


-
Ipomoea batatas (L.) Lam, commonly known as the sweet potato, is cultivated across more than 120 countries and territories globally, with China being the largest producer, accounting for 56% of the global production (FAO, 2021.
www.fao.org/faostat/zh/#data/QCL/visualize ). Sweet potato varieties are generally classified into processing types and fresh-eating types. Consumption of fresh-eating sweet potatoes has increased, accounting for approximately 30% of China's total sweet potato consumption. 'Pushu32' and 'Yanshu25' are major fresh-eating varieties in China. Sweet potatoes are favored by consumers for their unique aroma and sweetness. Volatile organic compounds play a pivotal role in the fragrance of sweet potatoes[1,2]. 'Pushu32', also known as 'Xiguahong', is characterized by its orange-colored flesh, high carotene content, high starch content, and good storability[3−5]. 'Yanshu25', is notable for its high quality, high yield, strong disease resistance, and storability. To fulfill the requirement for a consistent supply, sweet potatoes are generally kept in storage for a period of three to four months post-harvest before being marketed. However, after harvest, sweet potatoes have high water content, and are fragile, prone to damage, loss of nutritional value, and susceptibility to diseases, sprouting, and desiccation during storage, which results in significant storage losses[6]. Therefore, storage remains a major bottleneck for the sweet potato industry[7−9]. The effectiveness of storage and preservation of fresh-eating sweet potatoes depends not only on environmental factors such as temperature levels, humidity rates, and atmospheric gas compositions play crucial roles but also on the storage characteristics of different varieties[10−12]. Thus, selecting varieties with excellent quality and good storage tolerance is crucial for the successful storage of fresh-eating sweet potatoes.Sweet potato varieties vary in color, storage characteristics, and nutritional composition, including bioactive compounds, vitamins, minerals, dietary fibers, and starch content[13]. Starch is the primary component in the roots. Studies have indicated that sucrose synthase (SUS) and UDP-glucose pyrophosphorylase (UGPase) are essential for starch accumulation in the roots[14]. Carotenoids are crucial compounds that influence the quality and color of the roots[15,16]. Research has shown that genes such as Phytoene synthase (PSY), β-carotene 3-hydroxylase (CHYB), Zeaxanthin epoxidase (ZEP), 9-cis-epoxycarotenoid dioxygenase 3 (NCED3), Abscisic acid dehydrogenase (ABA2), and Abscisic acid 8' -hydroxylase (CYP707A) are closely linked to the carotenoid and abscisic acid (ABA) content in the roots[17]. Significant differences in antioxidant capacities exist among varieties, with those containing higher levels of antioxidant compounds demonstrating greater storability[18]. Also, ABA enhances stress resistance, thereby increasing storage length[19,20]. Transcriptomic analyses of various varieties under cold storage conditions have identified several key genes, including WRKY33, APX1, PYLs, CAM5, ribosomal proteins, DnaJ proteins, and HSPs, as potential candidates for improving cold tolerance in sweet potatoes[21].
Hence, the primary aim of this research endeavor was to investigate the regulatory mechanisms of sweet potato metabolism of stored roots for two varieties using transcriptomics and metabolomics approaches. The results offer significant insights into the selection and genetic enhancement of high-nutritional-quality sweet potato varieties.
-
'Xiguahong' (XGH) and 'Yanshu25' (YS) sweet potatoes, planted in a vegetable garden in Daxing District, Beijing, China, were harvested on October 20th in 2022 and stored in underground sweet potato pits that are six meters deep and four meters wide for four months. The temperature was maintained at 13 ± 2 °C, and the relative humidity ranged from 85% to 90%. Samples were retrieved from the sweet potato cellar after four months and conveyed to the lab within a two-hour timeframe at room temperature, where they were immediately sampled and frozen. To analyze quality differences before and after four months of storage, 12 roots of uniform size were randomly selected from each group: XGH-0 days, XGH-four months, YS-0 days, and YS-four months. The roots were thoroughly washed, air-dried, cut into small pieces, and then individually placed in plastic seal bags. Immediately after collection, the samples were frozen in liquid nitrogen and subsequently stored at −80 °C for future utilization. Using an IKA A11 analytical grinder (Aika, Germany), the samples were processed into a fine powder. This powdered material was then frozen once again in an ultra-low temperature freezer maintained at −80 °C, preparing them for potential applications in electronic nose assessments and GC-IMS (Gas Chromatography coupled with Ion Mobility Spectrometry) analyses.
E-nose analytical protocols
-
The aroma profile of the sweet potatoes was assessed utilizing a PEN-3 electronic nose (manufactured by Airsense Analytical Instruments Co., Ltd., Germany), equipped with 10 sensors. A quantity of 5 g of powdered tissue was accurately measured and transferred into a 20 mL headspace vial. Before measurement, the sample was allowed to equilibrate at a temperature of 25 ± 1 °C for 30 min. Subsequently, the electronic nose probe was inserted to capture the aroma data. The comprehensive sensor readings obtained from the electronic nose are presented in Supplementary Table S1. The experimental conditions for the electronic nose adhered to previously validated laboratory protocols[22].
GC-IMS analytical conditions
-
To analyze the variations in volatile aroma compounds of sweet potatoes, a GC-IMS system (FlavourSpec® Gas Phase Ion Mobility Spectrometer, manufactured by G.A.S. Company, Germany) equipped with an automated sampling apparatus (provided by CTC Analytics AG, Zwingen, Switzerland) was employed. A quantity of 2 g of sample was precisely weighed and placed into a 20 mL headspace vial, and each sample was measured in triplicate for consistency. The GC-IMS experimental conditions were based on previously established laboratory protocols[22].
Metabolomic analysis
Metabolite extraction
-
The frozen flesh tissues underwent lyophilization using a vacuum freeze-dryer (Model Scientz-100F). The resultant dried sample was subsequently pulverized with a mixer mill (MM 400, manufactured by Retsch) at a frequency of 30 Hz for 1.5 min. A quantity of 50 mg of the powdered sample was dissolved in 1.2 mL of 70% methanol. This mixture was vortexed for 30 s every 30 min, with this process being repeated six times. Following this, the mixture was centrifuged at 10,000 × g for 3 min, filtered, and subjected to UPLC-MS/MS analysis[23].
Data preprocessing and annotation
-
The sample extracts were subjected to a comprehensive analysis employing an Ultra-Performance Liquid Chromatography coupled with Electrospray Ionization and Tandem Mass Spectrometry (UPLC-ESI-MS/MS) system. The acquired mass spectrometry data were meticulously handled using the Analyst software version 1.6.3. With reference to the local metabolic database (
www.kegg.jp/kegg/compound ), we conducted quantitative and qualitative metabolite analyses using mass spectrometry. The data analysis encompassed Principal Component Analysis (PCA), clustering analysis, and the application of Spearman's rank correlation coefficient (R). After analysis, we compared fold changes among groups. Differential metabolites between two groups were identified using VIP ≥ 1 and |log2FC| ≥ 1.0 criteria.Transcriptome analysis
Transcriptome sequencing
-
The transcriptome sequencing, including library construction and RNA-seq, was performed by Maiteweier Biology Science and Technology Co., Ltd., (Wuhan, China). A sequencing library comprising 12 samples—specifically, four tissue groups with three biological replicates each—was established. Detailed procedures for transcriptome sequencing have been outlined in our prior research[24,25].
Statistical analysis of transcriptome data
-
Weigh 3 g of sweet potato tissue per sample and extract total RNA from it according to the kit instructions (15596026, Invitrogen Life Technologies, Carlsbad, CA, USA). Follow-up analysis was also performed as previously described[24,25]. After differential gene analysis, the Benjamini-Hochberg method corrected for multiple testing, yielding FDR. Differential genes were selected with |log2Fold Change| ≥ 1 and FDR < 0.05.
Integrated analysis of transcriptome and metabolome data
-
For a comprehensive analysis, metabolites and gene expressions were log2 transformed. PCA assessed intragroup variability, ensuring data integrity. KEGG pathways were utilized for the alignment of differential genes and metabolites. Expression correlation analysis used the 'cor' function in R with PCC > 0.80 and p < 0.05. To construct a biological regulatory network and identify key variables, an Orthogonalized Partial Least Squares (O2PLS) model was developed.
-
The 10 sensors, individually, within the electronic nose is designed to detect a specific class of compounds. The analysis using PCA indicated that 93.85% of the total data variance was attributed to the first two principal components (PC1 = 77.63%, PC2 = 16.22%). Significant differences in flavor profiles were observed between the varieties before and after storage. Also, variety had noticeable flavor differences after storage (Fig. 1a). Radar chromatograms generated from the response values of the 10 sensors in the PEN 3 electronic nose indicated that each sensor responded uniquely to the flavors of each variety (Fig. 1b). It is worth noting that sensors W1W, W1S, and W5S exhibited higher response values compared to the other sensors in the study. The W2S sensor value is lower than those of these three sensors but higher than the other six sensors. The sensors, namely W1W, W1S, W5S, and W2S, exhibited specific sensitivity towards sulfur, methane, nitrogen, and alcoholic compounds, respectively. The remaining six sensing devices showed smaller, non-differentiated responses, suggesting that all samples exhibited similar overall aromas for aromatic hydrocarbons, hydrogen, aromatic-aliphatic compounds, sulfur-chlorides, and methane-aliphatic compounds.
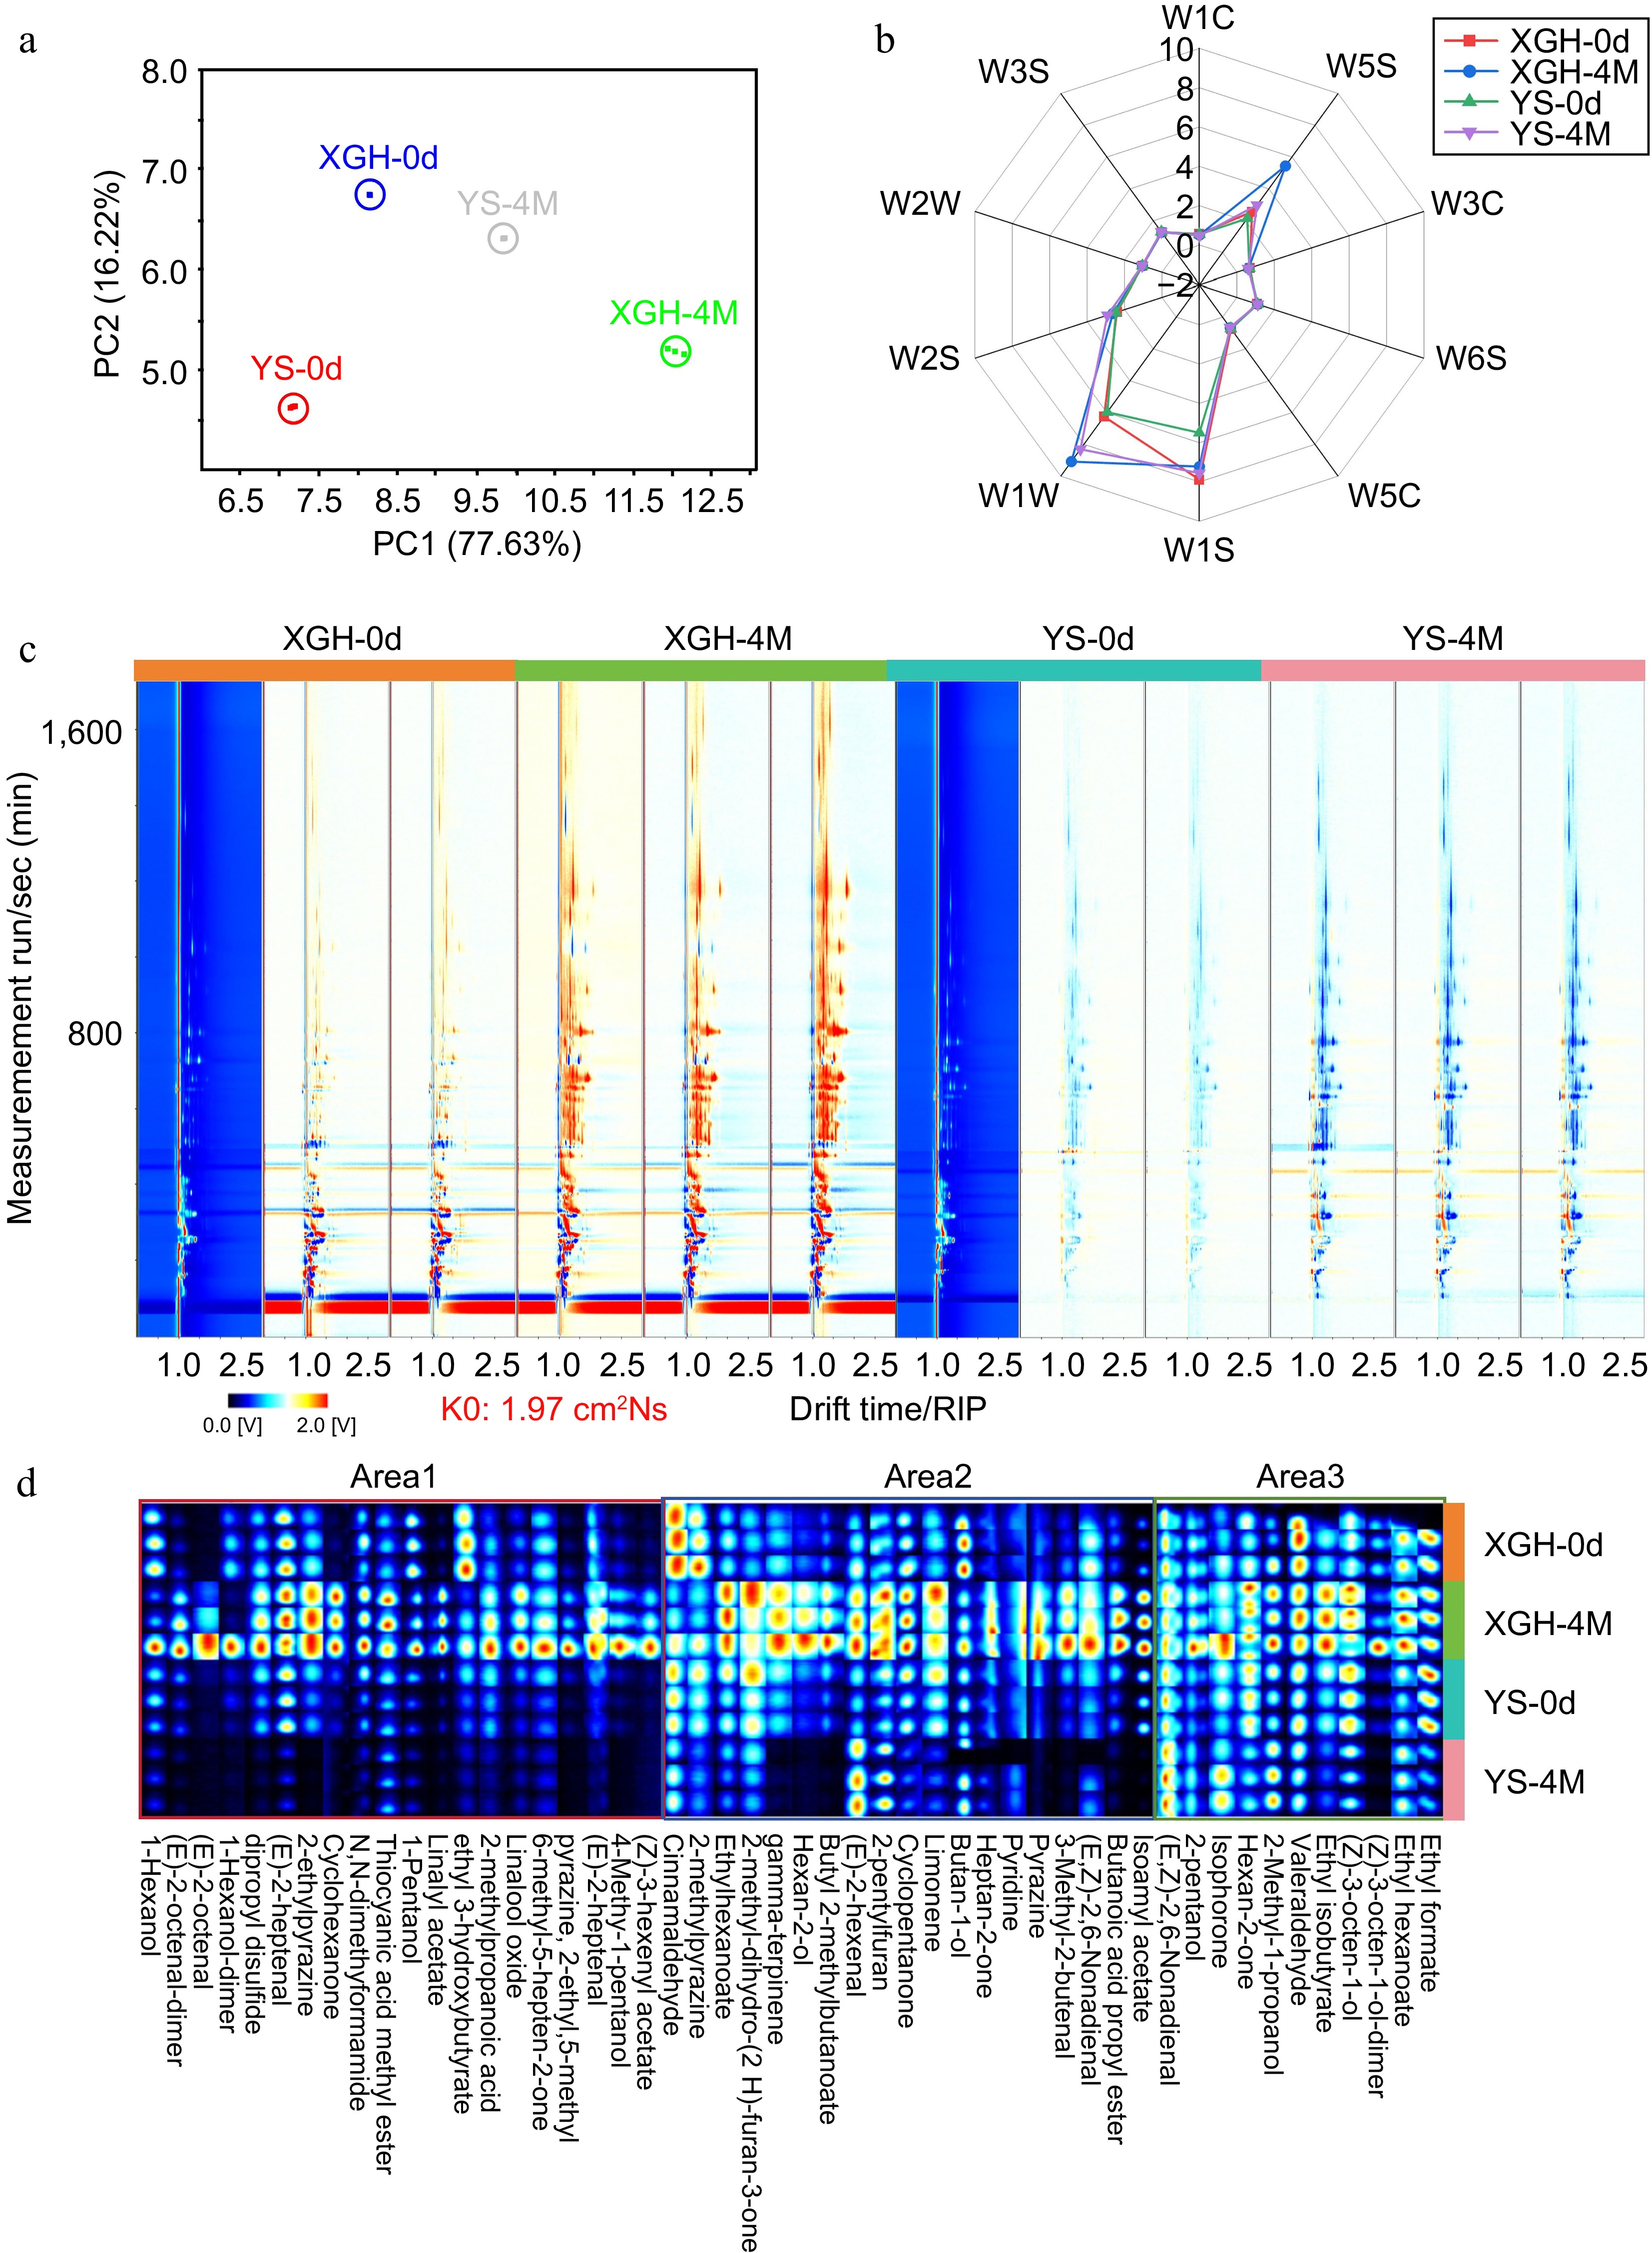
Figure 1.
E-nose analysis of sweet potato and GC-IMS two-dimensional spectral analysis of volatile flavor compounds in sweet potato. (a) PCA. (b) Radar chromatogram. (c) GC-IMS two-dimensional spectrum of sweet potato in XGH and YS. (d) Volatile flavor fingerprint. The red vertical line at the horizontal coordinate of 1.0 is the reactive ion peak (RIP), and each point on both sides of the peak represents volatile organic matter. The color represents the substance concentration, white represents a low concentration, red represents a high concentration, and the deeper the color is, the greater the concentration.
After storage, the response values for 'XGH' to sensors W1W and W5S were the highest among all samples, showing significant differences compared to 'YS', while the response values of the other eight sensors showed little variation between the varieties. YS, in contrast, showed more pronounced changes in response to sensors W1W and W1S. For XGH the sulfur-containing and ethanol compounds increased, while the methane content slightly decreased.
VOCs analysis based on GC-IMS
-
During storage, the flavor compounds of the varieties increased, but the number and content of these compounds in XGH were higher than those in YS before and after storage (Fig. 1c) indicating that the flavor of XGH was more intense than that of YS. To further differentiate the flavor characteristics of XGH and YS, volatile compound fingerprints were constructed for the two groups of samples (Fig. 1d). Based on the changes in volatile compounds during storage, the aroma fingerprint was divided into three regions. In area 1, compounds such as 1-hexanol, (E)-2-octenal, (E)-2-heptenal, 2-ethylpyrazine, linalyl acetate, cyclohexanone, N,N-dimethylformamide, thiocyanic acid methyl ester, 2-methylpropanoic acid, (Z)-3-hexenyl acetate, and pyrazine, 2-ethyl, 5-methyl increased after 4 months. Among these, (E)-2-octenal, (E)-2-heptenal, 2-ethylpyrazine, linalyl acetate, 2-methylpropanoic acid, (Z)-3-hexenyl acetate, and pyrazine, 2-ethyl, 5-methyl were characteristic aroma compounds of XGH. For YS, some flavor compounds were detected in area 1 on day 0, but their content was relatively low, and most of them degraded at month 4. In area 2, the contents of compounds such as γ-terpinene, hexan-2-ol, butyl 2-methylbutanoate, limonene, pyrazine, 3-methyl-2-butenal, butanoic acid propyl ester, and isoamyl acetate were higher in XGH than in YS after storage. These compounds have fruity aromas that enhance the overall flavor quality of XGH, making its flavor more appealing. In area 3, the contents of compounds such as 2-pentanol, valeraldehyde, ethyl isobutyrate, (Z)-3-octen-1-ol, ethyl hexanoate, and ethyl formate, which have appealing aromas, increased in XGH during storage. In contrast, in YS, the content of these compounds showed either insignificant increases or a decreasing trend by the end of the storage period.
Changes in metabolites during storage periods of sweet potatoes
-
A total of 444 unique metabolites were discerned when comparing XGH-0d to XGH-4M. Specifically, 353 metabolites showed an increase, whereas 91 demonstrated a decrease (Supplementary Table S2). The main classifications of these differential metabolites encompassed phenolic acids (24.0%), amino acids and their derivatives (15.0%), lignans and coumarins (8.1%), flavonoids (7.6%), terpenoids (7.4%), and lipids (6.7%) (Fig. 2a). By KEGG enrichment analysis, these metabolites were mainly enriched in pathways such as carotenoid biosynthesis, phenylpropanoid biosynthesis, starch and sucrose metabolism (Fig. 2e). A clustering heatmap constructed for the 20 most significantly altered metabolites (Fig. 2b), revealed that the most prominent differences were for flavonoids and phenolic acids. Specifically, Grevilloside F had the highest upregulation with a log2FC of 17.93, while 7-hydroxy-4-methoxyphenanthrene-2-O-glucoside showed the most significant downregulation with a log2FC of −15.65.
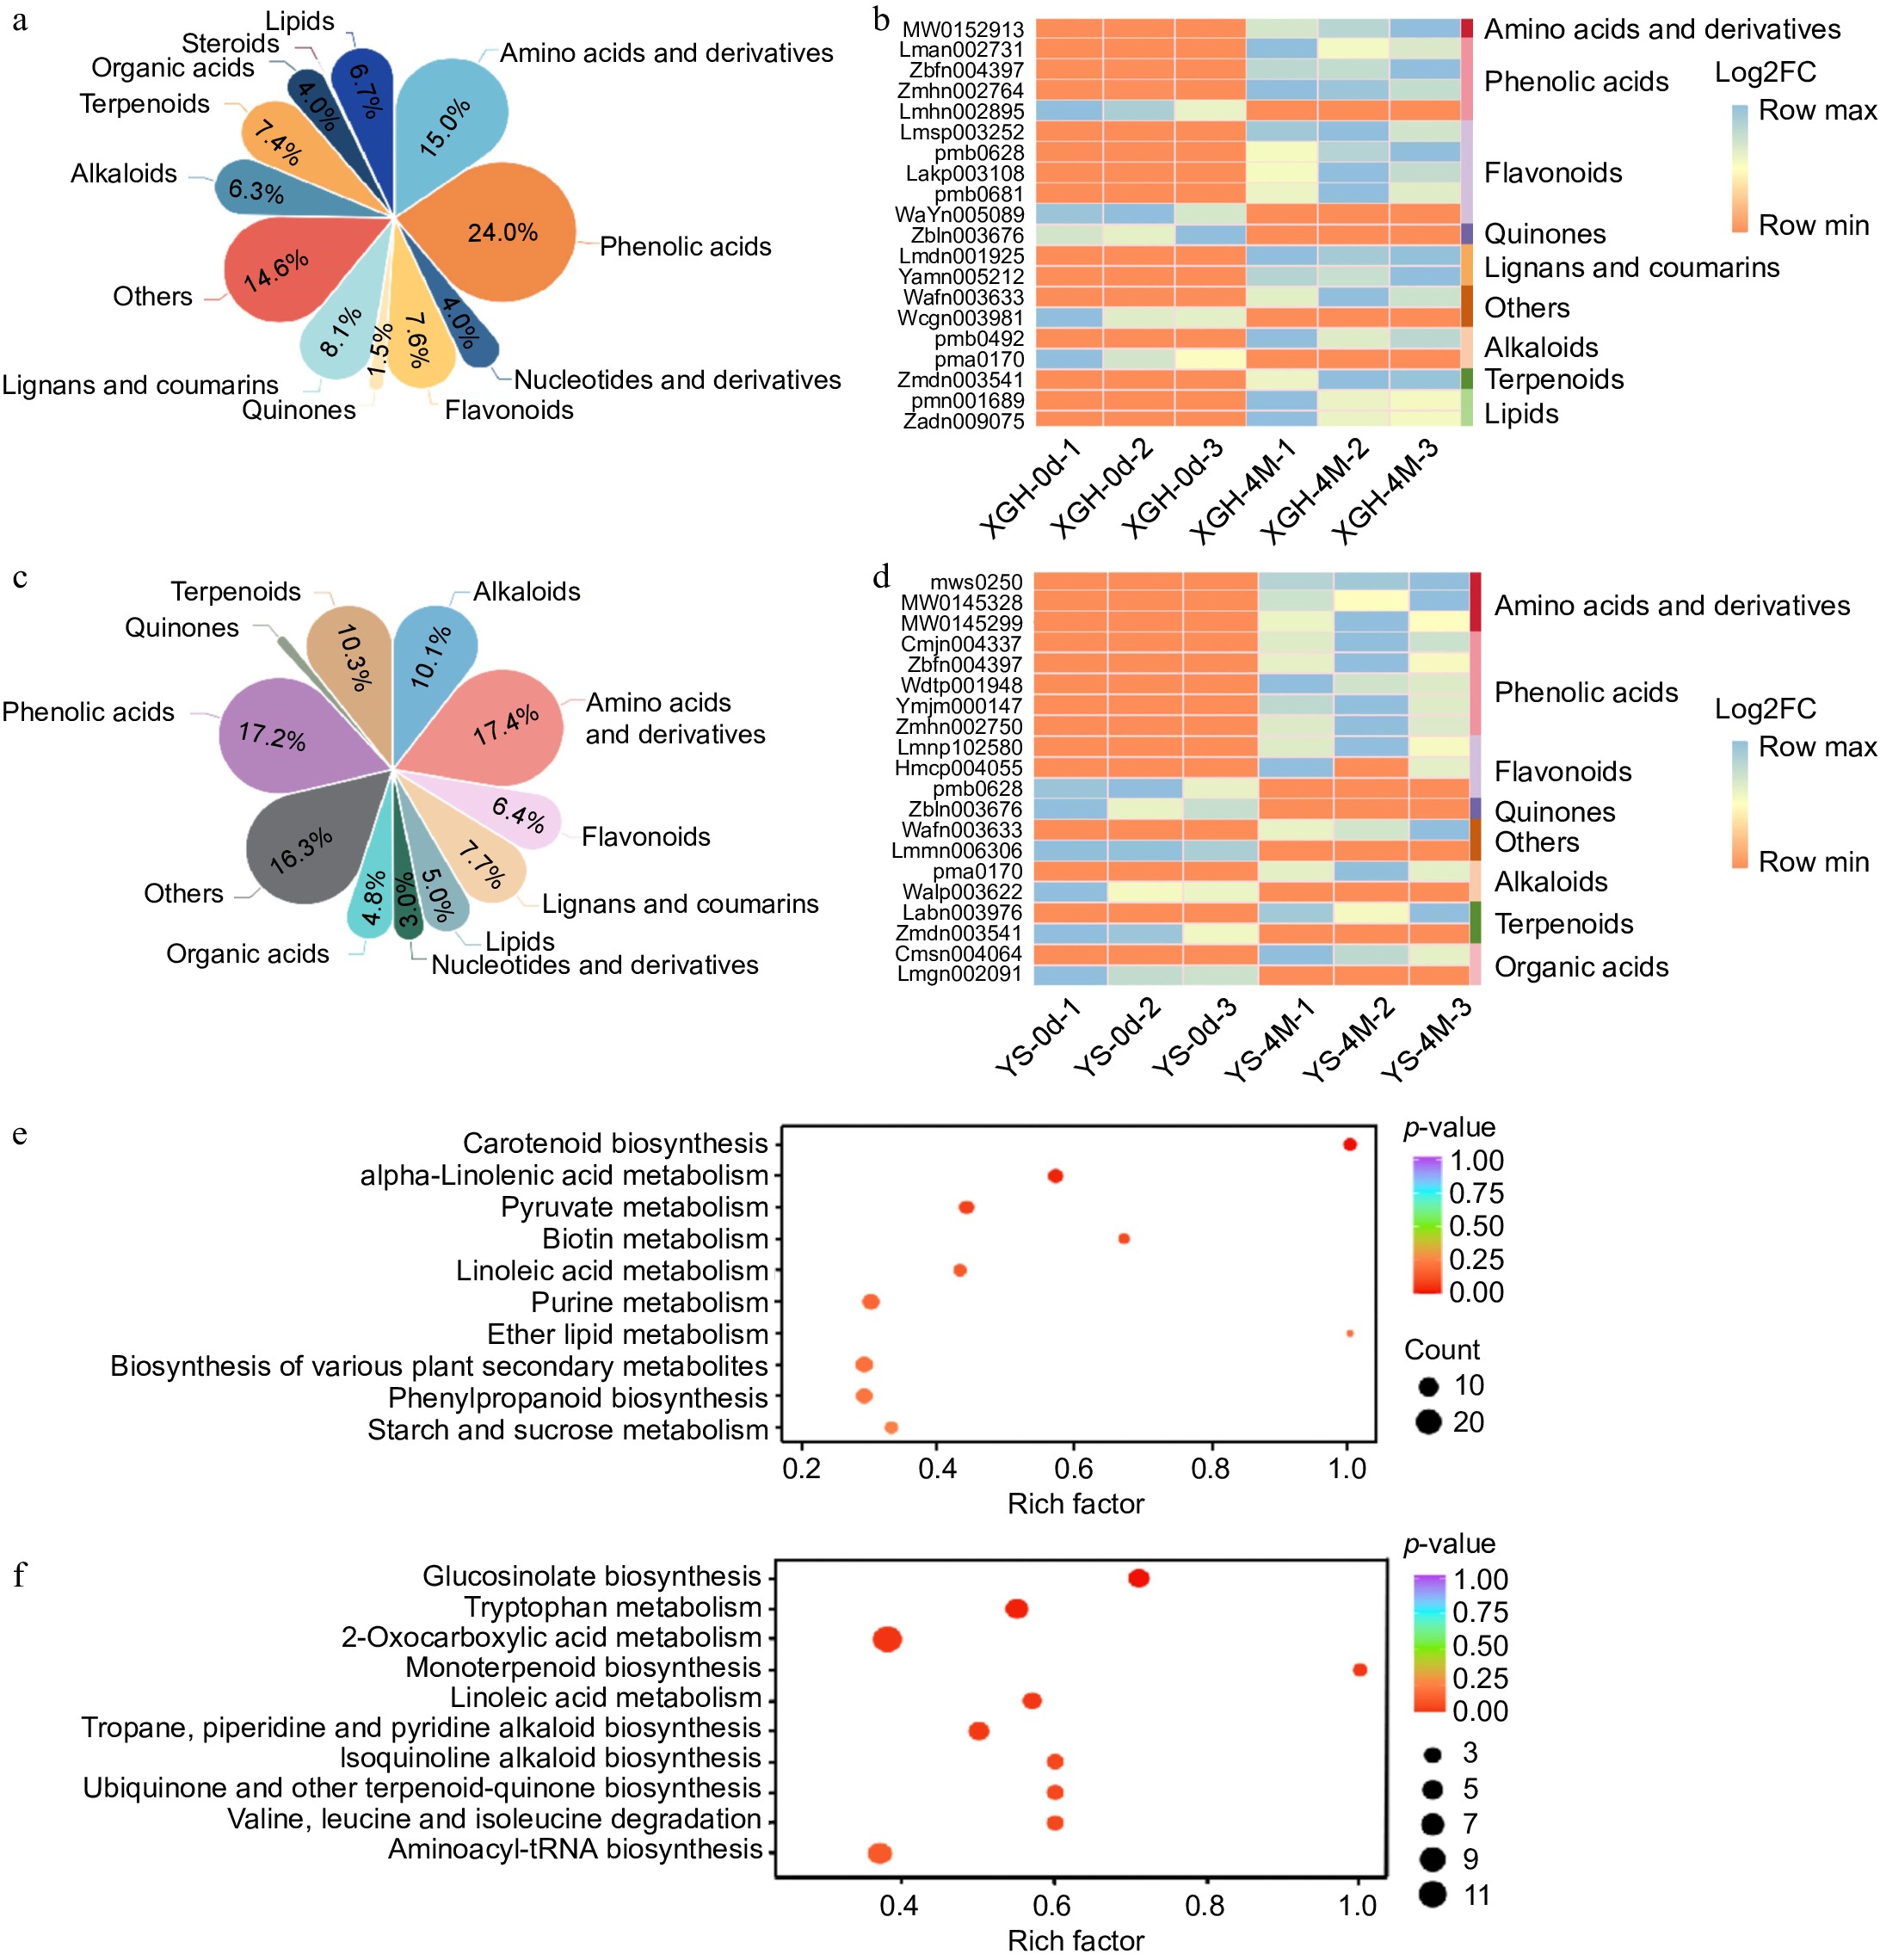
Figure 2.
Analysis of metabolome data. (a) Classification and content of differential metabolites in XGH-0d vs XGH-4M. (b) Heat maps displaying 20 most significantly altered metabolites in XGH-0d vs XGH-4M. (c) Classification and content of differential metabolites in YS-0d vs YS-4M. (d) Heat maps displaying 20 most significantly altered metabolites in YS-0d vs YS-4M. (e) Enrichment of the top 10 metabolic pathways based on KEGG analysis in the XGH-0d vs XGH-4M. (f) Enrichment of the top 10 metabolic pathways based on KEGG analysis in the YS-0d vs YS-4M.
Comparison between YS-0d and YS-4M revealed 452 different metabolites. The main groups of these metabolite variations comprised amino acids and their derivatives (17.4%), phenolic acids (17.2%), terpenoids (10.3%), lignans and coumarins (7.7%), flavonoids (6.4%), and lipids (5.0%) (Fig. 2c). Notably, 349 metabolites increased, while 103 showed a decrease (Supplementary Table S2). Through KEGG enrichment analysis, these metabolites were predominantly enriched in pathways such as 2-oxocarboxylic acid metabolism, glucosinolate biosynthesis, and tryptophan metabolism (Fig. 2f). A clustering heatmap of the 20 most significantly altered metabolites (Fig. 2d), found amino acid derivatives, flavonoids, and phenolic acids. Among them, vomifoliol 9-[xylosyl-(1→6)-glucoside] displayed the highest upregulation with a log2FC of 18.36, while 7-hydroxy-4-methoxyphenanthrene-2-O-glucoside showed the most significant downregulation with a log2FC of −15.68. After storage, the contents of antioxidant-related metabolites in XGH were higher than in YS, including phenolic acids, terpenoids, lignans and coumarins, and flavonoids (Supplementary Table S3). Furthermore, pathways associated with phenylpropanoid biosynthesis, carotenoid biosynthesis, and alpha-linolenic acid metabolism, which are enriched in XGH, suggest that XGH may have greater storability as compared to YS.
In the comparison between YS-0d and XGH-0d, a total of 602 distinct metabolites were detected. Among these, 401 metabolites were upregulated, while 201 were downregulated (Supplementary Table S3). The key classifications of the metabolites that exhibited differences were amino acids and derivatives (19.6%), phenolic acids (19.6%), alkaloids (9.1%), terpenoids (6.9%), organic acids (6.8%), lipids (6.4%), flavonoids (4.8%), and lignans and coumarins (4.8%) (Fig. 3a). KEGG pathway analysis reveals the enrichment of metabolites involved in 2-oxocarboxylic acid metabolism, glucosinolate biosynthesis, and aminoacyl-tRNA biosynthesis (Fig. 3d). A clustering heatmap constructed using 20 metabolites with significant differences indicated primarily phenolic acids and alkaloids (Fig. 3e). Among them, L-tyrosine exhibited the highest upregulation with a log2FC of 18.61, while (6S,7E,9R)-6,9-dihydroxy-4,7-megastigmadin-3-one-9-O-xylosyl(1-6)glucoside showed the most significant downregulation with a log2FC of −18.72. In the comparison between YS-4M and XGH-4M, 548 different metabolites were identified. Among them, 417 metabolites were upregulated, while 131 were downregulated (Supplementary Table S2). The main groups of metabolites demonstrating variations were phenolic acids (25.3%), amino acids and their derivatives (14.0%), terpenoids (7.6%), lipids (7.2%), alkaloids (7.2%), organic acids (6.9%), flavonoids (6.5%), lignans, and coumarins (6.2%) (Fig. 3b). These metabolites were enriched in pathways such as tyrosine metabolism, alanine, aspartate, and glutamate metabolism, as well as cysteine and methionine metabolism (Fig. 3f). A heatmap was constructed based on clustering analysis of 20 significantly differing metabolites (Fig. 3g). These metabolites were primarily classified into terpenoids, sugars, and phenolic acids. Among them, 2-methyl-3-oxoadipic acid showed the highest upregulation with a log2FC of 18.08, while (6S,7E,9R)-6,9-dihydroxy-4,7-megastigmadin-3-one-9-O-xylosyl(1-6)glucoside had the most significant downregulation with a log2FC of −19.80. After storage, most metabolites in both XGH and YS showed an upregulation trend, with only a few showing downregulation. The contents of metabolites with antioxidant properties, such as phenolic acids, terpenes, flavonoids, lignans, and coumarins, including quercetin-5,7,4'-tri-O-glucoside, luteolin-7-O-(6"-malonyl) glucoside, nicotinic acid, and gallic acid-4-O-glucoside—increased. Conversely, the content of lipids, alkaloids, amino acids, and their derivatives, such as Gln-Met, Cys-Trp-His, diethanolamine, and 3-pyridine-methanol-O-β-D-glucopyranosyl, decreased compared to no storage. However, hydroperoxylinoleic acid increased after four months, indicating lipid oxidation, which may lead to changes in the flavor of sweet potatoes, it is also somewhat related to its antioxidant defense response within its body (Supplementary Fig. S1). Compared with YS, XGH had less oxidation and more pronounced flavor changes after storage. Comparative analysis of differential metabolites between XGH-0d and XGH-4M and YS-0d and YS-4M, identified 220 shared differential metabolites (Fig. 3c). Most of these metabolites showed increased abundance, and their accumulation trends were largely consistent across both comparison groups. In this study, 26 metabolites that underwent significant changes during storage were selected for further analysis (Supplementary Table S4). These metabolites included phenolic acids, lignans and coumarins, flavonoids, sugars, and terpenes. Among them, phenolic acids accounted for the highest proportion (34.6%). Although Grevilloside F increased in both varieties, its abundance was higher in XGH than in YS. Conversely, increases in benzyl-(2"-O-xylosyl)glucoside, 2-O-caffeoyl-5-O-(3-hydroxy-4-phenoxy)-6-acetylglucose, and 3,4,5-trihydroxy-5-[4-(prop-2-enoyloxymethyl)phenoxy]oxane-2-carboxylic acid were most pronounced in YS. Notably, 3-O-p-coumaroylquinic acid, 4-O-p-coumaroylquinic acid, 5-O-p-coumaroylquinic acid, and 1-O-p-coumaroyl-β-D-glucose showed increased accumulation in XGH but decreased in YS, with significant abundance differences between the two varieties.
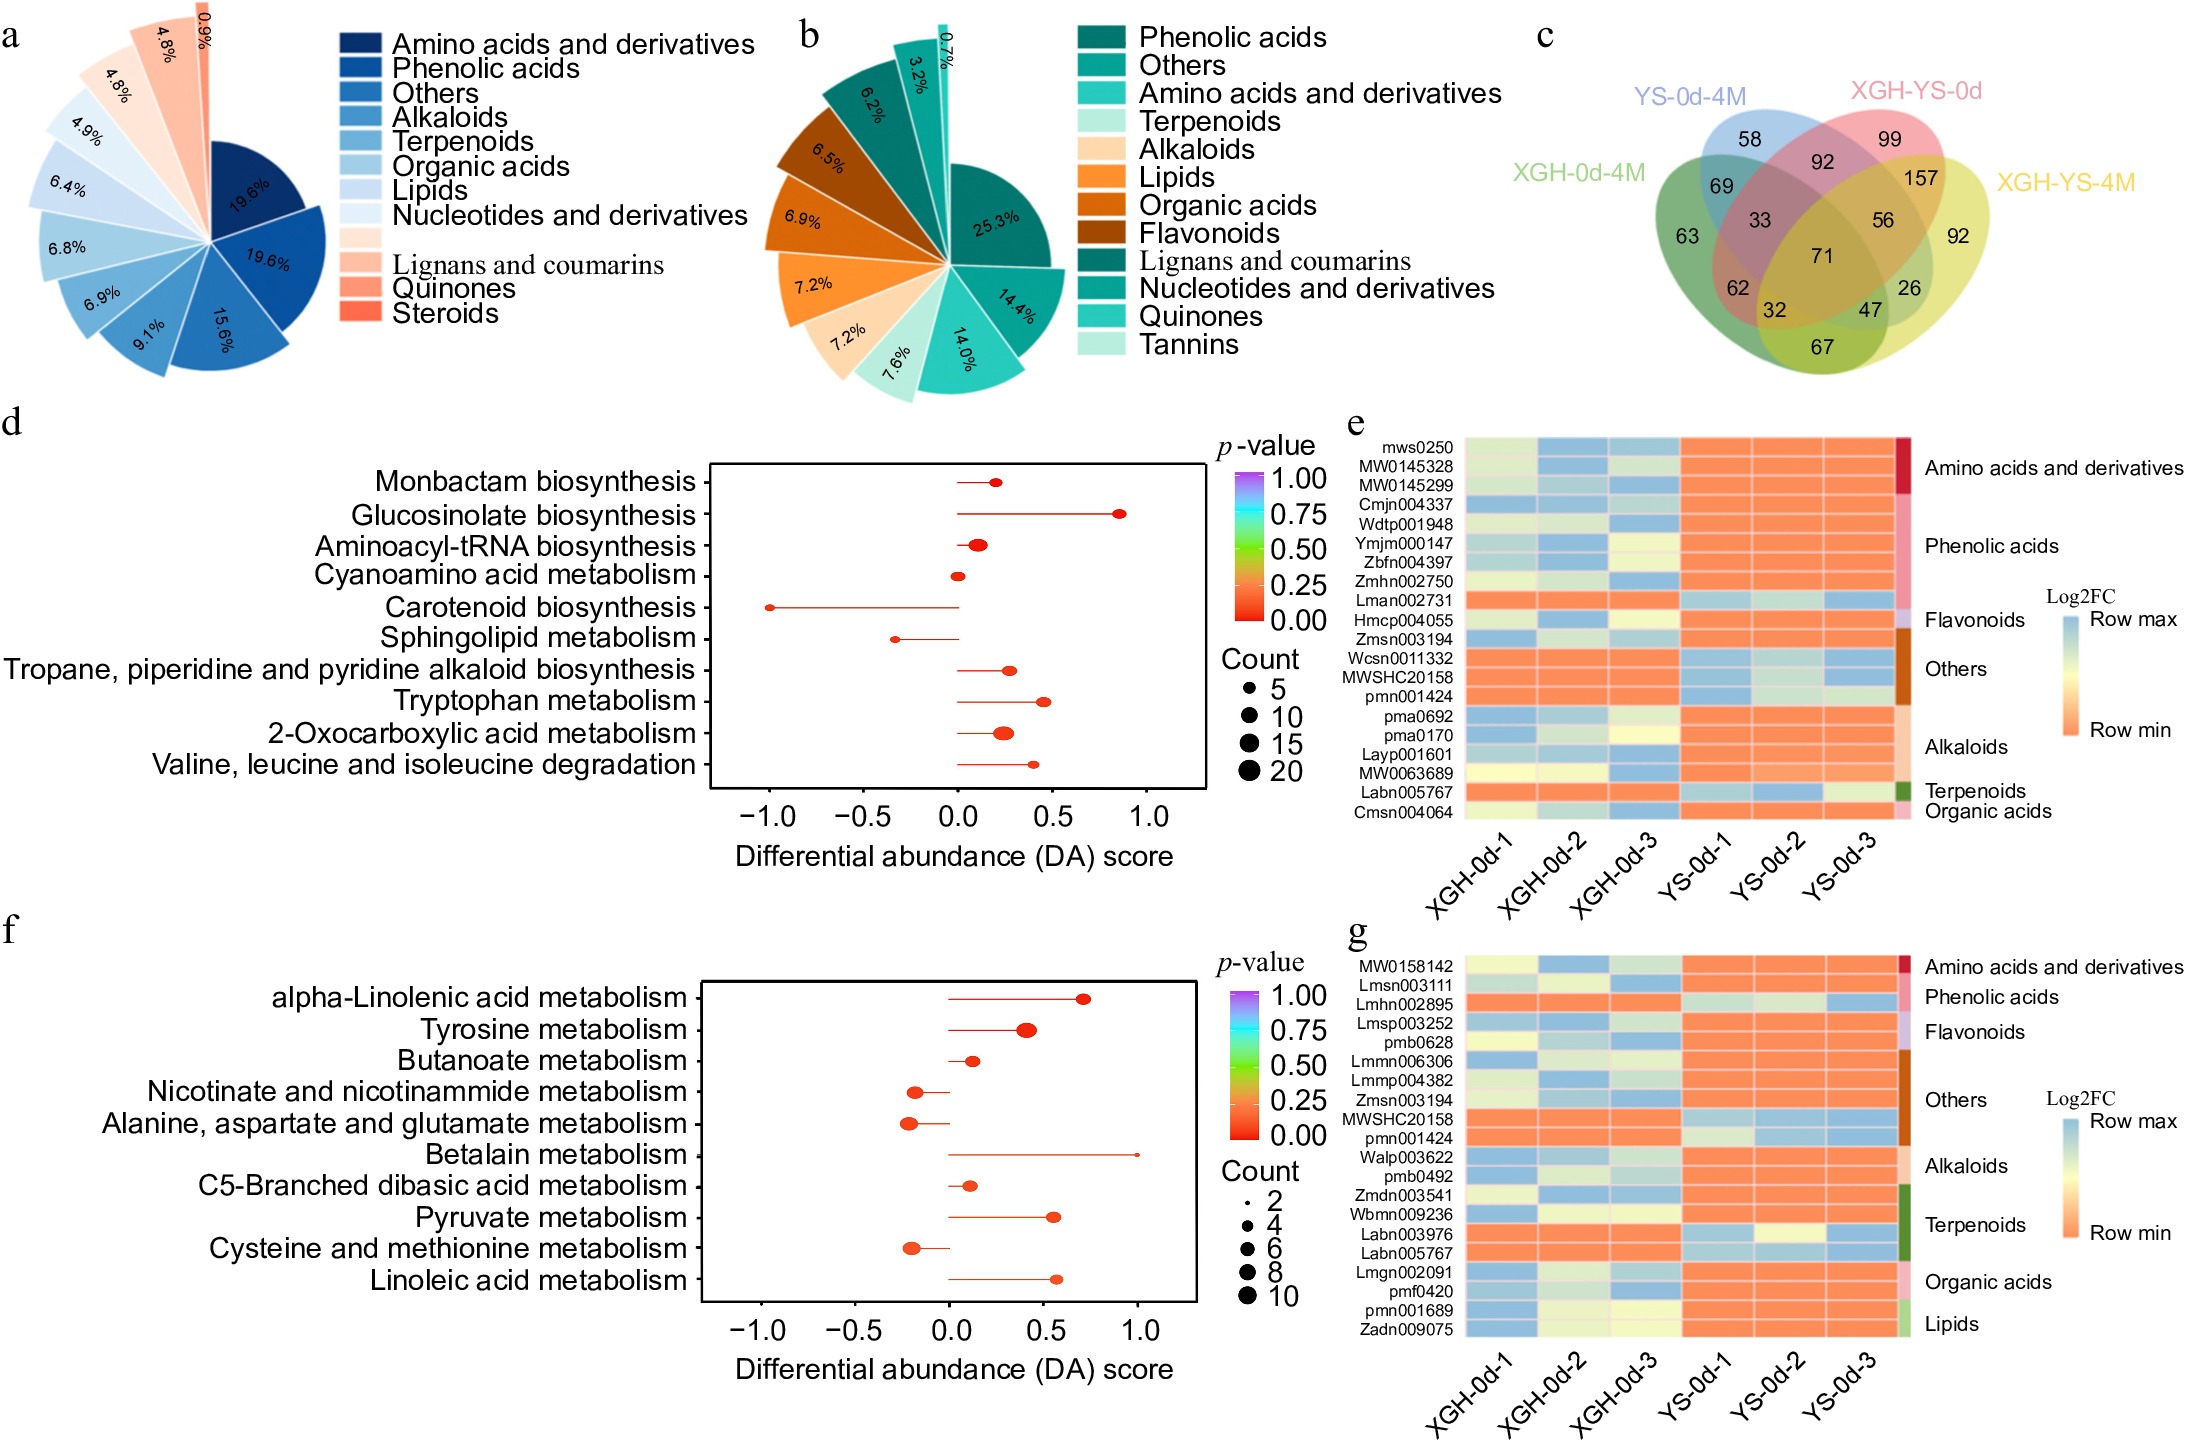
Figure 3.
Analysis of metabolome data. (a) Classification and content of differential metabolites in YS-0d vs XGH-0d. (b) Classification and content of differential metabolites in YS-4M vs XGH-4M. (c) Venn diagram illustrating the overlapping metabolites between XGH-0d vs XGH-4M, YS-0d vs YS-4M, YS-0d vs XGH-0d, and YS-4M vs XGH-4M comparisons. (d) Enrichment of the top 10 metabolic pathways based on KEGG analysis in the YS-0d vs XGH-0d. (e) Heat maps displaying 20 most significantly altered metabolites in YS-0d vs XGH-0d. (f) Enrichment of the top 10 metabolic pathways based on KEGG analysis in the YS-4M vs XGH-4M. (g) Heat maps displaying 20 most significantly altered metabolites in YS-4M vs XGH-4M.
Changes in gene expression during storage periods of sweet potatoes
-
Upon comparing XGH-0d with XGH-4M, we identified a total of 5,568 genes that exhibited differential expression. Specifically, 2,604 of these genes were found to be upregulated, while 2,964 were downregulated (Fig. 4f). The primary enrichment of these genes was observed among those that exhibited differential expression in those associated with secondary metabolism biosynthesis, carotenoid biosynthesis, and glutathione metabolism (Fig. 4g). In the comparison between YS-0d and YS-4M, a total of 5,468 differential genes were identified, with 2,438 genes upregulated and 3,030 downregulated (Fig. 4f). The pathways predominantly featured an enrichment of these genes, including secondary metabolite biosynthesis, carotenoid biosynthesis, and plant hormone signal transduction (Fig. 4h).
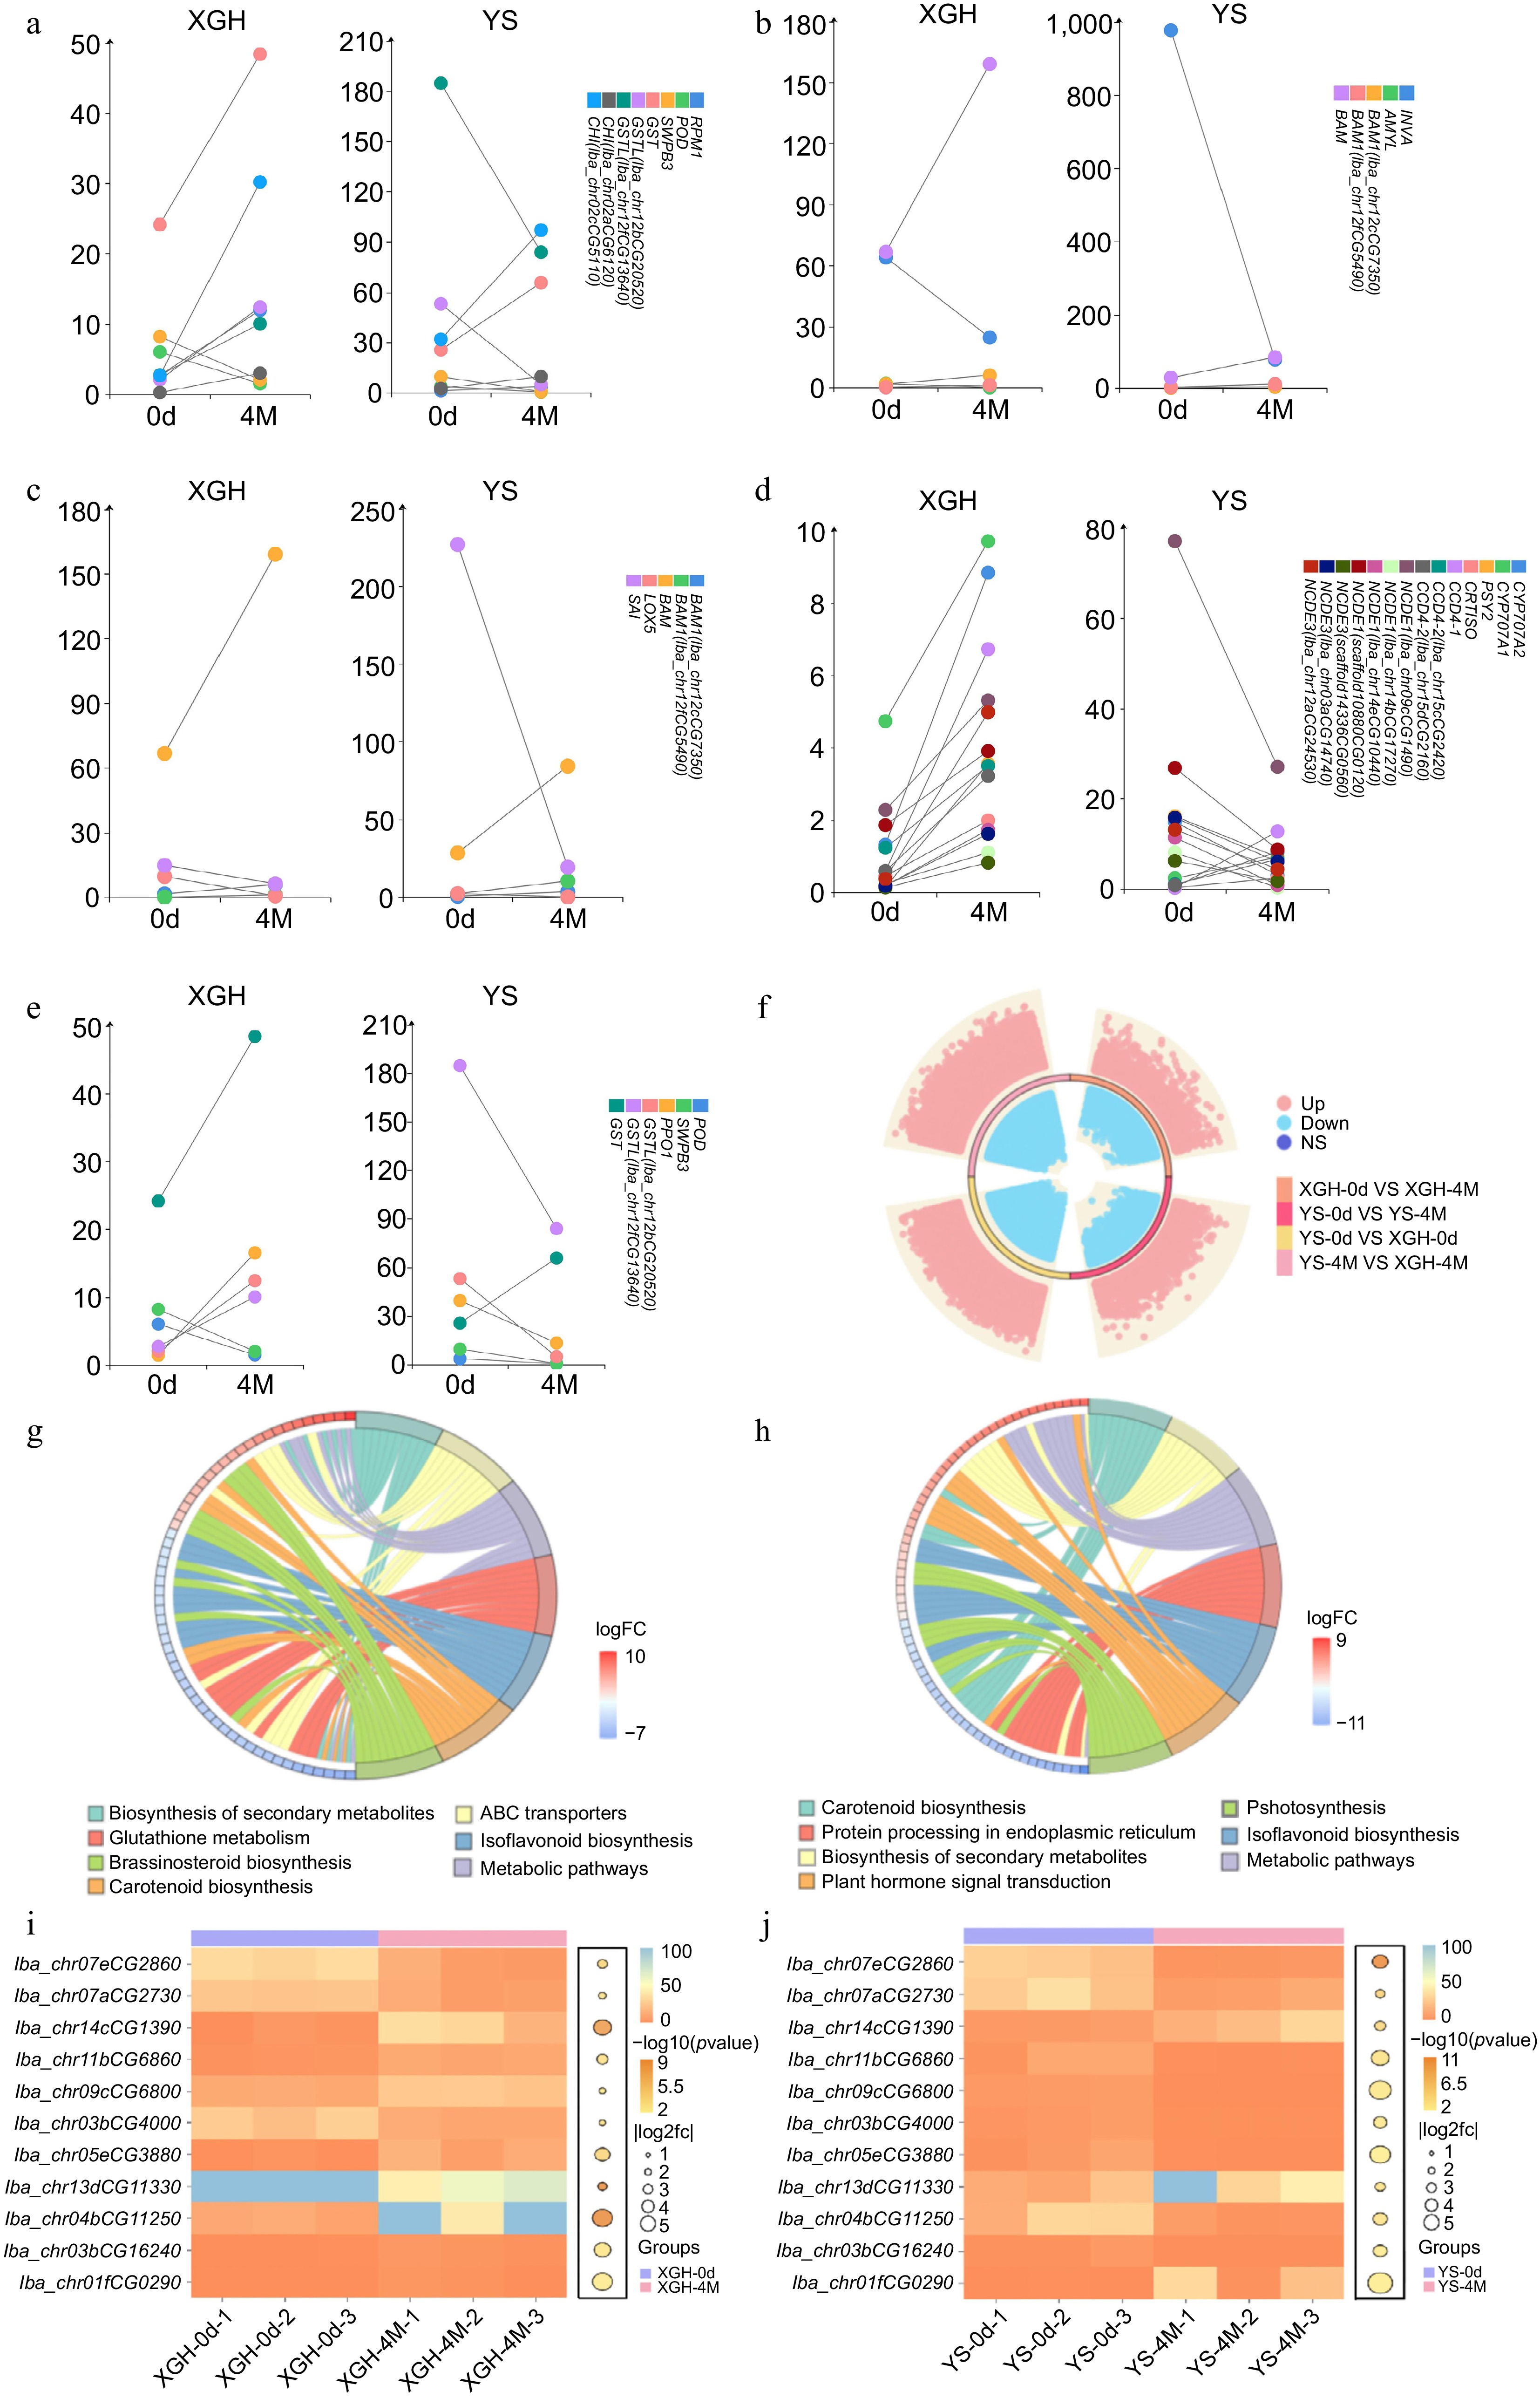
Figure 4.
Analysis of transcriptome data. (a)−(e) Dumbbell plot of common gene expression (fpkm) in XGH-0d vs XGH-4M and YS-0d vs YS-4M. (f) Diagram of a ring volcano between XGH-0d vs XGH-4M, YS-0d vs YS-4M, YS-0d vs XGH-0d, and YS-4M vs XGH-4M comparisons. (g) Enrichment of KEGG top seven pathways for DEGs in XGH-0d vs XGH-4M. (h) Enrichment of KEGG top seven pathways for DEGs in YS-0d vs YS-4M. (i) Texture shared gene expression bubble heat map in XGH-0d vs XGH-4M. (j) Texture shared gene expression bubble heat map in YS-0d vs YS-4M.
The fact that five of the top 10 most significantly enriched pathways are shared between the sweet potato varieties suggests that these pathways play crucial roles in growth, development, and environmental stress response. Despite differences between the varieties, they exhibit similar regulatory pathways in response to external environmental stimuli and internal physiological changes, indicating similarity in gene regulation and biological pathway responses between XGH and YS.
In the analysis of YS-0d vs XGH-0d, a total of 44,067 differentially expressed genes (DEGs) were identified. Among these, 21,993 genes were upregulated, and 22,074 were downregulated (Fig. 4f). These DEGs were primarily enriched in pathways such as amino acid biosynthesis, cofactor biosynthesis, carbon metabolism, and N-glycan biosynthesis (Supplementary Fig. S2). In the analysis of YS-4M vs XGH-4M, a total of 41,929 DEGs were identified, with 20,629 genes upregulated and 21,300 downregulated (Fig. 4f). These genes were mainly enriched in pathways such as amino acid biosynthesis, cofactor biosynthesis, N-glycan biosynthesis, and glycine, serine, and threonine metabolism (Supplementary Fig. S3). Eight of the top 10 most enriched pathways were shared between the two sweet potato varieties, indicating their importance in maintaining the basic biological functions of sweet potatoes during storage. Despite being different varieties, XGH and YS exhibit sufficient genetic similarity, manifesting similar regulatory pathways during storage. RNA-Seq analysis revealed 945 genes shared between the XGH-0d vs. XGH-4M and YS-0d vs. YS-4M comparison groups. Notably, among these shared genes, those related to texture, color, flavor, antioxidant activity, and disease resistance exhibited significant expression patterns.
Levels of gene expression related to texture
-
A comparative analysis between XGH-0d vs XGH-4M and YS-0d vs YS-4M identified a total of 11 genes related to texture attributes, with their expression levels depicted in bubble combination heatmap. The genes shared between the two varieties include: β-galactosidase-like (BGAL), phenylalanine ammonia-lyase (PAL), xyloglucan endotransglucosylase/hydrolase 2-like (XTH), caffeoyl-CoA O-methyltransferase-like (CCoAOMT), shikimate O-hydroxycinnamoyltransferase (HCT), cinnamoyl-CoA reductase 2-like (CCR), pectin acetylesterase 7-like (PAE), and expansin-A10-like (EXPA10) (Fig. 4i−j). Additionally, some non-shared genes exhibit distinct expression patterns. For example, genes associated with cell wall loosening and pectin degradation, such as expansin family (EXP) and pectin acetylesterase family (PAE), showed lower expression levels in XGH compared to YS. In comparison, CCoAOMT, a pivotal gene involved in the lignin biosynthesis pathway, its expression level is downregulated in YS, whereas it is upregulated in XGH. In contrast, genes related to lignin biosynthesis, including 4-coumarate–CoA ligase 2 (4CL2) and cinnamate 4-hydroxylase (C4H), were more highly expressed in XGH than in YS (Supplementary Table S5).
Levels of gene expression related to flavor
-
Upon comparative analysis between XGH-0d and XGH-4M, as well as YS-0d and YS-4M, six differentially expressed genes (DEGs) pertinent to flavor were identified. These genes play pivotal roles in metabolic pathways such as linoleic acid metabolism, galactose metabolism, and starch and sucrose metabolism. They include linoleate 9S-lipoxygenase 5 (LOX 5), lipoxygenase 6 (LOX 6), soluble acid invertase (SAI), malate synthase (MLS), and BAMs. Apart from LOX 6 and MLS, the other genes share the same gene numbers in both varieties and are considered as common genes (Fig. 4c). Notably, both LOX 5 and SAI were downregulated after storage period of both varieties; LOX 5 with a log2FC of −3.83 in XGH and −5.80 in YS, and SAI with a log2FC of −1.17 in XGH and −3.56 in YS, indicating a lesser degree of downregulation in XGH. Conversely, LOX 6, BAM 1, and BAM were upregulated in both varieties after storage. LOX 6 had a log2FC value of 4.43 in XGH, whereas no presence of LOX 6 was observed in YS; BAM 1 had a log2FC of 3.57 in XGH and 2.30 in YS; and BAM had a log2FC of 1.33 in XGH and 1.58 in YS. Furthermore, MLS expression was upregulated in XGH after storage, with a log2FC of 1.30, whereas it was downregulated in YS, with a log2FC of −1.53. These findings suggest that there could be a higher number of upregulated genes in XGH. Hence, after storage, XGH has the potential to maintain more robust flavor characteristics, a notion further corroborated by transcription results.
Levels of gene expression related to glucose metabolism
-
Through the comparison of XGH-0d vs XGH-4M and YS-0d vs YS-4M, a total of seven genes related to sugar metabolism were identified. These genes are primarily associated with starch and sucrose metabolism, galactose metabolism, and glycolysis/gluconeogenesis pathways. β-amylase (BAM), β-amylase 1 (BAM1), acid β-fructofuranosidase-like (INVA), and α-amylase-like (AMYL) are common genes shared by the varieties (Fig. 4b). BAM and BAM1 were upregulated in both varieties; however, BAM1 was most highly expressed in XGH, whereas BAM expression in YS was only slightly higher. Conversely, INVA was downregulated in both varieties, with a more downregulation in YS, the log2FC value being −3.78. AMYL was downregulated in XGH, with a log2FC value of −4.29, whereas it was upregulated in YS, with a log2FC of 1.73. The non-shared gene, sucrose synthase 2 (SUS2), was upregulated in XGH and downregulated in YS. The expression of AMYL was downregulated in XGH and upregulated in YS. Galactinol synthase 2-like (GOLS2) is downregulated in both varieties. ATP-dependent 6-phosphofructokinase 3-like isoform X2 (PFK) and ATP-dependent 6-phosphofructokinase 6-like (PFK) were downregulated specifically in XGH and YS, respectively. Additionally, XGH uniquely possesses soluble starch synthase 1 (SS1), which is upregulated after storage (Supplementary Fig. S4, Supplementary Table S6).
Levels of gene expression related to color
-
Through the comparison of XGH-0d vs XGH-4M and YS-0d vs YS-4M, a total of 14 common genes were identified (Fig. 4d), belonging to the carotenoid biosynthetic pathway. These genes are carotenoid cleavage dioxygenase 4 (CCD 4), carotenoid cleavage dioxygenase 4-1 (CCD 4-1), carotenoid cleavage dioxygenase 4-2 (CCD4-2), nine-cis-epoxycarotenoid dioxygenase 3 (NCED3), 9-cis-epoxycarotenoid dioxygenase NCED1 (NCED1), Phytoene synthase 2 (PSY 2), Abscisic acid 8'-hydroxylase CYP707A2 (CYP707A2), and Abscisic acid 8'-hydroxylase CYP707A1-like (CYP707A1). After storage, the number of genes related to carotenoid degradation, including NCED, and ABAH, was upregulated more in XGH than in YS. Conversely, carotenoid biosynthetic genes were upregulated in XGH and downregulated in YS. Furthermore, a total of 21 color-related genes were detected in the XGH cultivar, among which 19 genes, excluding Zeaxanthin epoxidase (ZEP) and prolycopene isomerase (CRTISO), were upregulated. In contrast, 39 color-related genes were identified in YS, with 13 genes upregulated and 26 genes downregulated.
Levels of gene expression related to resistance
-
The expression of resistance genes in the sweet potato varieties after storage was compared (Fig. 4a, e). A total of seven genes associated with antioxidant or disease resistance were screened, which were Peroxidase P7-like (POD), anionic peroxidase swpb3 (SWPB3), polyphenol oxidase I (PPO1), glutathione S-transferase-like (GSTL), glutathione S-transferase (GST), endochitinase A2-like (CHI), and disease resistance protein RPM1-like (RPM1). In addition to GST, the expression levels of the remaining six genes in XGH were higher than those in YS. The log2FC value of POD in XGH is −1.92, while in YS it is −2.78. SWPB3 has a log2FC of −1.94 in XGH and −3.87 in YS. PPO1 has a log2FC of 3.58 in XGH and −1.57 in YS. GSTL log2FC is 2.65 and 1.93 in XGH and −3.46 and −1.15 in YS. The expression of endochitinase A2-like (CHI) and disease resistance protein RPM1-like (RPM1) in the cultivars was up-regulated after storage, and the expression of endochitinase A2-like (CHI) and disease resistance protein RPM1-like (RPM1) were greatly changed in XGH.
Integrated outcomes from transcriptomic and metabolomic analyses
-
The top 10 pathways enriched in both the XGH-0d vs XGH-4M and YS-0d vs YS-4M comparisons were related to flavor, texture, color, and other relevant attributes (Fig. 5a, b). To gain deeper insights into the interplay among diverse genes and metabolites within the α-linolenic acid metabolic pathway, we constructed chord diagrams for both comparison groups. Our analyses unveiled associations between particular metabolites and genes that are co-regulated by α-linolenic acid metabolism. In the XGH-0d vs XGH-4M group, four metabolites—α-linolenic acid, 2R-hydroxy-9Z,12Z,15Z-octadecatrienoic acid, 9-hydroxy-12-oxo-15(Z)-octadecenoic acid, and 9-hydroxy-12-oxo-10(E),15(Z)-octadecadienoic acid—were found to co-regulate α-linolenic acid metabolism along with 28 genes. Notably, these metabolites displayed a positive correlation with most of these genes. In contrast, the YS-0d vs YS-4M group exhibited an opposing regulatory pattern, involving only 9-hydroxy-12-oxo-15(Z)-octadecenoic acid, which was negatively correlated with the majority of the genes (Fig. 5c, d).
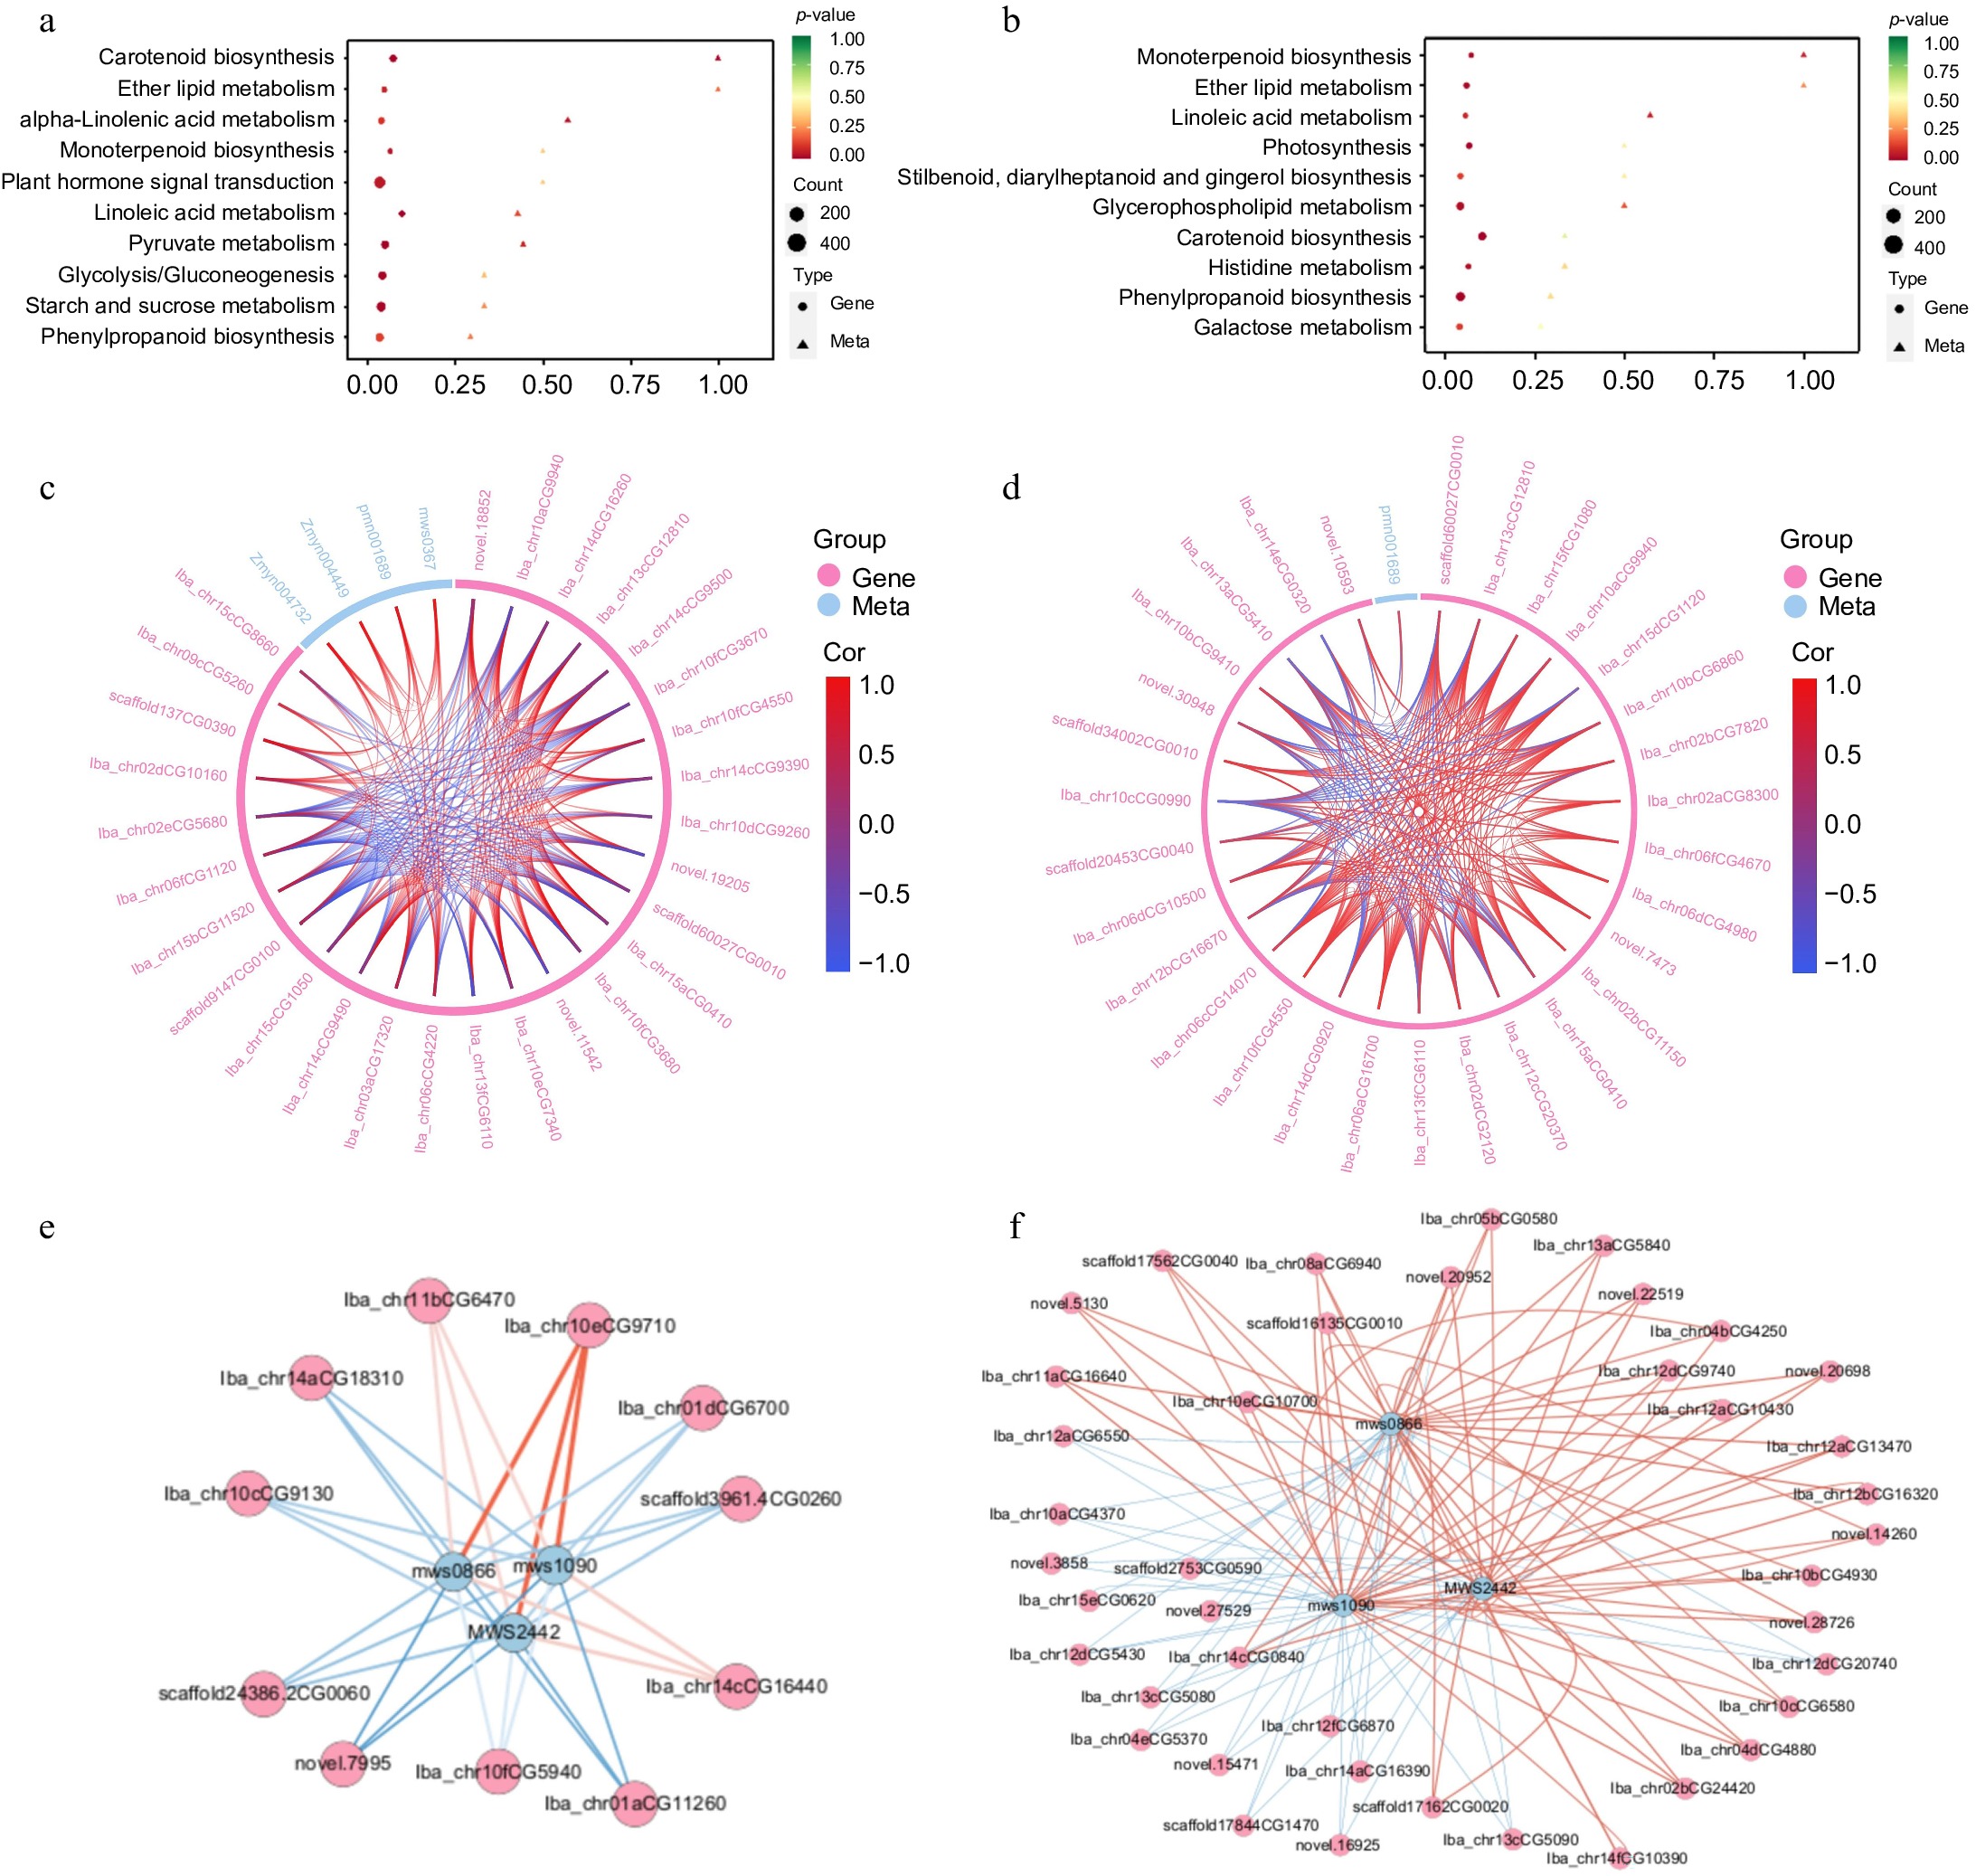
Figure 5.
Combined transcription and metabolism analysis. (a) KEGG co-enrichment analysis of DEMs and DEGs in XGH-0d vs XGH-4M. (b) KEGG co-enrichment analysis of DEMs and DEGs in YS-0d vs YS-4M. (c) Chord diagram of DEMs and DEGs enriched in the α-linolenic acid metabolic pathway in XGH-0d vs XGH-4M. (d) Chord diagram of DEMs and DEGs enriched in the α-linolenic acid metabolic pathway in YS-0d vs YS-4M. (e) Correlation network diagram of DEMs and DEGs enriched in starch and sucrose metabolism pathway in YS-0d vs YS-4M. (f) Correlation network diagram of DEMs and DEGs enriched in starch and sucrose metabolism pathway in XGH-0d vs XGH-4M.
A comparative correlation network analysis diagram depicting the dynamic interactions between genes and metabolites within the starch and sucrose metabolism pathways is provided for the XGH-0d vs XGH-4M and YS-0d vs YS-4M groups (Fig. 5e, f). In the XGH-0d vs XGH-4M group, three metabolites—D-glucose 6-phosphate, D-fructose 6-phosphate, and D-glucose-1-phosphate—along with 87 genes collectively modulated starch and sucrose metabolism, with the metabolites exhibiting a predominantly negative correlation with most of these genes. A similar pattern was observed in the YS-0d vs YS-4M group.
We further performed an exhaustive examination of the genes and metabolites implicated in the phenylpropanoid biosynthesis pathway, a process that is associated with texture characteristics (Fig. 6). In the XGH-0d vs XGH-4M group, strong positive correlations were noted among the genes phenylalanine ammonia-lyase, 4-coumarate–CoA ligase, trans-cinnamate 4-monooxygenase, and caffeoyl-CoA O-methyltransferase. Conversely, shikimate O-hydroxycinnamoyltransferase, cinnamoyl-CoA reductase, cinnamyl-alcohol dehydrogenase, and peroxidase exhibited strong negative correlations. Furthermore, phenylalanine ammonia-lyase, trans-cinnamate 4-monooxygenase, and shikimate O-hydroxycinnamoyltransferase positively regulated metabolites including caffeic acid, 1-O-sinapoyl-β-D-glucose, and 5-O-p-coumaroylquinic acid. In the YS-0d vs YS-4M group, caffeic acid 3-O-methyltransferase/acetylserotonin O-methyltransferase and shikimate O-hydroxycinnamoyltransferase positively regulated ferulic acid and 5-O-p-coumaroylquinic acid, respectively. Additionally, phenylalanine ammonia-lyase negatively regulated p-coumaric acid and caffeic acid. In the common pathways shared between XGH and YS varieties, amino acid biosynthesis pathways predominated. In the YS-0d vs XGH-0d group, metabolites involved in the valine, leucine, and isoleucine biosynthesis pathway—including 2-hydroxy-2-methyl-3-oxobutanoic acid (Lmbn001288), 2-isopropylmalic acid (pmb3101) and 3-isopropylmalic acid (Lmbn001754)—were positively regulated by most genes. In the YS-4M vs XGH-4M group, 2-hydroxy-2-methyl-3-oxobutanoic acid (Lmbn001288), 2-isopropylmalic acid (pmb3101), 3-isopropylmalic acid (Lmbn001754) and 2,3-dihydroxy-3-methylpentanoic acid (Lmbn001034) remained positively regulated by most genes. Notably, the abundance of 2-hydroxy-2-methyl-3-oxobutanoic acid decreased, whereas the abundance of 2-isopropylmalic acid and 3-isopropylmalic acid increased in both varieties after four months of storage (Supplementary Figs S5, S6).
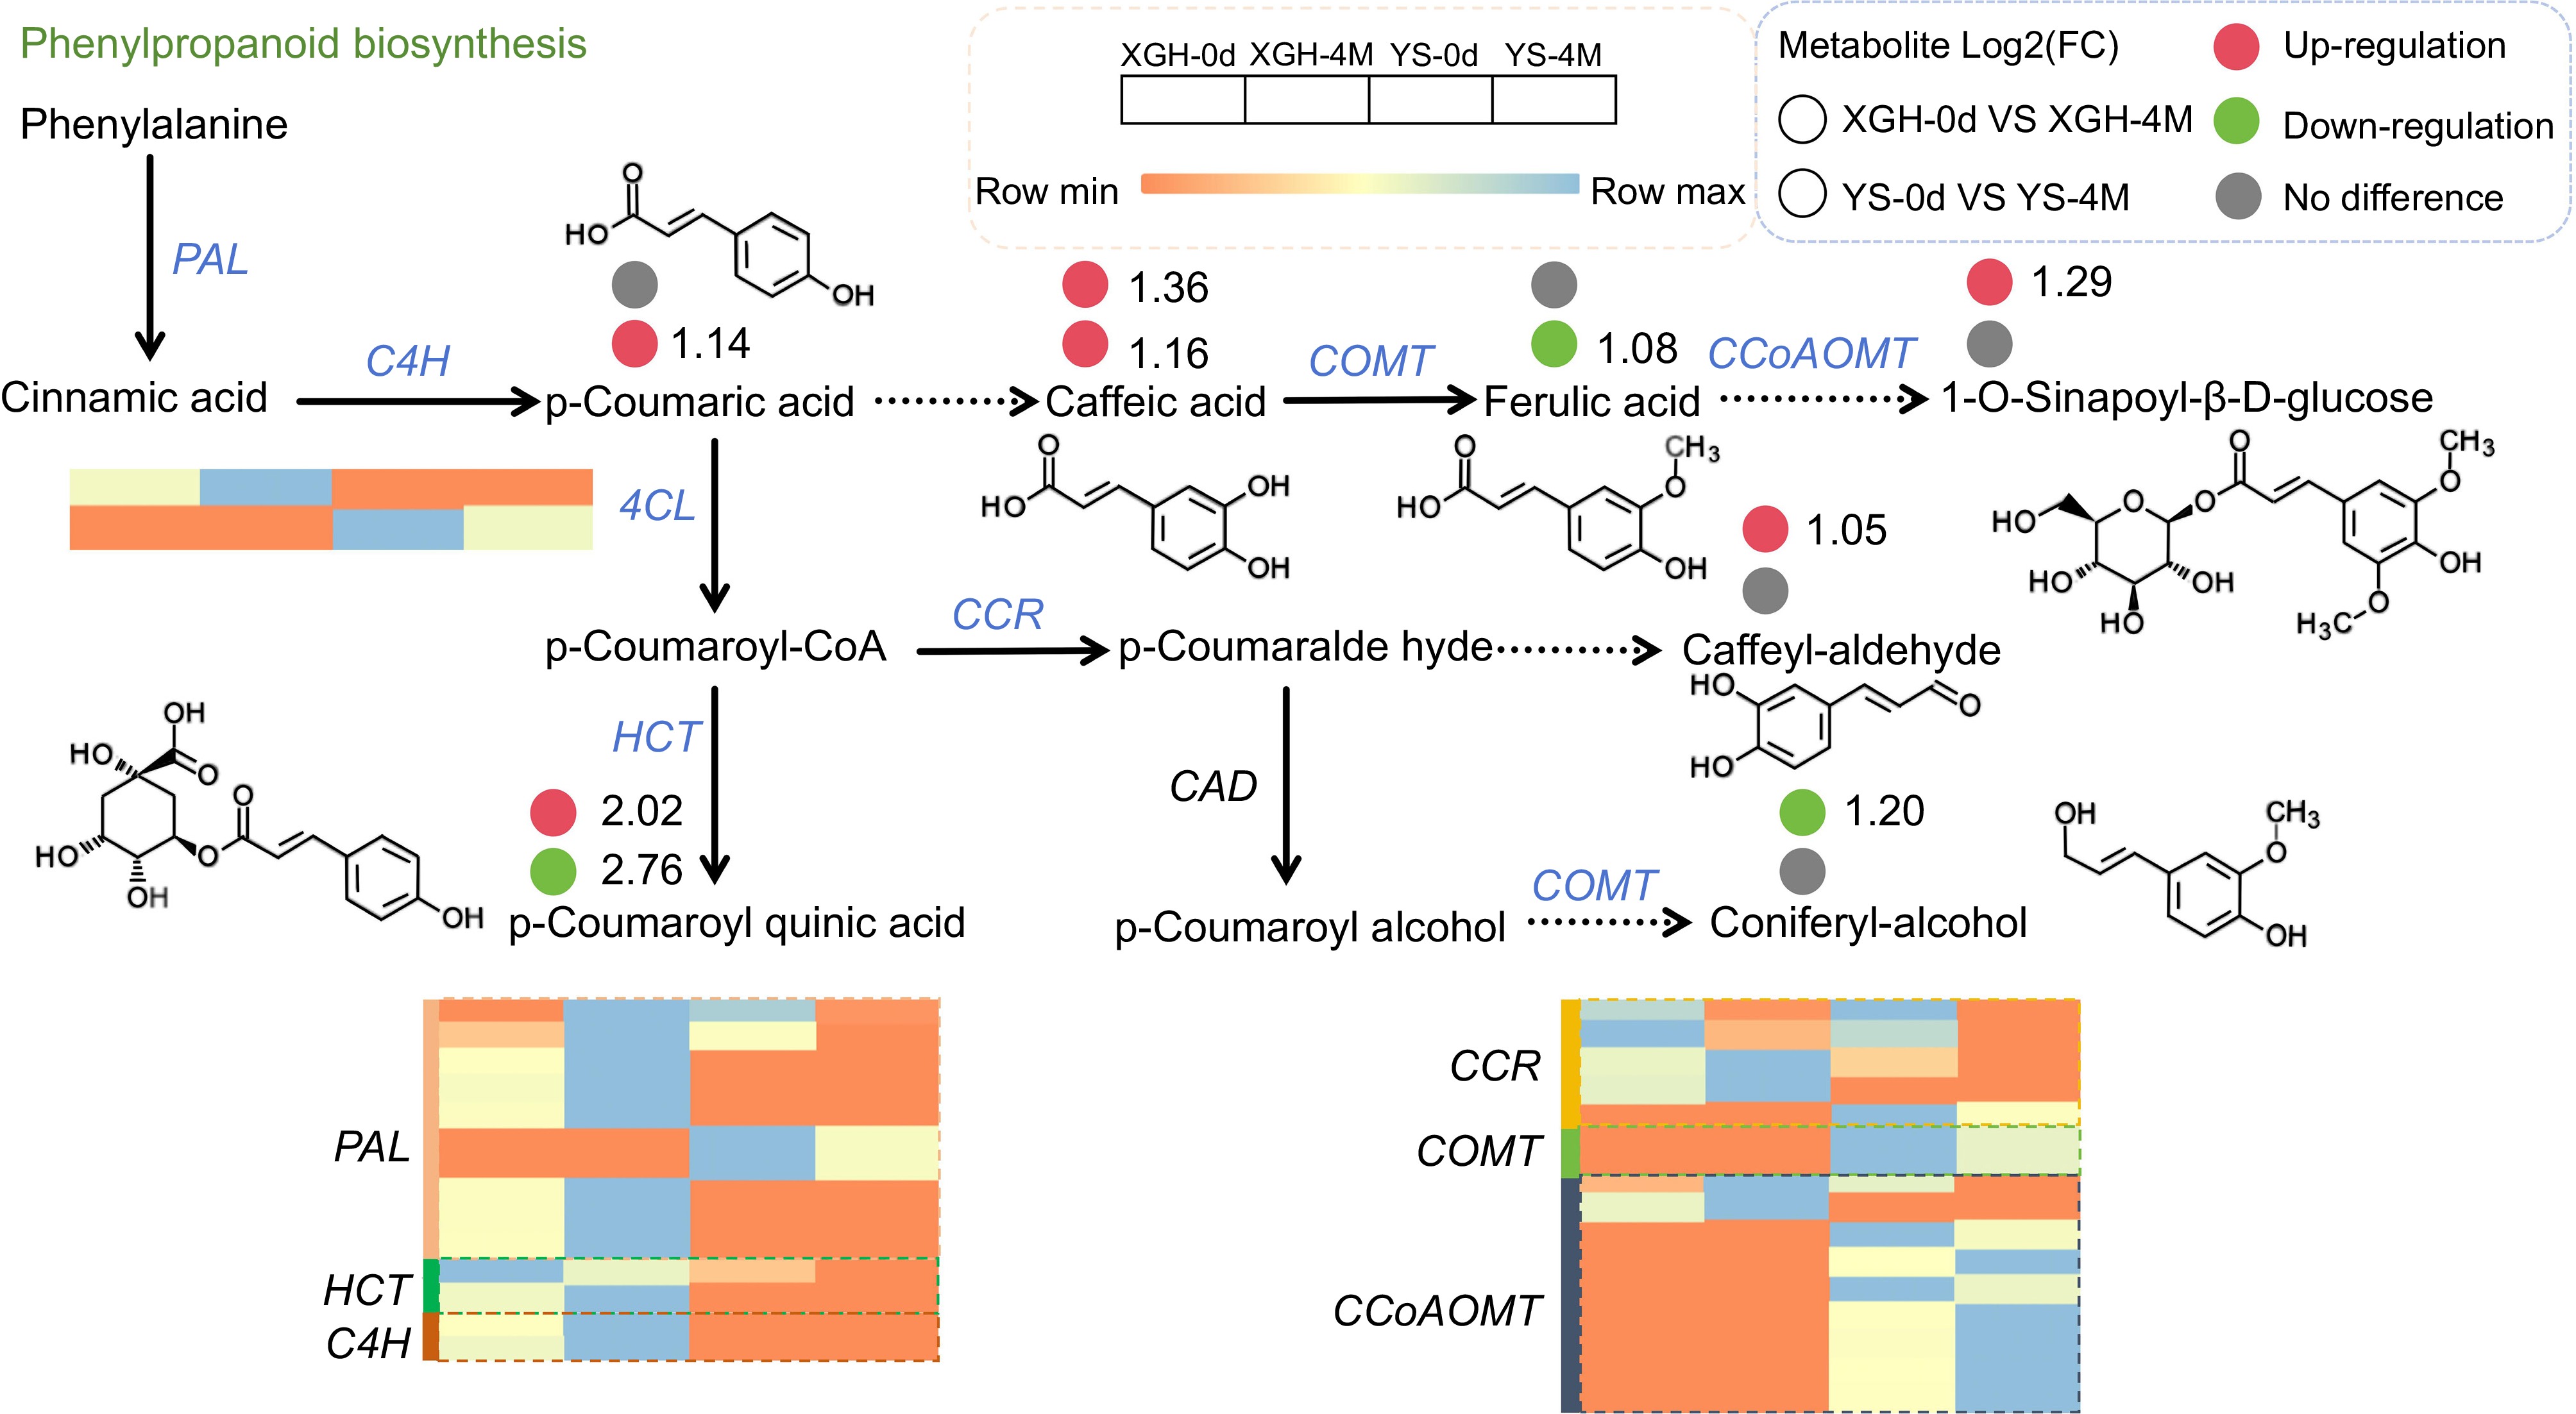
Figure 6.
Changes of DEMs and DEGs in the phenylpropanoid biosynthesis pathway.
-
Texture changes, the modifications include phenomena like the softening of cell walls and the process of lignification, occur during the storage of sweet potatoes[26,27]. The process of cell wall softening entails the disintegration of pectin and hemicellulose components within the primary cell wall, leading to weakened intercellular adhesion. In contrast, lignification results from increased lignin synthesis in the secondary cell wall[28−30]. Texture variations among sweet potato varieties correlate with differential gene expression related to cell wall degradation and lignin biosynthesis[4,31]. We identified DEGs related to texture BGAL, PAE, and PAL. These genes collectively affect cell wall structure through different biochemical pathways, influencing the textural properties of sweet potatoes[32,33]. After storage, genes related to cell wall softening—BGAL, PAE, XTH, and EXP—were expressed at lower levels in XGH compared to YS. In contrast, gene expression linked to lignin production, including PAL, HCT, 4CL, and CCR, was higher in XGH than in YS. Furthermore, intermediate products of lignin synthesis, such as caffeic acid and 1-O-sinapoyl-β-D-glucose, were more abundant in XGH. In summary, XGH exhibits reduced cell wall degradation gene expression and elevated lignin synthesis gene expression, and a higher abundance of intermediate products compared to YS.
Starch, the primary constituent of sweet potato tubers, decreases in content over extended storage periods due to respiratory and metabolic processes, where starch is hydrolyzed into glucose and fructose[34]. As storage progresses, the sucrose content in tubers gradually increases, possibly due to amylase activity and the action of sucrose phosphate synthase[35−37]. This study identified several differential metabolites and genes associated with starch and sugar metabolism. Genes involved in starch degradation include BAM, (BAM1), and AMYL. Notably, BAM, BAM1, and AMYL were upregulated in YS, while in XGH, BAM, and BAM1 were upregulated, but AMYL was downregulated. Studies have shown that Pushu 32 stands out the most among high-quality, high-starch sweet potato varieties, while Yanshu 25 belongs to the fresh-eating type of sweet potatoes[38,39]. The results of our study confirm that the gene expression involved in starch synthesis in XGH is superior to that in YS. The expression of genes involved in glycolysis and sugar metabolism, such as PFK, INVA, and GOLS2, were downregulated in both varieties, with a greater decrease in YS than in XGH. Genes related to starch and sucrose synthesis, including SS1, SUS2, and SUS3 were upregulated in XGH but downregulated in YS. This aligns with the observation that XGH has a higher sugar content. We utilized a multi-omics approach integrating transcriptomics and metabolomics to explore quality alterations in sweet potatoes during storage in the comparative groups of XGH-0d vs XGH-4M and YS-0d vs YS-4M (Fig. 7). Metabolomics revealed an increase in sugar content in both groups, indicating that the sweetness of sweet potatoes increases with prolonged storage. Transcriptomic analysis revealed genes linked to cell wall stability, lignin biosynthesis, antioxidant responses, disease resistance, color, and flavor, all of which influence quality degradation during storage. These findings can inform the breeding of superior sweet potato varieties and the selection of effective preservation methods.
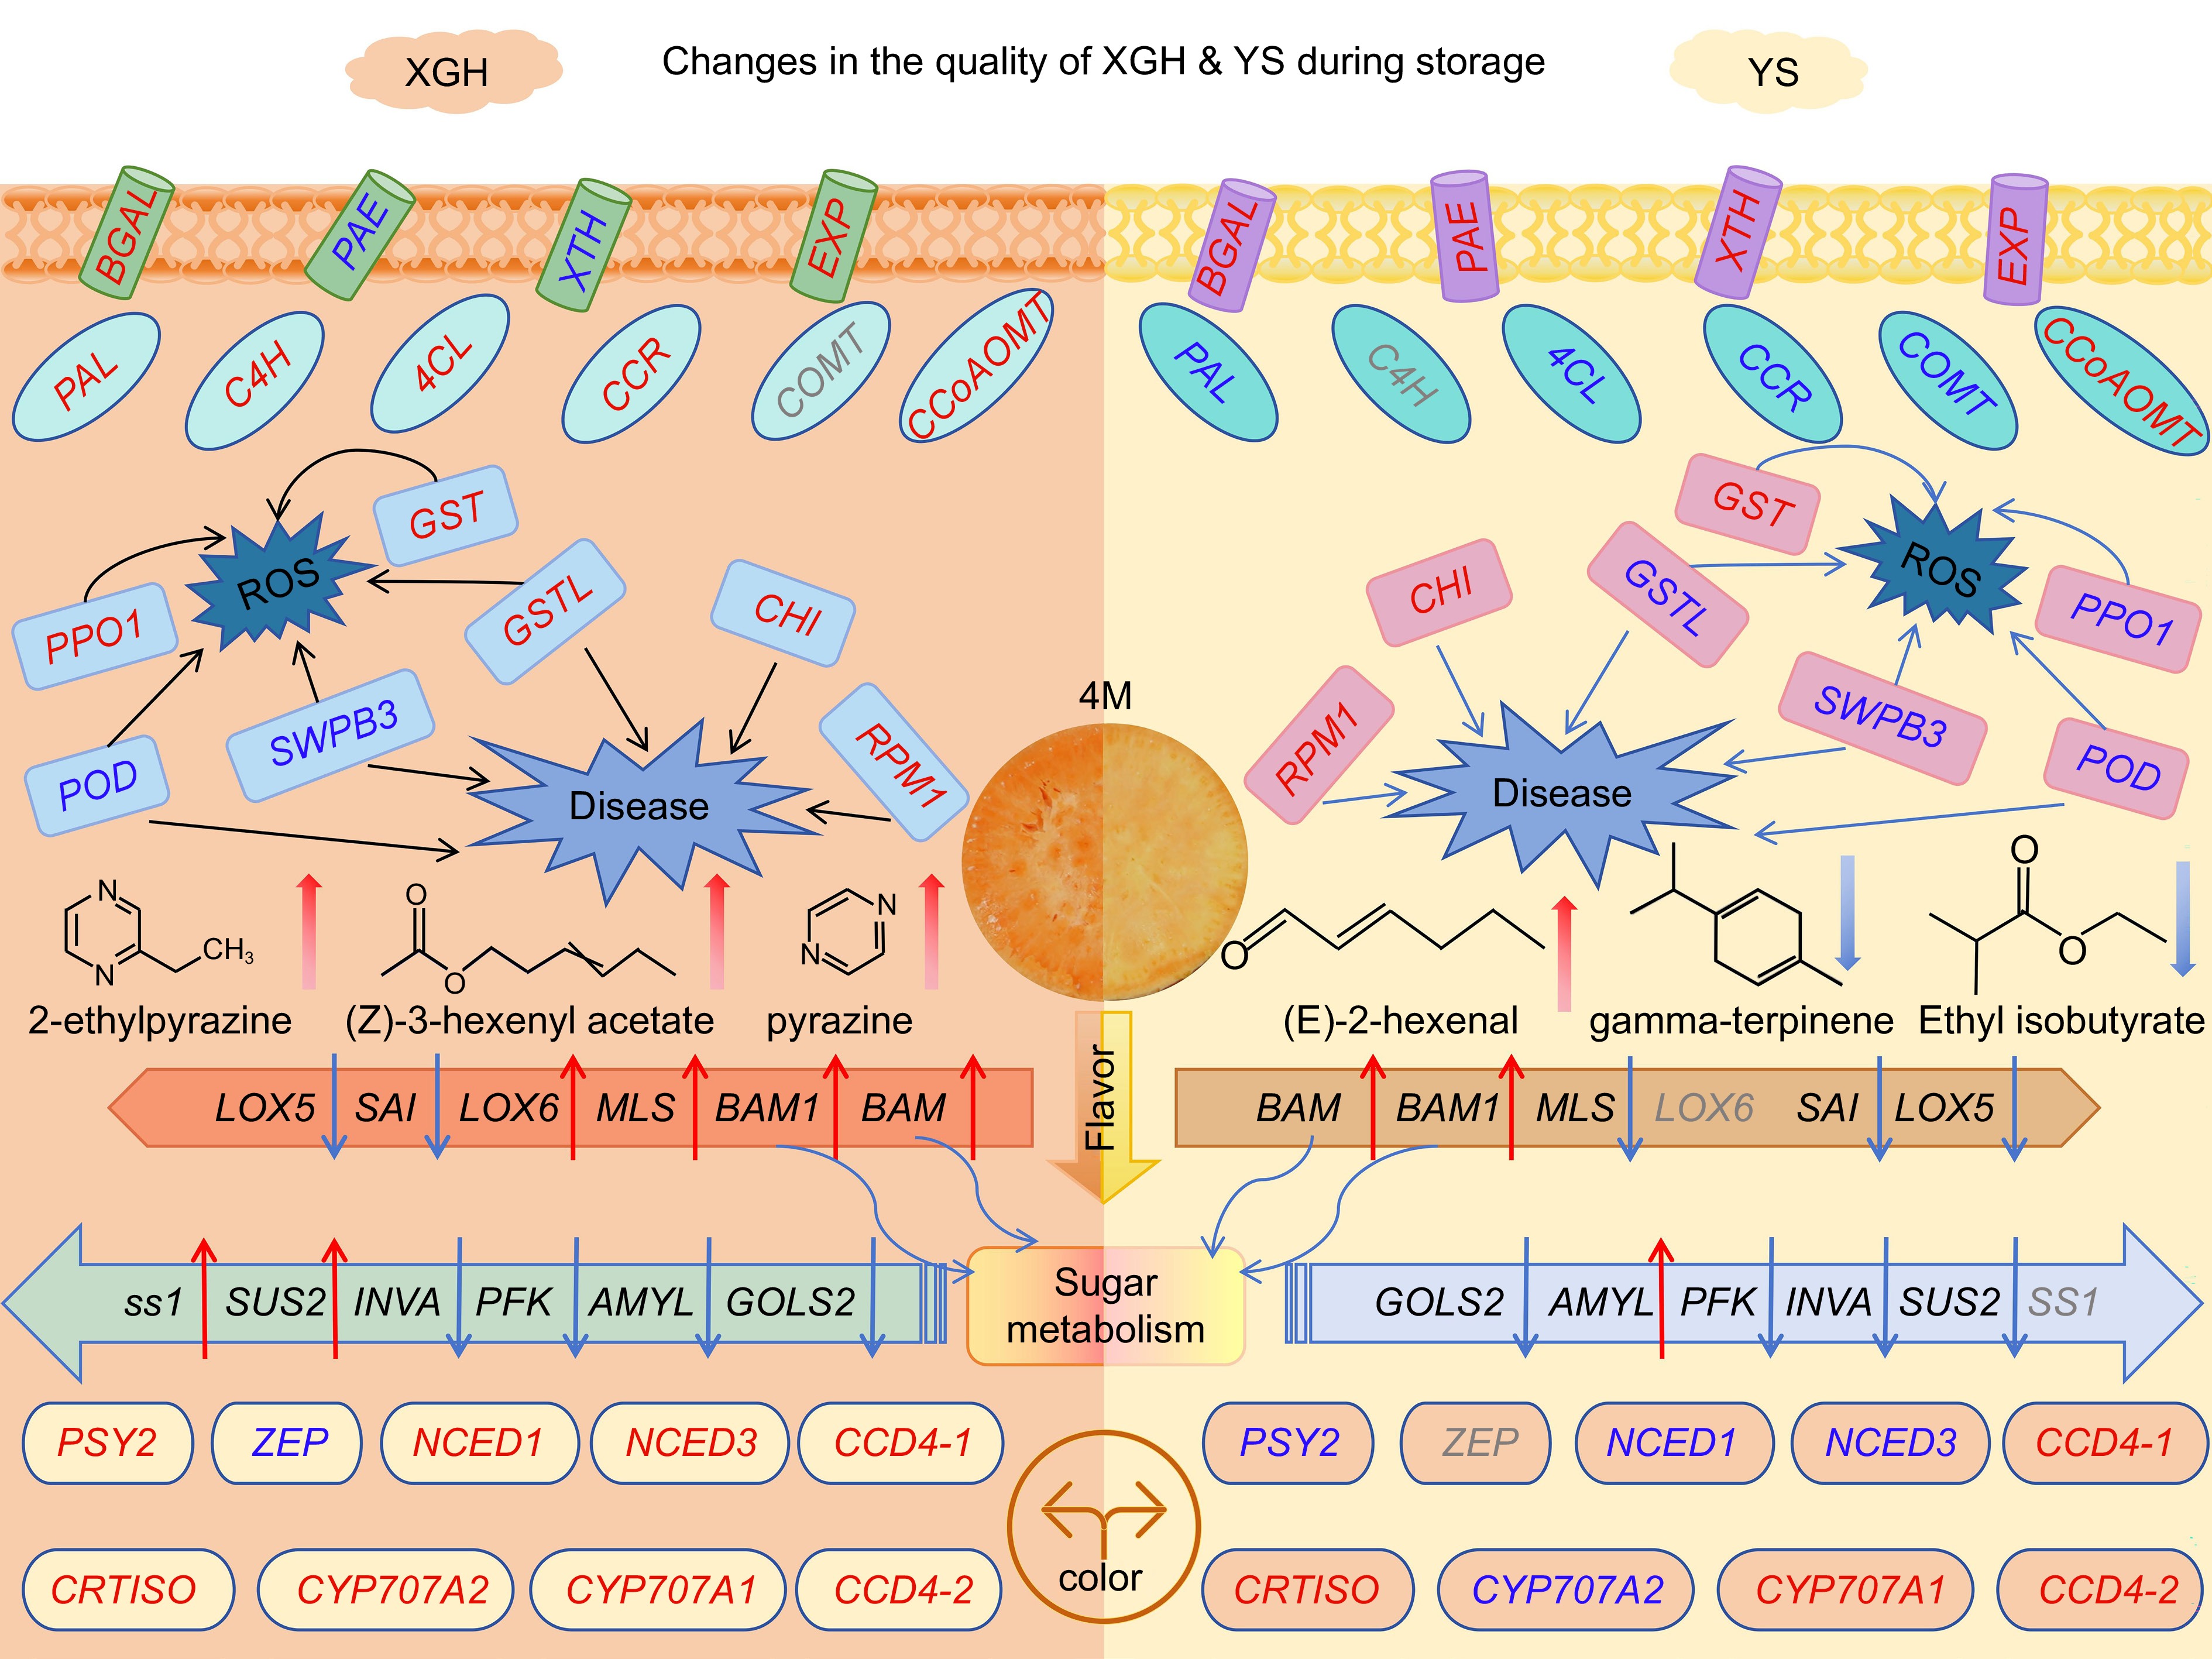
Figure 7.
A model of genes and metabolites related to quality deterioration of different varieties of sweet potato. The red font indicates up-regulated gene expression, and the blue font indicates down-regulated gene expression. The red arrow indicates an increase, and the blue arrow indicates a decrease. Gray fonts indicate that the gene is not present.
Color is one of the attributes that influence consumer preference for fruits and vegetables. The flesh color of 'Xiguahong' sweet potatoes is typically orange-red, while that of 'Yanshu25' is orange-yellow, attributed to their carotenoid content. The flesh color of orange-yellow sweet potatoes is primarily determined by carotenoids[40]. Our findings suggest that in the two comparative groups (XGH-0d vs XGH-4M and YS-0d vs YS-4M), expression of PSY, involved in carotenoid biosynthesis, was upregulated in XGH, while CRTISO was upregulated in YS. Interestingly, the gene NCED, involved in carotenoid degradation, was upregulated in XGH but downregulated in YS, whereas CCD was upregulated in both varieties. Genes related to carotenoid synthesis and degradation in both varieties changed as a result of storage. The upregulation of PSY 2 and CRTISO contributes to carotenoid accumulation, while the upregulation of NCED in XGH suggests increased carotenoid degradation, promoting ABA synthesis and playing a crucial role in stress response.
Sweet potato varieties with good storability have low disease susceptibility and maintenance of nutritional content[41,42]. Research has demonstrated that the MAPK signaling pathway, widely present in plants, and plant-pathogen interactions can serve as dynamic defense mechanisms in response to external stresses. Plant hormones and ROS can also induce plant defense genes, triggering defense responses[43−45]. In the present study, 14 common genes involved in these pathways were identified after the storage of both varieties. However, combined transcriptomic and metabolomic analysis revealed that only XGH had enriched metabolites in the plant hormone signal transduction pathway. ABA is key for abiotic stress tolerance, enhancing plants ability to withstand environmental stresses. Additionally, ABA can induce the expression of enzymes involved in antioxidant activity, like SOD, POD, APX, and GST, thereby improving the plant tissues capacity to affect ROS[46]. Our study found that ABA accumulation was detected in XGH, as well as the transcription levels of GSTL and POD genes encoding antioxidant enzymes, were higher in XGH compared to YS. Therefore, XGH likely exhibits greater antioxidant capacity and stronger resistance to abiotic stresses than YS.
-
To our understanding, this study is the first to utilize both transcriptomics and metabolomics to investigate the differential genes and metabolites in stored sweet potato varieties. The accumulation and concentration of differential metabolites and genes after storage were generally similar between the two varieties; however, XGH exhibited elevated expression of genes related to the phenylpropanoid metabolic pathway and a greater abundance of metabolites related to texture and antioxidant properties. Genes related to disease resistance, such as RPM1, POD, GSTL, and CHI, were enriched in pathways including plant-pathogen interactions, phenylpropanoid biosynthesis, and glutathione metabolism, with higher expression levels in XGH. Transcriptomic analysis also revealed that more flavor-related genes were upregulated in XGH compared to YS, suggesting that XGH may have superior flavor after storage. In summary, the primary factors contributing to quality changes in sweet potatoes during postharvest storage are texture softening and oxidation. These factors are associated with genes and metabolites involved in cell wall degradation, lignin synthesis, flavonoid biosynthesis, and plant-pathogen interactions.
This work was supported by Beijing Innovation Consortium of Agriculture Research System (BAIC02-2024), Special Innovation Ability Construction Fund of Beijing Academy of Agricultural and Forestry Sciences (20240405), and the Major Scientific and Technological Achievements Cultivation Project of Beijing Academy of Agriculture and Forestry Sciences. Thanks to Christopher B. Watkins from Cornell University for his valuable suggestions on this article.
-
The authors confirm contribution to the paper as follows: study conception and design: Meng D, Zheng Y; data collection: Bai C, He X, Tao J, Ren Y; analysis and interpretation of results: Wang Y, Ma L, Liu S, Chen S; draft manuscript preparation: Feng X, Zuo J. All authors reviewed the results and approved the final version of the manuscript.
-
The datasets generated during and/or analyzed during the current study are available from the corresponding author on reasonable request.
-
The authors declare that they have no conflict of interest.
-
# Authors contributed equally: Xinyi Feng, Jinhua Zuo
- Supplementary Table S1 Comprehensive sensor readings.
- Supplementary Table S2 Multiple comparison groups of metabolites.
- Supplementary Table S3 The comparison of metabolite content differences.
- Supplementary Table S4 Comparison of 26 metabolite contents.
- Supplementary Table S5 Analysis of texture-related gene differences.
- Supplementary Table S6 The endemic gene soluble starch synthase 1 in XGH.
- Supplementary Fig. S1 Changes in the abundance of hydroperoxylinoleic acid in XGH-0d vs. XGH-4M and YS-0d vs. YS-4M.
- Supplementary Fig. S2 Enrichment of KEGG top 9 pathways for DEGs in YS-0d vs. XGH-0d.
- Supplementary Fig. S3 Enrichment of KEGG top 9 pathways for DEGs in YS-4M vs. XGH-4M.
- Supplementary Fig. S4 Change of DEGs associated with galactose metabolism and starch and sucrose metabolism.
- Supplementary Fig. S5 Valine, leucine, and isoleucine biosynthesis pathwaycorrelation network diagram in YS-0d vs. XGH-0d, the red circle represents the gene name, the green square represents the metabolite name, the solid line is positively correlated, and the dashed line is negatively correlated.
- Supplementary Fig. S6 Valine, leucine, and isoleucine biosynthesis pathwaycorrelation network diagram in YS-4M vs. XGH-4M, the red circle represents the gene name, the green square represents the metabolite name, the solid line is positively correlated, and the dashed line is negatively correlated.
- Copyright: © 2025 by the author(s). Published by Maximum Academic Press, Fayetteville, GA. This article is an open access article distributed under Creative Commons Attribution License (CC BY 4.0), visit https://creativecommons.org/licenses/by/4.0/.
-
About this article
Cite this article
Feng X, Zuo J, Wang Y, Bai C, Chen S, et al. 2025. Comparative analysis of two stored sweet potato varieties using integrated transcriptomics and metabolomics. Vegetable Research 5: e012 doi: 10.48130/vegres-0025-0007 

Comparative analysis of two stored sweet potato varieties using integrated transcriptomics and metabolomics
- Received: 05 December 2024
- Revised: 28 December 2024
- Accepted: 06 January 2025
- Published online: 16 April 2025
Abstract: Texture, color, antioxidant capacity, and disease resistance of sweet potato varieties differ, but information on metabolic differences among varieties is limited. This research investigated the alterations in volatile substances, gene expression quantities, and metabolites during the storage process of two varieties of sweet potatoes: 'Xiguahong' and 'Yanshu25'. The GC-IMS findings indicated that compounds possessing appealing aromas, including 2-ethylpyrazine, γ-terpinene, and ethyl isobutyrate, were more concentrated in 'Xiguahong'. The expression levels of phenylpropanoid biosynthesis genes (PAL, CCR), flavor-related genes (MLS, LOX6), color-related genes (PSY2, CRTISO), and resistance-related genes (PPO1, GSTL) were higher in 'Xiguahong'. Phenolic acids, flavonoids, terpenes, lignans, and coumarins content increased more in 'Xiguahong' than in 'Yanshu25'. This study provides insights into the molecular mechanisms underlying post-harvest quality changes in different sweet potato varieties.
-
Key words:
- Sweet potato /
- Antioxidant capacity /
- Texture /
- Transcriptome /
- Metabolome