-

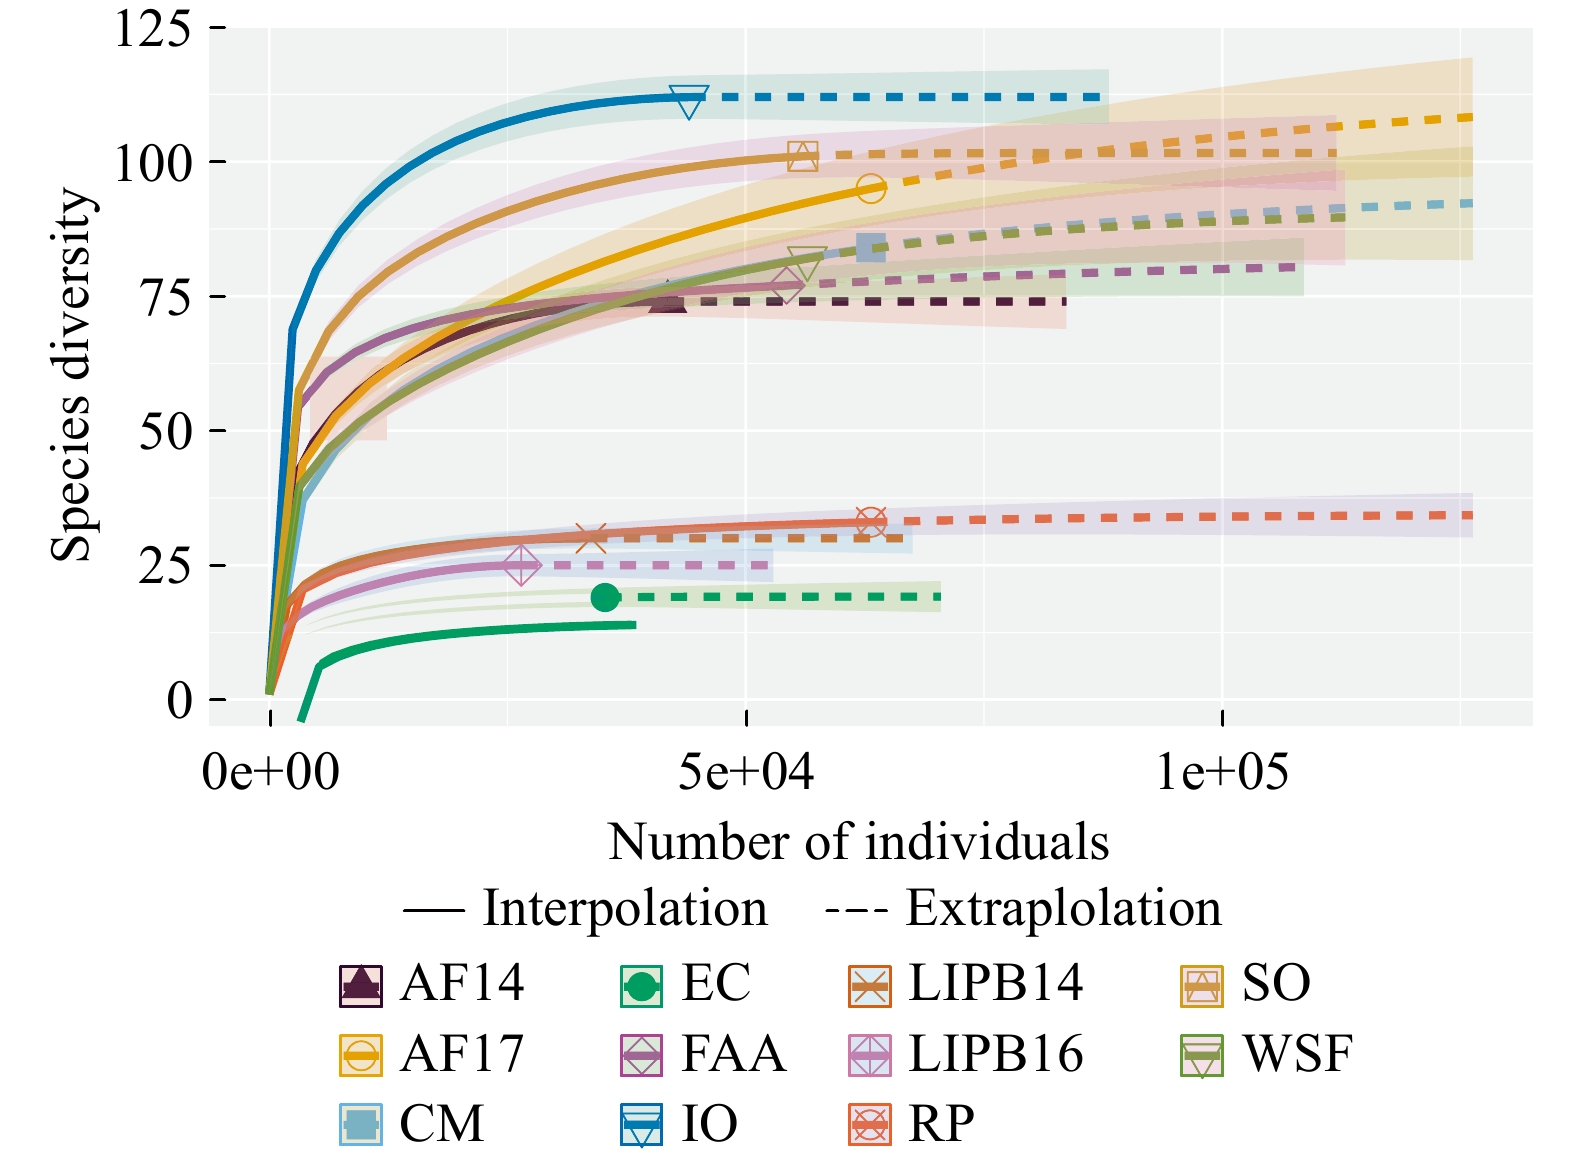
Figure 1. Rarefaction analysis of AM fungal communities from all sampled sites. AF14 - Adelphia Research Field 2014, AF17 - Adelphia Research Field 2017, CM - Colliers Mills, EC - EARTH Center, IO - Iowa, FAA - Federal Aviation Administration, LIPB14 - Long Island Pine Barrens 2014, LIPB16 - Long Island Pine Barrens 2016, RP - Rocky Point, SO - Somerset Research Field, WSF - Wharton State Forest.
-

Figure 2. Maximum-likelihood phylogenetic tree of the AM fungal diversity detected in this study. Numbers on branches indicate percent bootstrap support for 1000 replications. Bootstrap values > 70% are shown. Bold names represent sequences obtained from this study. AM fungal families are aligned vertically.
 = sequences retrieved exclusively from managed lands;
 = sequences retrieved exclusively from the Iowa prairie;
 = sequences retrieved exclusively from pine barrens forests.
-

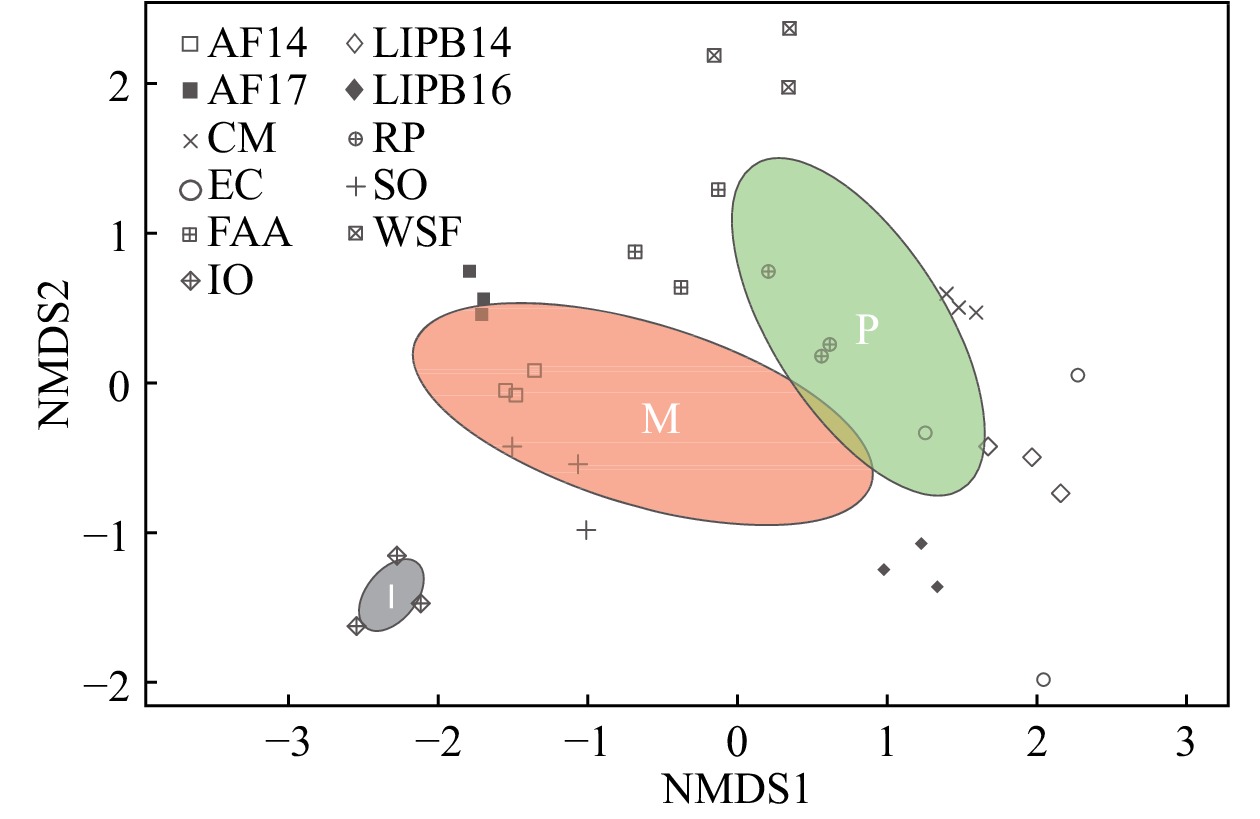
Figure 3. Nonmetric multidimensional scaling (NMDS) plot of AM fungal communities from 33 switchgrass samples from 11 sites. This analysis was based on Bray–Curtis dissimilarity measurements between samples (non-pooled) (stress = 0.147). A green ellipse with a ‘P’ indicates pine barrens AM fungal diversity, a red ellipse with an ‘M’ indicates managed AM fungal diversity, and a grey ellipse with an ‘I’ indicates Iowa AM fungal diversity. Pine barrens sites included CM, FAA, LIPB14, LIPB16, RP, and WSF. Managed sites included AF14, AF17, EC, and SO. The Iowa site was exclusively IO. Different shapes represent the sampling sites.
-
Site No of Samples No of OTUs
(observed)No of OTUs
(rarefied)No of Reads
(observed)No of Reads
(rarefied)Shannon Simpson Fisher's α AF14 (M) 3 74 74 41,819 41,819 2.366 0.869 8.732 AF17 (M) 3 153 89 710,459 63,147 1.736 0.675 10.973 CM (P) 3 97 81 156,356 63,147 1.023 0.367 9.549 EC (M) 3 19 19 35,821 35,245 0.952 0.4 1.937 FAA (P) 3 83 76 169,083 54,286 2.661 0.877 8.826 IO 3 113 111 48,525 44,057 3.148 0.927 13.892 LIPB14 (P) 3 30 30 33,757 33,757 0.756 0.283 3.243 LIPB16 (P) 3 25 25 26,451 26,451 0.655 0.261 2.723 RP (P) 3 39 33 367,234 63,147 1.911 0.8 3.352 SO (M) 3 103 102 63,304 56,003 2.12 0.791 11.949 WSF (P) 3 102 84 169,654 56,463 2.089 0.811 9.428 ‘Observed’ refers to raw abundance and ‘rarefied’ refers to abundance after rarefying to the median number of reads.
Site abbreviations are: AF14 - Adelphia Research Field 2014, AF17 - Adelphia Research Field 2017, CM - Colliers Mills, EC - EARTH Center, IO - Iowa, FAA - Federal Aviation Administration, LIPB14 - Long Island Pine Barrens 2014, LIPB16 - Long Island Pine Barrens 2016, RP - Rocky Point, SO - Somerset Research Field, WSF - Wharton State Forest. (M): managed field site, (P): pine barrens site.Table 1. The number of AM fungal operational taxonomic units (OTUs) and reads detected from each of the 11 sampled sites, obtained through Illumina sequencing. Three diversity indices (Shannon, Simpson, and Fisher's α) are compared.
-
Order Family Genus No of OTUs No of Reads by Land Use Managed Pine Barrens Iowa Archaeosporales Ambisporaceae Ambispora 4 0 65 0 Archaeosporaceae Archaeospora 10 301 268 0 N/A Undescribed Archaeosporales 1 0 20 0 Diversisporales Acaulosporaceae Acaulospora 38 0 23,042 643 Diversisporaceae Diversispora 3 358 87 618 Gigasporaceae Undescribed Gigasporaceae 12 1,789 12,085 0 Gigasporaceae Gigaspora 15 9,335 17,396 0 Glomerales Claroideoglomeraceae Claroideoglomus 42 14,068 7,885 4,260 Glomeraceae Glomus 251 156,470 235,695 27,743 Glomeraceae Undescribed Glomeraceae 12 742 156 1,792 N/A Undescribed Glomerales 20 12,430 266 8,993 Paraglomerales Paraglomeraceae Paraglomus 14 712 286 8 N/A N/A Undescribed Glomeromycetes 1 9 0 0 Table 2. Distribution and abundance of AM fungal OTUs and reads (rarefied) among all sites. Colors represent a common order. Abundance of each taxon found under different land uses (managed, pine barrens, Iowa) is included.
Figures
(3)
Tables
(2)