-
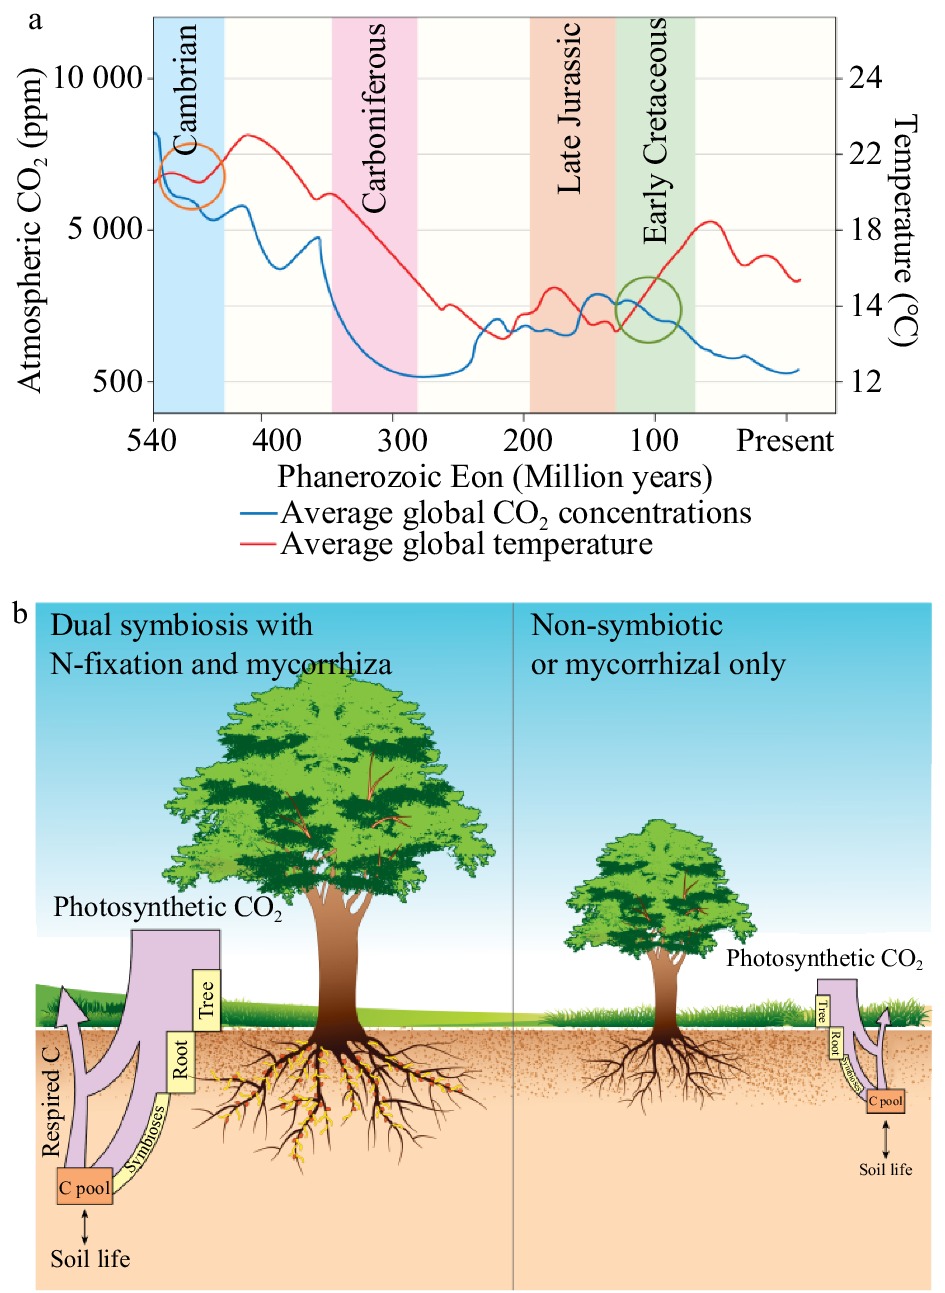
Figure 1.
Atmospheric carbon dioxide (CO2, ppm) and temperature (°C) levels during the Phanerozoic Eon (540 Ma to present) (a). Data adapted from [5], [20], [21]. The highlighted portions indicate relevant periods in the past: light blue indicates the Devonian Period, purple the Carboniferous Period, light orange the late Jurassic Period, and light green the early Cretaceous Period. The proposed periods for the development of the mycorrhizal symbioses are circled in orange and that of symbiotic N-fixation in green. The illustrative description of the C-pumps model proposed for N-fixing trees shows the relative movement of C through these systems (b). The relative proportion of C captured via photosynthesis is represented by the purple box, with as much as 50% more C fixed in dual symbiotic plants compared to non-symbiotic plants[10]. The yellow boxes represent the relative amounts of C stored in biomass, with N-fixing trees growing as much as nine times faster than their non-N-fixing counterparts[20].
Figures
(1)
Tables
(0)