-
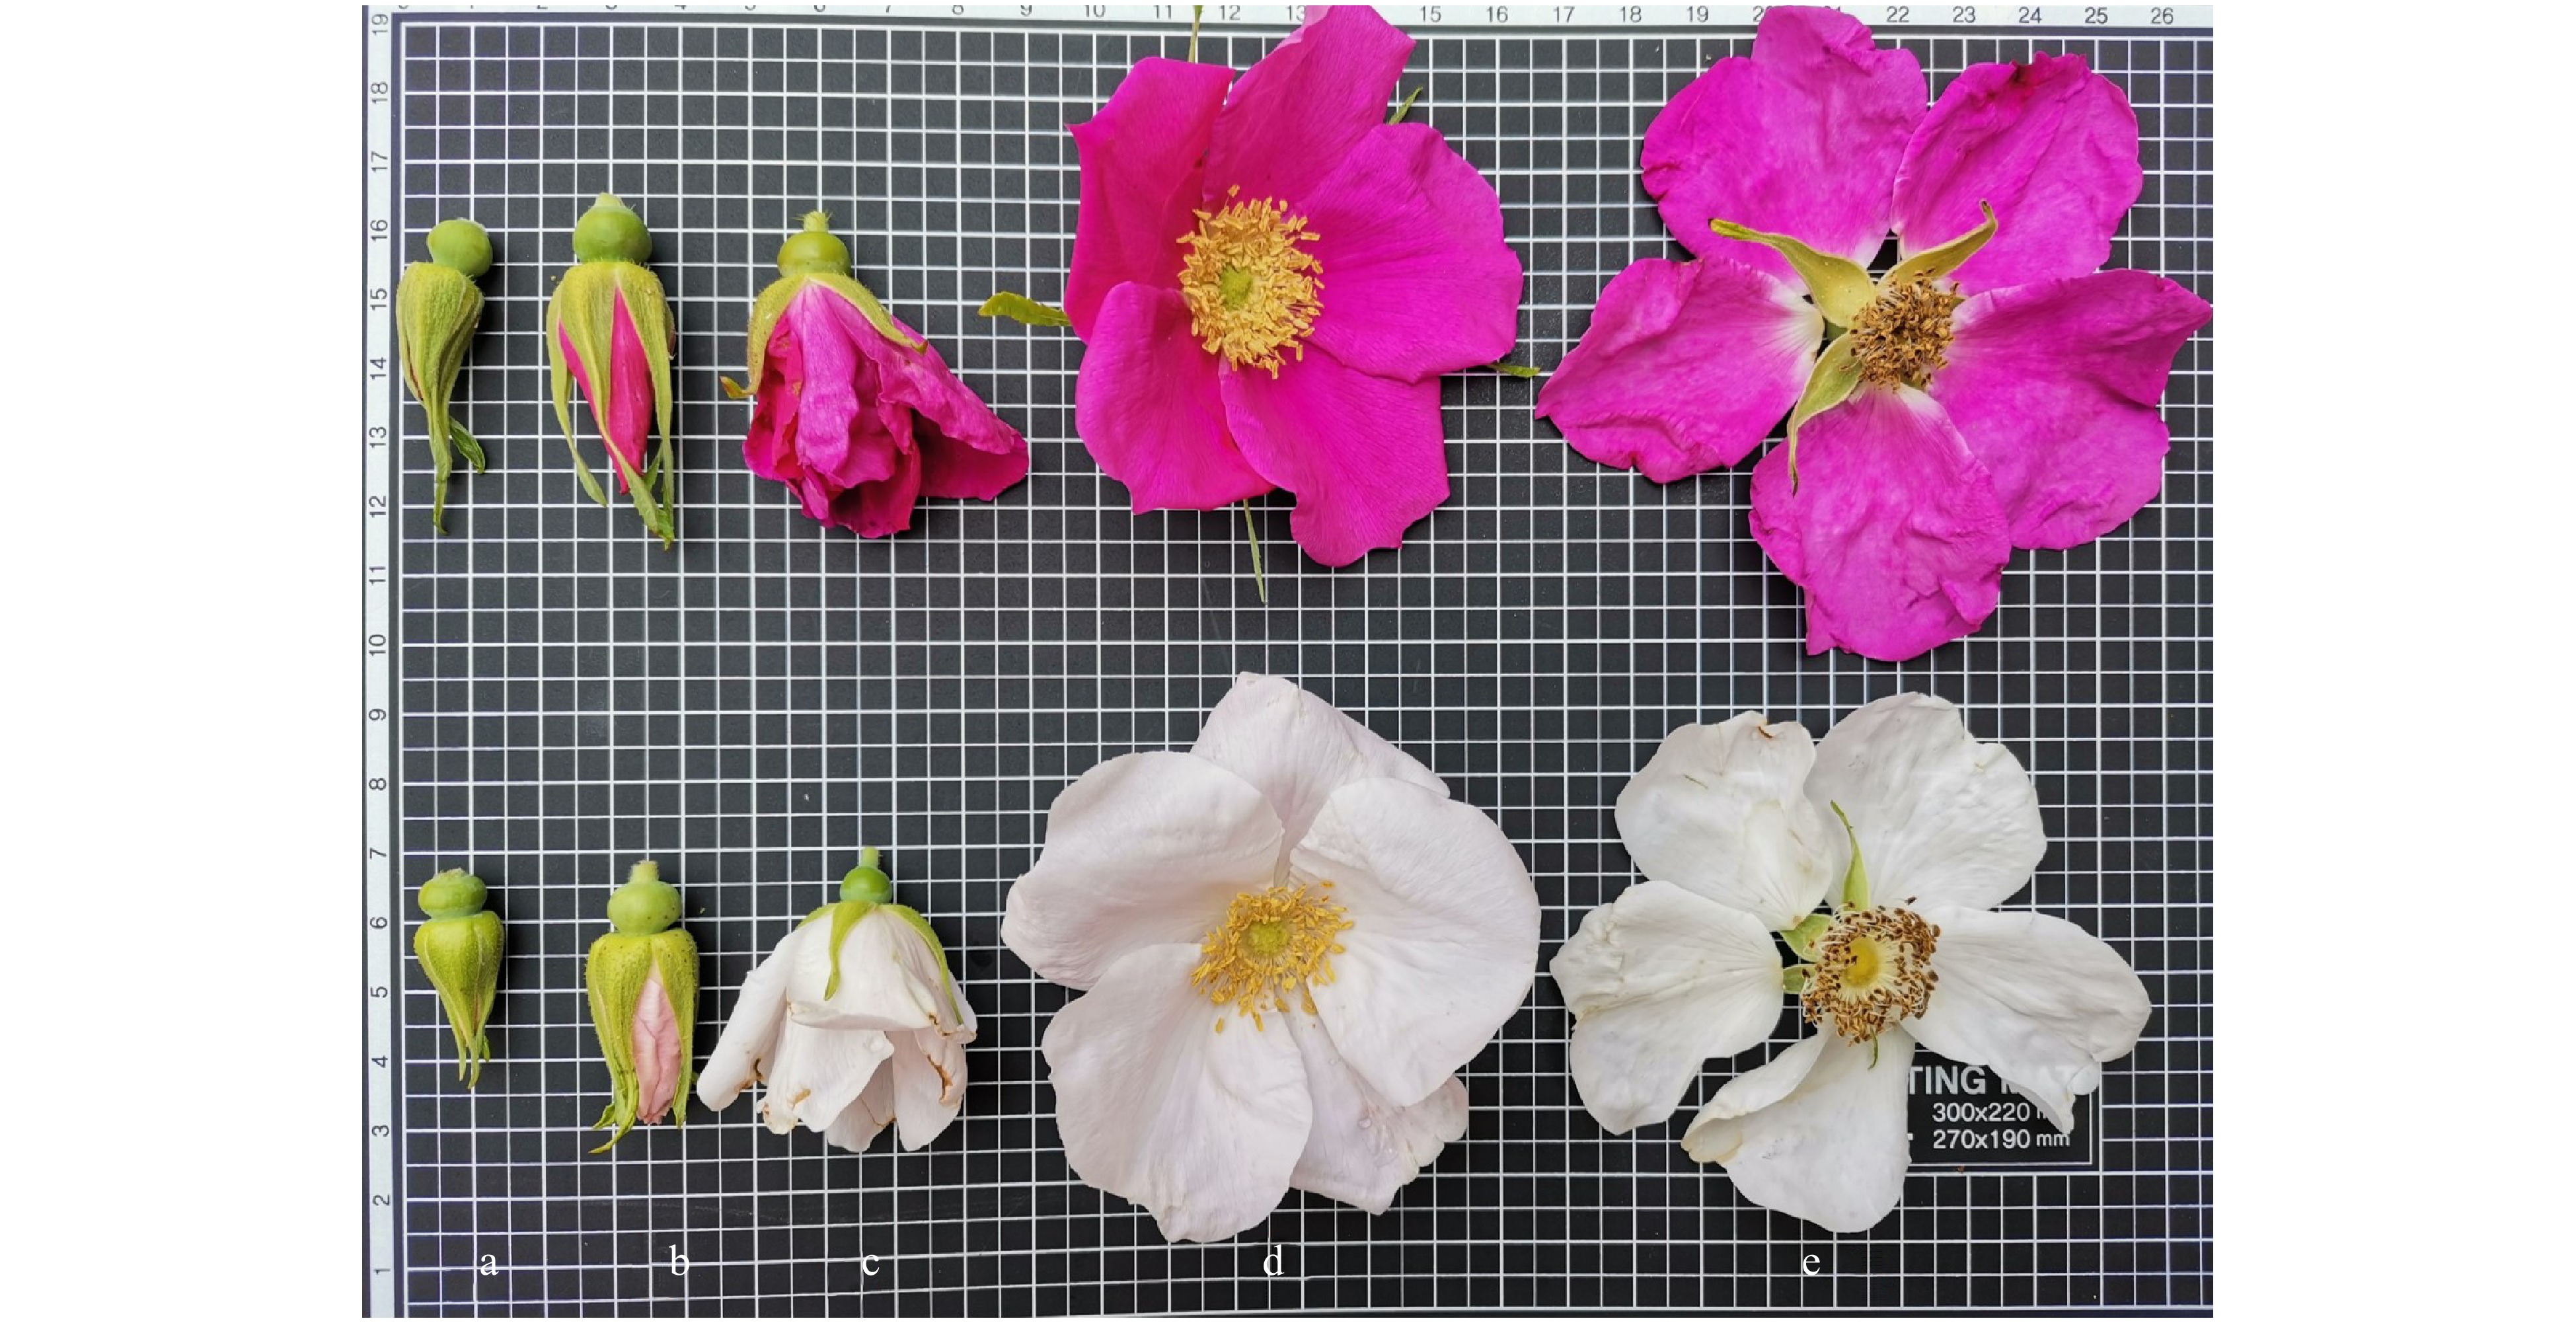
Figure 1. Five development stages of R. rugosa Thunb. f. rosea Rehd. (RR) and R. rugosa Thunb. f. alba (Ware)Rehd. (WR). (a) Stage 1, bud stage; (b) Stage 2, early flowering stage; (c) Stage 3, half-open stage; (d) Stage 4, blooming stage; (e) Stage 5, decline stage.
-
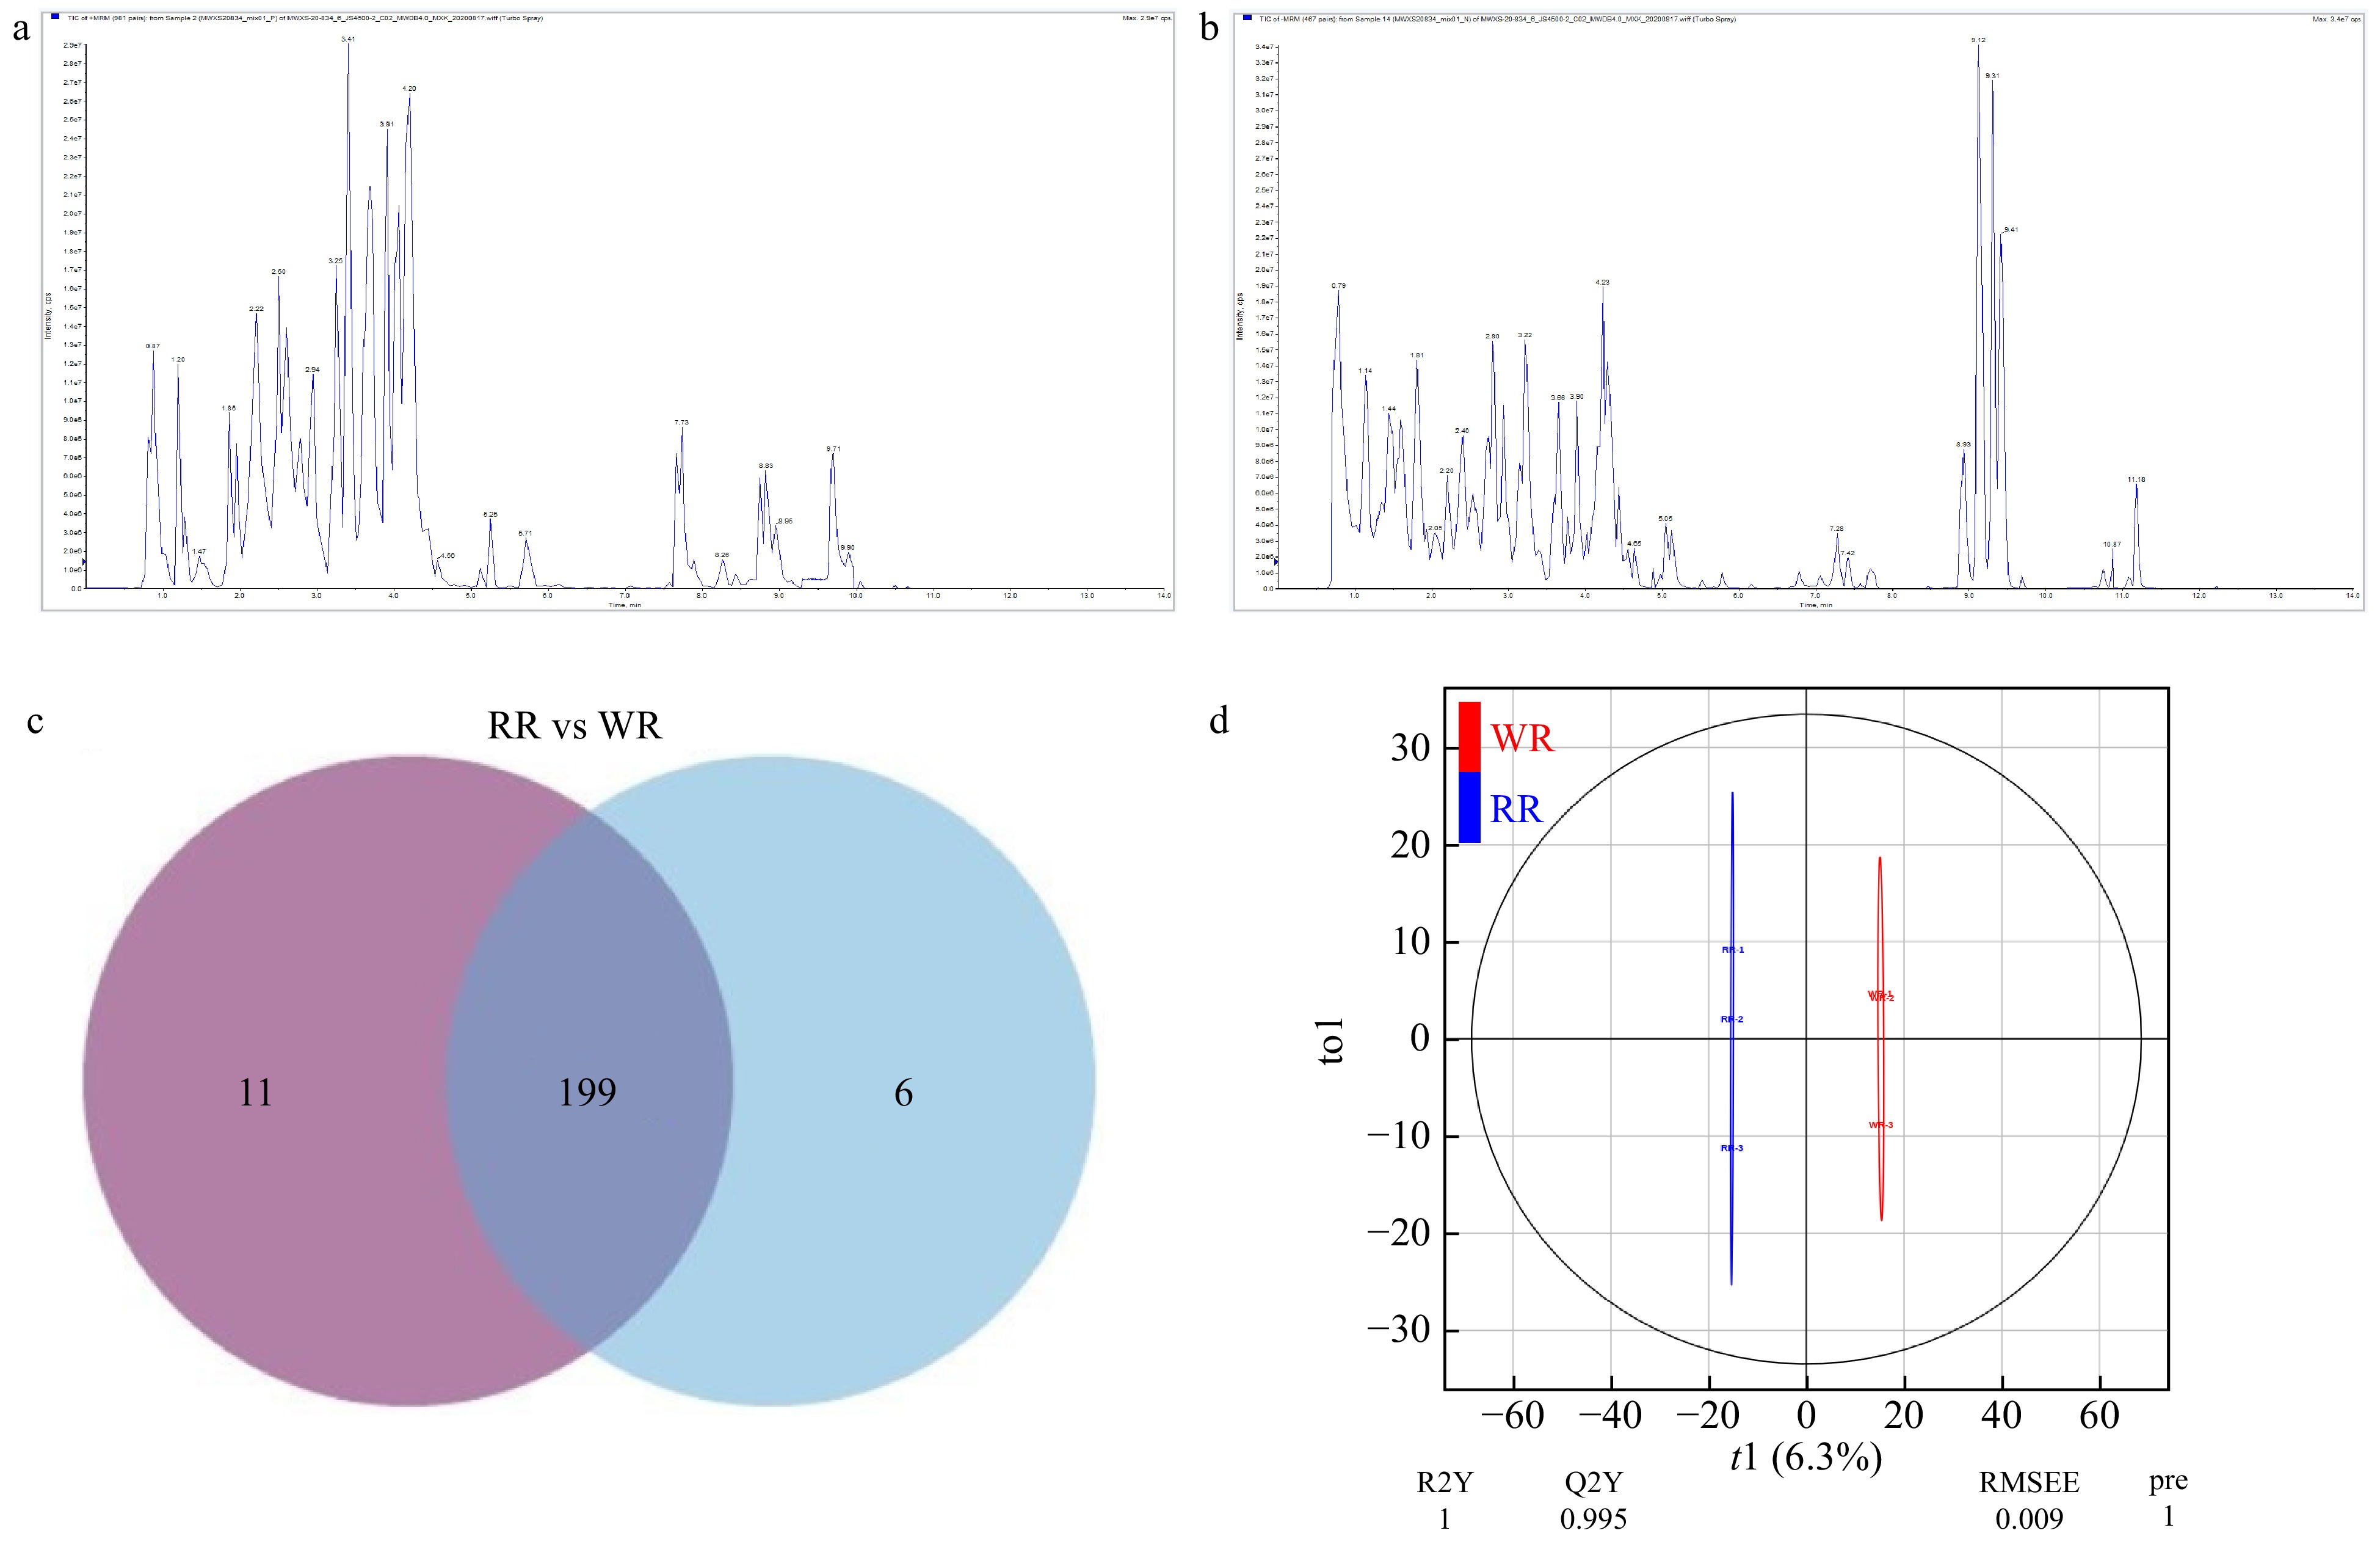
Figure 2. Component analysis of flavonoids of the petals. (a) QC_MS_TIC-P, total ions current of one quality control sample by mass spectrometry; (b) QC_MS_TIC-N, multi-peak detection plot of metabolites in the multiple reaction monitoring mode; (c) Venn diagram, the distribution of 216 flavonoids detected in WR and RR. (d) Score scatter plot of the orthogonal projections to latent structures-discriminant analysis (OPLS-DA) model.
-
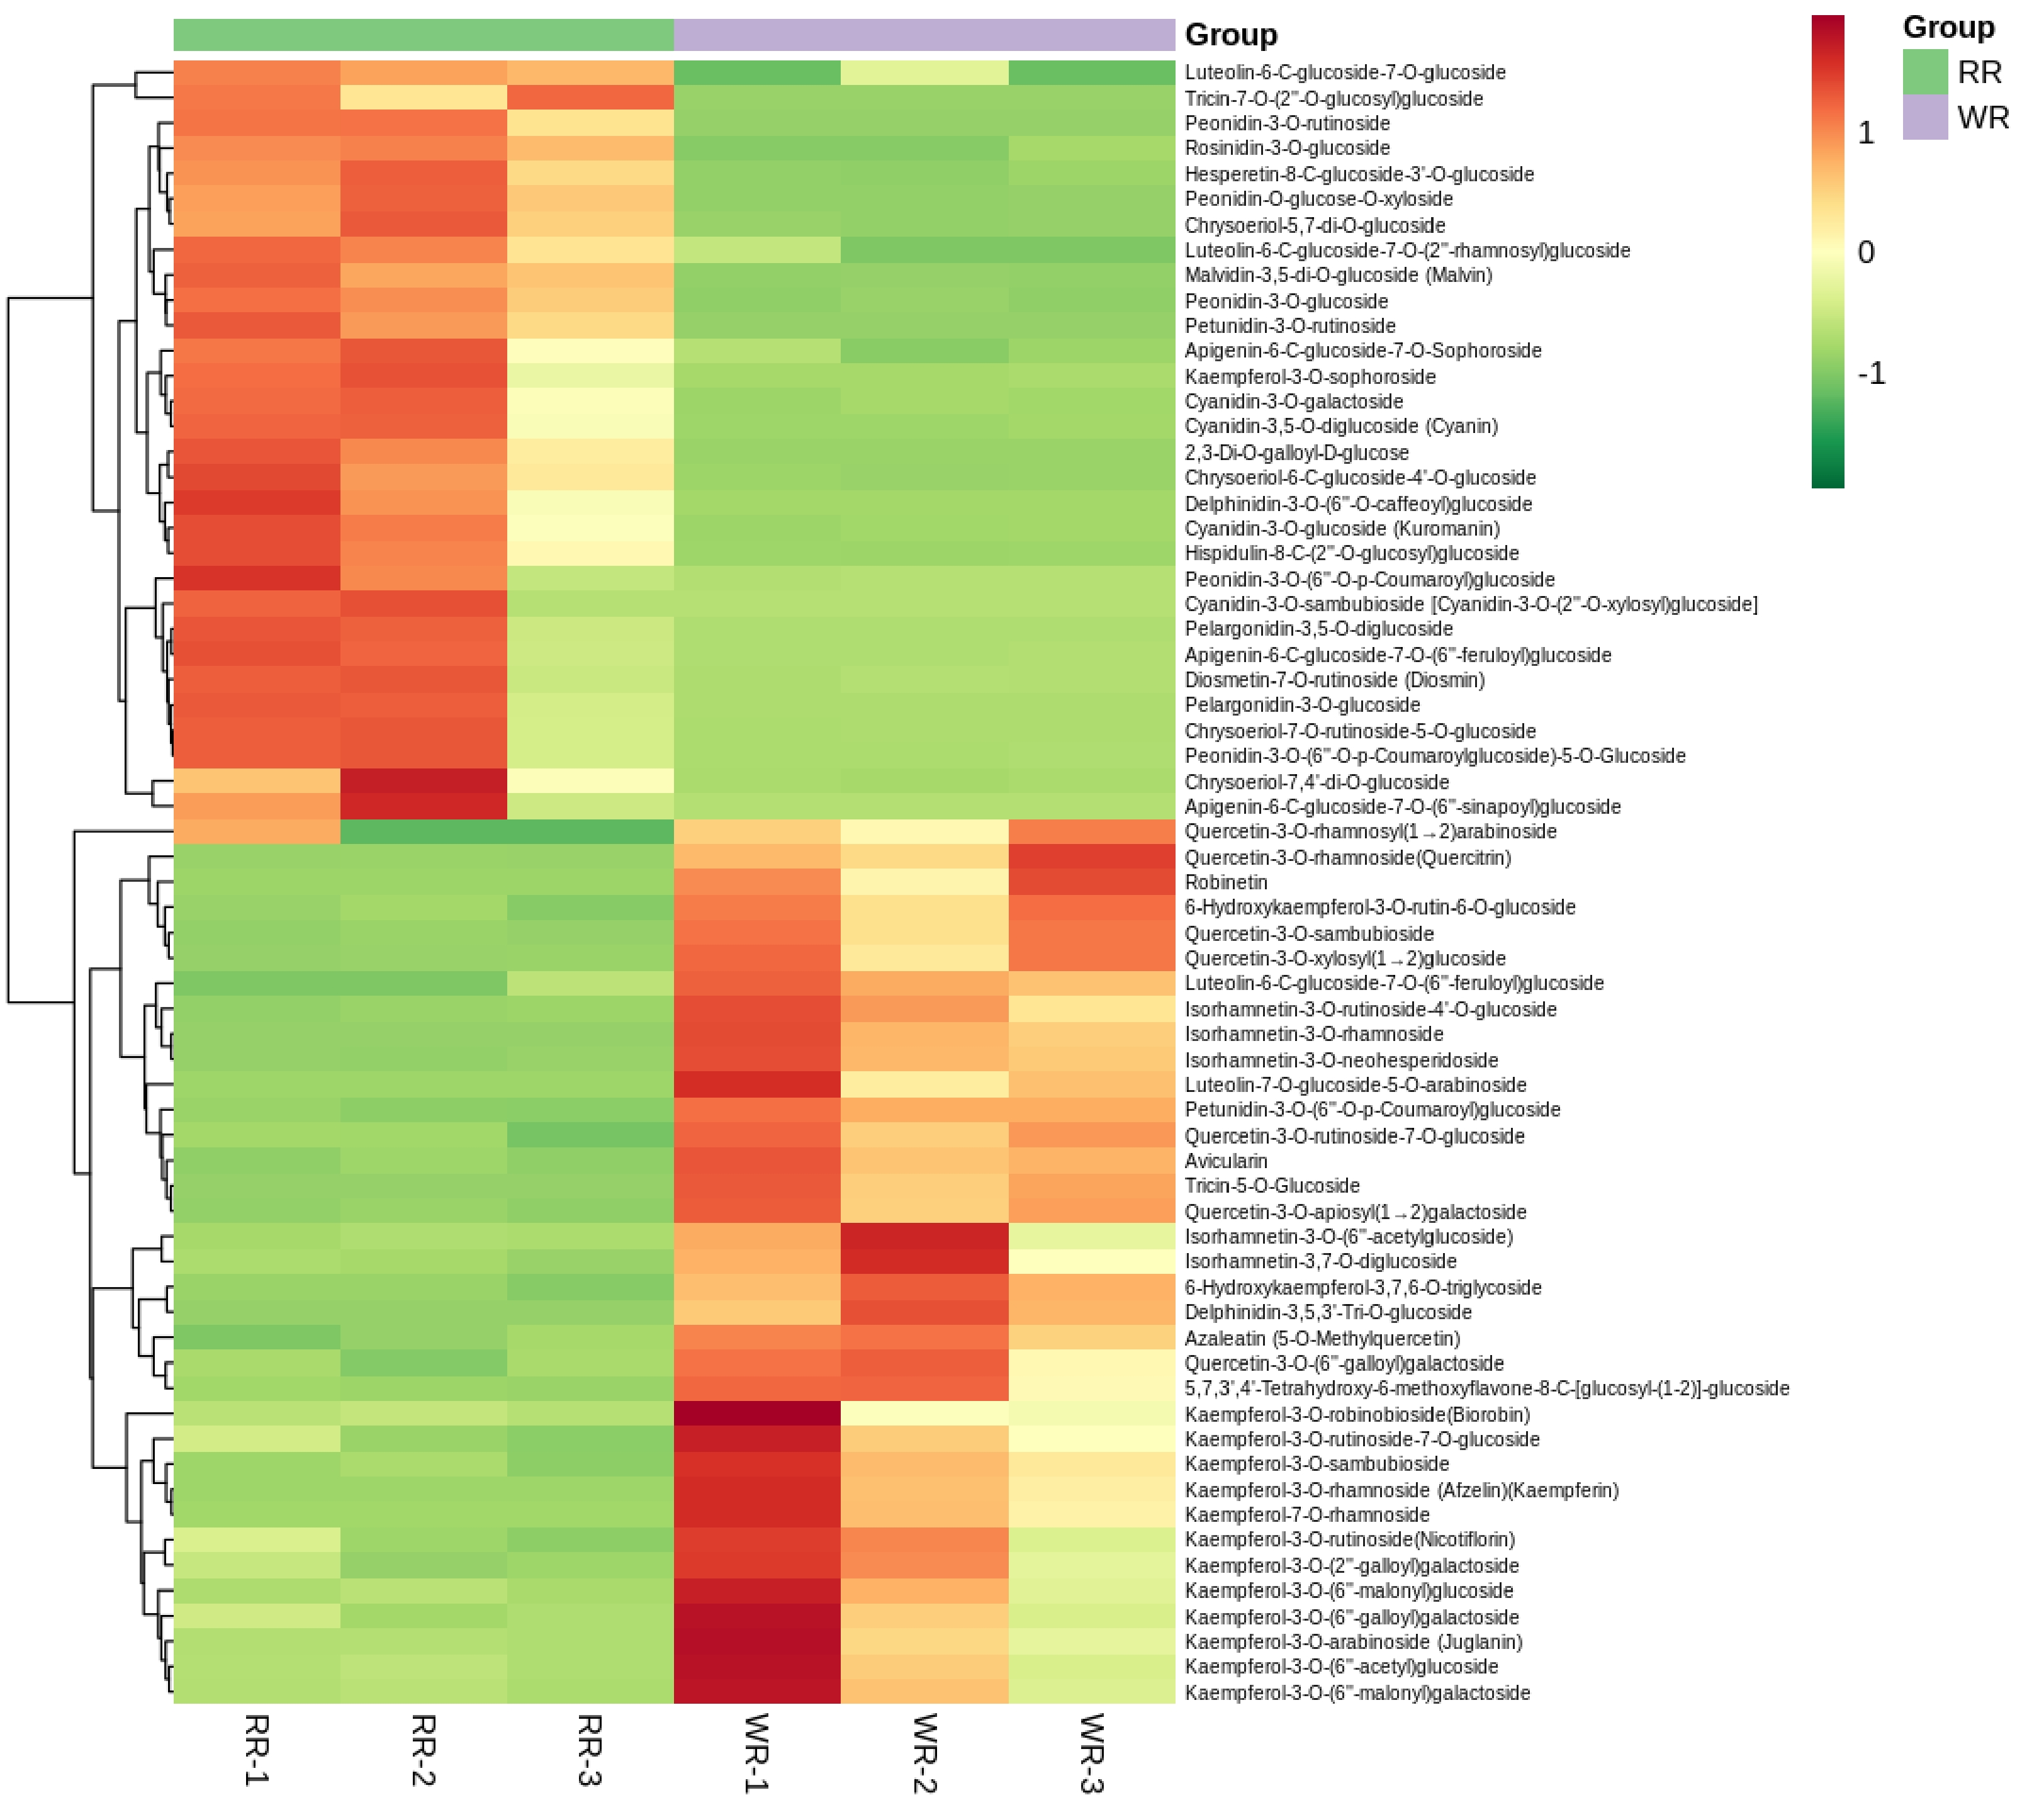
Figure 3. Clustering heatmap of 65 identified differential flavonoid-targeted metabolites of petals in RR and WR by the content data, normalized using the maximum difference normalization method. The abscissa means 3 replicates of petals in RR and WR, and the ordinate indicates flavonoid metabolites detected. The relative high content of metabolites is represented in red, while that of the lower content metabolites ar green. The metabolites abundance is represented by bars of specific color. The color of the bar changed from green to red with the increase in abundance value, as shown in the bar on the upper right.
-
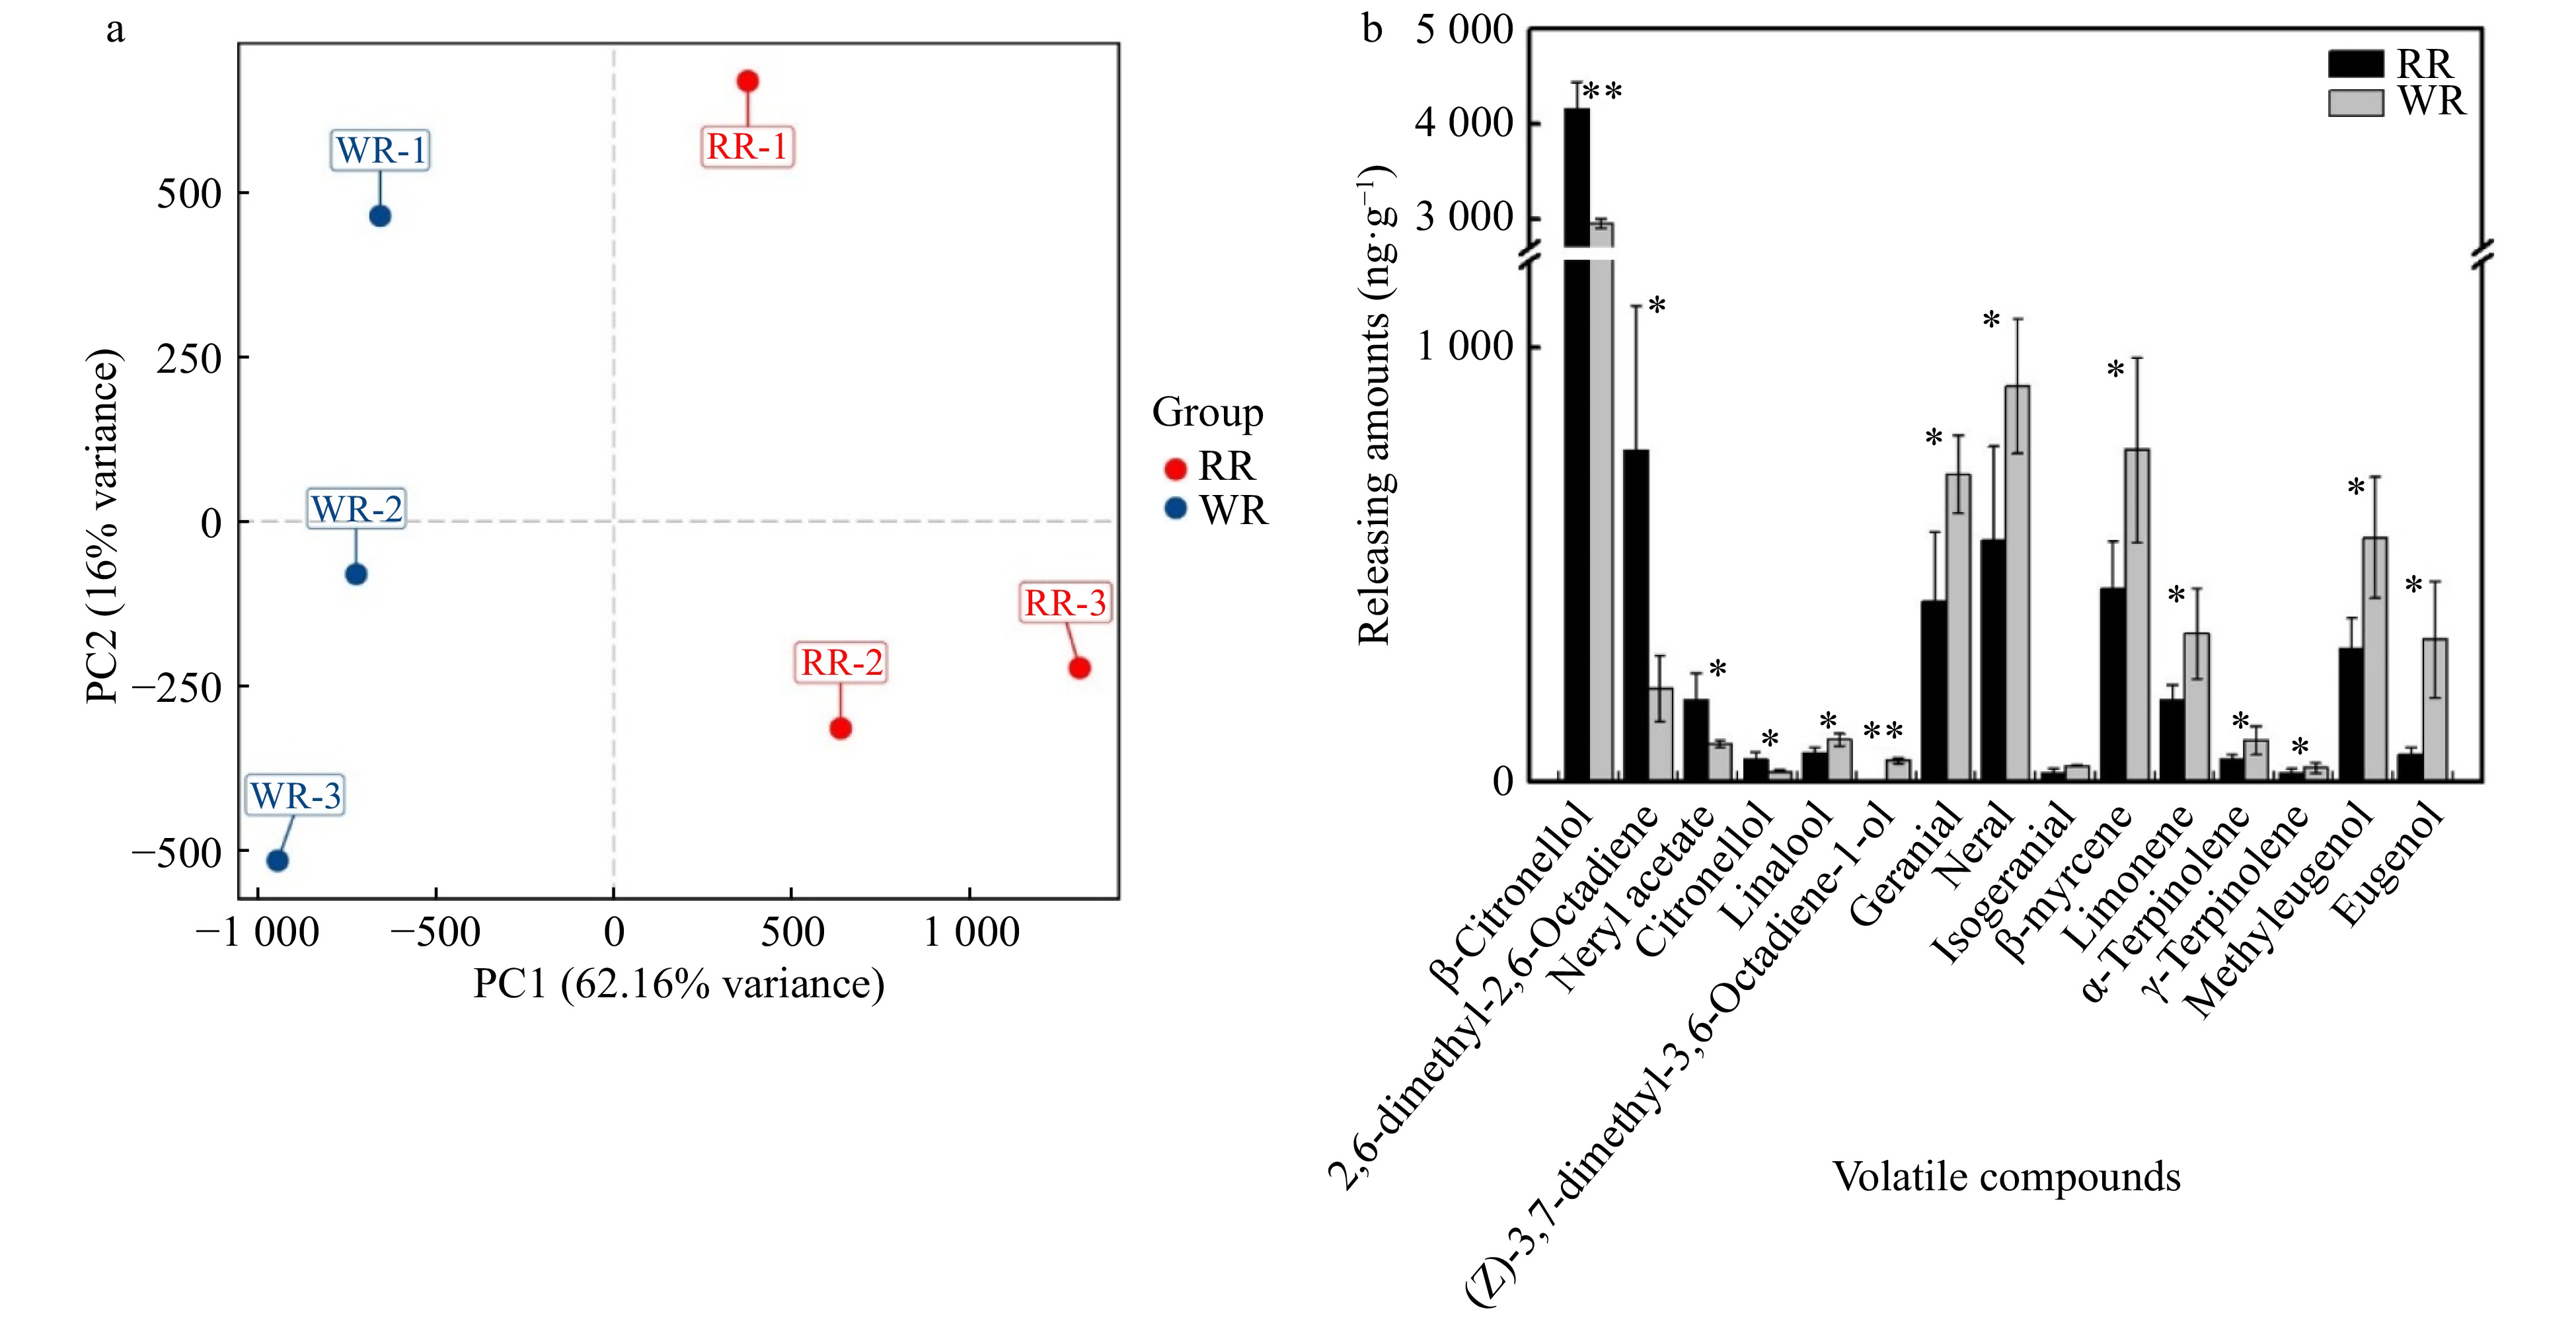
Figure 4. Principal component and comparison of different production amounts of volatile compounds between the two varieties (WR and RR). (a) Principal component analysis score diagram for mass spectrum data of volatile compounds. The X-axis represents the first principal component (PC1), and the Y-axis represents the second principal component (PC2). (b) Comparison of different production amounts of volatile compounds between the two varieties. The abscissa represents the volatile compounds, and the ordinate represents the production amounts of volatile. The error bars are represented by standard deviations of three replicates. Significant difference between the two varieties was calculated using the Student’s t-test based on the raw data of production amounts of volatile compounds; **P < 0.01; *P < 0.05, n = 3. The black bars show volatiles in RR, and the gray bars show volatiles in WR.
-
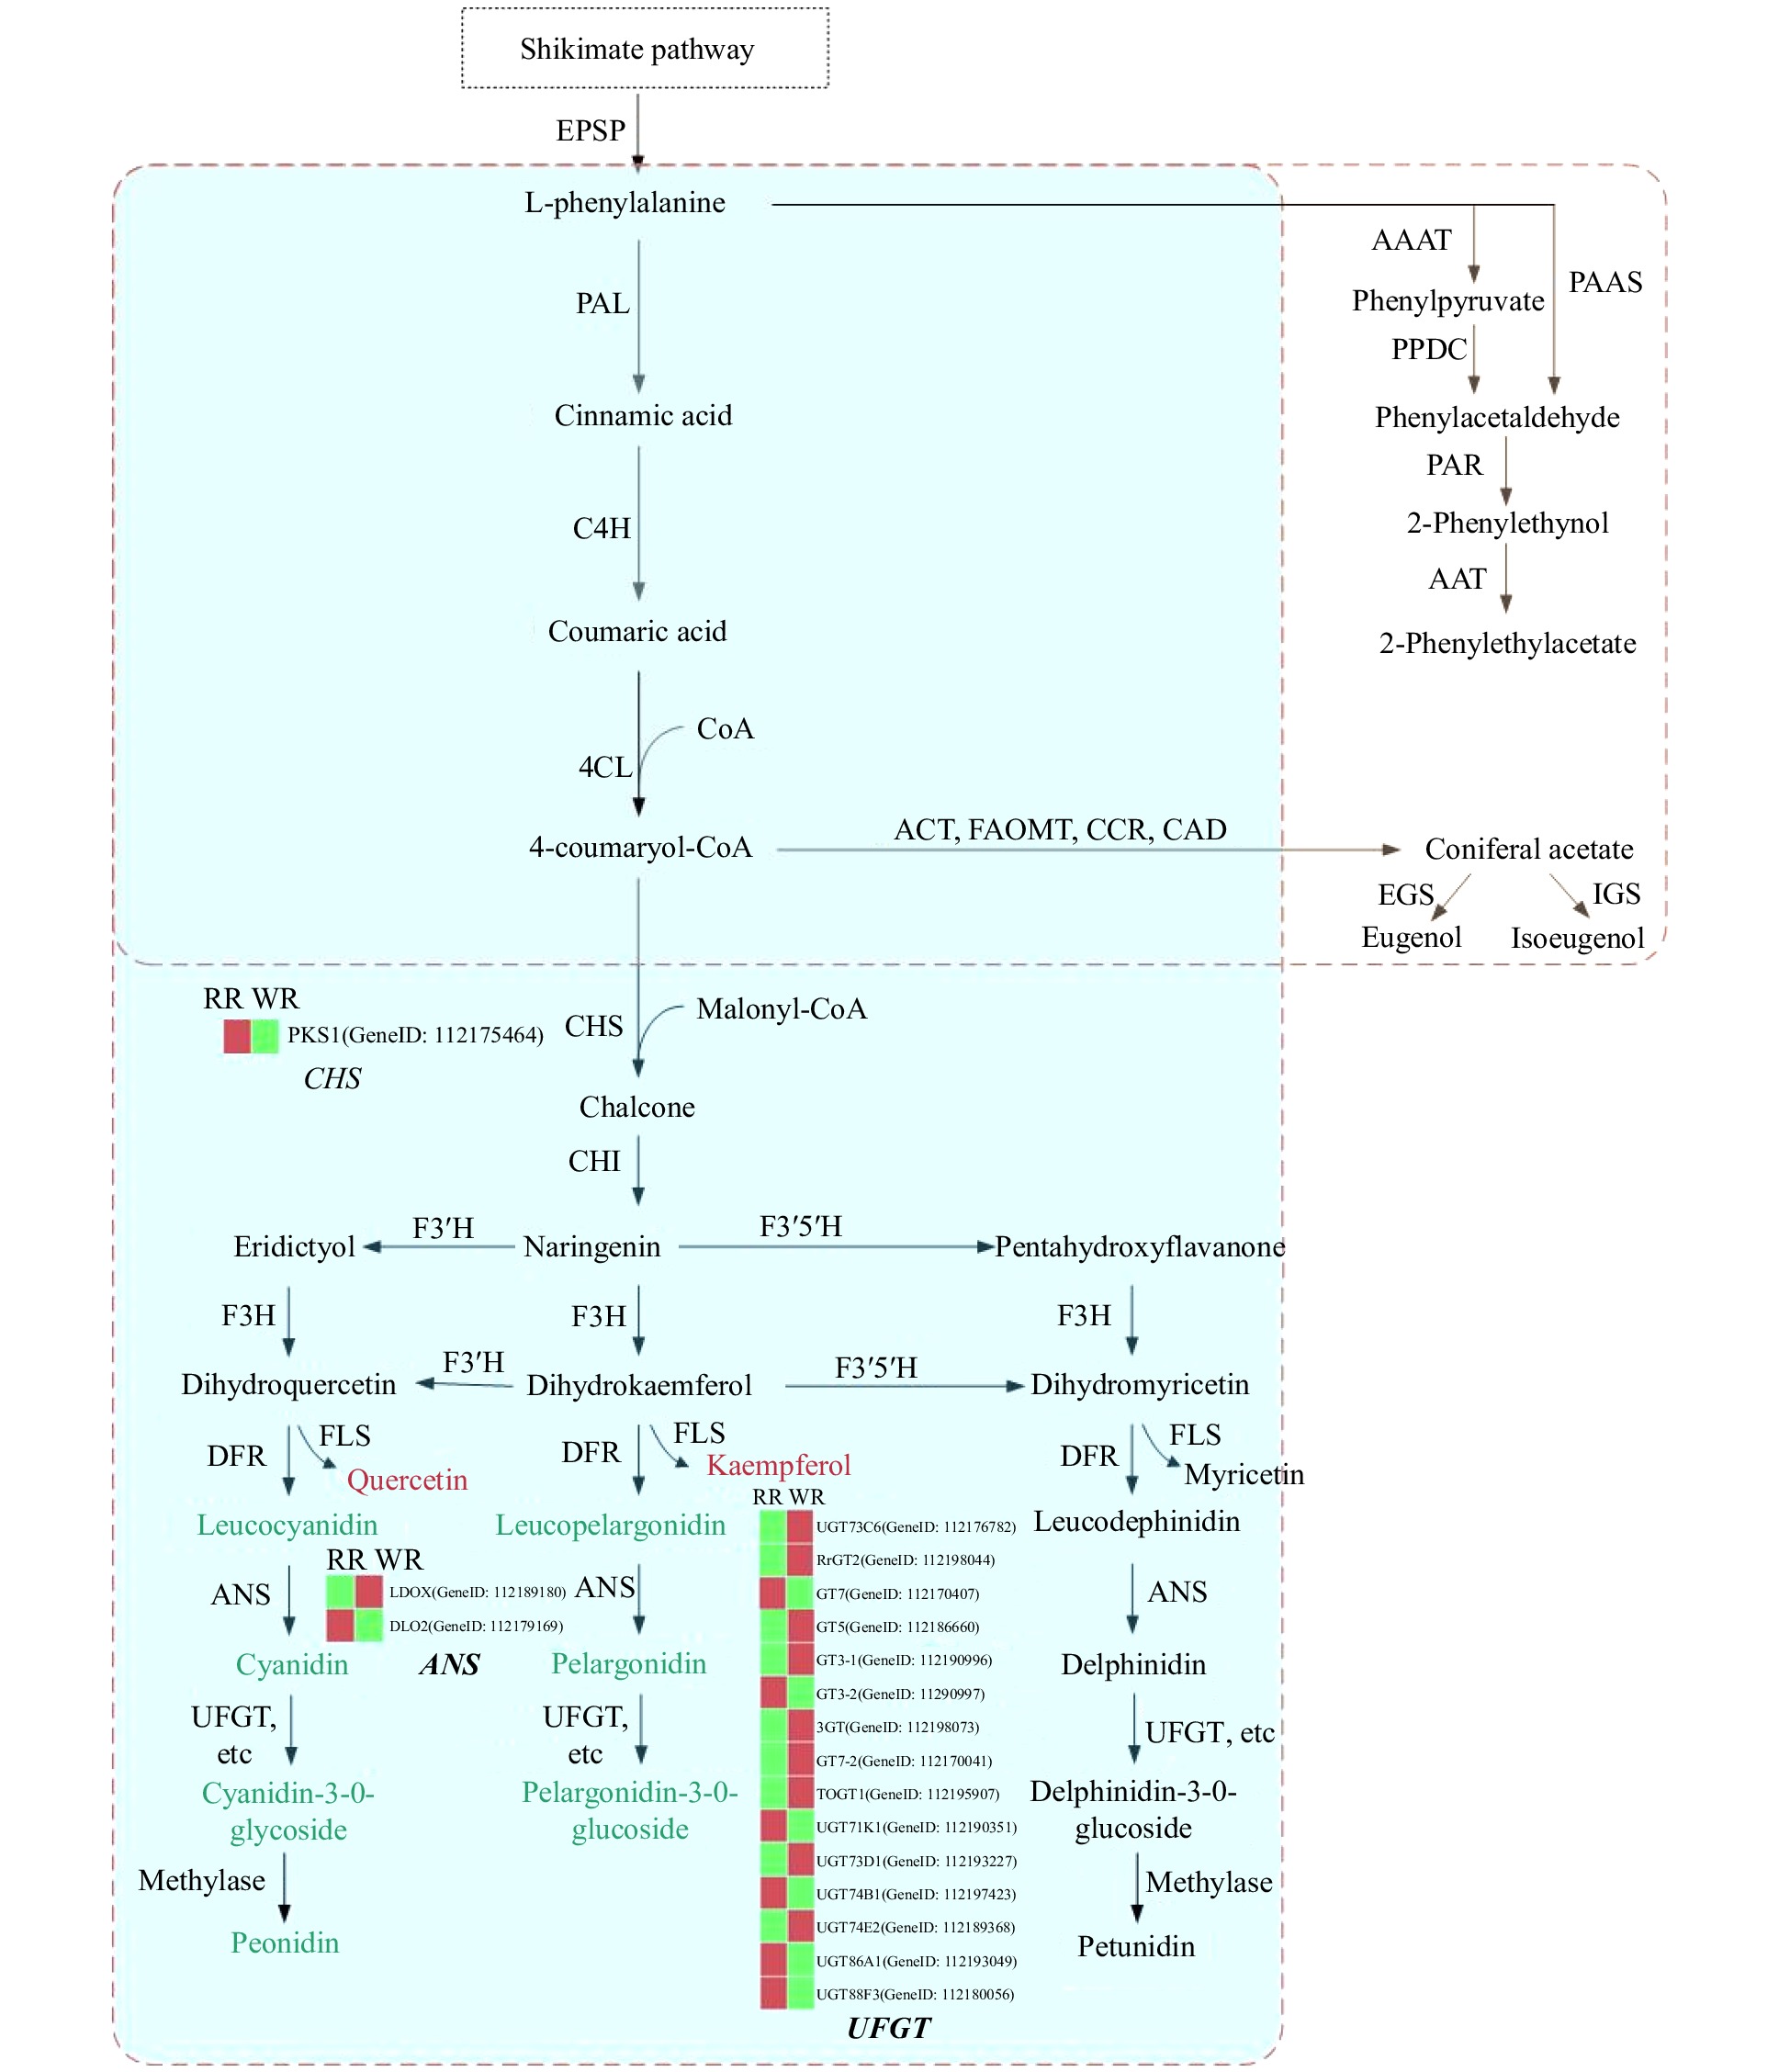
Figure 5. Schematic representation of the pathways leading to the production of anthocyanins and some benzenoids/phenylpropanoids determining color and scent profiles in rose flowers. Biosynthesis pathways are boxed with a dotted line. The box with the blue background represents the flavonoid biosynthesis pathway, and the box with the light yellow background indicates the benzenoid/phenylpropanoid biosynthesis pathway. In the flavonoid biosynthesis pathway, metabolites in a red font indicate significantly higher content in WR, and those in a green font indicate remarkably lower content in WR. The red and green bars in the heatmap represent higher and lower expression levels of related genes, respectively. EPSP: 5-enolpyruvylshikimate 3-phosphate; PAL: phenylalanine ammonia lyase; C4H: cinnamic acid-4- hydroxylase; 4CL: 4-coumarate-CoA ligase; CHS: chalcone synthase; CHI, chalcone isomerase; F3′H, flavonoid 3′-hydroxylase; F3′5′H, flavonoid 3′5′-hydroxylase; F3H, flavanone 3-hydroxylase; DFR, dihydroflavonol 4-reductase; FLS, flavonol synthase; ANS, anthocyanidin synthase; UFGT, anthocyanidin 3-O-glucosyltransferase; ACT: cetyltransferase; FAOMT: methyltransferase; CCR: cinnamoyl-CoA reductase; CAD: cinnamyl alcohol dehydrogenase; EGS: eugenol synthase; IGS: isoeugenol synthase; AAAT: aromatic amino acid aminotransferase; PPDC: phenylpyruvate decarboxylase; PAAS: phenylacetaldehyde synthase; PAR: phenylacetaldehyde reductase; AAT: geraniol/citronellol acetyl transferase.
-
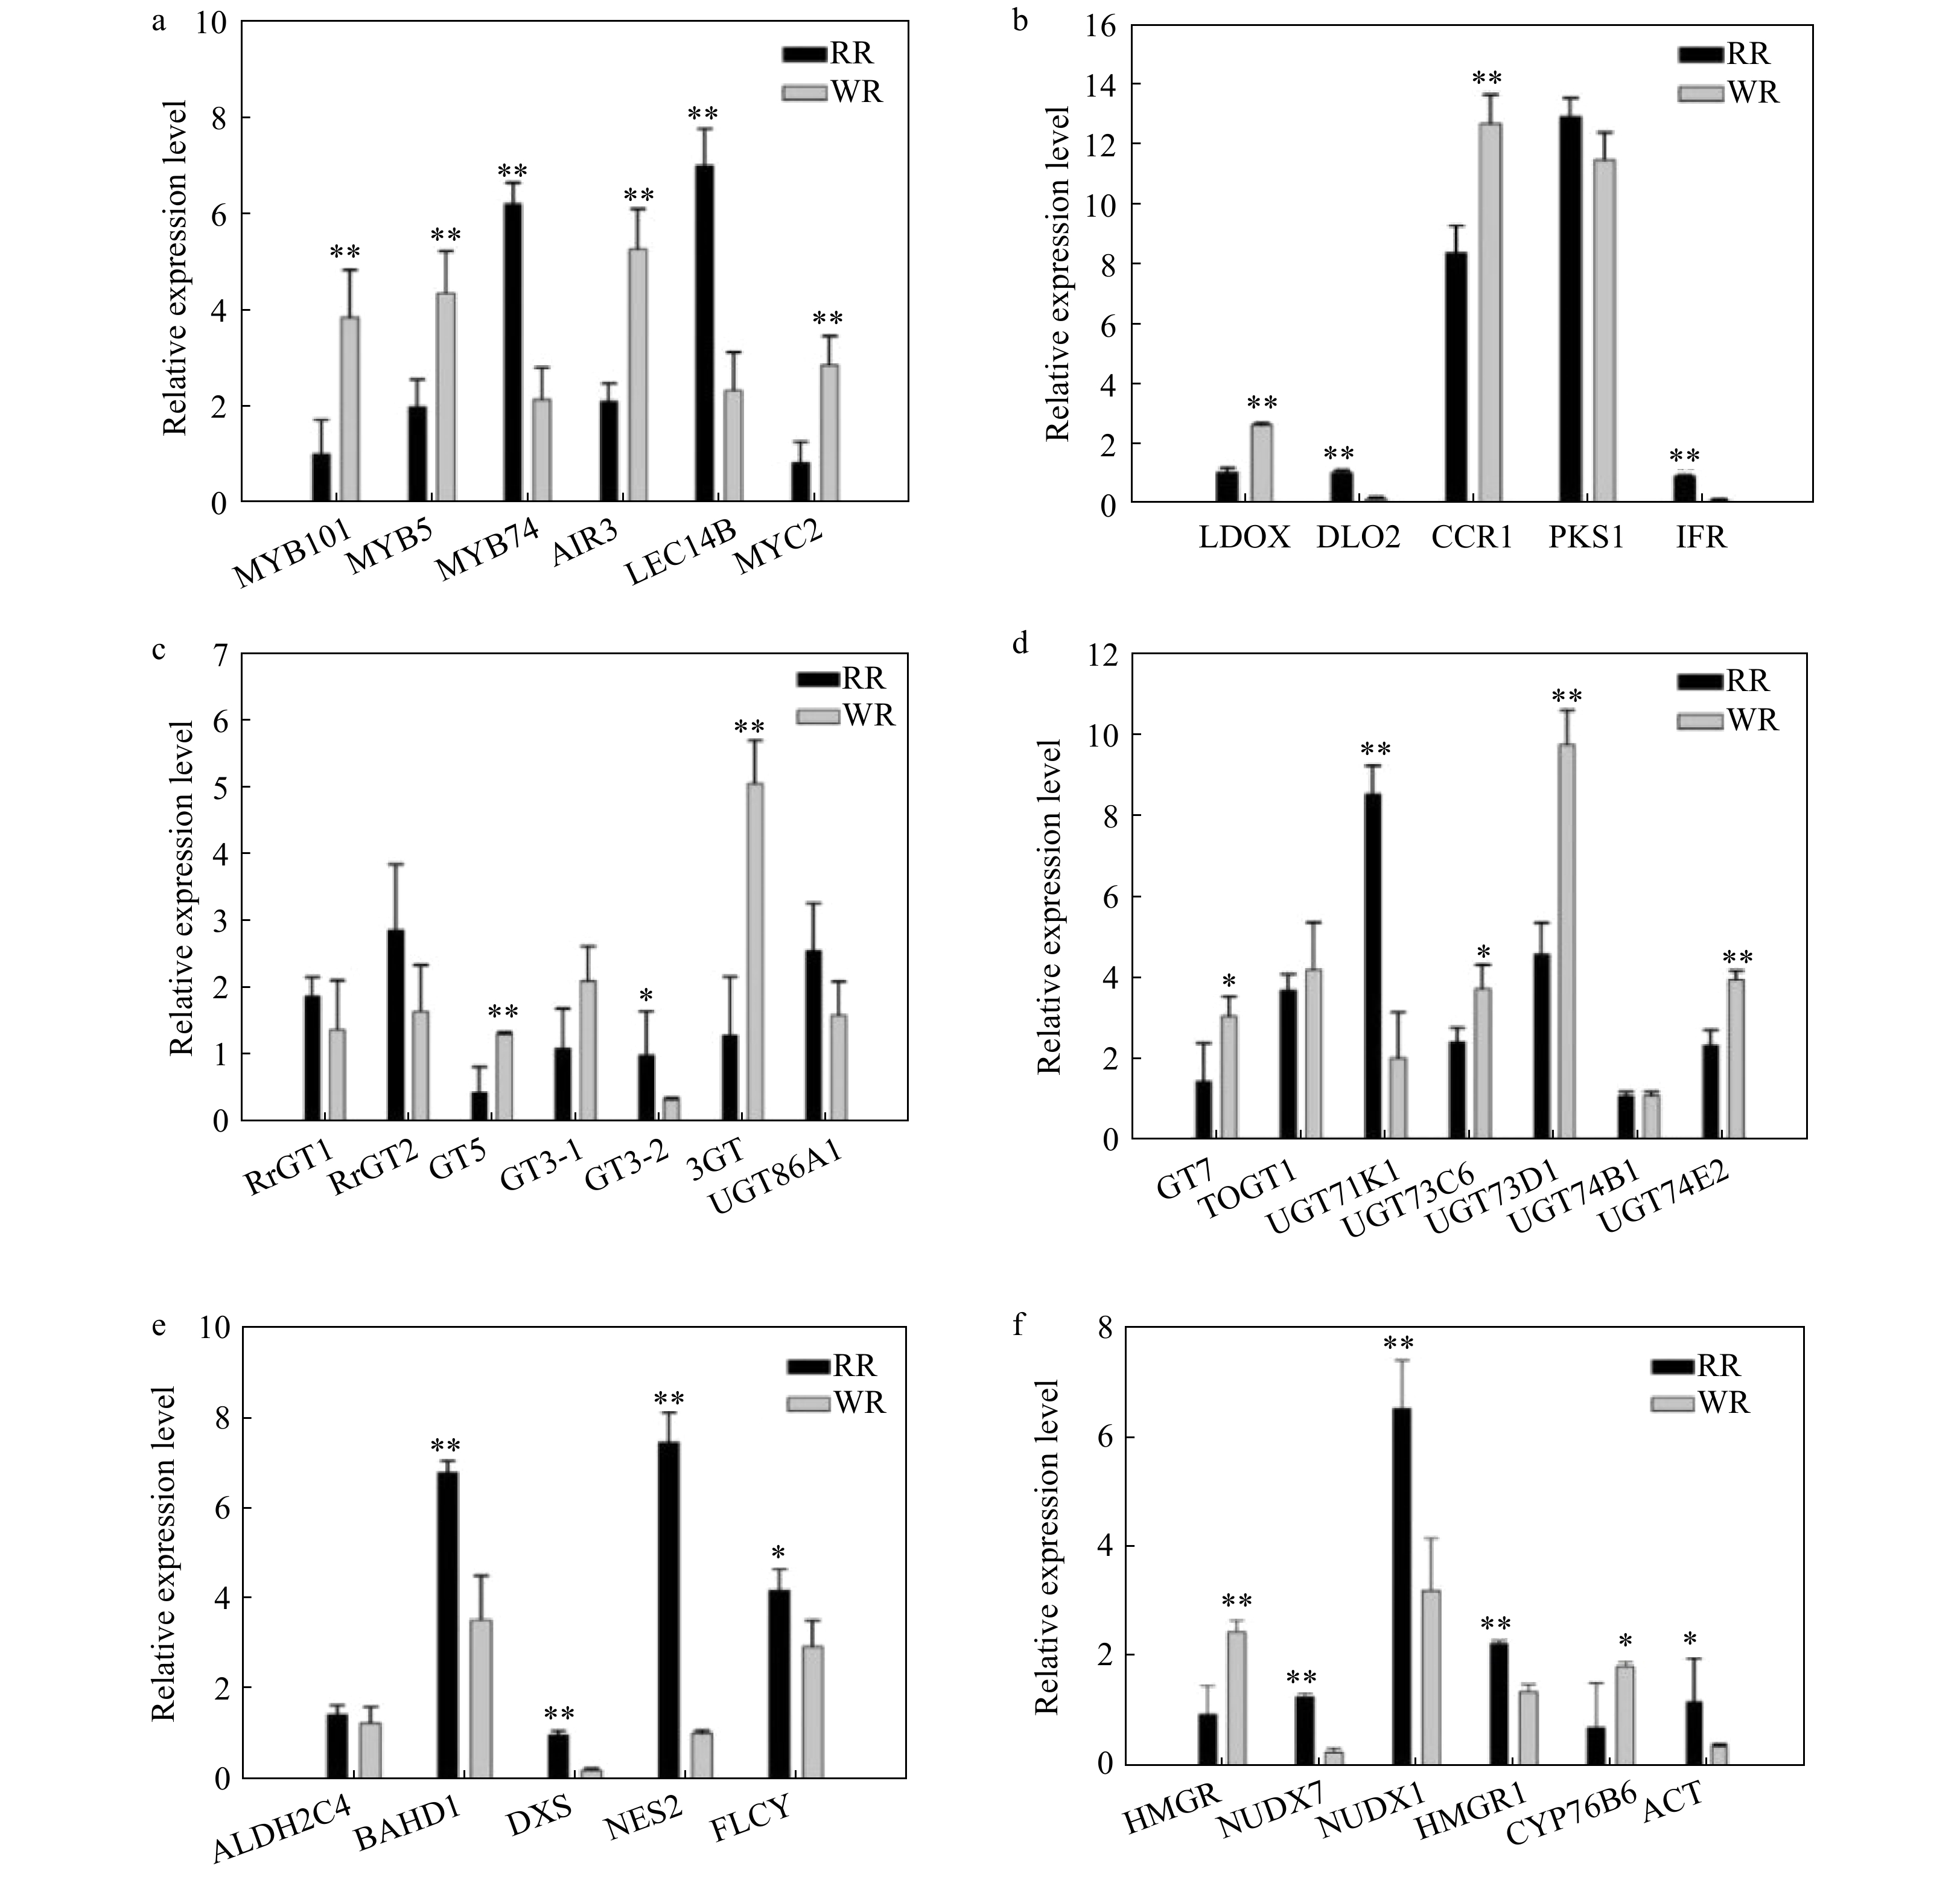
Figure 6. Comparison of relative expression of some differential genes involved in flavonoid, phenylpropanoid and terpenoid biosynthesis pathways in RR and WR. RhGAPDH was used as the normalized standard. The relative expression level was calculated using the 2−ΔΔCT method. The error bars are represented by standard deviations of three replicates. Significant difference between the two varieties was calculated using Student’s t-test based on the raw data of expression levels of genes; **P < 0.01; *P < 0.05, n = 3. The black bars show volatiles in RR, and the gray bars show volatiles in WR.
-
Gene family and classification Up-regulated Down-regulated TF MYB MYB52, MYB101, MYB5, MYB44, MYB61, LIMYB PAP1, MYB74, MYB105, MYB78, KUA1, MYBL TF bHLH bHLH10, bHLH66, MYC2-like, bHLH79, bHLH25, bHLH − WD40 AIR3, KIN13B Wdr3, HOS15, LEC14B, ATG18B, Ercc8 Flavonoid FAOMT HIDM, CXE1, ACT, BAHD1 Anthocyanin LDOX PKS1, LDO2 anthocyanin modification RhGT1, GT3, GT5, UGT75L6, UGT73C6, UGT73D1, UGT74E2 3GT, GT7, UGT71K1, UGT71A16, UGT74B1, UGT88F3, UGT86A1 Phenylpropanoid HST, 4CLL7, FAOMT, GT5 CCR1, TKPR1, BAHD1, ACT, CAD, ALDH2C4, NES1, IGS Terpenoid HMGR, CYP76B6 ACT, NUDX1, NUDX7,
HMG1, DXS, SPS2, CYP76B10, NES2Table 1. Genes showing up- or down-regulated expression levels in WR compared with RR.
Figures
(6)
Tables
(1)