


-
Rosa rugosa, an important ornamental plant in Rosaceae, is widely used in landscaping, cosmetics, food and the medical industry, due to its unique fragrance, color and tolerance to environmental stresses[1,2]. Flower color is an important trait for plants to attract pollinators, which benefit for completing sexual-hybridization. In nature, the petals of most varieties of R. rugosa are pink and purple, only a few are white or other color[3]. The major primary compounds that influence flower colors are flavonoids, which could lead to anthocyanin accumulation and in turn contributing to flower color[4,5]. The flavonoid biosynthetic pathway finally leads to three types of anthocyanin metabolites: cyanidin, pelargonidin, and delphinidin, and these became stabilised via methylation, hydroxylation, acylation and glycosylation[6,7]. Many regulatory genes and structural genes (especially genes encoding key synthases) that participate in anthocyanin biosynthetic pathways have been identified in plants[8−12]. In rose, an anthocyanin synthase gene, F3’5’H, was expressed in a transgenic plants resulting in blue flowers[13]. RrFLS, RrDFR and RrF3’H were reported to be the key genes controlling petal color in three novel-colored R. rugosa cultivars[14]. Overexpression of RrMYB5 and RrMYB10 might promote the production of proanthocyanidins in R. rugosa and tobacco[15]. Furthermore, it was proposed that disequilibrium expression of flavonol synthase (FLS, the key synthase in producing flavonols) and Dihydroflavonol-4-Reductase (DFR, the key enzyme in accumulating anthocyanins) genes share the same substrates and leads to different colors[16]. For the modification genes, RrGT2 and RrGT1 play important roles in anthocyanin accumulation[2,3].
Flower scent is another important trait in ornamental plants, which is not only critical for pleasant fragrance, but also can defend against fungi and bacteria due to the volatile compounds involved in scent production[17,18]. According to the biosynthetic origin, the volatile metabolites were classified into three classes: terpenoids, benzenoids/phenylpropanoids and fatty acid derivatives[19]. Some structural genes, especially genes encoding key enzymes involved in the volatile compound biosynthetic pathways, have also been reported[20−26]. For regulatory genes, RhMYB1 has been shown to be a regulatory gene involved in the biosynthesis of volatiles in roses, and MYB21 and MYC2 has been indicated to regulate the function of activating the expression of linalool synthase genes (TPS), and enhanced linalool biosynthesis in Freesia hybrida and Arabidopsis thaliana[27,28]. As a key enzyme in the terpenoid biosynthetic pathway, geraniol/citronellol Acetyltransferase was shown to promote the formation of volatile esters from geraniol/citronellol in rose[29]. Moreover, the aromatic amino acid aminotransferase and phenylacetaldehyde synthase, encoded by AAAT and PAAS genes respectively, were reported to play important roles in the biosynthesis of 2-phenylethanol[30,31]. Yan et al.[32] identified the function of a key synthase gene involved in the phenylpropanoid biosynthetic pathway, eugenol synthase gene (RcEGS1), which was responsible for eugenol biosynthesis in roses.
Biosynthesis of anthocyanins and benzenoids/phenylpropanoids volatile metabolites, competing the common substrate: L-phenylalanine, was completed via different metabolic flows by various enzymes[33]. Previous studies on the function of PAP1, PH4, F3H and PhCCoAOMT showed the relationship of biosynthesis of anthocyanin and benzenoids/phenylpropanoid volatiles, and the relationships lead to different combinations of colors and fragrance of flowers[34−37]. In this study, we analyzed the flavonoid metabolites and volatile compounds in R. rugosa Thunb. f. rosea Rehd with red petals and its white petal variant by comparative transcriptomic and metabonomic processes, and revealed some genes that are closely associated with both scent and color biosynthesis in Rosa rugosa. Finally, two modification enzyme genes, ACT and GT5, were indicated to be the critical regulator in flower pigmentation and volatile compound biosynthesis. It provides a theoretical basis to the molecular mechanisms controlling the relationships between flower color and fragrance in Rosa rugosa.
-
Flavonoids, the complex metabolites including anthocyanins, determine flower colors in nature[38]. To gain insights into the changes of flower color and scent between RR and WR (Fig. 1), the UPLC-ESI-MS/MS system was used to determine flavonoid metabolites in stage 4 of R. rugosa. Firstly, the total ion current (TIC), the multi-peak map of MRM and the overlap display analysis of the TIC map indicates successful quality control (QC) (Fig. 2a, b). We then obtained 216 flavonoid-related metabolites, and by Venn diagram analysis, a total of 210 (RR) and 205 (WR) metabolites were detected, with 199 common metabolites. While six metabolites, (including five flavanone or flavonol and one anthocyanin) were not detected in RR red petals. Eleven metabolites (including six anthocyanins, four flavonoids and one Tannin were not detected in WR (Fig. 2c, Supplemental Table S1).
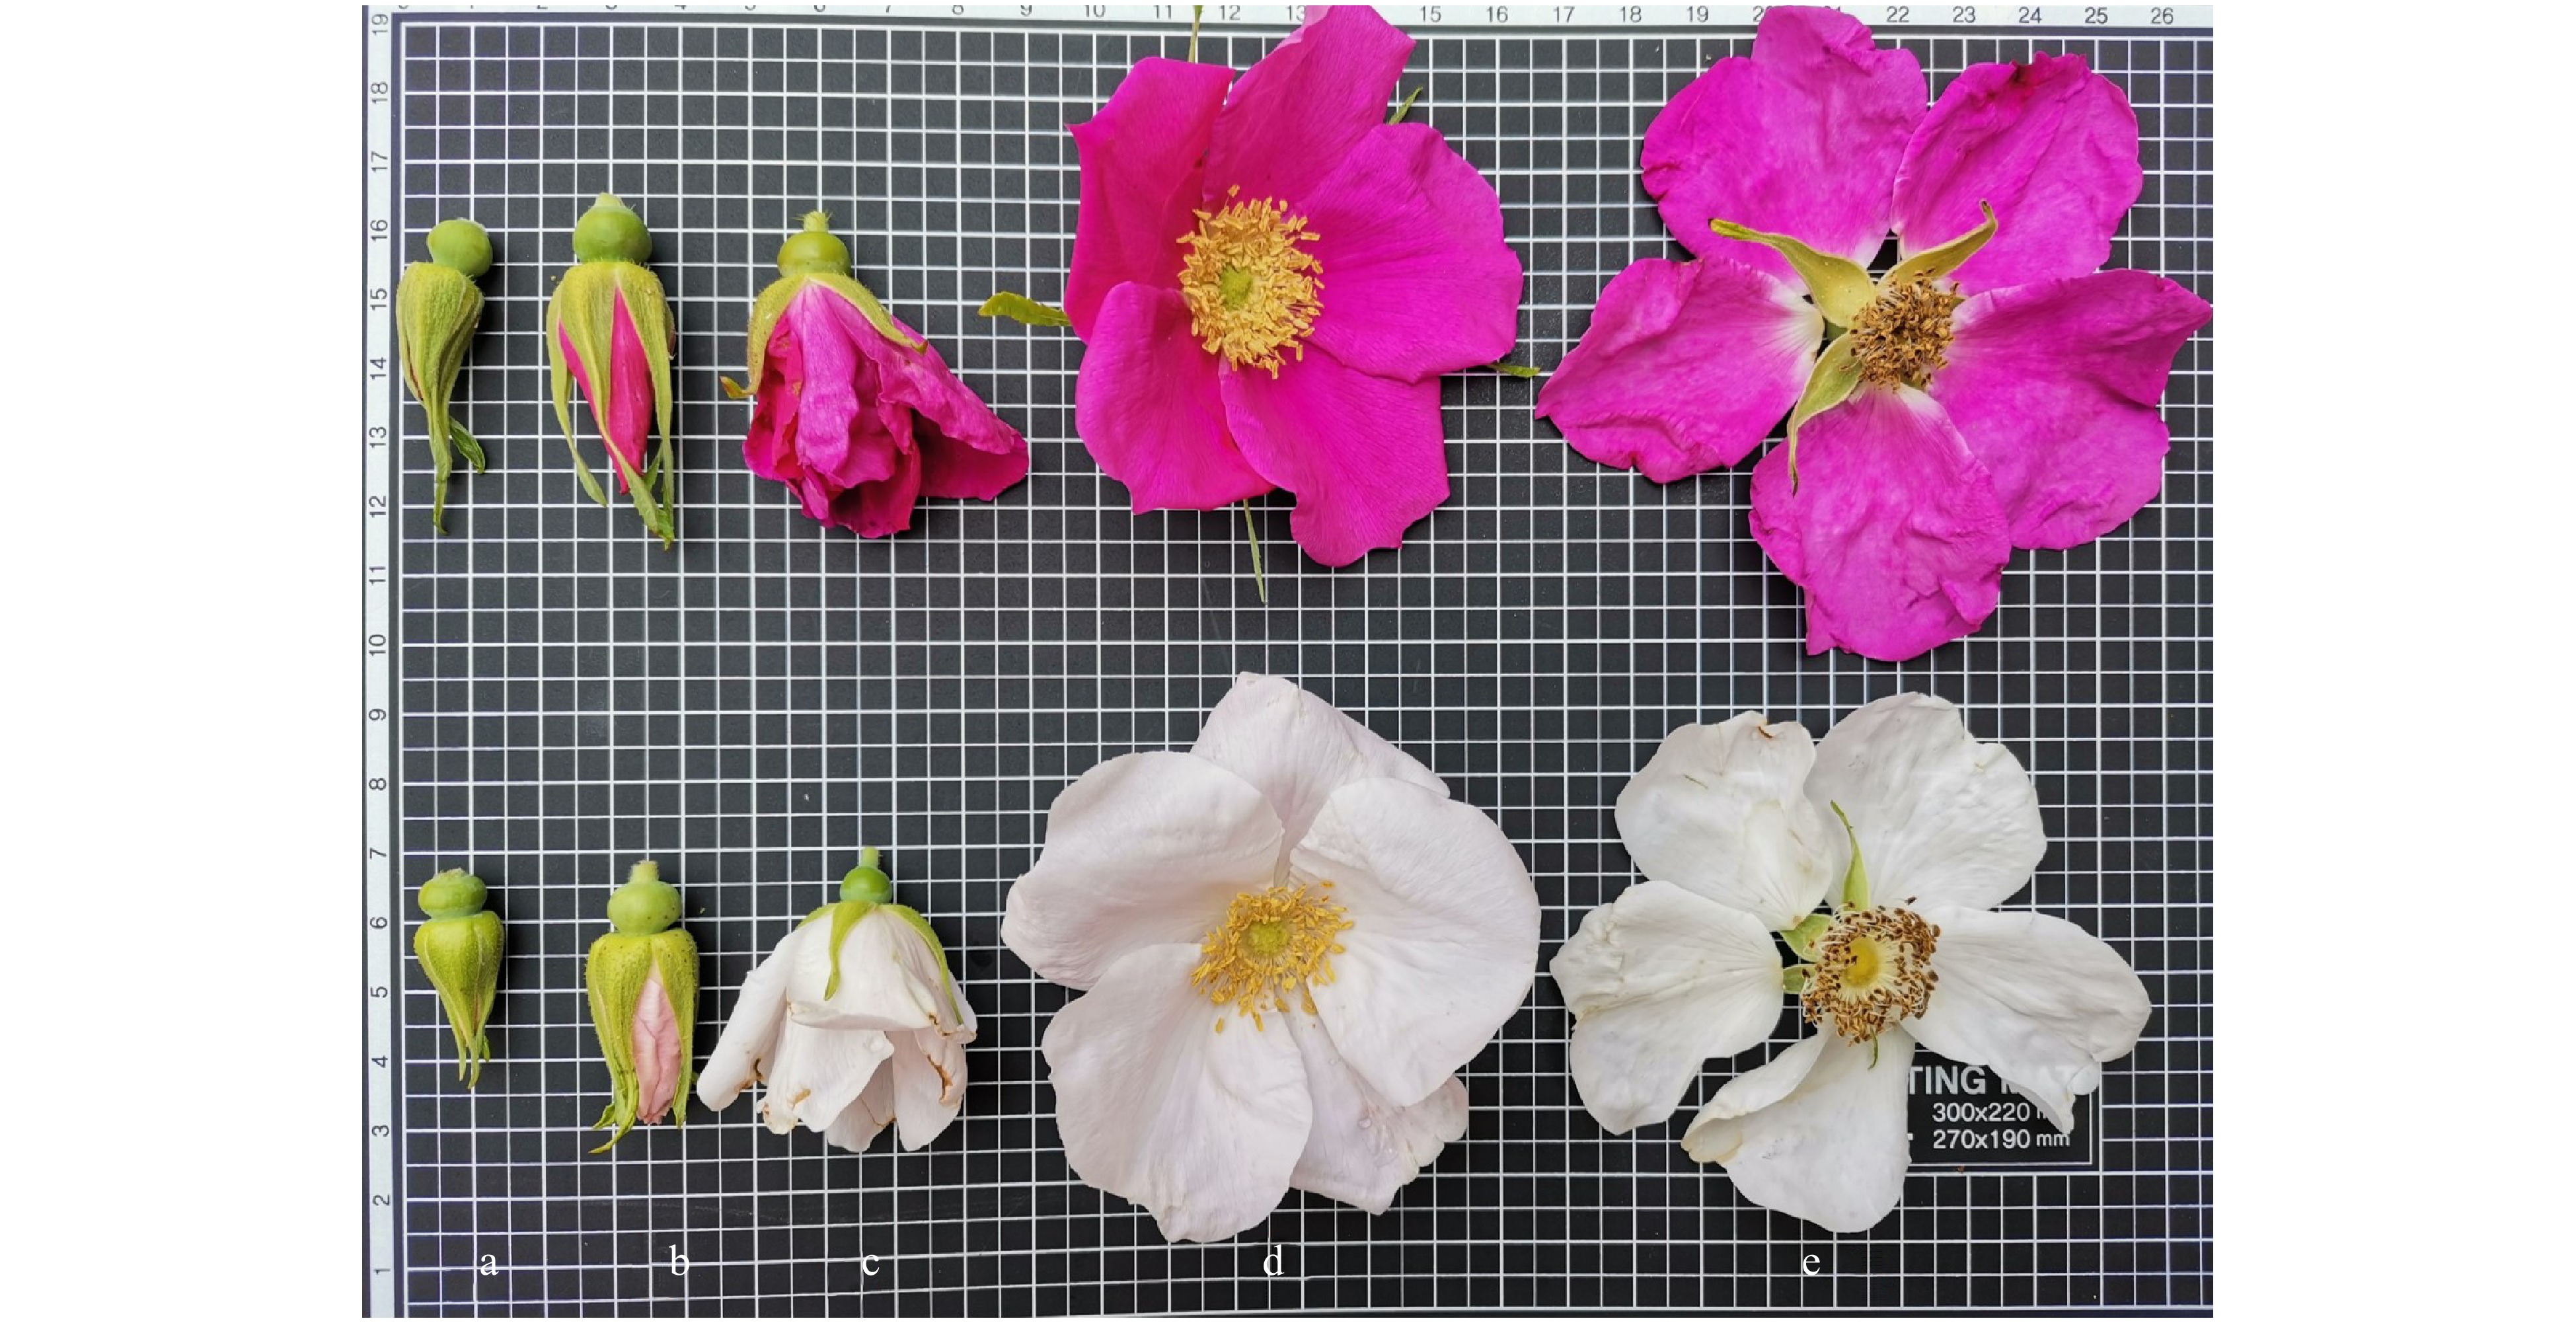
Figure 1. Five development stages of R. rugosa Thunb. f. rosea Rehd. (RR) and R. rugosa Thunb. f. alba (Ware)Rehd. (WR). (a) Stage 1, bud stage; (b) Stage 2, early flowering stage; (c) Stage 3, half-open stage; (d) Stage 4, blooming stage; (e) Stage 5, decline stage.
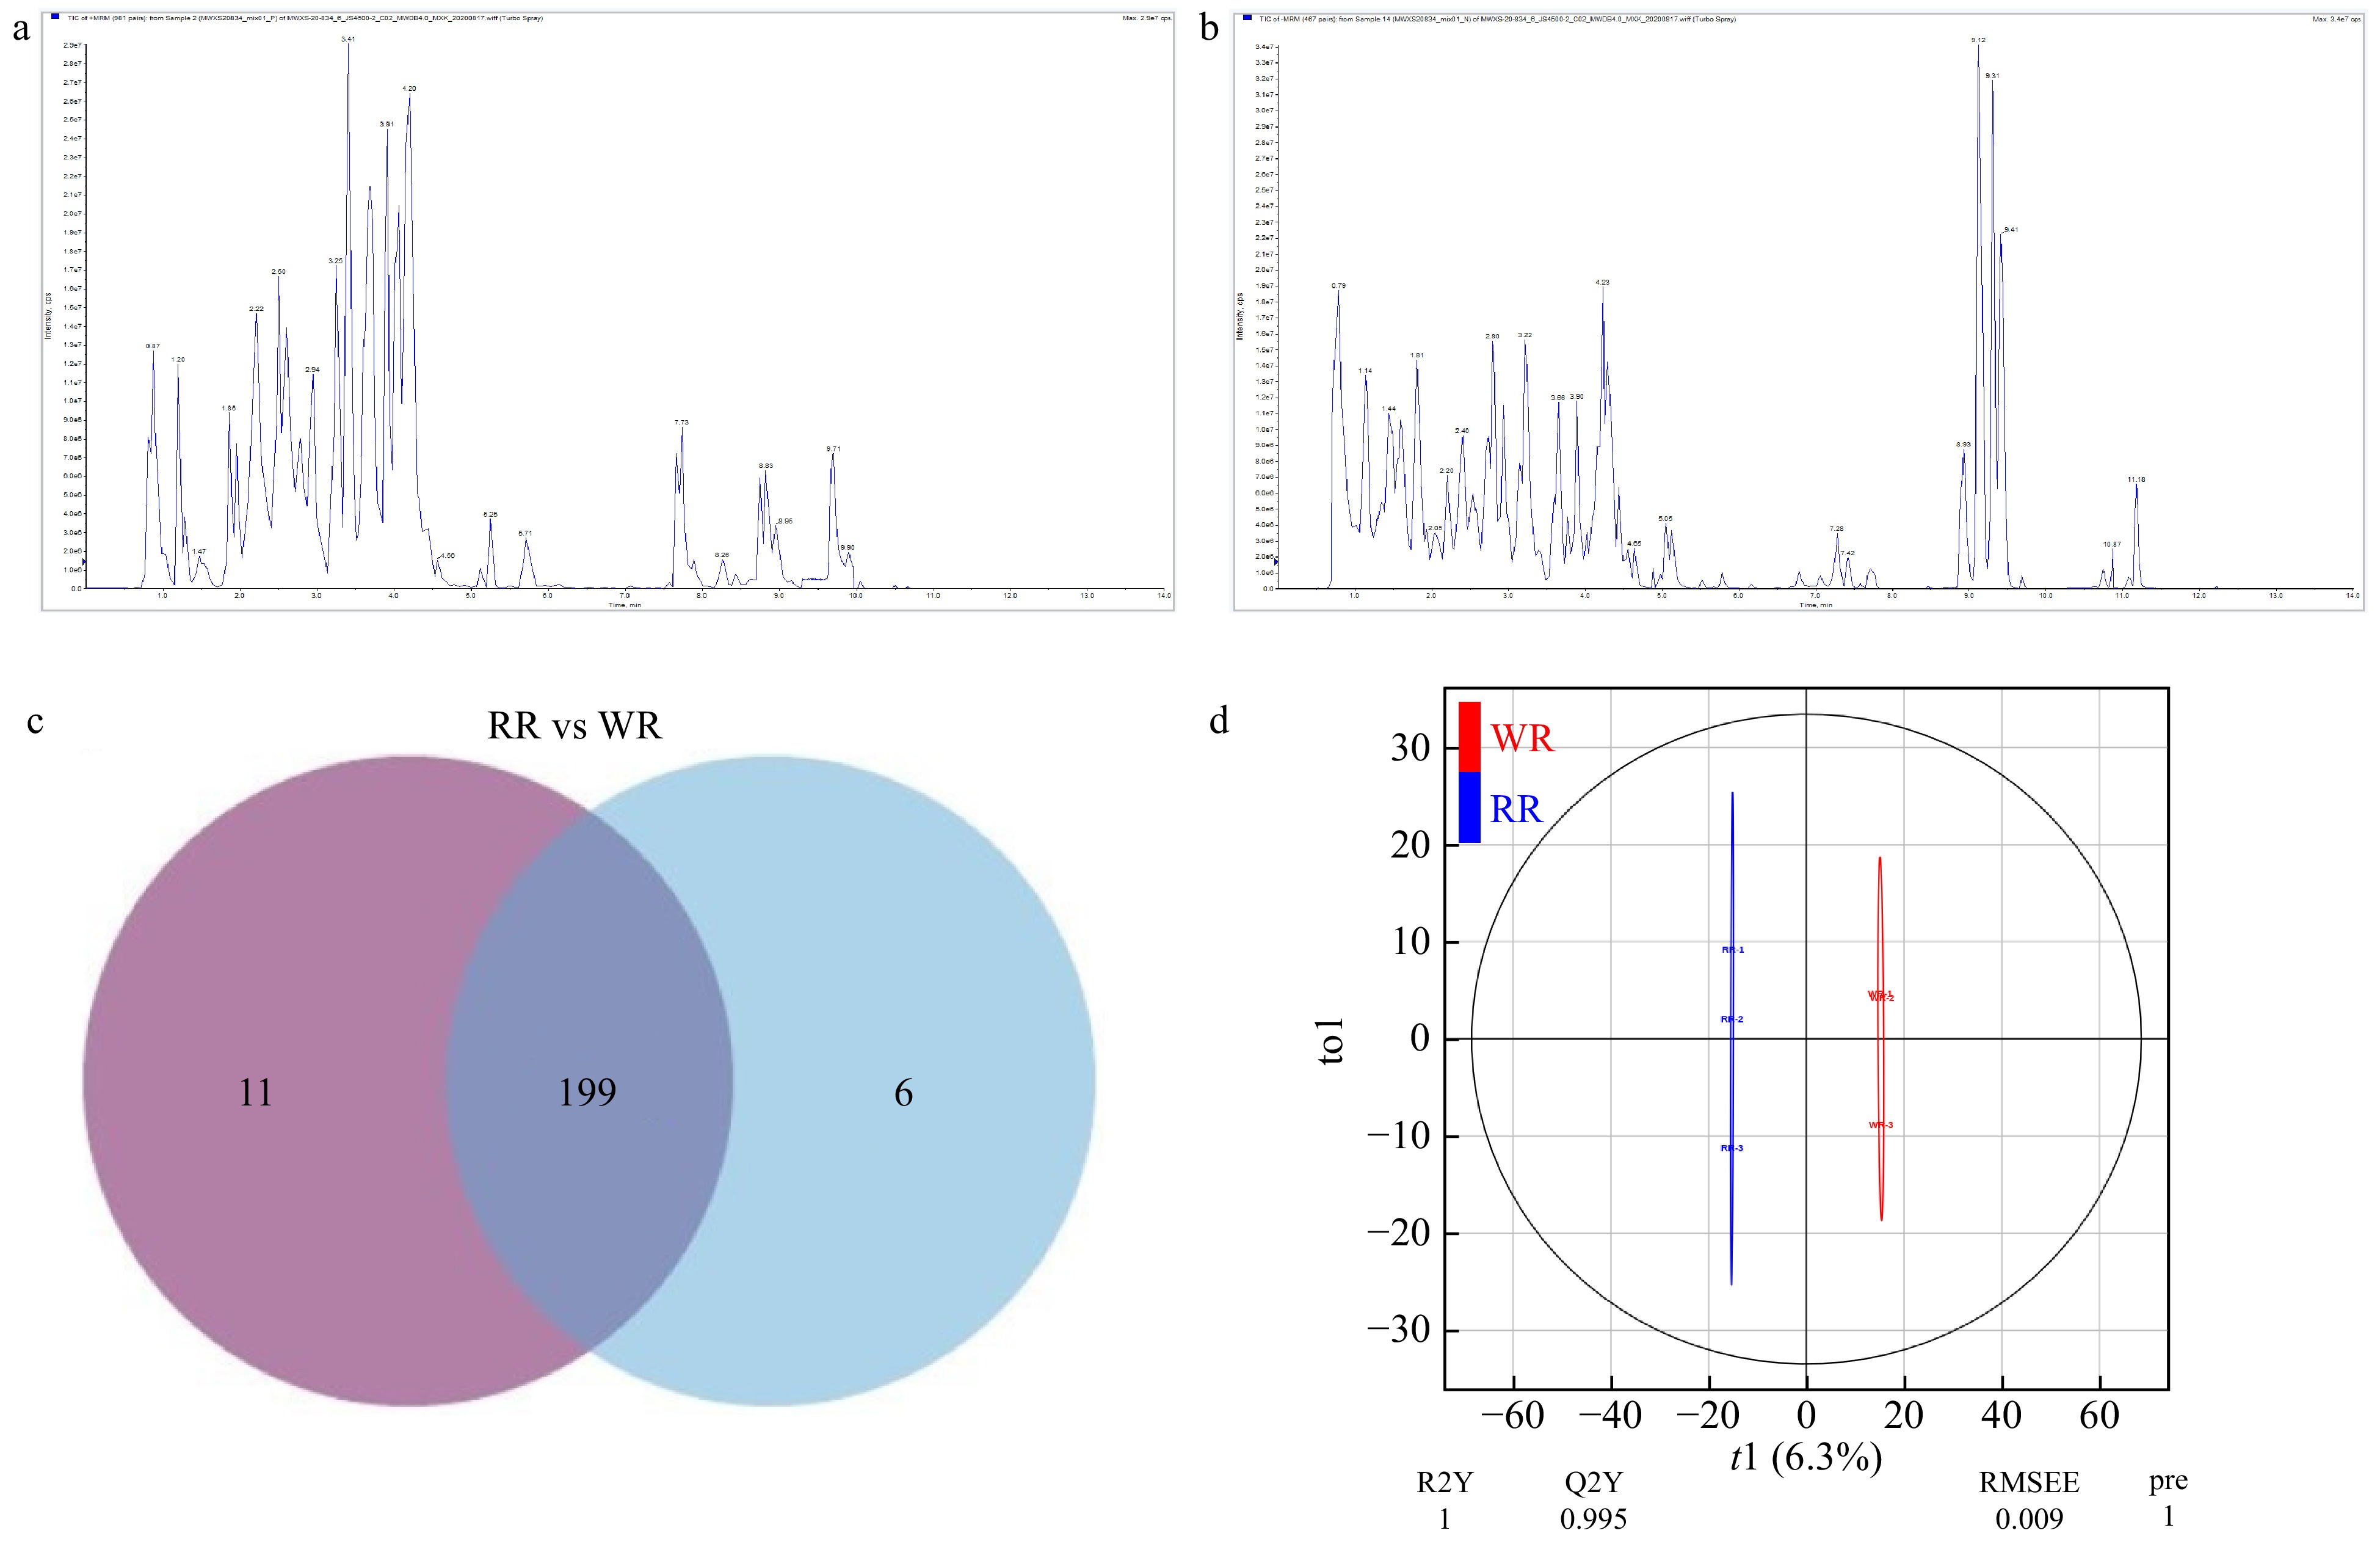
Figure 2. Component analysis of flavonoids of the petals. (a) QC_MS_TIC-P, total ions current of one quality control sample by mass spectrometry; (b) QC_MS_TIC-N, multi-peak detection plot of metabolites in the multiple reaction monitoring mode; (c) Venn diagram, the distribution of 216 flavonoids detected in WR and RR. (d) Score scatter plot of the orthogonal projections to latent structures-discriminant analysis (OPLS-DA) model.
Using Principal Component Analysis (PCA), the component content of flavonoids in WR was remarkably separated from that of RR, with the PC1 and PC2 showing variance of 47.81% and 22.45%, respectively (Supplemental Fig. S1). For more in-depth analysis, the model Orthogonal Projections to Latent Structures-Discrimination Analysis (OPLS-DA) was used to calculate the variable importance in project (VIP) (Fig. 2d), and 65 differential flavonoid metabolites (30 down-regulated and 35 up-regulated) were identified in WR by comparing to RR, which included 17 Anthocyanins, 14 Flavonoid, 9 Flavonoid carbonoside, 24 Flavonols, 1 Tannin (Fig. 3, Supplemental Table S2).
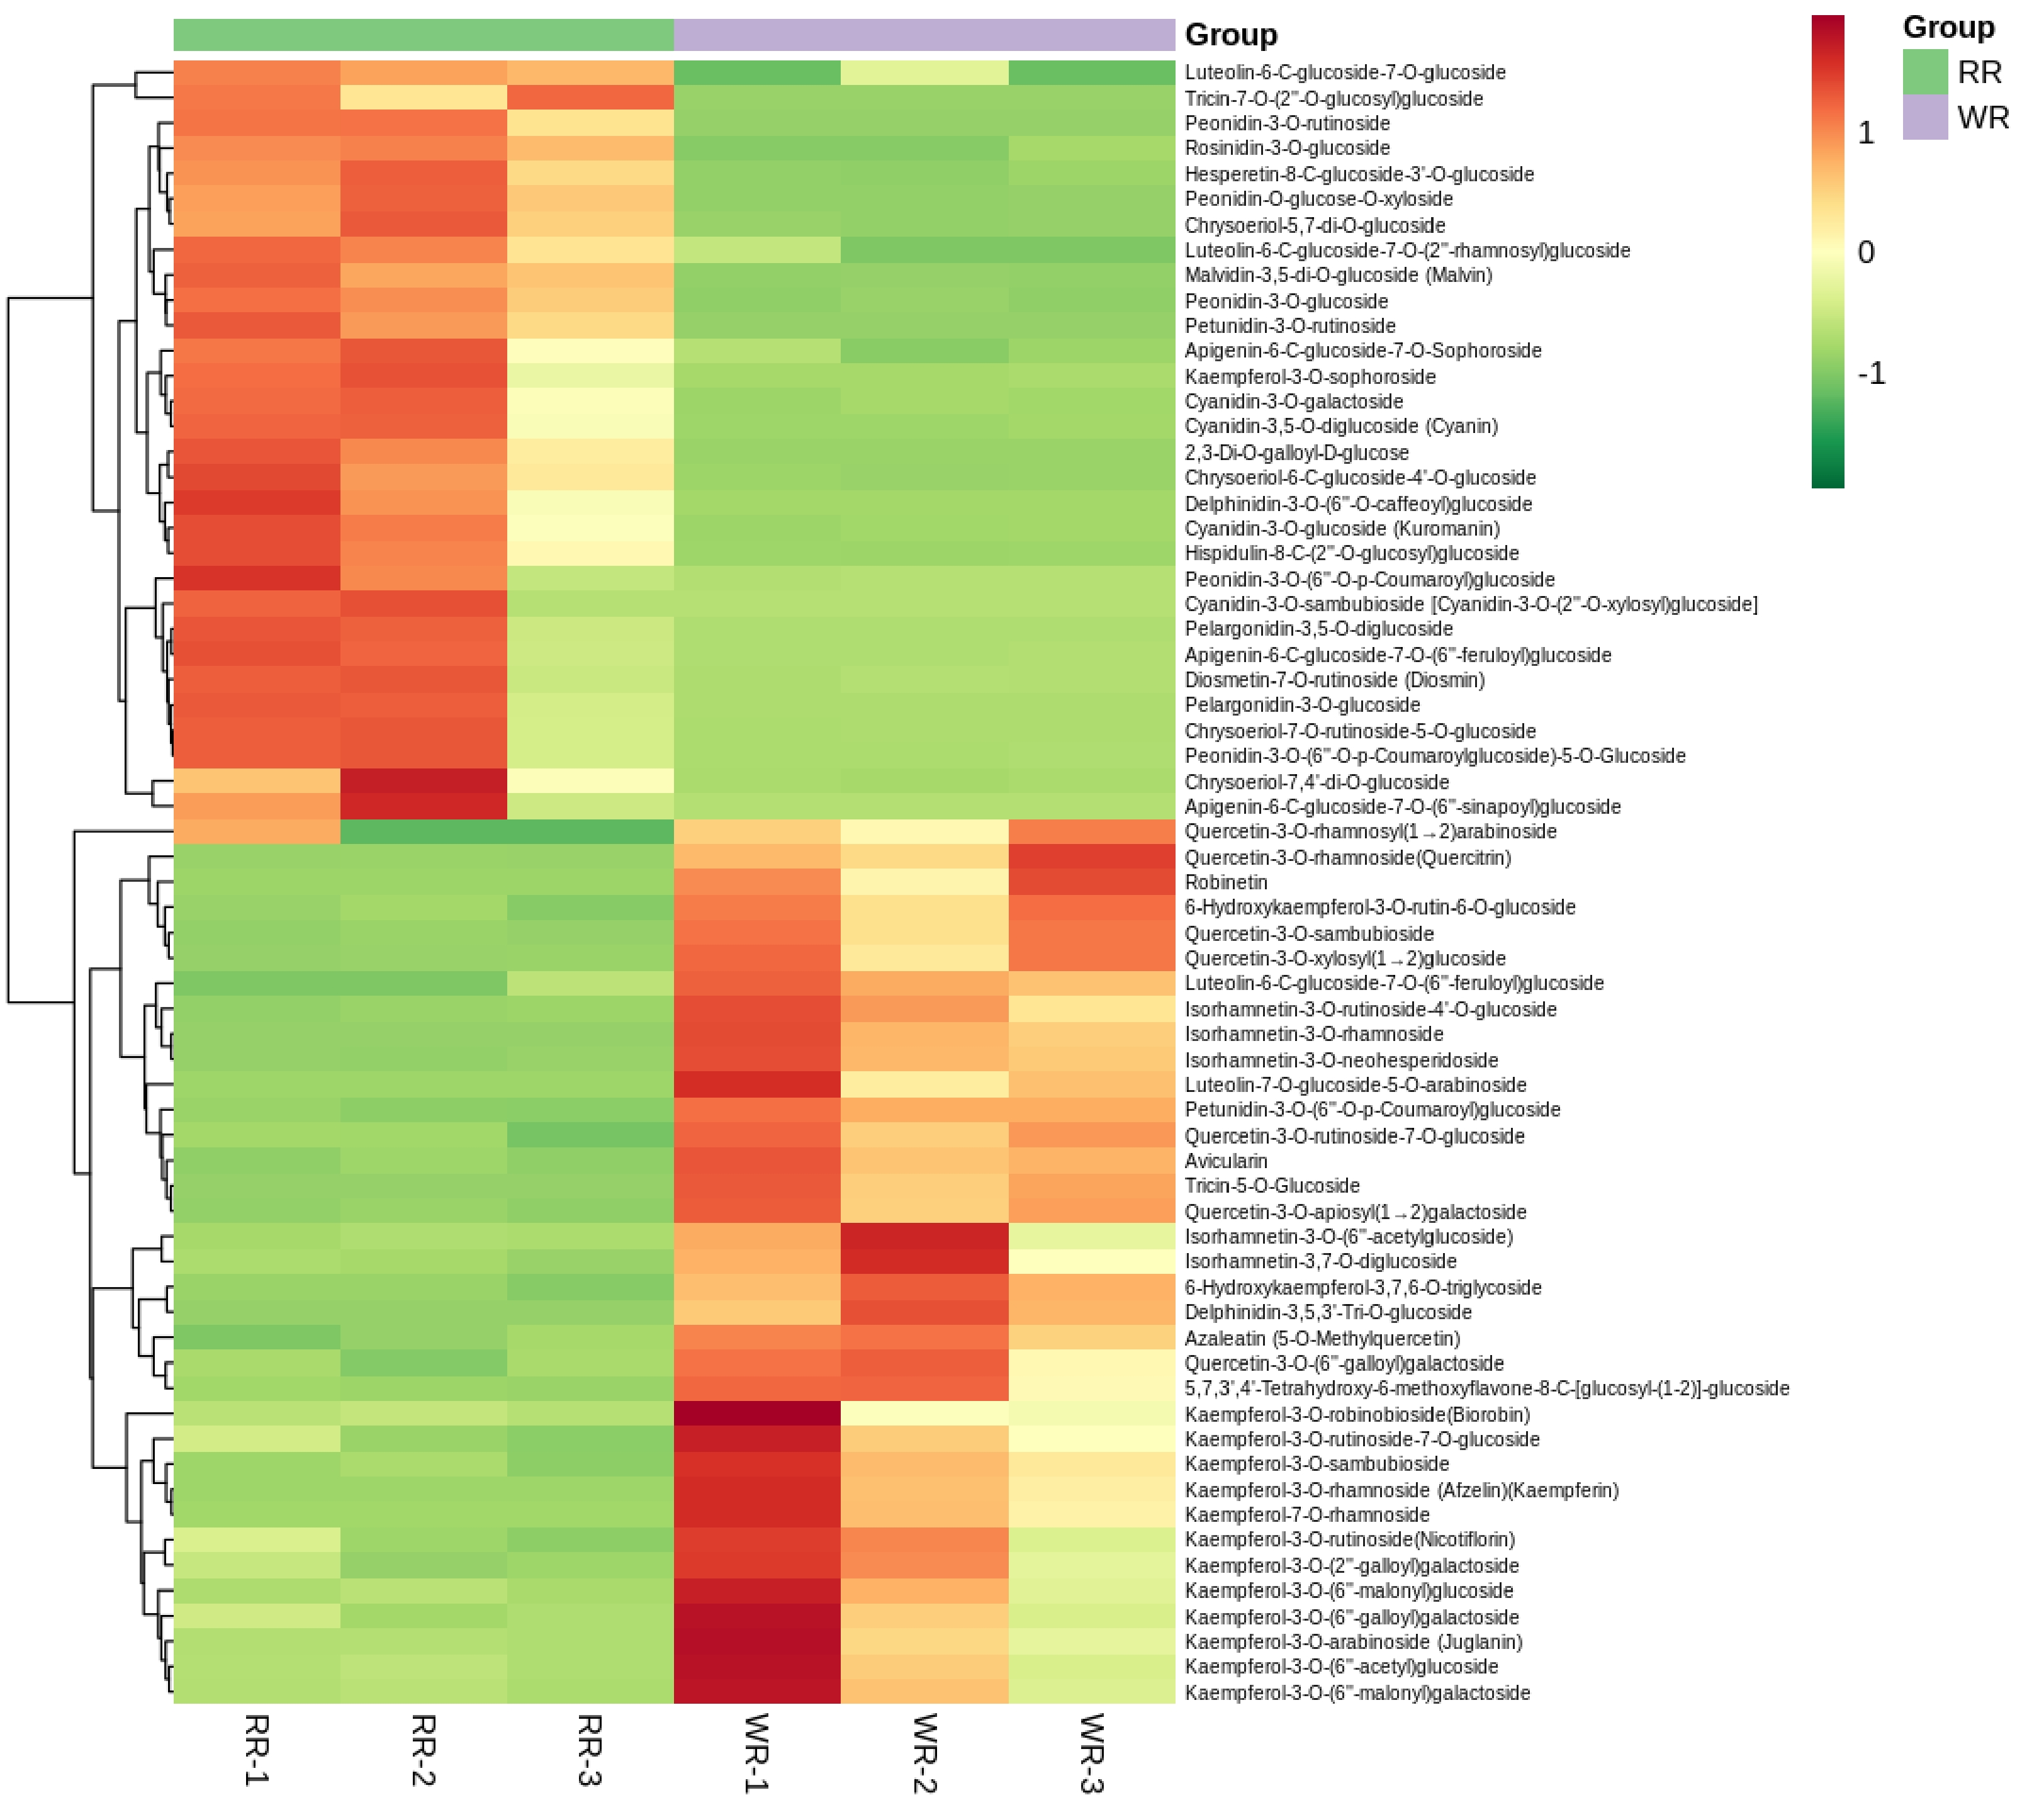
Figure 3. Clustering heatmap of 65 identified differential flavonoid-targeted metabolites of petals in RR and WR by the content data, normalized using the maximum difference normalization method. The abscissa means 3 replicates of petals in RR and WR, and the ordinate indicates flavonoid metabolites detected. The relative high content of metabolites is represented in red, while that of the lower content metabolites ar green. The metabolites abundance is represented by bars of specific color. The color of the bar changed from green to red with the increase in abundance value, as shown in the bar on the upper right.
All 17 anthocyanins were found to belong to the three major classes: Cyanidin, Pelargonidin, Delphinidin and their derivatives. The content of the former two and their derivatives, were fairly low in WR, and five were not detected. As for the two Delphinidins, one was detected in WR and the other was just in RR. The content of flavanones or flavonols were all significantly higher in WR than in RR. The results may indicate the color loss of WR petals (Supplemental Table S2).
Qualitative and quantitative analyses of volatile compounds
-
HS-SPME and GC-MS was used to detect volatile compounds from petals at stage 4 in both WR and RR. A total of 39 volatile compounds were detected from the petals of the two varieties in this study, including alcohols, esters, aldehydes, terpenes, ketones, acids, phenols and alkanes (Supplemental Table S3). According to the origin and metabolic pathways, six of them belonged to the benzenoids/phenylpropanoids, and 26 of those detected in WR (25 in RR) belonged to the terpenoids. The three major volatiles: 2-phenylethanol, β-Citronellol and geraniol accounted for 19.99%, 18.06% and 16.05% in WR and 20.08%, 23.81% and 15.27% in RR, respectively. Principal Component Analysis (PCA) was used to produce GC data, and the two varieties were separated significantly with PC1 and PC2 explaining 62.16% and 16% variance, respectively (Fig. 4a).
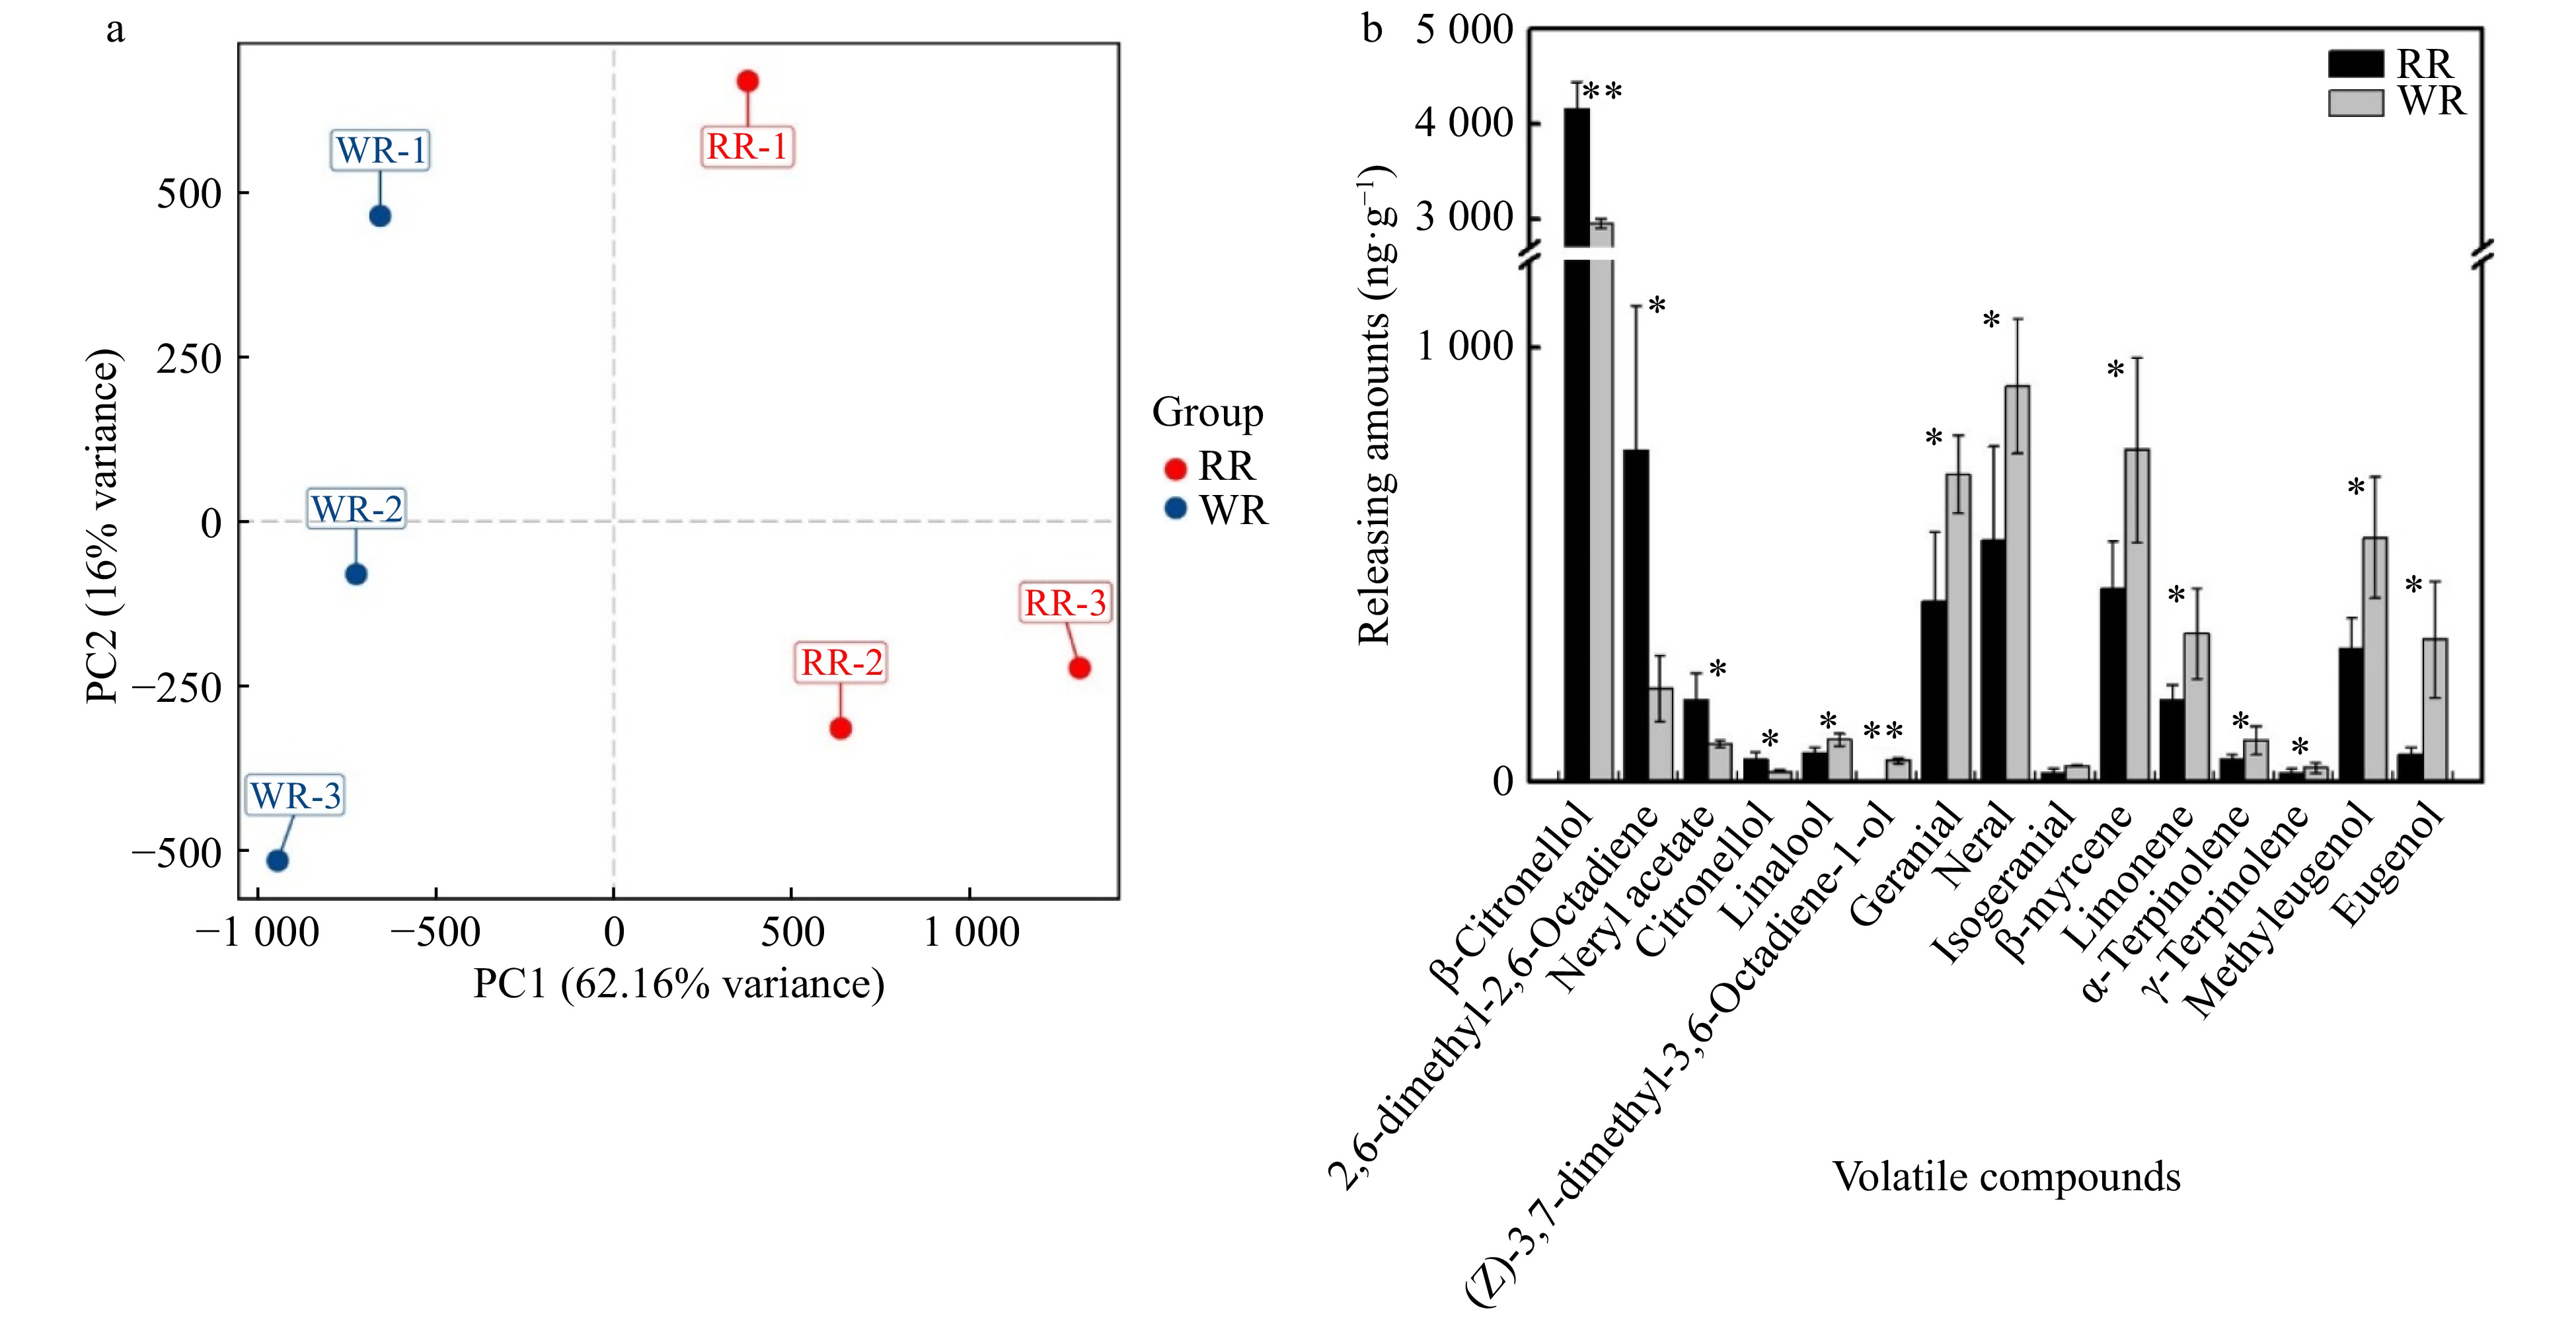
Figure 4. Principal component and comparison of different production amounts of volatile compounds between the two varieties (WR and RR). (a) Principal component analysis score diagram for mass spectrum data of volatile compounds. The X-axis represents the first principal component (PC1), and the Y-axis represents the second principal component (PC2). (b) Comparison of different production amounts of volatile compounds between the two varieties. The abscissa represents the volatile compounds, and the ordinate represents the production amounts of volatile. The error bars are represented by standard deviations of three replicates. Significant difference between the two varieties was calculated using the Student’s t-test based on the raw data of production amounts of volatile compounds; **P < 0.01; *P < 0.05, n = 3. The black bars show volatiles in RR, and the gray bars show volatiles in WR.
Compared with RR, 15 volatiles showed significant differences in production amounts in WR by t-test (P-value < 0.05). Four volatiles, that all belong to terpenoids, including β-Citronellol, Neryl acetate, Citronellal and 2,6-dimethyl-2,6-Octadiene, are lower in WR, while the others are higher, including 13 terpenoids (Linalool, (Z)-3,7-dimethyl-3,6-Octadien-1-ol, Geranial, Neral, Isogeranial, β-Myrcene, Limonene, α-Terpinolene, γ-Terpinene, Methyleugenol and Eugenol) and 2 phenylpropanoids (Fig. 4b, Supplemental Table S3). Above all, the emission amount of β-Citronellol was significantly different between RR and WR, suggesting that β-Citronellol was most likely the component leading to the different odor of the two varieties.
Screening genes related to color and volatile compound biosynthesis
-
Transcriptomic sequencing was performed to identify different expression genes in the two samples. 2,228 up-regulated and 2,777 down-regulated in WR compared to RR using fold change of at least 3 and a P-value < 0.001. The RNA-seq data in this study have been deposited in the Sequence Read Archive (SRA) submission: PRJNA732789. By GO and KEGG enrichment analysis, searching standard gene names and synonyms in the combined functional annotations, a total of 156 genes were identified (Supplemental Table S4).
Previous studies showed that three transcriptional factor families, MYB, bHLH, WD40, were closely involved in the regulation of flower color and scent. In this study, 16 differential MYB family genes, six bHLH family genes and eight WD40 family genes were screened from transcriptomic data. For MYB family, MYB52, MYB101, MYB5, etc. were up-regulated, while 10 genes (such as PAP1, MYB74 etc.) were down-regulated in WR. For bHLH, a total of six genes (such as bHLH10, bHLH66, MYC2-like et al) were all up-regulated. And for WD40, three genes (such as AIR3, KIN13B etc.) were up-regulated, and five genes (Wdr3, HOS15 etc.) were down-regulated (Table 1).
Table 1. Genes showing up- or down-regulated expression levels in WR compared with RR.
Gene family and classification Up-regulated Down-regulated TF MYB MYB52, MYB101, MYB5, MYB44, MYB61, LIMYB PAP1, MYB74, MYB105, MYB78, KUA1, MYBL TF bHLH bHLH10, bHLH66, MYC2-like, bHLH79, bHLH25, bHLH − WD40 AIR3, KIN13B Wdr3, HOS15, LEC14B, ATG18B, Ercc8 Flavonoid FAOMT HIDM, CXE1, ACT, BAHD1 Anthocyanin LDOX PKS1, LDO2 anthocyanin modification RhGT1, GT3, GT5, UGT75L6, UGT73C6, UGT73D1, UGT74E2 3GT, GT7, UGT71K1, UGT71A16, UGT74B1, UGT88F3, UGT86A1 Phenylpropanoid HST, 4CLL7, FAOMT, GT5 CCR1, TKPR1, BAHD1, ACT, CAD, ALDH2C4, NES1, IGS Terpenoid HMGR, CYP76B6 ACT, NUDX1, NUDX7,
HMG1, DXS, SPS2, CYP76B10, NES2Genes related to flavonoid and anthocyanin biosynthesis were screened from transcriptomic data and classified into three types: Flavonoid biosynthesis pathway, Anthocyanin biosynthesis pathway and Anthocyanin modification. As for anthocyanin modification, 13 genes were up-regulated and 11 were down-regulated, separately (Fig. 2, Supplemental Table S4). For anthocyanin biosynthesis, chalcone synthase genes (CHS, CHI, F3H, F3'H, FLS) in the upstream of the pathway, were detected. Most of the differential genes were distributed downstream of the pathway, such as ANS (genes involved in the formation of colored anthocyanidin from leucoanthocynidin) and anthocyanin modification genes, such as glycosylation genes, methylase genes (Fig. 5, Table 1).
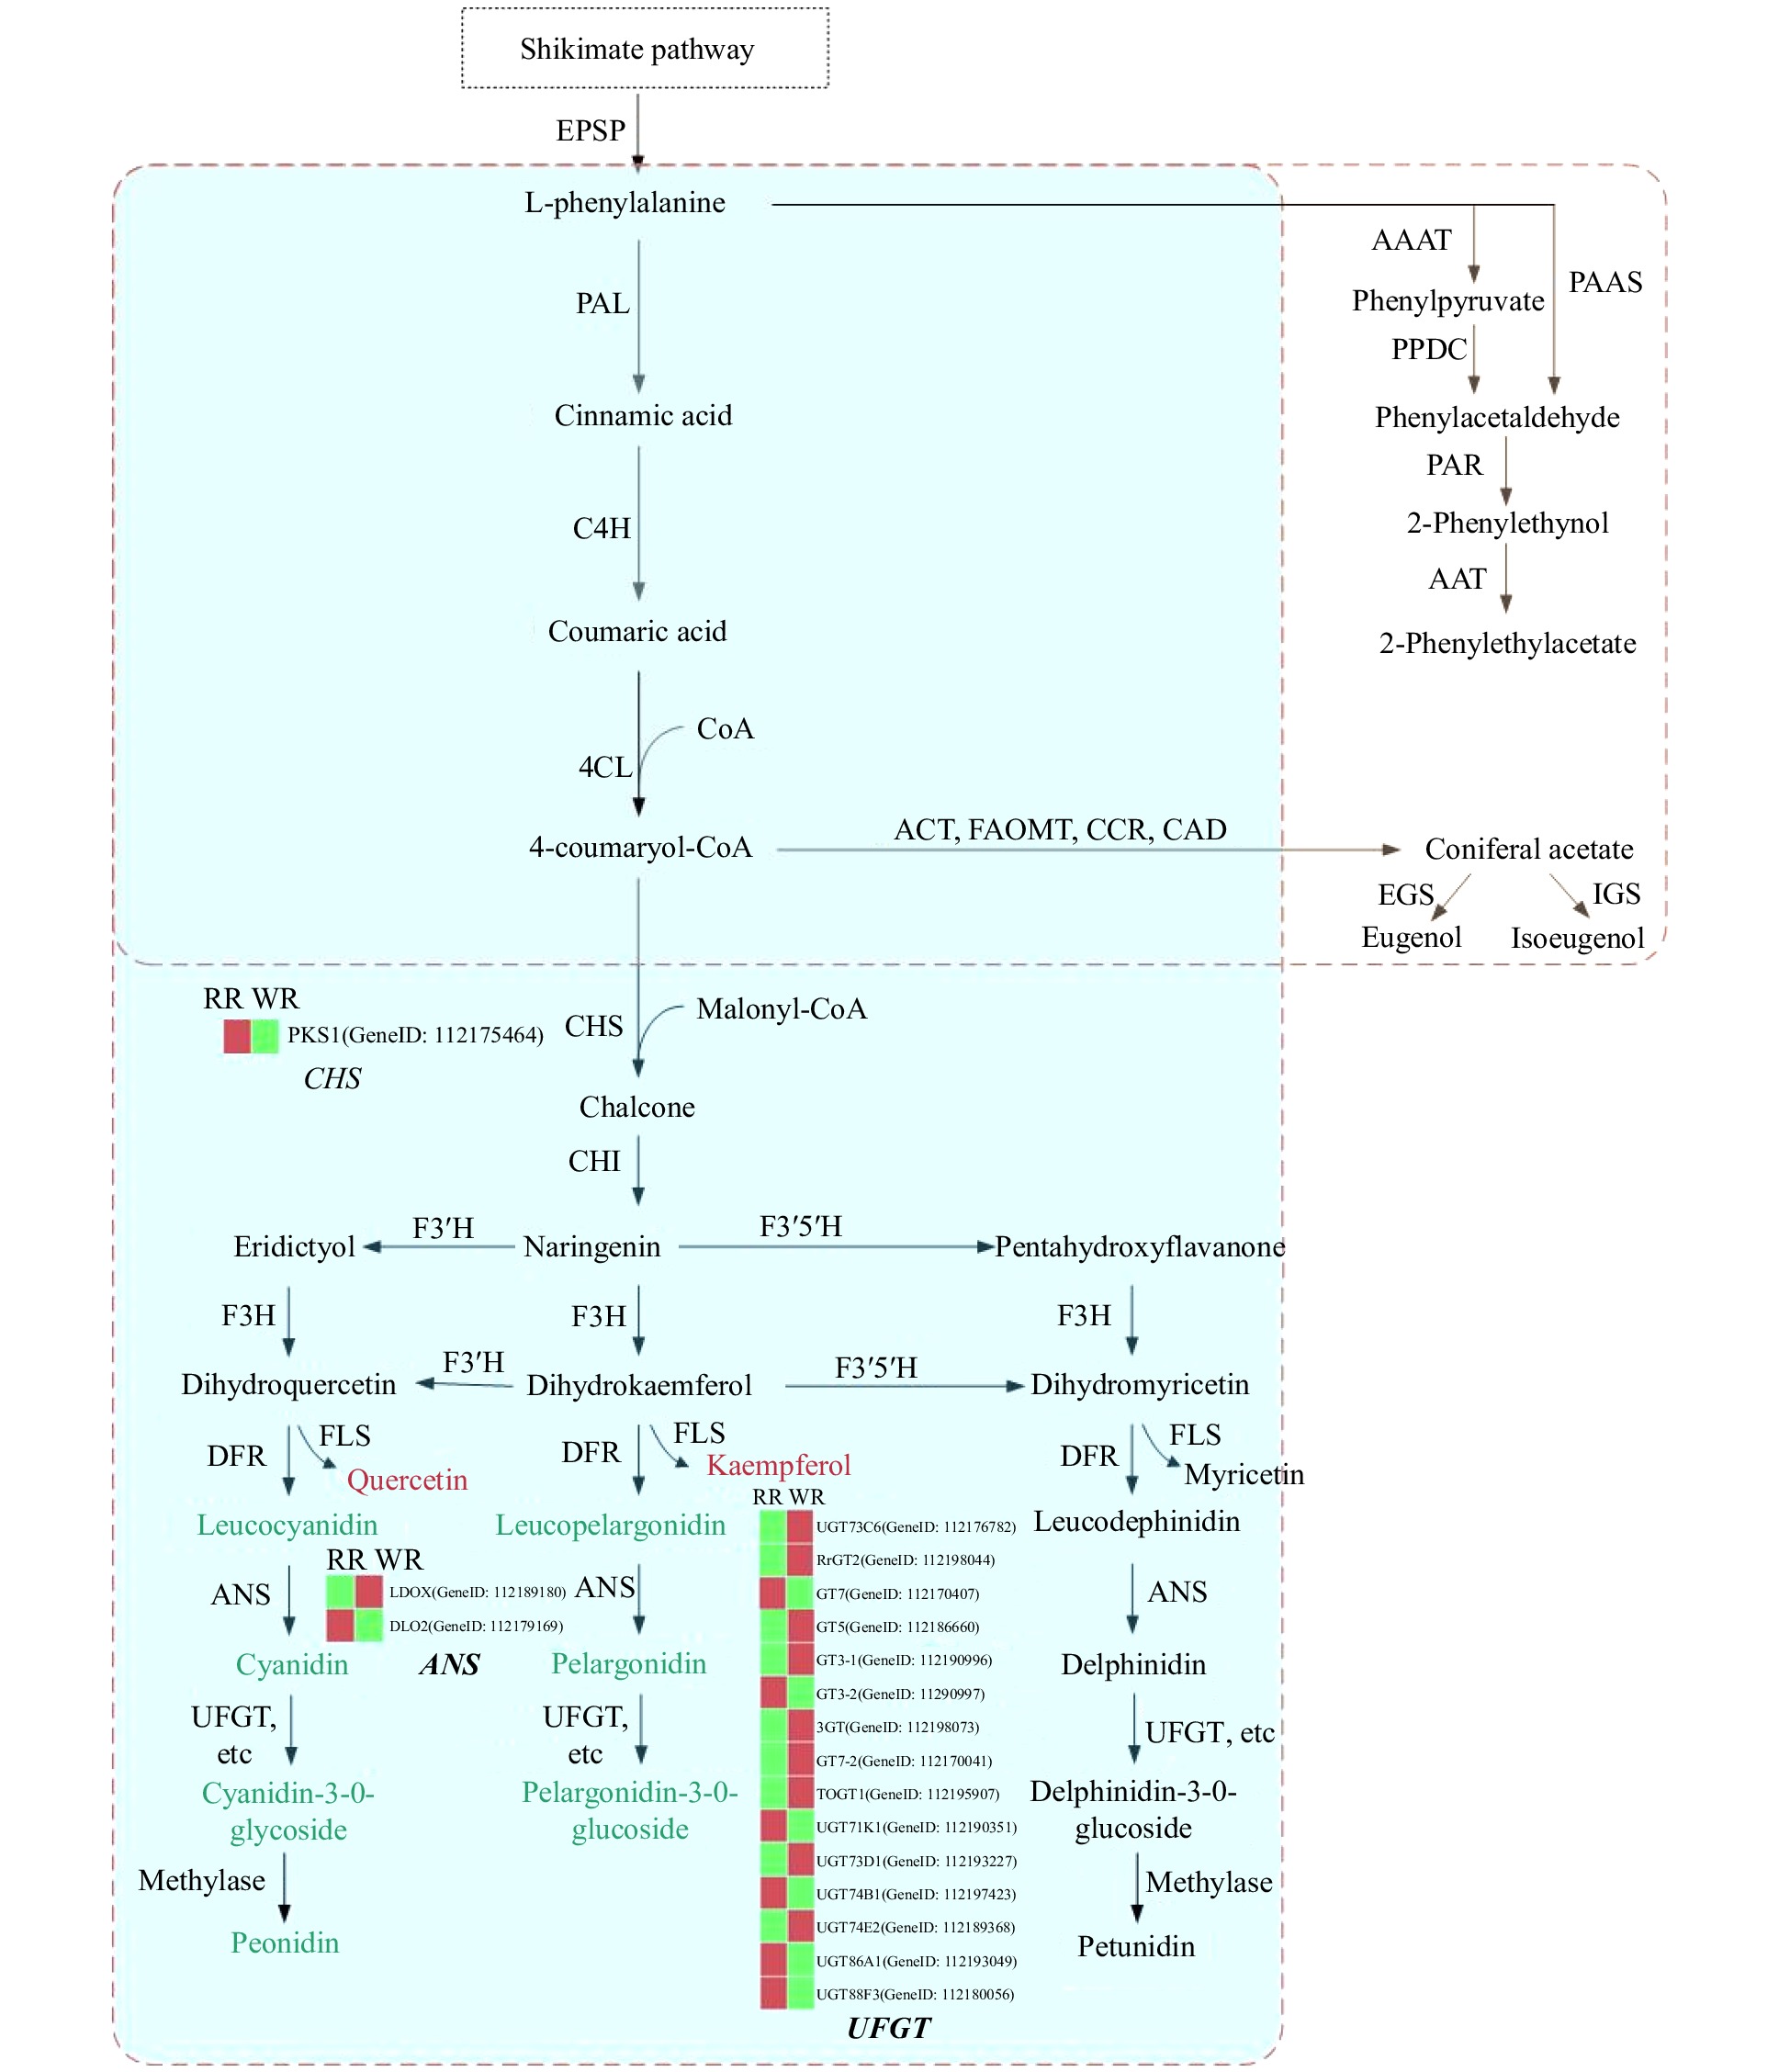
Figure 5. Schematic representation of the pathways leading to the production of anthocyanins and some benzenoids/phenylpropanoids determining color and scent profiles in rose flowers. Biosynthesis pathways are boxed with a dotted line. The box with the blue background represents the flavonoid biosynthesis pathway, and the box with the light yellow background indicates the benzenoid/phenylpropanoid biosynthesis pathway. In the flavonoid biosynthesis pathway, metabolites in a red font indicate significantly higher content in WR, and those in a green font indicate remarkably lower content in WR. The red and green bars in the heatmap represent higher and lower expression levels of related genes, respectively. EPSP: 5-enolpyruvylshikimate 3-phosphate; PAL: phenylalanine ammonia lyase; C4H: cinnamic acid-4- hydroxylase; 4CL: 4-coumarate-CoA ligase; CHS: chalcone synthase; CHI, chalcone isomerase; F3′H, flavonoid 3′-hydroxylase; F3′5′H, flavonoid 3′5′-hydroxylase; F3H, flavanone 3-hydroxylase; DFR, dihydroflavonol 4-reductase; FLS, flavonol synthase; ANS, anthocyanidin synthase; UFGT, anthocyanidin 3-O-glucosyltransferase; ACT: cetyltransferase; FAOMT: methyltransferase; CCR: cinnamoyl-CoA reductase; CAD: cinnamyl alcohol dehydrogenase; EGS: eugenol synthase; IGS: isoeugenol synthase; AAAT: aromatic amino acid aminotransferase; PPDC: phenylpyruvate decarboxylase; PAAS: phenylacetaldehyde synthase; PAR: phenylacetaldehyde reductase; AAT: geraniol/citronellol acetyl transferase.
Different volatile compounds have been indicated to be controlled by the differential genes that belong to the Benzenoid/phenylpropanoid biosynthesis pathway and the terpenoid biosynthesis pathways. For the genes related to Phenylpropanoid biosynthesis, 27 and 34 genes were found to be up- and down-regulated, respectively. In this study, genes related to terpenoid biosynthesis, nine genes were detected to be up-regulated and 28 were down-regulated. In the phenylpropanoid pathway, most of the differentially expressed genes were found to be located in the phenyl acryles pathway, while in the benzenoid biosynthesis pathway, only a few genes were detected to be differentially expressed (Fig. 5, Table 1).
According to the volatile biosynthesis pathway (Fig. 5, light yellow background), CCR1 was one of the key enzymes to biosynthesize Eugenol and Methyleugenol, and up-regulation of CCR1 might illustrate the higher releasing amount of Eugenol and Methyleugenol in WR. Most of the genes were related to biosynthesis of terpenoids, and down-regulation of DXS, NUDX7, NUDX1, and ACT (encoding Geraniol/Citronellol acetyltransferase) which might explain the much lower emission amount of citronellol in WR petals compared to that in RR.
Using the biosynthesis pathway of correlation analysis, 13 genes related to both flavonoid biosynthesis and phenylpropanoid biosynthesis pathways were detected, nine of them were up-regulated and four were down-regulated. ACT, 3 HST, 2 GT5, 1 BAHD1, 1 FAOMT and two caffeoyl-CoA O-methyltransferase-like genes were related to the biosynthesis of color and scent. Especially, the ACT gene (encoding CoA geraniol/citronellol acetyltransferase, GeneID:112190420), which expressed lower in WR, was involved in three pathways: flavonoid biosynthesis, phenylpropanoid biosynthesis and terpenoid biosynthesis. However, GT5 (anthocyanin glycosylation gene, GeneID:112186660), expressed higher in WR, was involved in both flavonoid and phenylpropanoid biosynthesis pathways. (Fig. 5, Table 1). The results indicated that these two genes, ACT and GT5, might play important roles in equilibrating the relationship of color pigmentation and volatile release.
Validation of differential expressed genes
-
To further reveal the relationships between biosynthesis of volatiles and flavonoid metabolites, the expression of genes related to color and scent were analyzed using RT-qPCR in petals of RR and WR. The transcriptional factors, MYB101, MYB5, MYBP, MYB74, PAP1, MYC2, AIR3, LEC14B, involved in biosynthesis pathways of flavonoids or volatile compounds, were verified. The results indicated that the expression of MYB74 and LEC14B was down-regulated, while MYB101, MYB5, AIR3, MYC2 was up-regulated in WR compared to RR. Interestingly, the expression of MYC2 was up-regulated in WR along with a higher release amount of linalool, which was consistent with previous reports that overexpression of MYC2 enhanced linalool biosynthesis[27] (Fig. 6a, Supplemental Table S5).
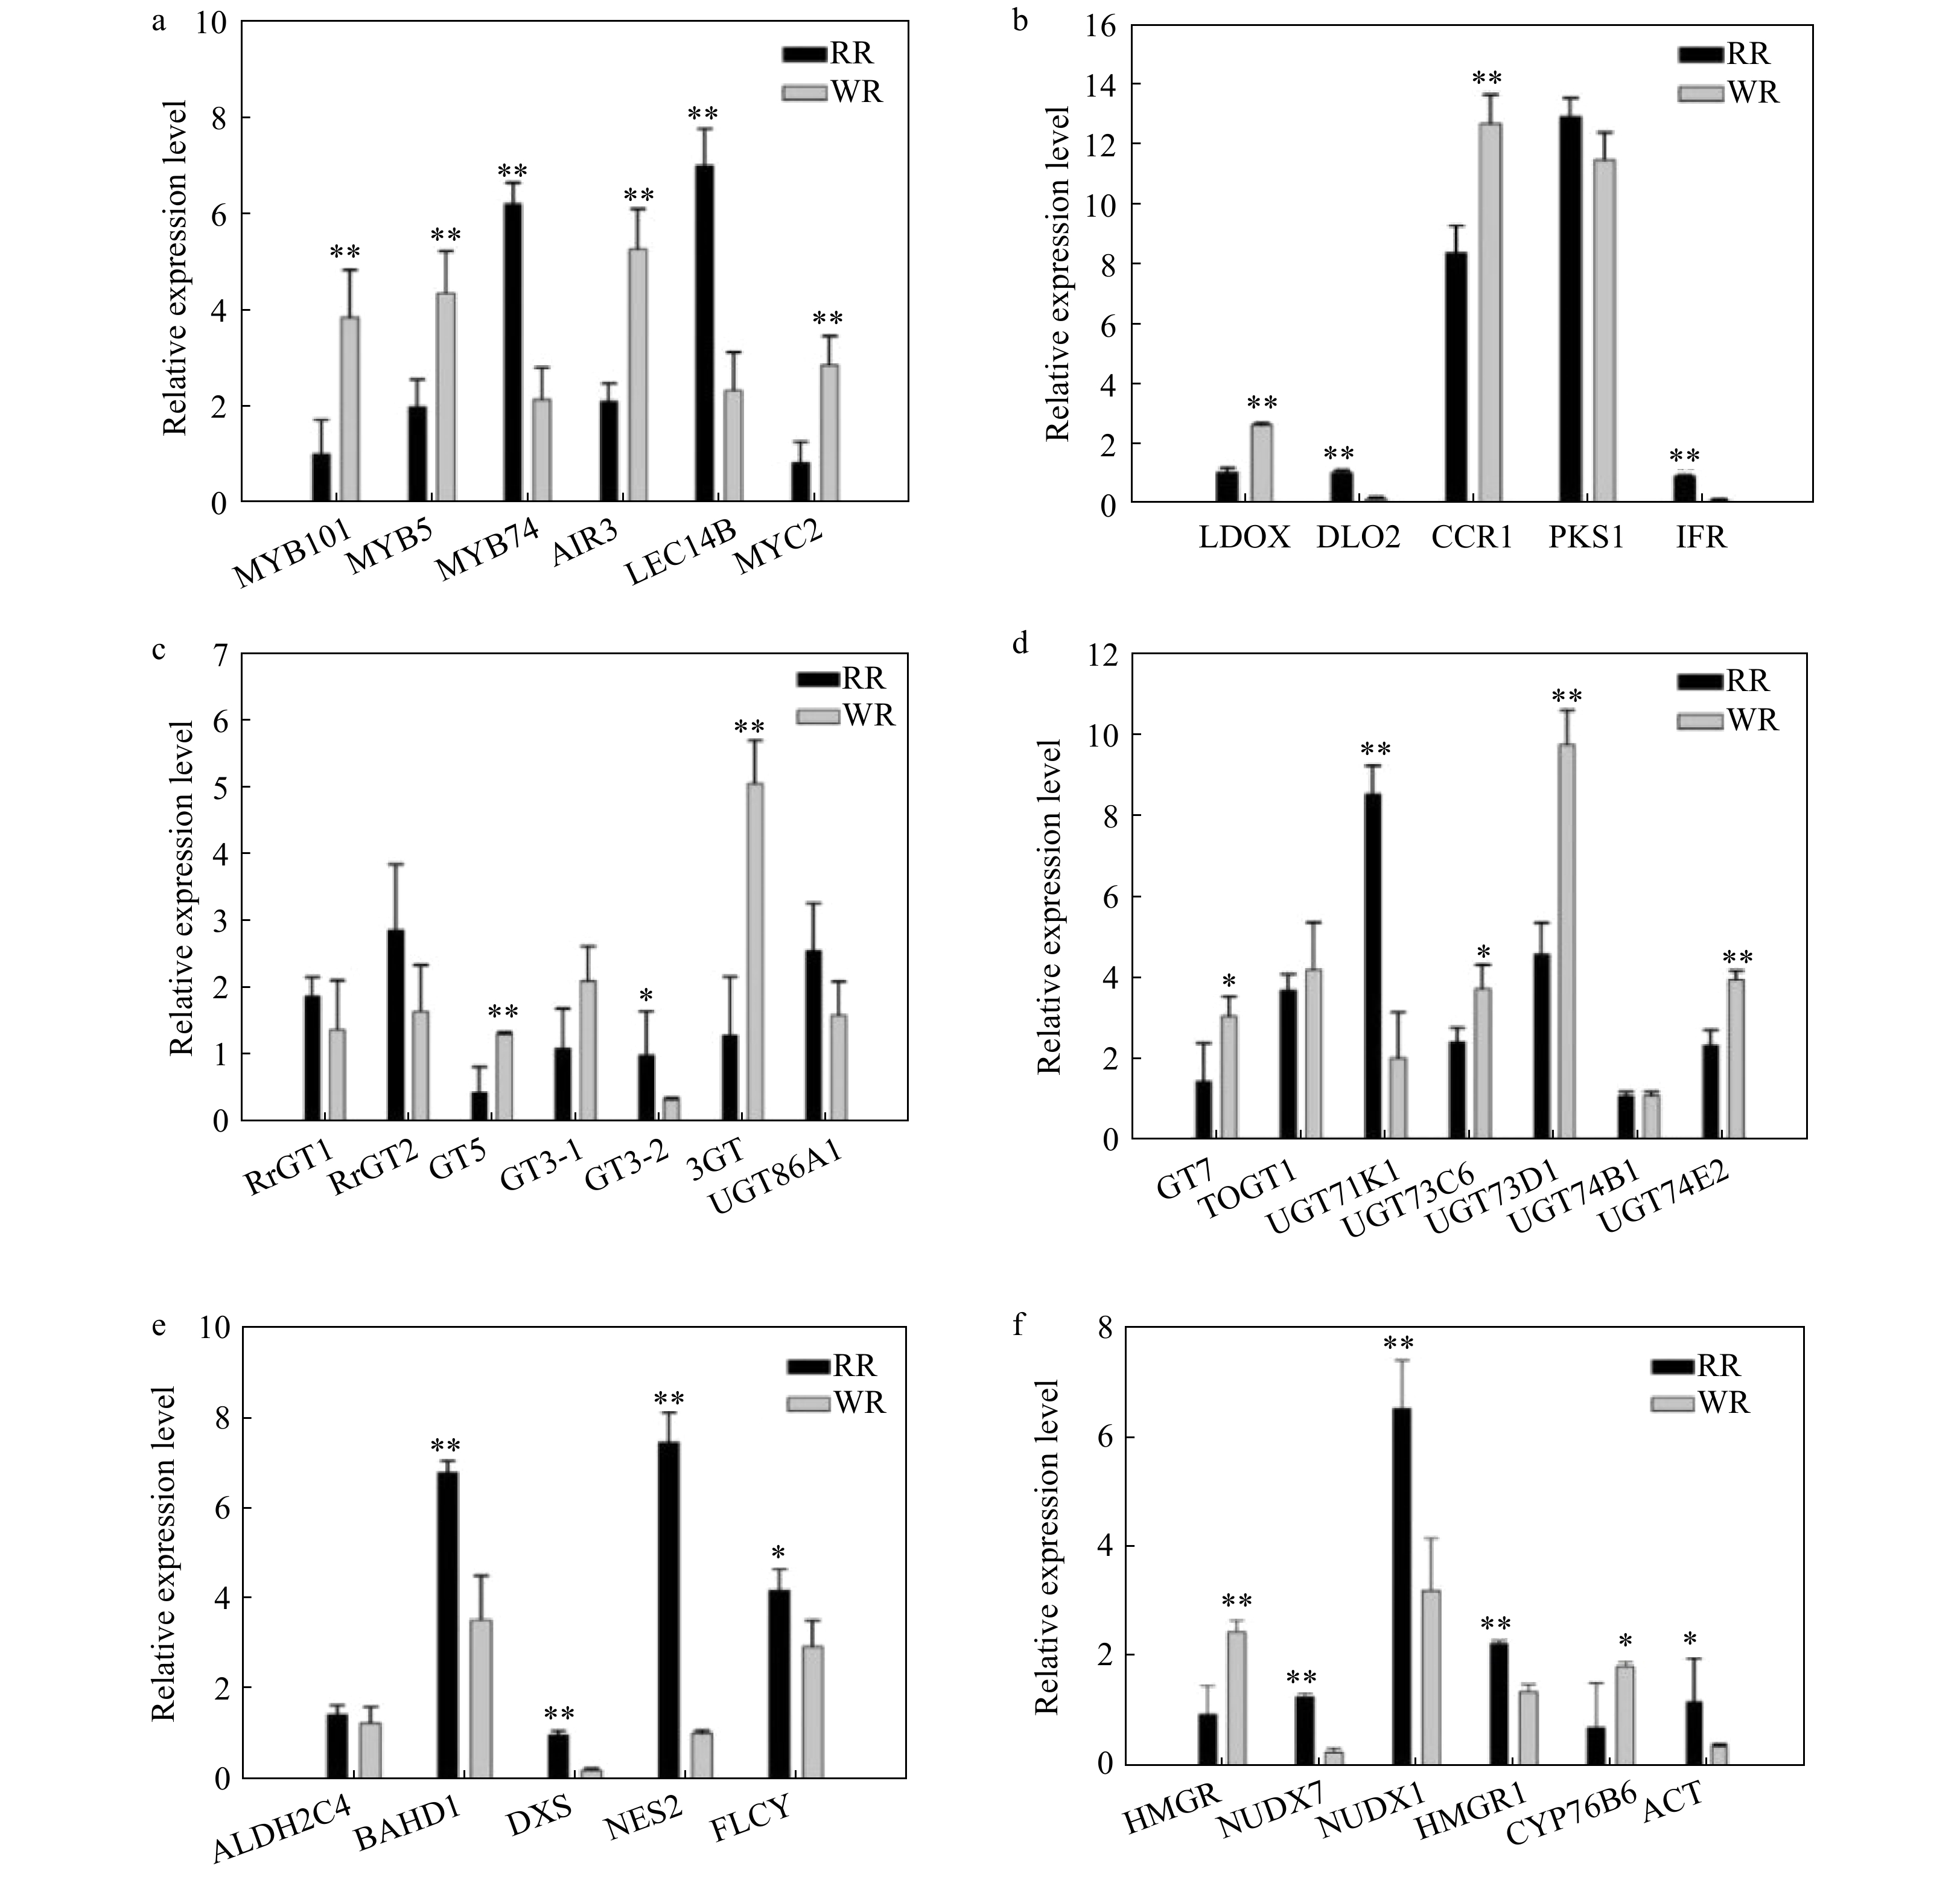
Figure 6. Comparison of relative expression of some differential genes involved in flavonoid, phenylpropanoid and terpenoid biosynthesis pathways in RR and WR. RhGAPDH was used as the normalized standard. The relative expression level was calculated using the 2−ΔΔCT method. The error bars are represented by standard deviations of three replicates. Significant difference between the two varieties was calculated using Student’s t-test based on the raw data of expression levels of genes; **P < 0.01; *P < 0.05, n = 3. The black bars show volatiles in RR, and the gray bars show volatiles in WR.
The structural and modification genes in the flavonoid biosynthesis pathway were also verified with RT-qPCR. The results showed that the CHS synthase gene, PKS1 was down-regulated, while LDOX/ANS, LDOX and DLO2 showed different expression patterns in the flavonoid biosynthesis pathway. The modified genes, such as UFGTs, also showed different expression patterns (Fig. 5a, d, e). For the anthocyanin biosynthesis pathway (Fig. 2, blue background), the down-regulation of DLO2, PKS1 in WR, might suggest the decline of anthocyanins (Fig. 6b–d). As for genes involved in the pathway of scent biosynthesis, ALDH2C4, BAHD, DXS, NES, FLCY, NUDX7, NUDX1, HMGR1, ACT were found to be down-regulated in WR, while CCR1, HMGR, CYP76B6 were up-regulated (Fig. 6b, e and f).
-
R. rugosa is cultivated for its economical value in ornamental plants, the cosmetics and medical industries. R. rugosa Thunb. f. alba (Ware) Rehd with white petals is the variant of R. rugosa Thunb. f. rosea Rehd. (red petals), and the two varieties have almost identical phenotype agronomic traits, except for flower color and fragrance. They are ideal materials to study the biosynthesis of flower color and fragrance.
As is known, different anthocyanins lead to different colors in plants, including the three: Cyanidin, Pelargonidin and Delphinidin. However, R. rugosa petals mainly consist of Cyanidin and Pelargonidin[14]. Cyanidin, and its derivative Peonidin, appear red violet, and Pelargonidin appears brick-red[39]. In our study, Cyanidin and its derivative Peonidin and Pelargonidin are significantly lower in WR than in RR, suggested that this might be the main reason for the color loss in white petals (Fig. 5). Additionally, the loss of color requires a blockage of the anthocyanin biosynthetic pathway before Cyanidin and Pelargonidin formation. In the anthocyanin biosynthetic pathway, all of the upstream genes (CHS, CHI, F3H, F3'H, FLS) had no obvious change except one CHS gene, PKS1 and the downstream genes (DFR and ANS), two ANS genes (SRG1 and LDO2), while anthocyanin modification genes, such as GT5, 3GT, GT3, RrGT1, RrGT2, TOGT1 et al. showed diverse expression patterns. These results suggested that the down-regulation of DLO2, PKS1 in WR, and anthocyanin modification genes with diverse expression patterns, might explain the decline of anthocyanins in WR.
In the present study, the content of Kaempferol (produced from dihydrokaempferol by flavonol synthase, FLS) and its derivatives were all significantly higher in WR, except for Kaempferol-3-O-sophoroside, and Pelargonidin (produced from dihydrokaempferol by dihydroflavonol-4-reductase, DFR) which has a markedly lower content in WR and its derivatives; Quercetin and Cyanidin shared the same patterns (Fig. 6). The patterns of higher Kaempferol and lower Pelargonidin is in accordance with the opinion that FLS and DFR compete for the common substrates and result in the production of different colors[16].
In petunia, anthocyanins and volatile phenylpropanoid (eugenol and isoeugenol) share the common precursor 4-coumaryl CoA[33,37], and the transcription factor genes PAP1[35] and PH4[36], the structural genes F3H[34] and CCoAOMT[37] were reported to coregulate the biosynthesis of anthocyanins and volatile phenylpropanoids. Therefore, we supposed that the anthocyanins and volatile phenylpropanoids might influence each other in the biosynthesis process in roses, with competing common substrates, sharing the same regulation genes and enzymes, etc., and finally leading to different colors and fragrance.
CoA reductase, encoded by CCR, is the key enzyme for the biosynthesis of eugenol and isoeugenol in the phenylpropanoid biosynthesis pathway, which competed for the common substrate 4-coumaryol-CoA in the pathway of anthocyanin biosynthesis[18]. In the study, the up-regulated expression of CCR was consistent with higher production of eugenol and isoeugenol in WR.
Finally, by comparative transcriptomic and metabonomic manners, we found that the ACT gene (encoding CoA geraniol/citronellol acetyltransferase[29]) might be involved in three pathways: flavonoid biosynthesis, phenylpropanoid biosynthesis and terpenoid biosynthesis pathways and GT5 (anthocyanin glycosylation gene), involved in both flavonoid and phenylpropanoid biosynthesis pathway, showed significant difference in relative expression between WR and RR. These results suggested that ACT and GT5 might play important roles in regulating the relationship of color pigmentation and volatile release.
-
R. rugosa Thunb. f. rosea Rehd. (abbreviated as RR) with red petals and its variant R. rugosa Thunb. f. alba (Ware) Rehd (abbreviated as WR) with white petals, were field-grown at the rose germplasm garden of the Flower Research Institute, Yunnan Agriculture Academic Science, Kunming, Yunnan, PR China (Fig. 1).
Sampling and preparation
-
Petals from different flowers on the middle branches of the adult plants at blooming stage (stage 4 of flower development) were collected at 10:00−11:00 on 13 August 2020[40,41]. One part of the petals were frozen immediately in liquid nitrogen and stored at –80 °C for RNA extraction and flavonoid analysis. Other samples were collected in the ice-box and brought to the laboratory for volatile analysis.
Measurement and identification of flower flavonoids-targeted metabolomics
-
The flavonoids were analyzed using Ultra Performance Liquid Chromatography (UPLC, SHIMADZU Nexera X2) and Tandem mass spectrometry (MS/MS, Applied Biosystems 4500 Q TRAP) system as previously described[38]. The standard HPLC grade (BioBioPha, Kunming, China) dissolved in methanol (Merck, Darmstadt, Germany) as solvent and stored at −20 °C.
The petals of the two varieties were vacuum freeze-dried and ground with a grinder (30 Hz for 1.5 min) to powder. The 100 mg powder was dissolved in 70% methanol solution. The dissolved sample was swirled six times at 4 °C overnight to improving the extraction rate. After centrifugation (12,000 rpm for 10 min), the supernatant was filtered with a microporous membrane (0.22 μm pore size). The sample was stored in a sample injection bottle for UPLC-MS/MS analysis.
Measurement of petal volatile compounds
-
The content of petal volatile compounds were assayed quantitatively using Head Solid-phase Micro-extraction (HS–SPME) and Gas Chromatography-Mass Spectrometry (GC–MS). The petals were mixed and 1 g was placed into a glass vial for volatile extraction with 5 μl internal standard, a mixture of 2μl Ethyl caprate (CAS#110-38-3, 0.865 μg·μL–1) dissolved into 1,998 μl n-Hexane AR (CAS#110-54-3). The process of extraction lasted for 35 min at 35 °C with a 50 μm DVB/CAR/PDMS solid-phase microextraction (SPME) fiber (Supelco, Bellefonte, PA, USA), and detected for 30 min in 7890B GC system and 5977A MSD (Agilent Technologies, USA). The NIST2014 library and Kovats’ Retention Indices (RI) were used to identify the volatiles.
RNA extraction, library construction and RNA-Seq
-
The total RNAs of petals from each sample were extracted using EASY spin Plus Complex Plant RNA Kit (Genenode Biotech Co., Ltd, Beijing, China) and then the concentration and purity were examined with a NanoDrop 2000 spectrophotometer (NanoDrop Technologies, Wilmington, DE, USA). The RIN (RNA integrity number) values of these samples were characterized using an Agilent 2100 Bioanalyzer (Santa Clara, CA, USA). And 1.5% electrophoresis gel was used to detect whether RNA samples were contaminated with genomic DNA or degraded.
The construction of the libraries and the RNA-Seq were performed by the Frasergen Gene Corporation (Wuhan, China). mRNA was enriched and purified with oligo (dT)-rich magnetic beads and then broken into short fragments. The cyclic libraries were made into DNA Nano Balland then sequenced using a BGI MGIseq 2000. Transcriptomic sequencing was performed on BGISEQ platform with MGISEQ-2000RS instrument. The Old Blush Haploid genome, R. chinensis Genome v1.0, was used as the reference, and a total of 5005 DEGs were identified using DESeq2 based on |log2Fold Change| ≥ 1 and FDR < 0.05 in the two samples.
Identification of differential expressed genes
-
For reverse transcription, 100ng RNA was taken from each sample to obtain cDNA by PrimeScriptTM reagent Kit with gDNA Eraser (Perfect Real Time) (TAKARA, China). The cDNA was then diluted to less than 50 ng·μL. CFX96TM Real-ime System (Bio-Rad, Hercules, CA, USA) was used for RT-qPCR by TB Green Premix Ex TaqTM II (Tli RNaseH Plus)(TAKARA, China). The specific primers of flavonoid and scent-related genes used for RT-qPCR identification were listed (Supplemental Table S5), and Primer3 (http://bioinfo.ut.ee/primer3-0.4.0) was used to design the gene-specific primers. The gene expression was normalized by RhGAPDH (AB370120) as standard, and calculated by 2−ΔΔCT. All data were expressed as the mean ± standard deviation (SD) after normalization. Three biological replicates were performed for each analysis.
- This work is supported by the National Key Research and Development Program of China (Grant no. 2018YFD1000400), the National Natural Science Foundation of China (Grants no. 32060693 and 31872144), National Science Foundation of Jiangsu Province (BK20180543).
- The authors declare that they have no conflict of interest.
- Supplemental Fig. S1 Principal component analysis score diagram for mass spectrum data of samples and quality control samples of flavonoid-target metabolites. The X-axis represents the first principal component (PC1), and the Y-axis represents the second principal component (PC2).
- Supplemental Table S1 Types and contents of total flavonoid compounds in RR and WR.
- Supplemental Table S2 65 flavonoid metabolites significantly different between RR and WR.
- Supplemental Table S3 volatile compounds detected in WR and RR.
- Supplemental Table S4 Regulatory genes and genes belonged to flavonoid, benzenoid/phenylpropanoid and terpenoid biosynthesis pathway.
- Supplemental Table S5 Genes related to flavonoid and volatile compounds veridified by RT-qPCR.
- Copyright: © 2021 by the author(s). Exclusive Licensee Maximum Academic Press, Fayetteville, GA. This article is an open access article distributed under Creative Commons Attribution License (CC BY 4.0), visit https://creativecommons.org/licenses/by/4.0/.
-
About this article
Cite this article
Feng D, Zhang H, Qiu X, Jian H, Wang Q, et al. 2021. Comparative transcriptomic and metabonomic analysis revealed the relationships between biosynthesis of volatiles and flavonoid metabolites in Rosa rugosa. Ornamental Plant Research 1: 5 doi: 10.48130/OPR-2021-0005

Comparative transcriptomic and metabonomic analysis revealed the relationships between biosynthesis of volatiles and flavonoid metabolites in Rosa rugosa
- Received: 24 February 2021
- Accepted: 15 June 2021
- Published online: 29 June 2021
Abstract: Rosa rugosa is not only cultivated as a landscaping plant, but also used in cosmetics, the medical and food industries. However, little information is currently available on the gene regulatory networks involved in its scent and color biosynthesis and metabolism. In this study, R. rugosa Thunb. f. rosea Rehd with red petals (RR) and its white petal variant (WR), were used to study the molecular mechanisms in flower color and scent. Sixty-five differential flavonoid metabolites and 15 volatiles were found to have significant differences between RR and WR. Correspondingly, the key regulators (MYB-bHLH-WD40) of anthocyanin synthesis pathway and their structural genes involved in flavonoid biosynthesis, benzenoid/phenylpropanoid biosynthesis, terpenoid biosynthesis pathways were also found to be differentially expressed by comparative transcriptome. Further, qPCR permitted the identification of some transcripts encoding proteins that were putatively associated with scent and color biosynthesis in roses. Particularly, the results showed that the ACT gene (encoding CoA geraniol/citronellol acetyltransferase, GeneID: 112190420), which expressed lower in WR, was involved in three pathways: flavonoid biosynthesis, phenylpropanoid biosynthesis and terpenoid biosynthesis, however, GT5 (anthocyanin glycosylation gene, GeneID:112186660), expressed higher in WR, was involved in both flavonoid and phenylpropanoid biosynthesis pathways. These results suggested that ACT and GT5 might play important roles in regulating the relationship of color pigmentation and volatile emission.
-
Key words:
- Rosa rugosa /
- flavonoid /
- anthocyanin /
- scent /
- phenylpropanoid /
- terpenoid