-
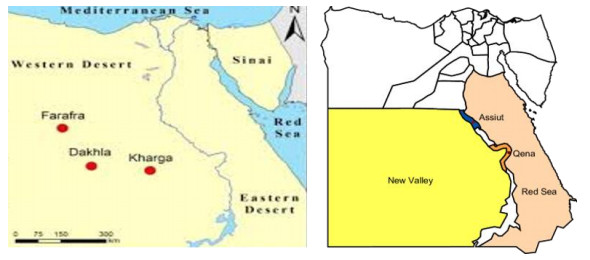
Figure 1. Location of the New Valley Governorate showing study site.
-
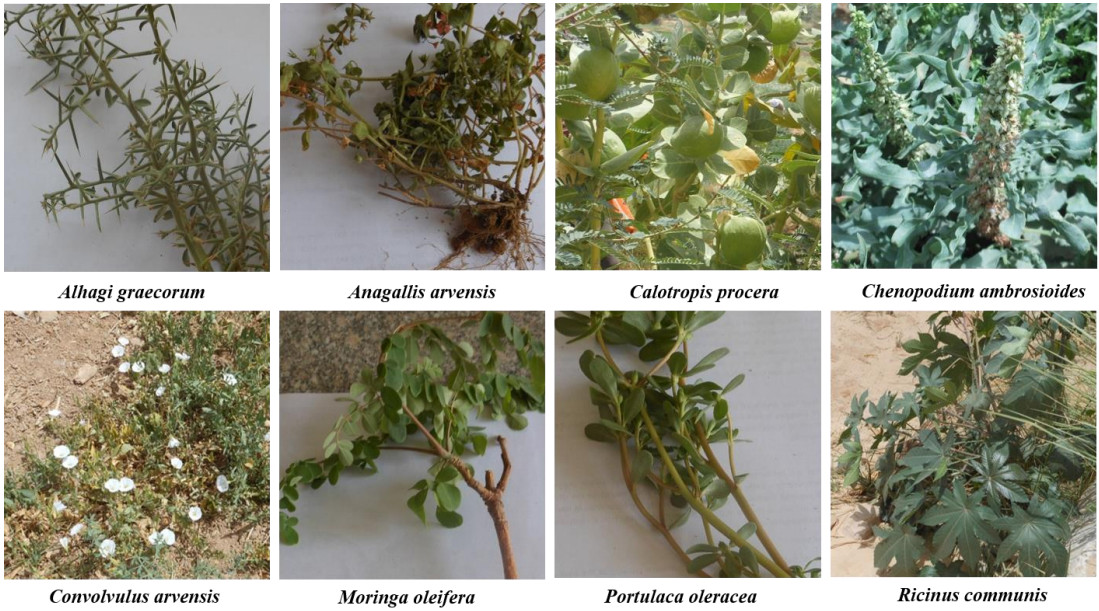
Figure 2. Wild medicinal plant species collected from El-Kharga Oasis, the New Valley Governorate, Egypt, during April 2018.
-
Fungal genera & species Plant species Gross total Alhagi graecorum Convolvulus arvensis Chenopodium ambrosioides Calotropis procera Ricinus communis Angallis arvensis Moringa oleifera Portulaca oleracea L R L R L R L R L R L R L R L R CFU %CFU Acremonium 4 4 0.89 A. rutilum 1 1 0.22 A. sclerotigenum 3 3 0.67 Alternaria 1 34 36 1 20 15 107 24 A. alternata 1 21 20 4 46 10.33 A. brassicicola 1 1 0.22 A. chlamydospora 8 8 1.79 A. citri 1 7 8 1.79 A. citri macularis 4 4 0.89 A. longipes 3 3 1 7 1.57 A. tenuissima 10 8 9 6 33 7.42 Aspergillus 1 10 3 2 1 1 20 10 21 2 2 2 1 2 78 17.5 A. creber 2 2 0.44 A. flavus 1 1 1 19 2 1 1 26 5.84 A. fumigatus 1 1 2 0.44 A. keveii 1 1 0.22 A. parasiticus 1 8 1 1 1 12 2.70 A. terreus 1 9 1 20 1 1 33 7.42 A. tubingensis 2 2 0.44 Beauveria bassiana 1 1 0.22 Chaetomium senegalense 1 1 0.22 Cladosporium exile 1 1 0.22 Clonostachys solani 1 1 0.22 Curvularia spicifera 19 1 20 4.49 Fusarium 7 33 37 14 12 14 22 6 20 165 37 F. oxysporum 6 33 36 22 6 103 23.1 F. solani 1 1 14 12 14 20 62 13.9 Macrophomina phaseolina 1 4 1 1 7 1.57 Penicillium olsonii 21 21 4.72 Pseudoallescheria boydii 2 2 0.44 Rhizoctonia solani 1 2 3 0.66 Rhizopus microspores 1 1 0.22 Sarocladium kiliense 2 2 0.44 Scopulariopsis fimicola 1 1 0.22 Stemphylium botryosum 6 1 6 13 2.92 Verticillium fungicola 2 2 0.44 Yeast spp. 1 1 1 1 1 1 8 1 15 3.37 CFUs 1 37 43 44 36 20 62 23 45 21 52 9 18 0 10 24 445 100 No. of genera 1 4 5 6 3 4 3 3 5 6 6 3 3 0 2 4 No. of species 1 6 7 8 5 4 7 4 7 6 9 3 6 0 2 5 Total CFUs 38 87 56 85 66 61 18 34 445 Total genera (18) 4 9 6 5 10 7 3 5 Total species (32) 6 14 9 11 12 10 6 6 Table 1. CFUs (calculated to the total CFUs of each fungus per 25 segments of leaves (L) or roots (R) of each plant sample), Gross total CFUs and % gross total CFUs of fungi isolated from 8 wild medicinal plants collected from El-Kharga Oasis, New Valley Governorate on 1 % glucose-Cz at 25℃ during April 2018.
-
Fungal species Number of isolates tested Preliminary screening Pectinases Cellulases Positive L M H Positive L M H Acremonium 2 2 1 1 2 1 1 Acremonium rutilum 1 1 1 1 1 Acremonium sclerotigenum 1 1 1 1 1 Alternaria 26 20 14 6 6 4 2 A. alternata 8 7 5 2 2 2 A. brassicicola 1 1 1 A. chlamydospora 1 1 1 1 1 A. citri 3 2 2 A. citri macularis 2 2 2 A. longipes 3 3 1 2 1 1 A. tenuissima 8 6 6 Aspergillus 35 27 11 9 7 21 6 7 8 A. flavus 9 7 3 2 2 4 1 2 1 A. fumigatus 2 1 1 2 1 1 A. parasiticus 6 3 2 1 2 2 A. terreus 15 14 5 5 4 12 4 2 6 A. tubingensis 1 Aspergillus AY-1 1 1 1 1 1 Aspergillus AY-2 1 1 1 Beauveria bassiana 1 1 1 Chaetomium senegalense 1 1 1 Cladosporium exile 1 1 1 1 1 Clonostachys solani 1 1 1 1 1 Curvularia spicifera 2 1 1 2 2 Fusarium 23 20 14 3 3 16 13 1 2 F. oxysporum 13 11 8 2 1 11 10 1 F. solani 10 9 6 1 2 5 3 1 1 Macrophomina phaseolina 7 3 3 3 2 1 Penicillium olsonii 1 1 1 1 1 Pseudo allescheria boydii 1 1 1 1 1 Rhizopus microsporus 1 1 1 1 1 Sarocladium kiliense 1 1 1 1 1 Scopulariopsis fimicola 1 Stemphylium botryosum 5 5 3 2 3 3 Verticillium fungicola 1 1 1 1 1 Yeast spp. 10 7 3 1 3 6 4 2 Total isolates 120 94 51 25 18 66 37 16 13 No. of genera 17 16 10 8 8 14 9 6 5 No. of species 31 28 17 15 9 23 14 9 8 Note: H = high producers: ≥ 20 mm, M = moderate: 11-19 mm, L = < 11 mm Table Appendix 1. Preliminary screening of pectinases and cellulases production by endophytic fungi recovered from leaves and roots of eight wild medicinal plants collected from El-Kharga Oasis, the New Valley Governorate, Egypt, during April 2018.
-
Fungal species AUMC no. Pectinase Glucose g/l Production IU/ml Activity IU/ml/min Aspergillus flavus 14274 19.27 107.063 147.8 A. flavus 14289 27.82 154.555 213.4 A. fumigatus 14283 27.44 152.438 210.5 A. terreus* 14278 29.4 163.244 225.4 A. terreus 14287 26.34 146.326 202.0 A. terreus 14293 26.0 144.814 200.0 A. terreus 14279 24.14 134.103 185.2 Cladosporium exile 14294 23.91 132.846 183.4 Curvularia spicifera 14276 23.6 131.016 180.9 C. spicifera 14273 29.0 161.255 222.7 Fusarium solani 14277 23.3 129.472 178.8 F. solani 14292 21.6 119.954 165.6 Macrophomina phaseolina 14272 23.253 129.185 178.4 M. phaseolina 14275 23.0 127.854 176.5 Penicillium olsonii 14295 23.73 131.843 182.0 Yeast sp. 14289 24.85 138.066 190.7 Yeast sp. 14281 22.9 127.275 175.8 * The highest producer showed in bold Table 2. Pectinase production and activity of some endophytic fungi.
-
Fungal species AUMC no. Endoglucanase (CMCase) Glucose g/l Production IU/ml Activity IU/ml/min Aspergillus flavus 14274 0.41 2.282 3.15 A. fumigatus 14283 0.3 1.684 2.32 A. terreus 14278 1.9 10.623 14.7 A. terreus* 14287 2.874 15.966 22.0 A. terreus 14280 2.68 14.895 20.6 A. terreus 14282 1.47 8.164 11.3 A. terreus 14284 1.9 10.579 14.6 A. terreus 14285 1.5 8.328 11.5 A. terreus 14288 1.0 5.575 7.7 Clonostachys rosea 14291 0.24 1.332 1.84 Curvularia spicifera 14276 1.3 7.167 9.9 C. spicifera 14273 1.39 7.711 10.65 Fusarium oxysporum 14290 0.757 4.206 5.8 F. solani 14286 0.7 3.910 5.4 * The highest producer showed in bold Table 3. Endoglucanase (CMCase) production and activity of some endophytic fungi.
-
Fungal species AUMC no. Avicellase Glucose g/l Production IU/ml Activity IU/ml/min Aspergillus flavus 14274 4.213 23.405.5 35.55 A. fumigatus 14283 4.232 23.512 35.71 A. terreus 14278 4.049 22.496 34.17 A. terreus* 14287 5.672 31.51 47.87 A. terreus 14280 4.418 24.51 37.23 A. terreus 14282 3.706 20.588 31.3 A. terreus 14284 3.671 20.395 30.98 A. terreus 14285 3.876 21.53 32.71 A. terreus 14288 4.907 27.258 41.41 Clonostachys rosea 14291 3.466 19.258 29.25 Curvularia spicifera 14276 3.592 19.958 30.32 C. spicifera 14273 3.782 21.008 31.91 Fusarium oxysporum 14290 3.085 17.139 26.0 F. solani 14286 3.709 20605 31.3 * The highest producer showed in bold Table 4. Avicellase production and activity of some endophytic fungi.
Figures
(2)
Tables
(5)