-
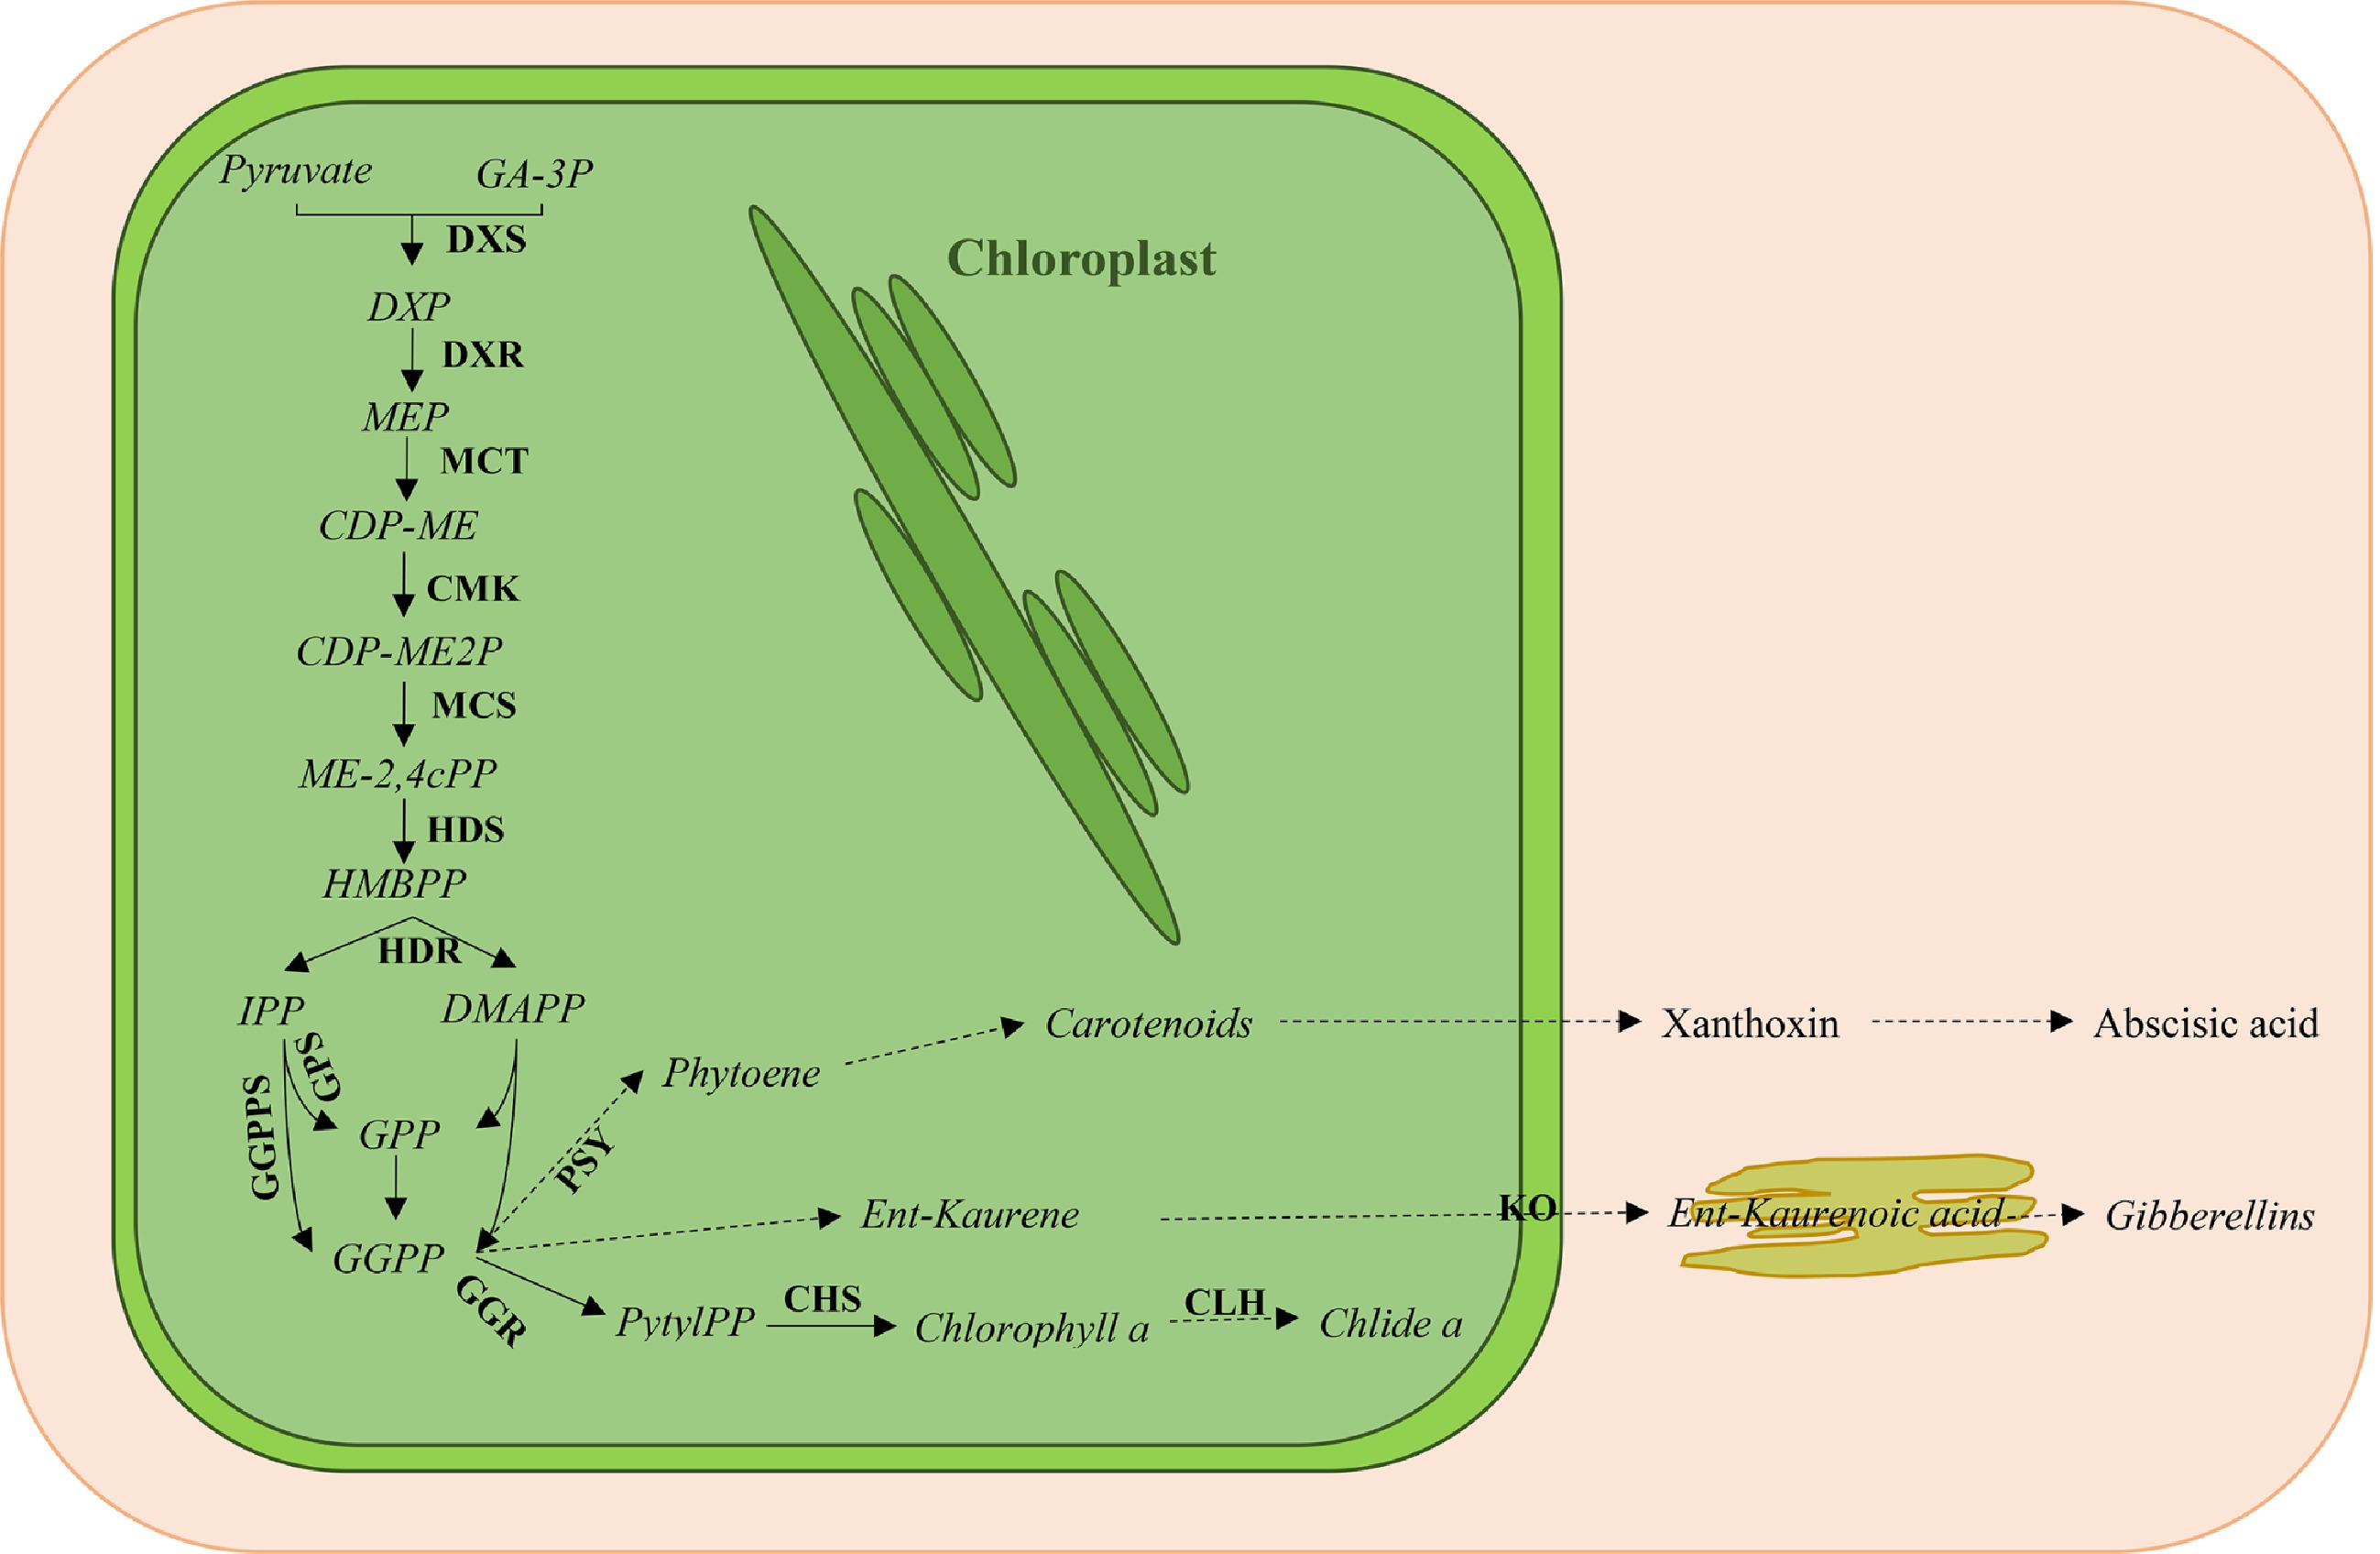
Figure 1. Overview of the plastidic methyl erythritol phosphate (MEP) pathway for isoprenoid biosynthesis. GA-3P, glyceraldehyde-3-phosphate; DXS, 1-deoxy-D-xylulose-5-phosphate synthase; DXP, 1-deoxy-D-xylulose-5-phosphate; DXR, 1-deoxy-D-xylulose reductase; MEP, methylerythritol phosphate; MCT, MEP cytidyltransferase; CDP-ME, 4-(cytidine 5’-diphosphate)-2-C-methylerythritol; CMK, CDP-ME kinase; CDP-ME2P, 2-Phospho-4-(cytidine 5’-diphospho)-2-C-methylerythritol; MCS, 2-C-methylerythritol 2,4-cyclodiphosphate (ME-2,4cPP) synthase; HDS, 1-hydroxy-2-methyl-2-butenyl 4-diphosphate (HMBPP) synthase; HDR, HMBPP reductase; IPP, isopentenyl diphosphate; DMAPP, dimethylallyl diphosphate; GPS, geranyl diphosphate (GPP) synthase; GGPPS, geranylgeranyl diphosphate (GGPP) synthase; PSY, phytoene synthase; GGR, geranylgeranyl reductase; PhytlPP, phytyl diphosphate; CHS, chlorophyll synthase; CLH, chlorophyllase; KO, ent-kaurene oxidase. Solid lines indicate a single enzymatic step, and dashed lines indicate several enzymatic steps.
-
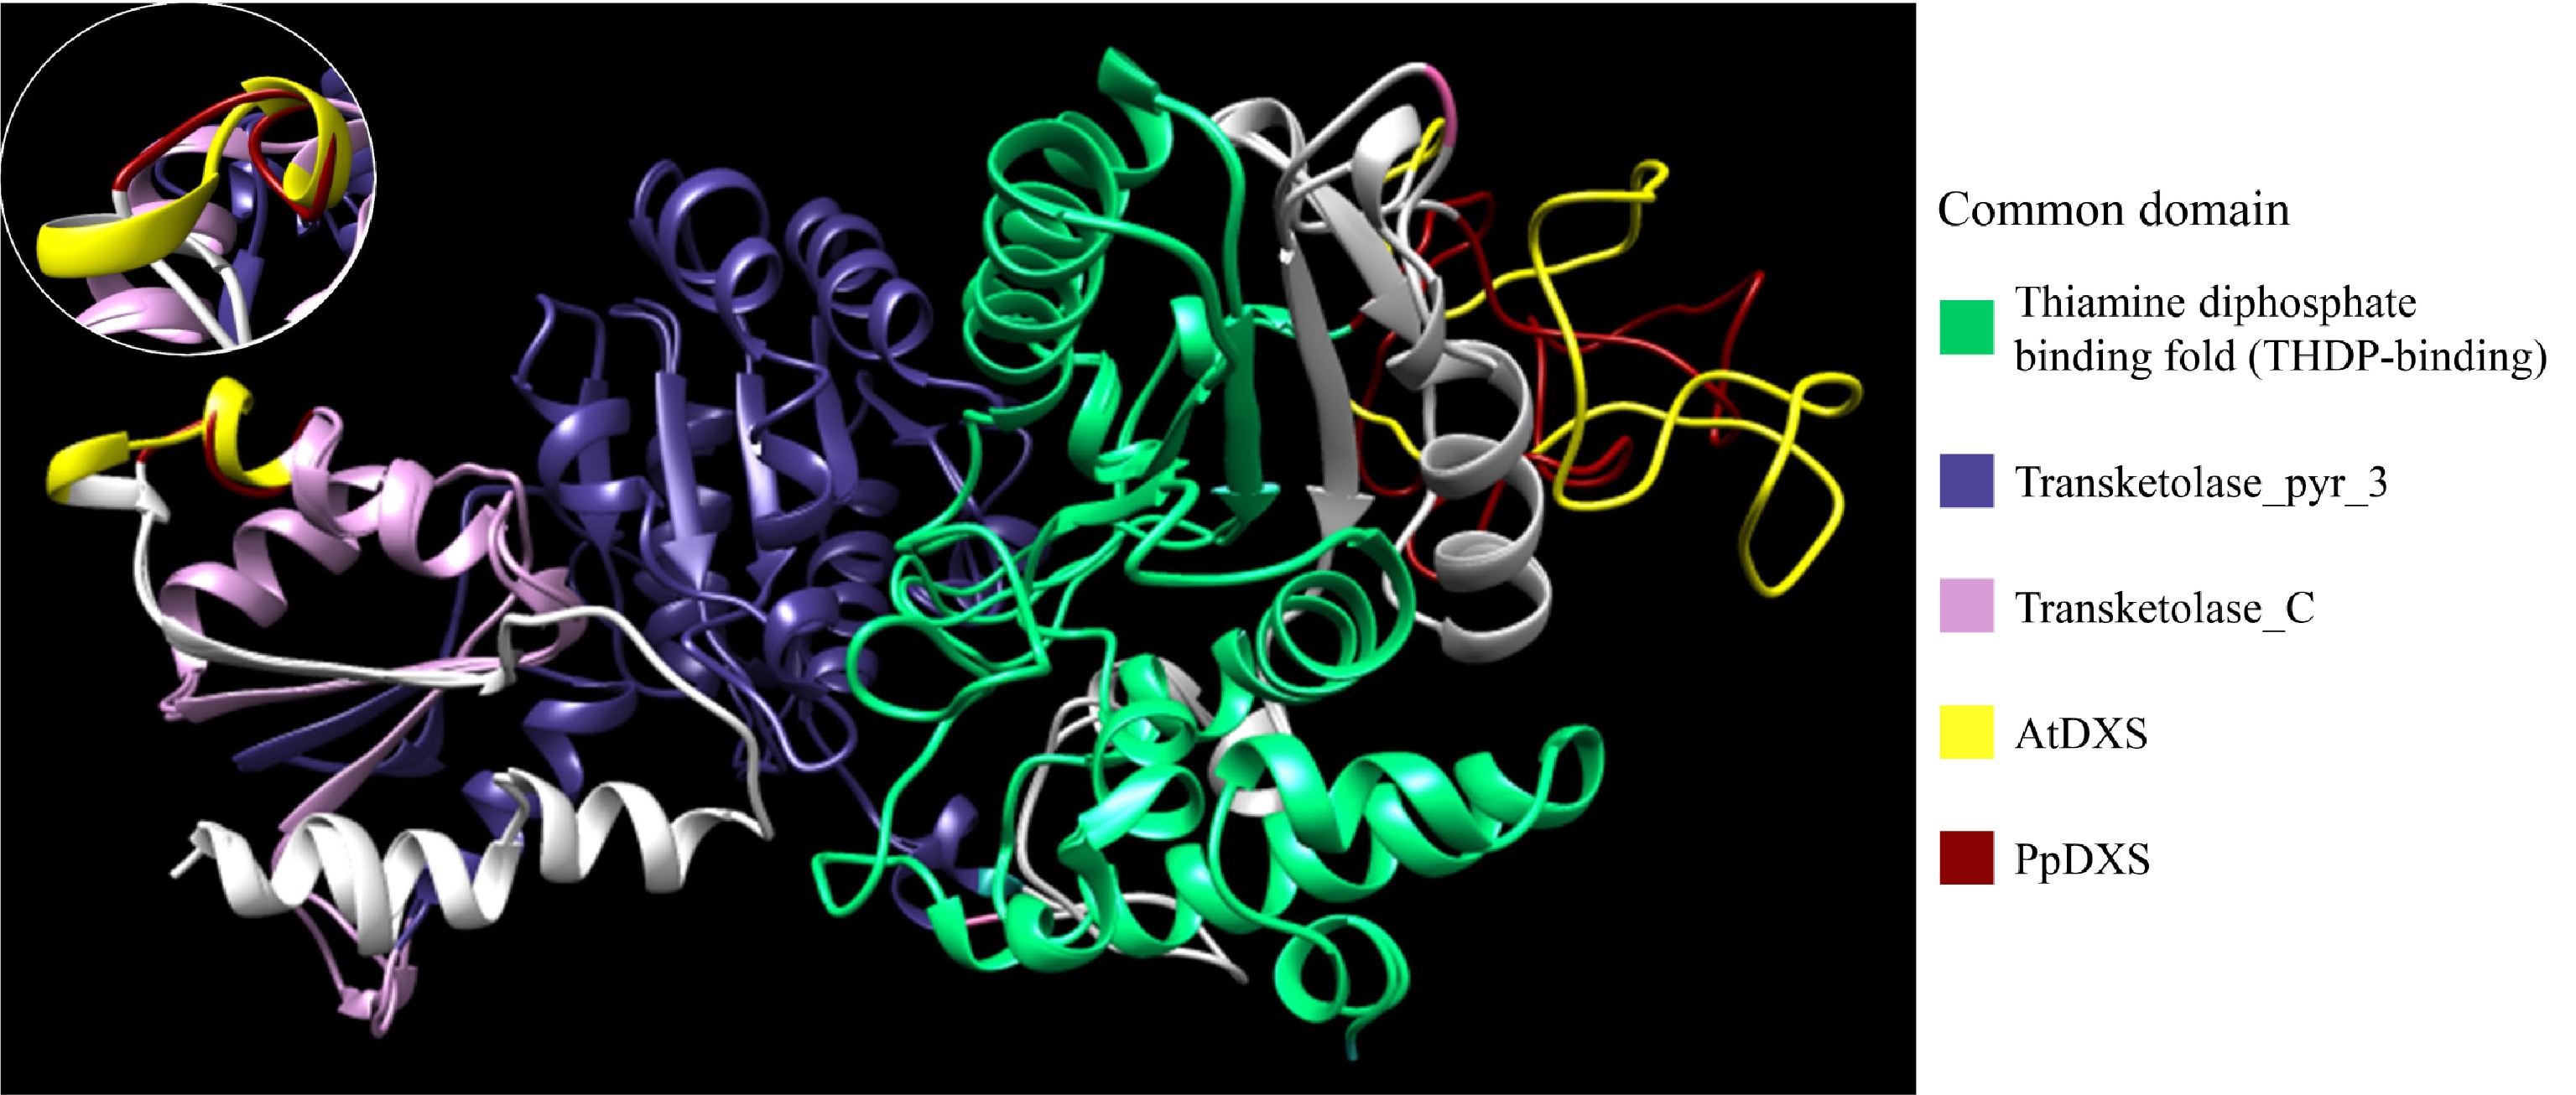
Figure 2. Expasy structure prediction models of PpDXS and AtDXS. Model images were generated using Chimera and conserved domains were analyzed using the InterPro server. Residues 62–259 (PpDXS) and 74–273 (AtDXS) represent the THDP-binding domain (green). Residues 387–552 (PpDXS) and 399–564 (AtDXS) represent the thansketolase_pyr_3 domain (blue). Residues 566–698 (PpDXS) and 578–701 (AtDXS) represent the thansketolase_C domain (pink). Differences between the PpDXS and AtDXS model are shown in red (PpDXS) and yellow (AtDXS).
-
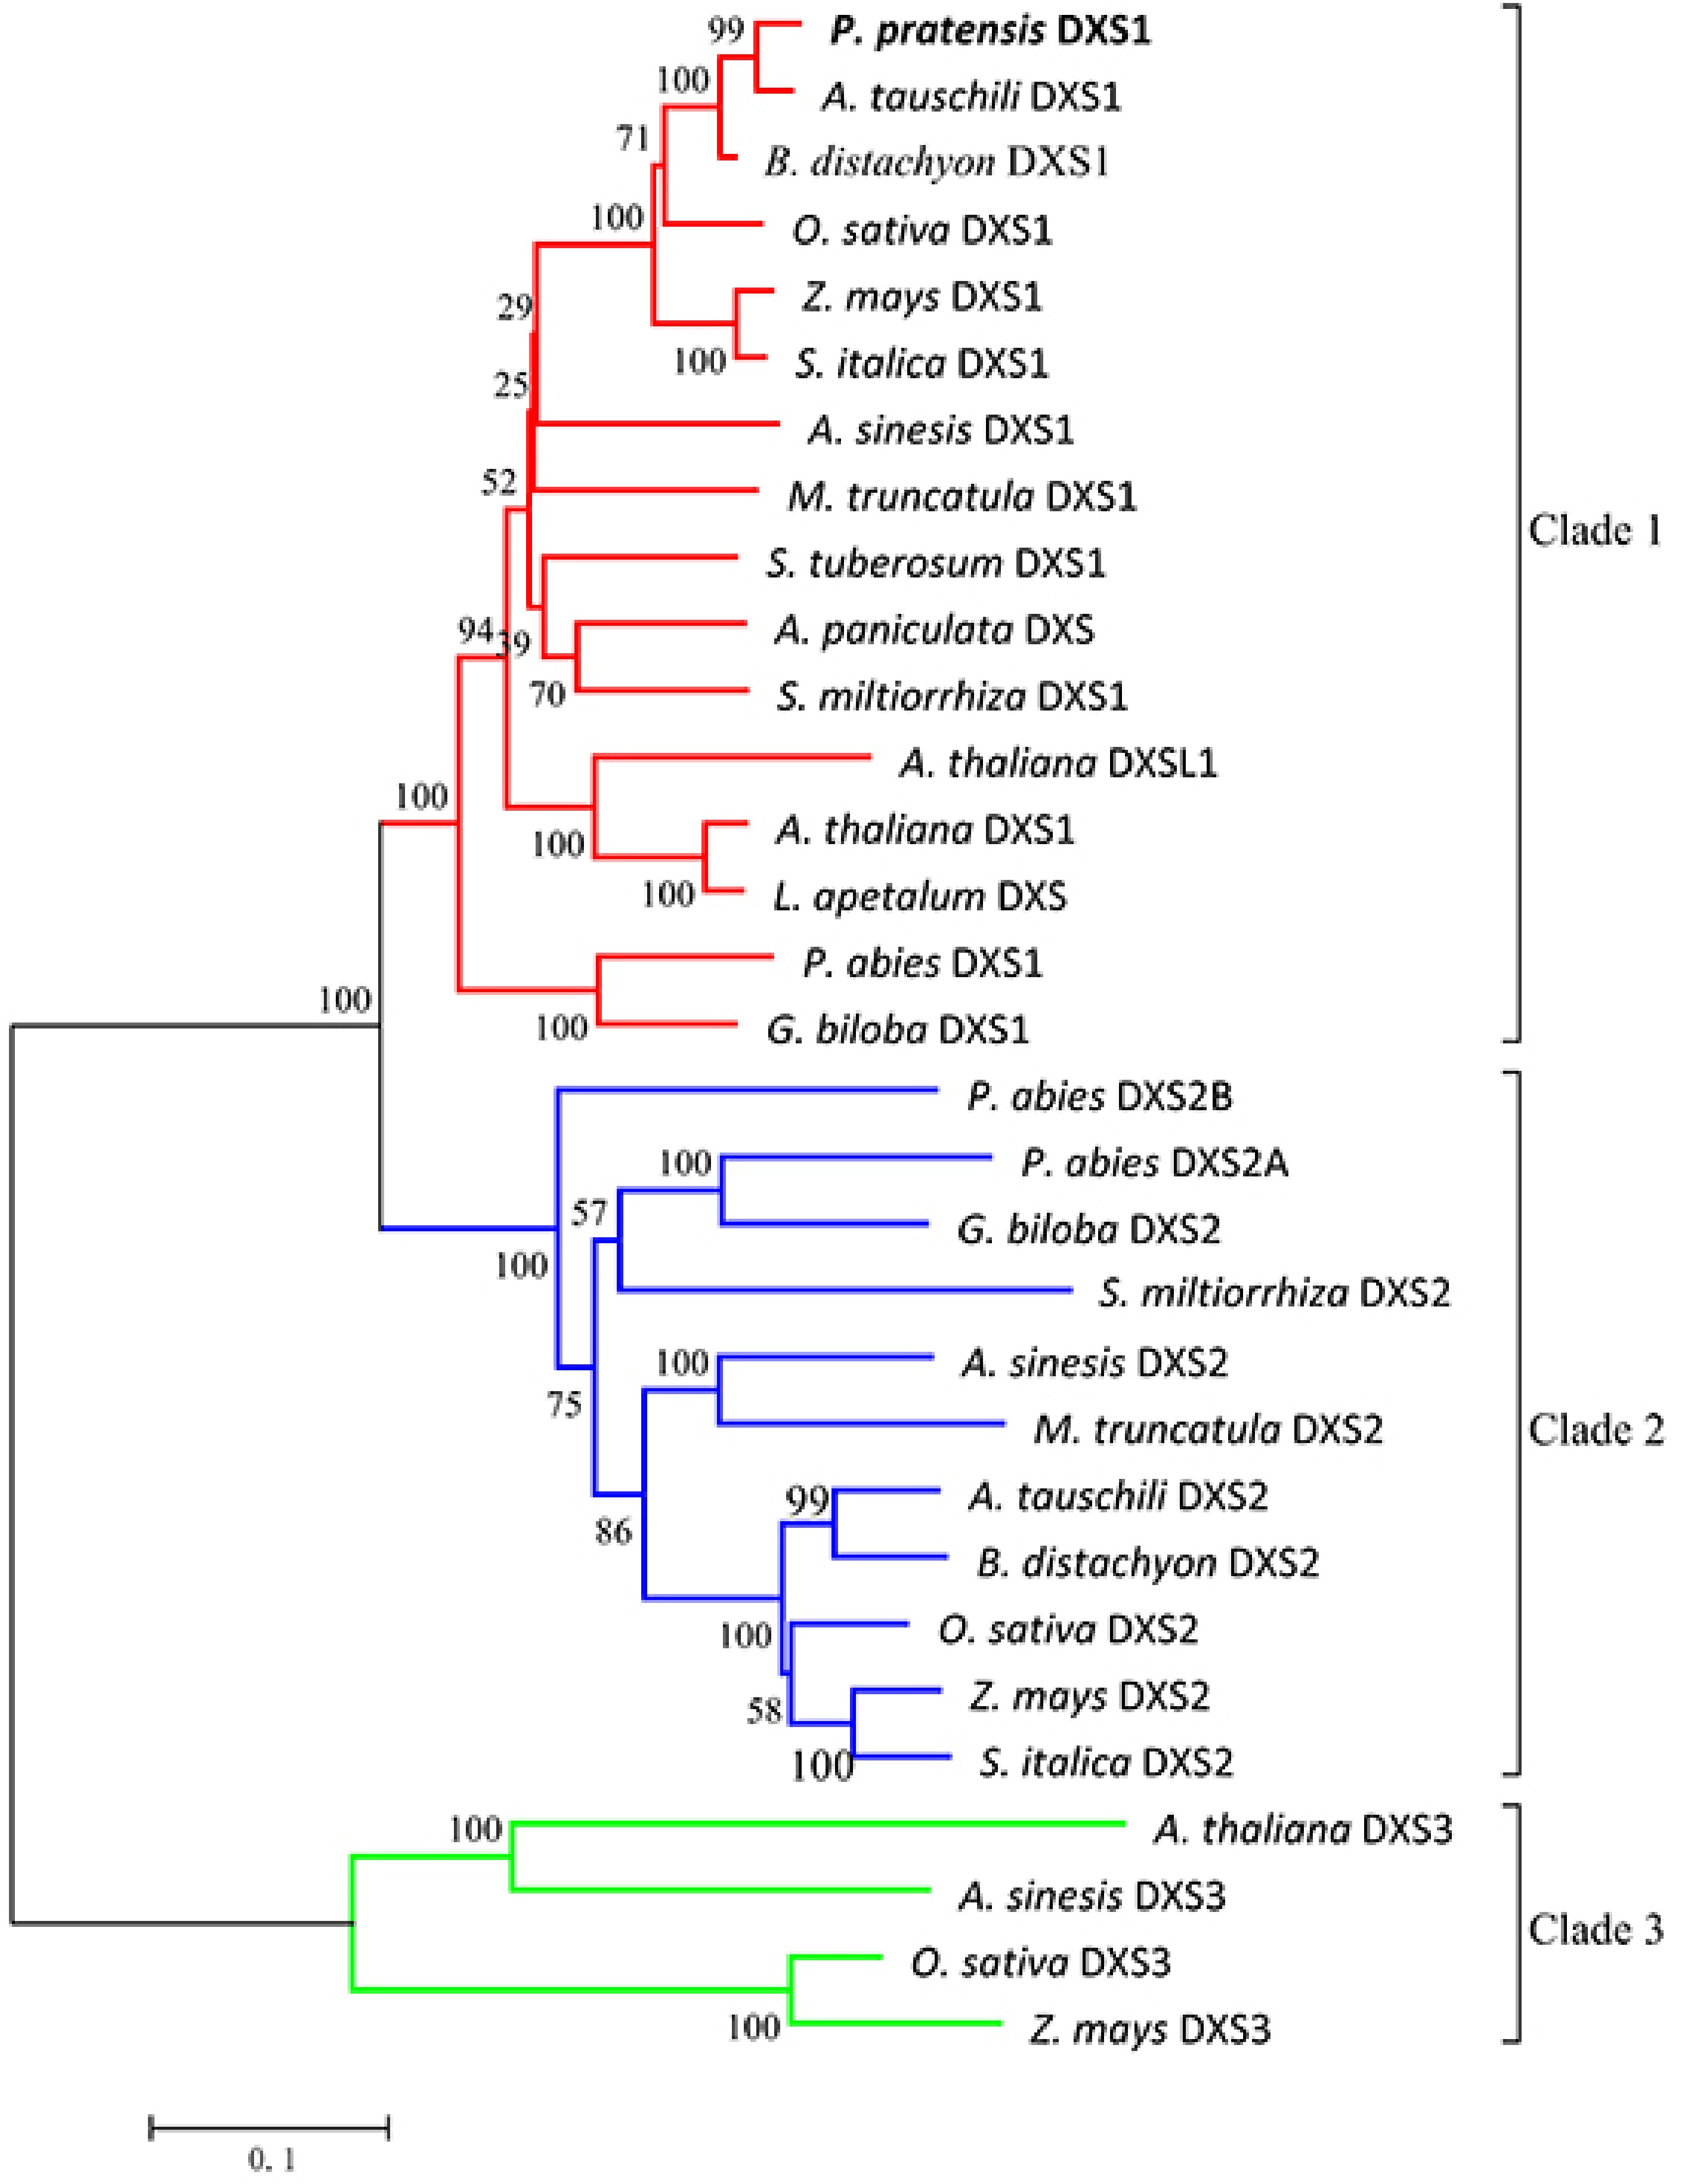
Figure 3. Phylogenetic tree of plant DXS proteins. The tree was constructed with the neighbor-joining method and the JTT model using MEGA 5.0 software with 1,000 bootstrap values. The TAIR or GenBank accession numbers of DXS amino acid sequences used for phylogenetic analysis are as follows: Arabidopsis thaliana (DXS1 clade At4g15560, DXSL1 clade At3g21500, DXS3 clade At5g11380); Oryza sativa (DXS1 clade NP_001055524.1, DXS2 clade NP_001059086.1, DXS3 clade BAA83576.1); Zea mays (DXS1 clade NP_001157805.1, DXS2 clade NP_001295426.1, DXS3 clade HQ113384.1); Aquilaria sinensis (DXS1 clade AFU75321.1, DXS2 clade AHI62962.1, DXS3 clade AFU75320); Andrographis paniculata (DXS, AAP14353.1); Lepidium apetalum (DXS, KU314760.1); Medicago truncatula (DXS1 clade CAD22530.1, DXS2 clade CAN89181.1); Picea abies (DXS1 clade ABS50518.1, DXS2A clade ABS50519.1, DXS2B clade ABS50520.1); Salvia miltiorrhiza (DXS1 clade ACF21004.1, DXS2 clade ACQ66107.1); Solanum tuberosum (DXS1 clade NP_001275130.1); Ginkgo biloba (DXS1 clade AAS89341.1, DXS2 clade AAR95699.1); Aegilops tauschili (DXS1 clade XP_020161542.1, DXS2 clade XP_020164020.1); Brachypodium distachyon (DXS1 clade XP_003568467.1, DXS2 clade XP_003557443.1); Setaria italica (DXS1 clade XP_004962111.1, DXS2 clade XP_004955719.1). Poa pratensis (DXS1 clade MG257788).
-

Figure 4. PpDXS1 promoter from P. pratensis. Putative cis elements are labeled as shown, Element positions are shown proportional to the full length of the promoter.
-
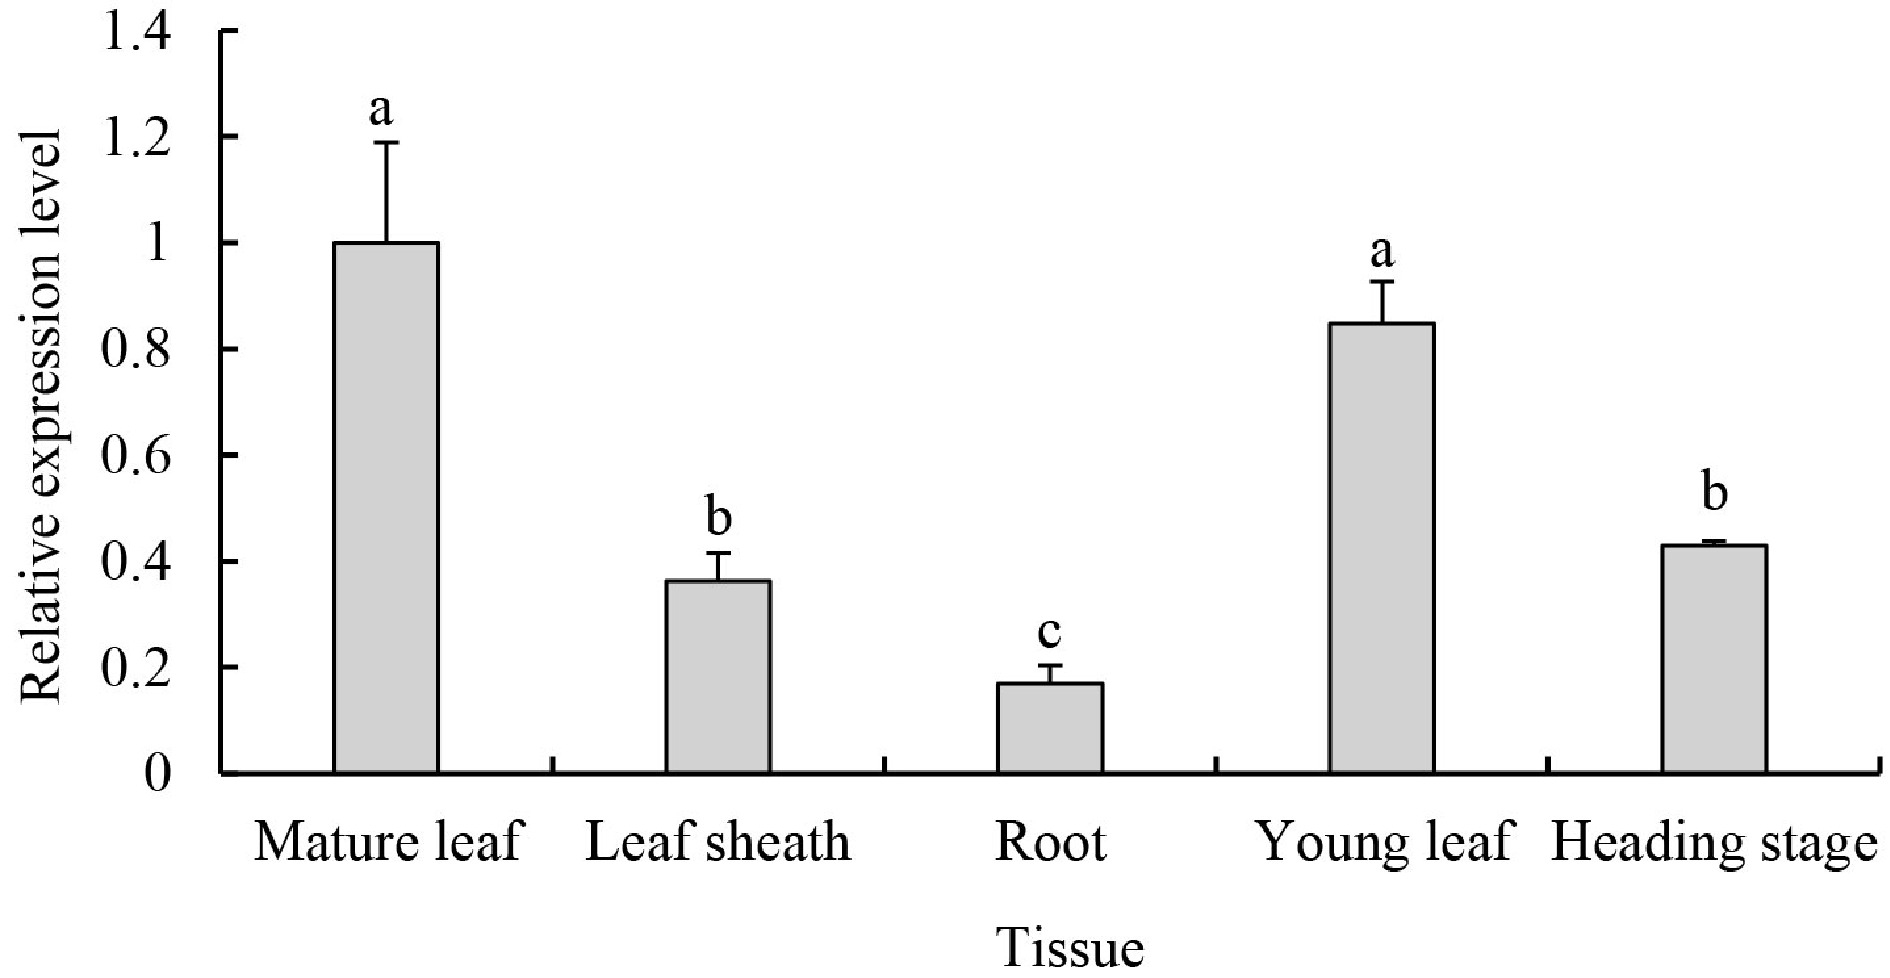
Figure 5. PpDXS1 expression analysis in P. pratensis. Quantitative RT-PCR analysis of PpDXS1 gene expression. Fully expanded leaves (named as mature leaf), leaf sheaths and roots at vigorous growth stage were used for gene organ/tissue-specific expression analysis. For the time-series gene expression analysis, young leaves at early growth stage (named as young leaf), mature leaves at vigorous growth stage (similarly named as mature leaf), and old leaves at heading stage (named heading stage) were used. All qRT-PCR reactions were performed from triplicate biological samples. The
$2^{-\Delta \Delta} $ Cᴛ method was used to calculate the fold expression relative to the control (mature leaf). Means of three replicates ± standard error is shown. Bars superscripted with different letters are significantly different at p < 0.05. -
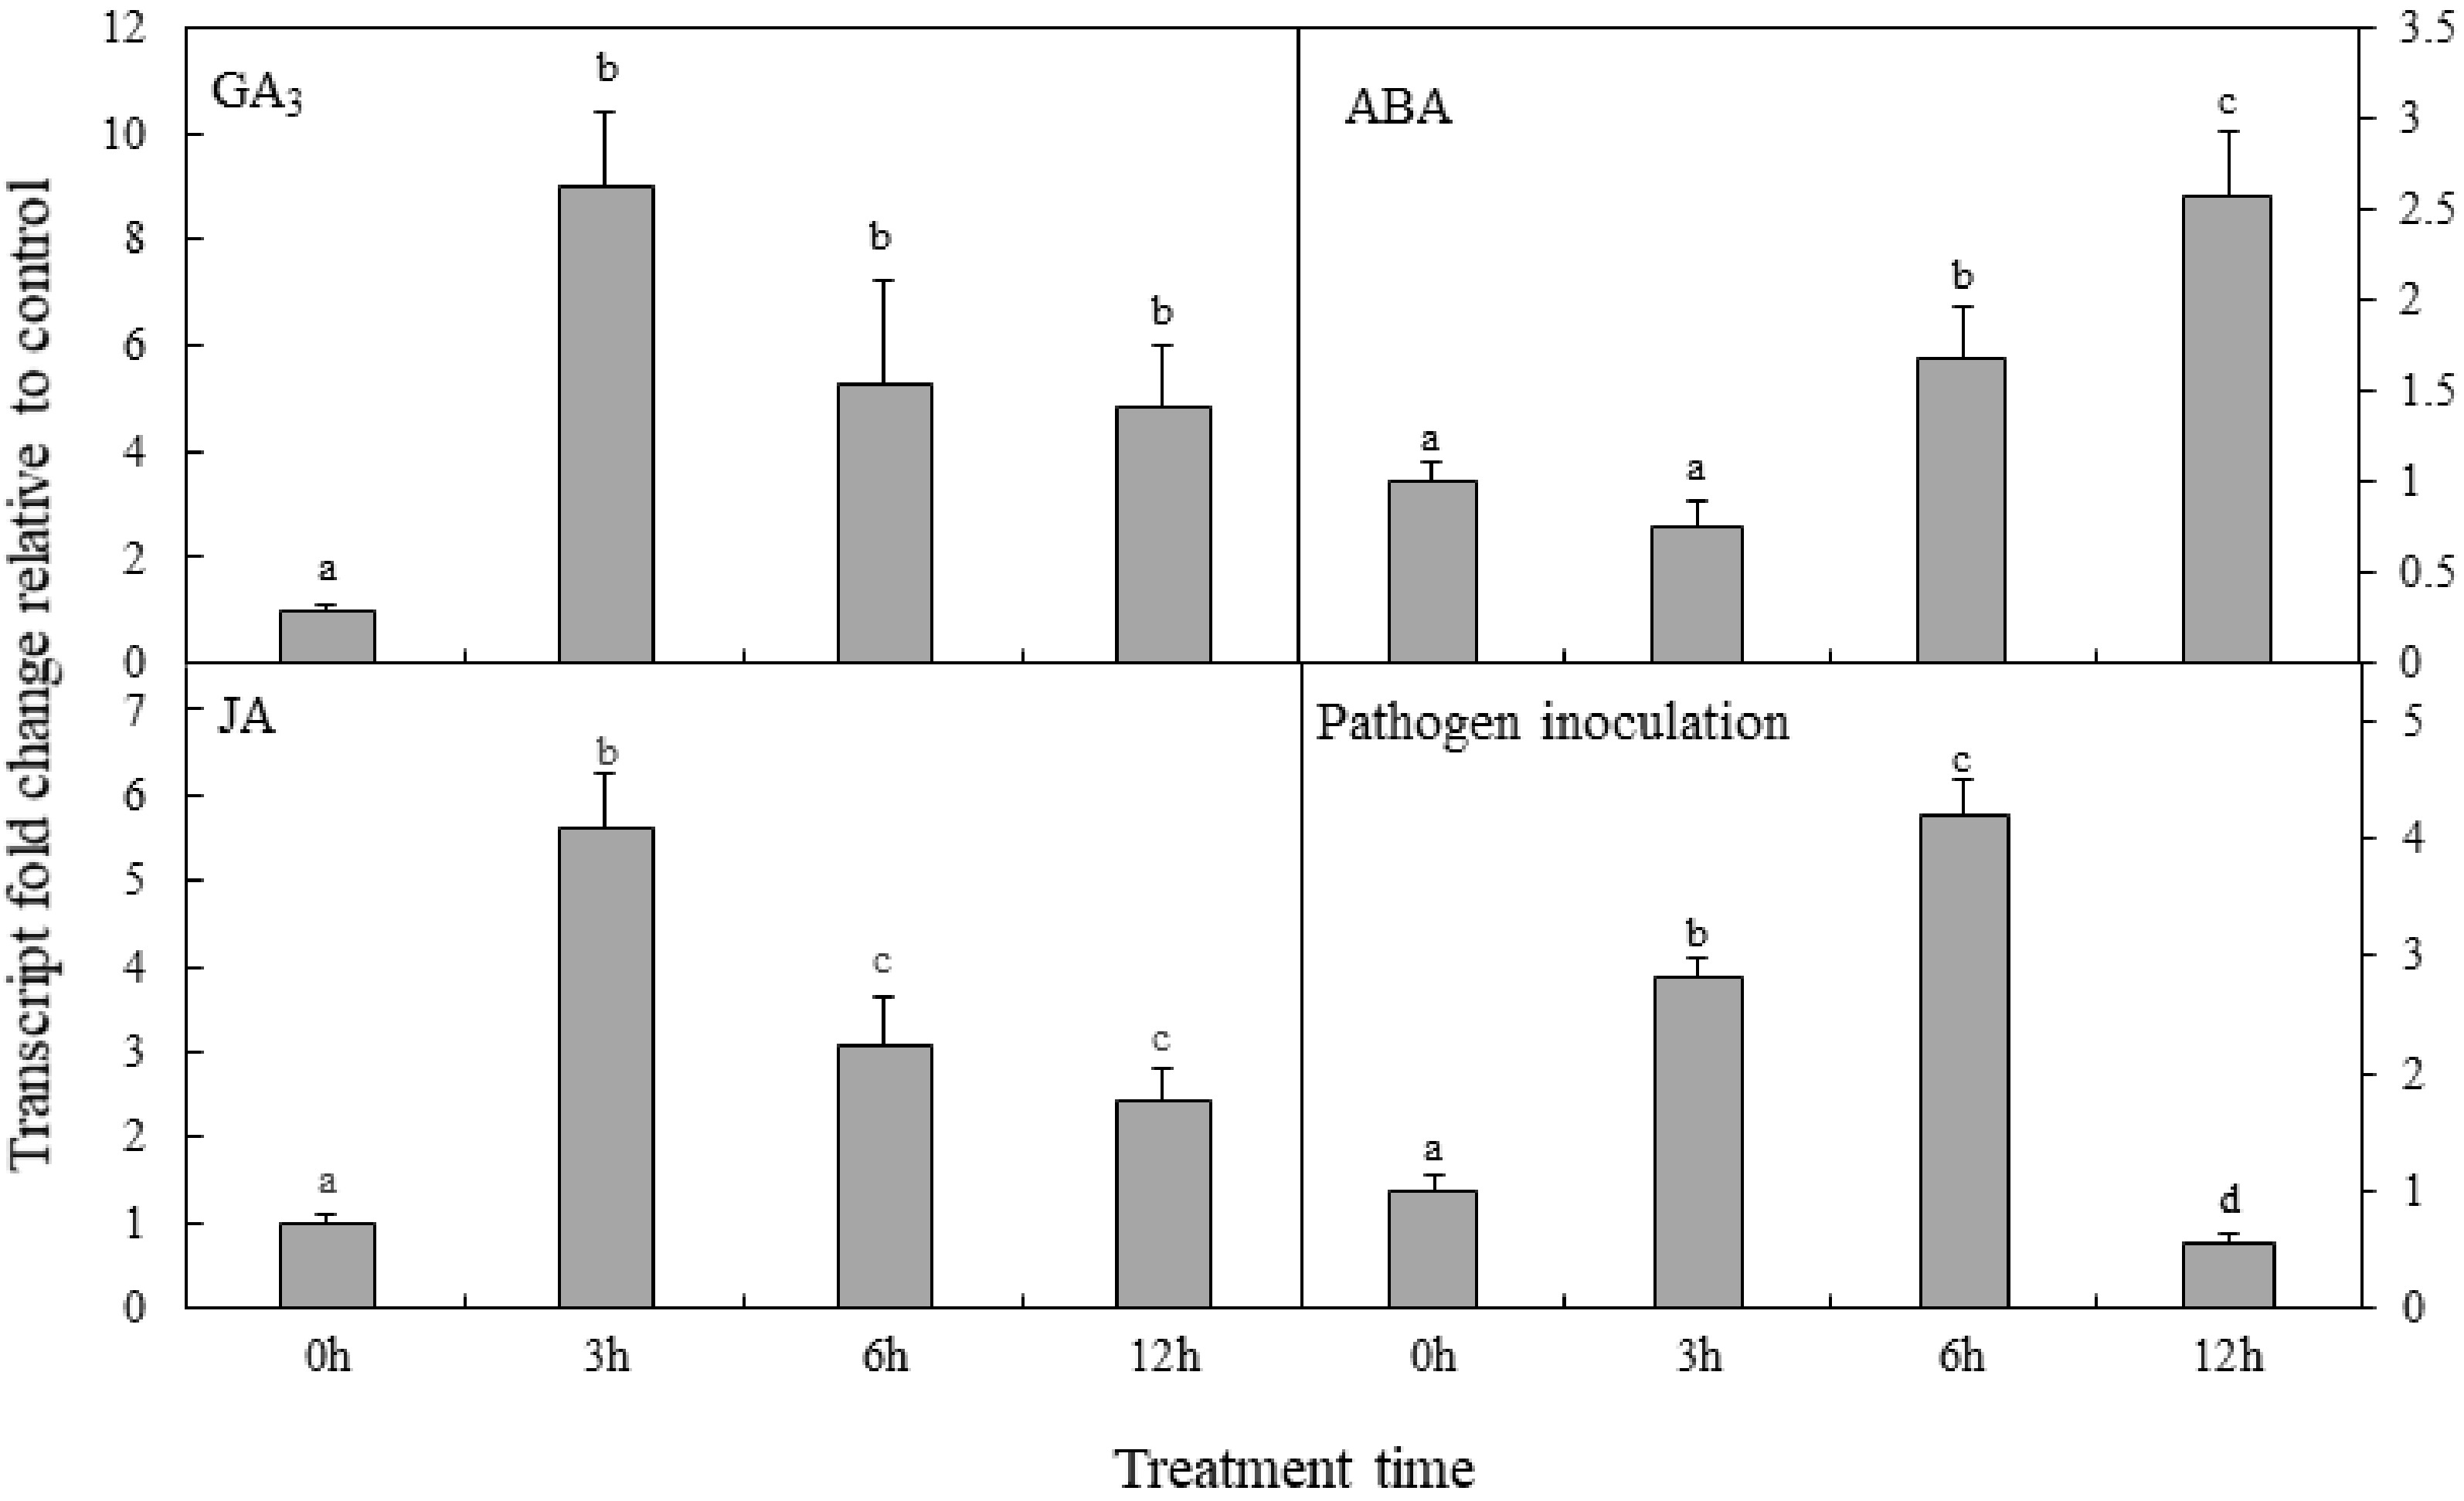
Figure 6. Analysis of PpDXS1 expression after exogenous phytohormone treatment or pathogen inoculation in P. pratensis. Quantitative real-time PCR analysis of relative PpDXS1 expression after foliar exposure to gibberellic acid (GA3), abscisic acid (ABA), jasmonate (JA), and pathogen inoculation. All qRT-PCR reactions were performed from triplicate biological samples. The
$2^{-\Delta \Delta} $ Cᴛ method was used to calculate the fold expression relative to the control (0h-point). Mean of three replicates ± standard error is shown. Bars superscripted with different letters are significantly different at p < 0.05. -
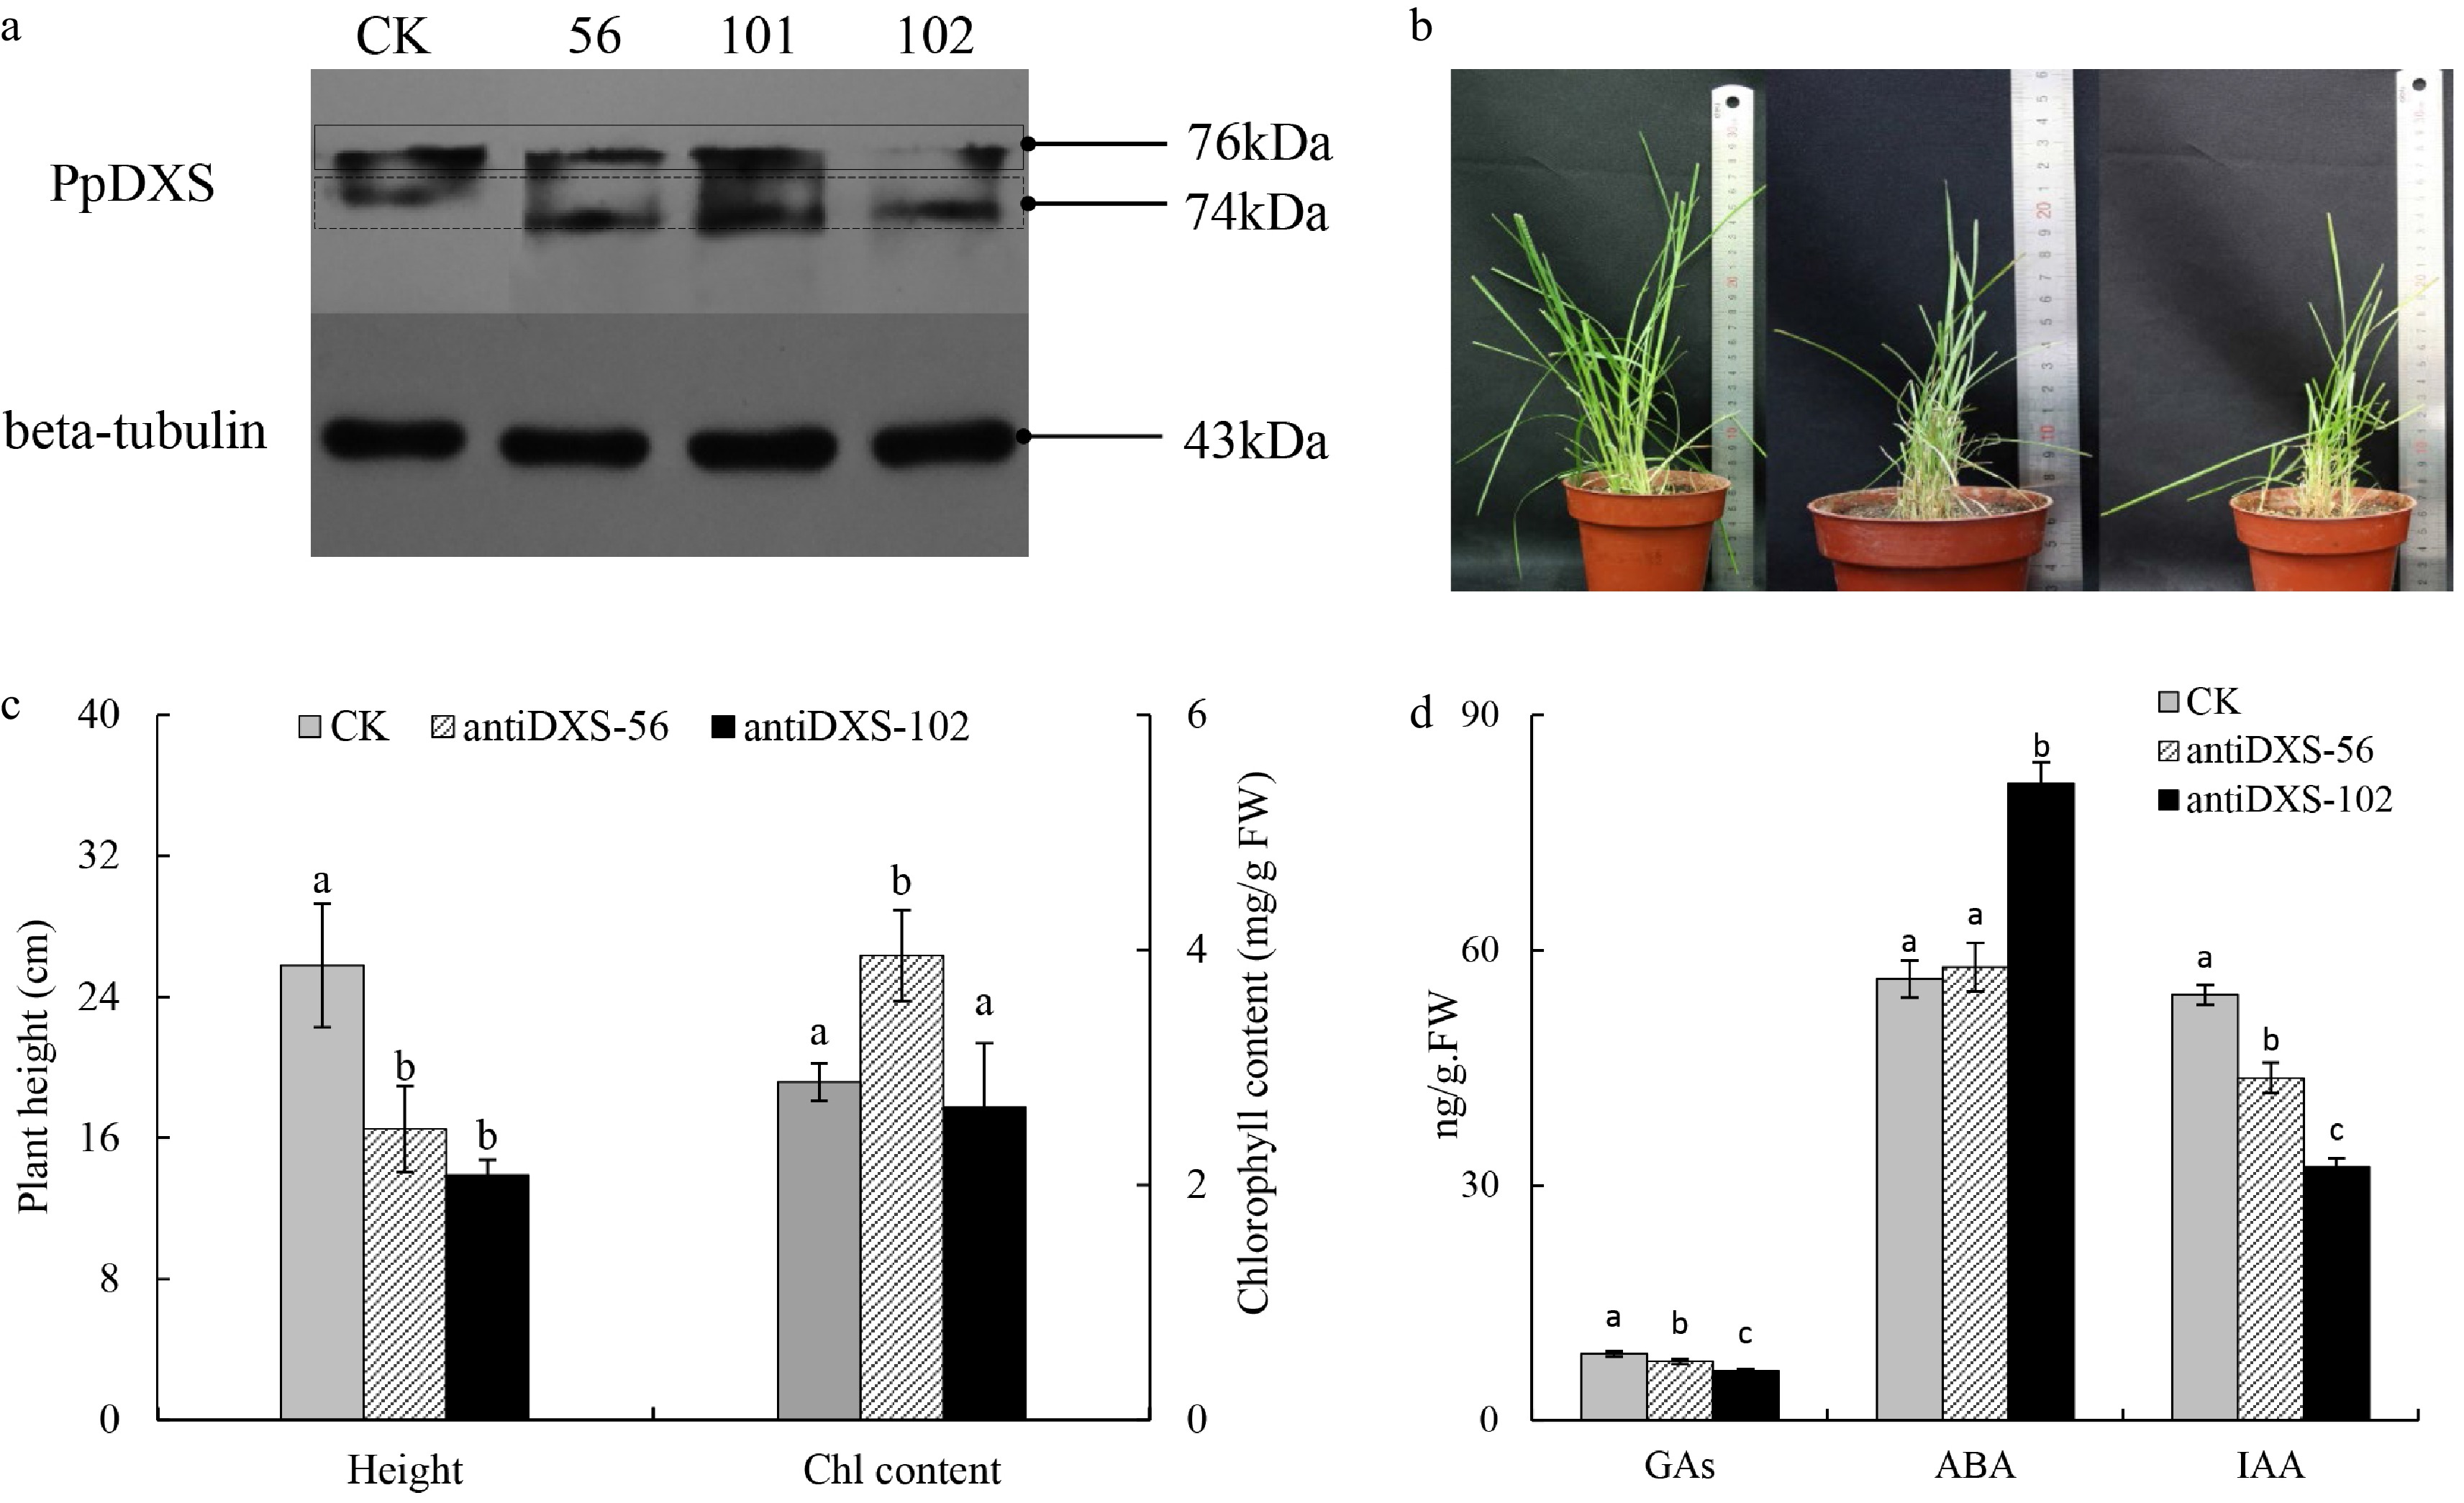
Figure 7. Comparison of CK and transgenic lines underexpressing PpDXS1 in Poa pratensis. (a) Western analysis of PpDXS1 protein levels in mature leaves of CK and antiDXS1-56, -101, and -102. (b) The photos of CK, antiDXS1-56 and antiDXS1-102 transgenic plants (left to right). (c) Plant height and total chlorophyll content of CK, antiDXS1-56 and antiDXS1-102 transgenic plants. Bars superscripted with different letters are significantly different at p < 0.05. (d) Phytohormone content of CK, antiDXS1-56 and antiDXS1-102 transgenic plants. Means of three replicates ± standard error is shown. The data were subjected to ANOVA test to determine the LSD between CK (control) and transgenic lines (antiDXS1-56 and antiDXS1-102) at p < 0.05.
-
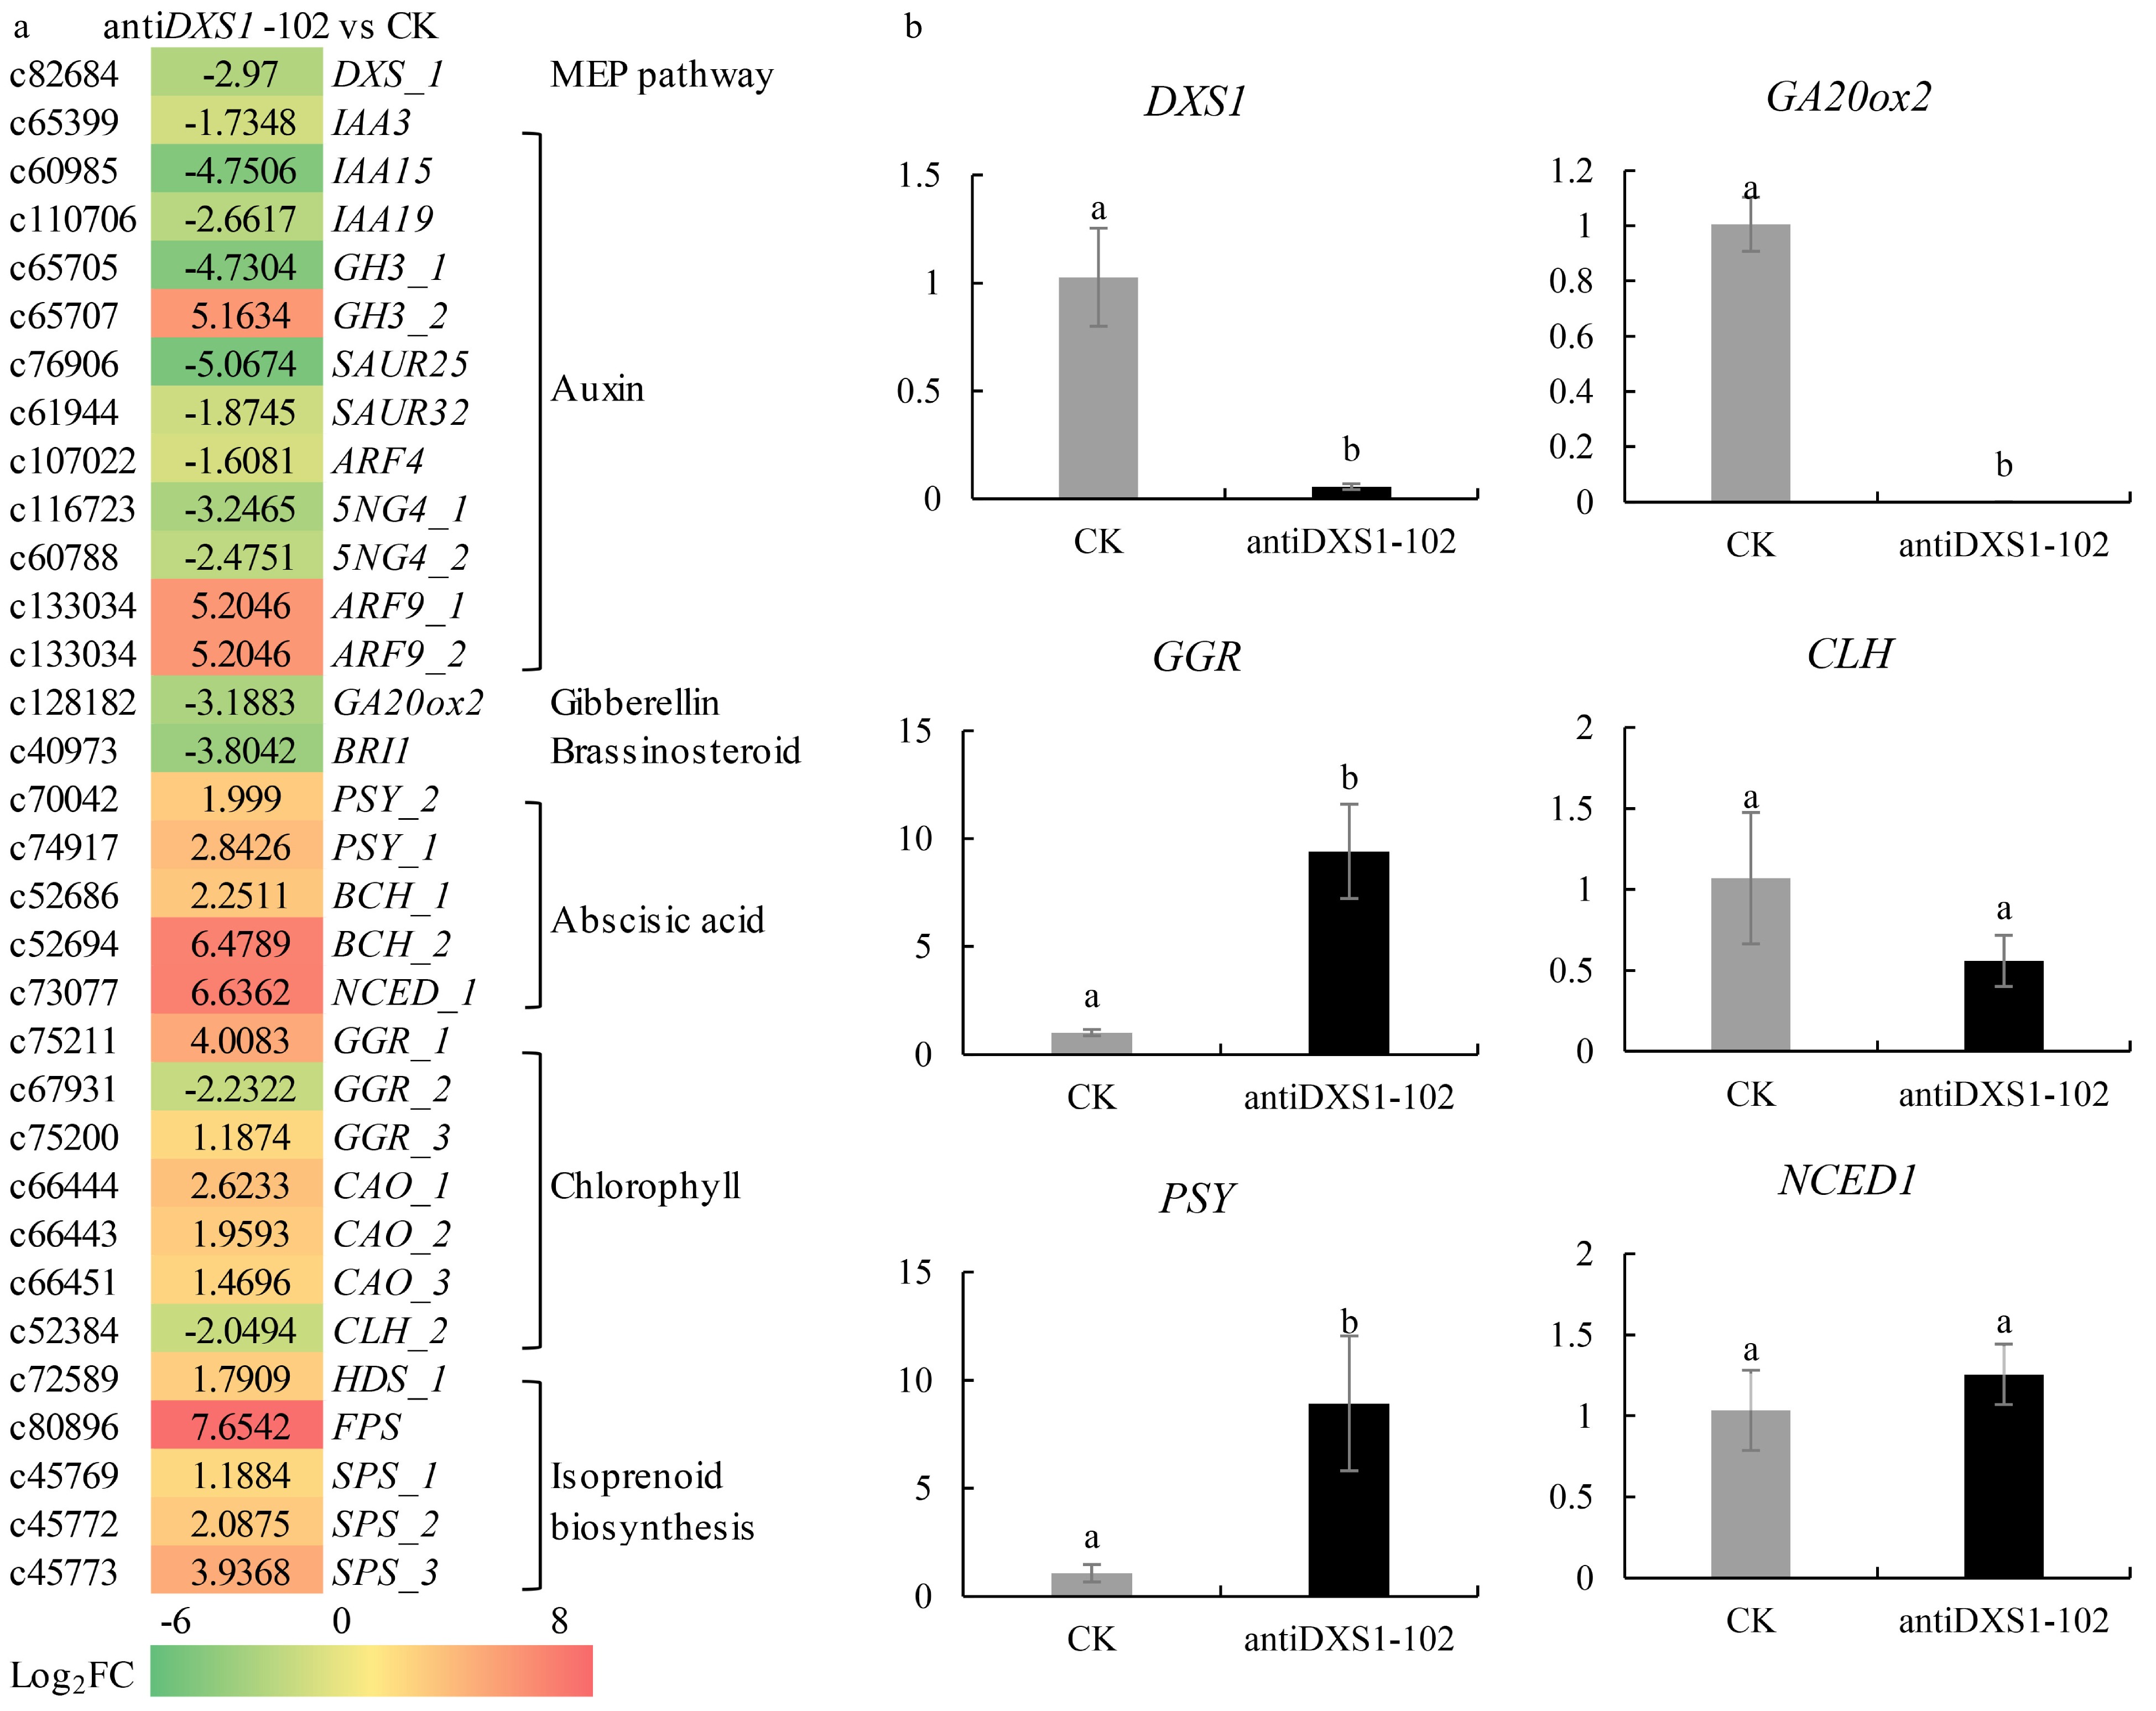
Figure 8. Differential expression analysis of related genes in CK and antiDXS1-102. (a) Heatmaps of differentially expressed genes (DEGs). DXS, 1-deoxy-D-xylulose-5-phosphate synthase; IAA3/15/19, auxin-responsive protein 3/15/19; GH3, indole-3-acetic acid-amido synthetase GH3 gene family; SAUR25/32, auxin-responsive SAUR protein family; ARF9, auxin responsive factor 9; GA20ox2, gibberellin 20 oxidase 1; BRI1, brassinosteroid-insensitive 1; PSY, phytoene synthase; BCH, beta-carotene hydroxylase; NCED1, 9-cis epoxycarotenoid dioxygenase 1; GGR, geranylgeranyl reductase; CLH, chlorophyllase; CAO, chlorophyllide a oxygenase; HDS, 1-hydroxy-2-methyl-2-butenyl 4-diphosphate (HMBPP) synthase; FPS, farnesyl diphosphate synthase; SPS, solanesyl-diphosphate synthase. Upregulation and downregulation in antiDXS1-102 compared to CK are shown using a color scale for log2 (antiDXS1-102/WT ratio) values. On the left side of the color block is the Unigene ID from the transcriptome database, and on the right side is the gene annotation in the database. (b) qRT-PCR results of selected six DEGs. The transformed line of empty vector (CK) is the control and the value is one. The
$2^{-\Delta \Delta} $ Cᴛ method was used to calculate the value of fold change compared to the control (CK, the transformed line of empty vector). All qRT-PCR reactions were performed from triplicate biological samples. Mean of three replicates ± 1 standard error is shown. Bars with superscript letters are significantly different at p < 0.05. -
Primer name Sequence (5'-3') Description 3'-GSP CGACGACCTCATCACCATCCTCCG 3'-RACE primer 5'-GSP GTCTTGGTGCCCTTGACCTCCCG 5'-RACE-out-primer 5'-NEST TCCGCCTATTTGCTTCGTCACTCC 5'-RACE-in-primer DXS-F ATGGCGCTCTCGACGACGTTCT ORF-F DXS-R CTAAACATTCTGCACCGTCATG ORF-R antiDXS-F(BstEII) GGGTNACCATGGCGCTCTCGACGACGTTCT Primers for vector construction antiDXS-R(BglII) GAAGATCTAACATTCTGCACCGTCATG SP1 CCGTCGGTCTGCCGCATCGTC Primer for promoter amplification SP2 TCGCTTGTCCTGAGGGGTGTTG SP3 TGAGGGACAGGTTCTTCATGTGGA Table 1. Nucleotide sequences of gene-specific primers
Figures
(8)
Tables
(1)