ARTICLE   Open Access    

Underexpression of PpDXS1 gene decreased plant height and resulted in altered accumulation of phytohormones in Kentucky bluegrass

More Information
  • 1-deoxy-D-xylulose-5-phosphate synthase (DXS) catalyzes the first and rate-limiting step of the plastidic 2-C-methyl-D-derythritol-4-phosphate (MEP) pathway which regulates the synthesis of terpenoids, such as gibberellins, abscisic acid, and chlorophyll. The objective of this study was to determine the functional role of PpDXS1 in plant growth and development in Kentucky bluegrass (Poa pratensis L.). The PpDXS1 gene has a 2139 bp open reading frame that encodes a polypeptide of 712 amino acids with a calculated molecular weight of 76.7 kDa. PpDXS1 gene expression was the highest in leaves. Moreover, the PpDXS1 promoter contained several hormone response elements and gene expression was induced by exogenous treatment with gibberellin, abscisic acid, jasmonate, and pathogen infection. Functional analysis indicated that underexpression of PpDXS1 gene in Poa pratensis decreased plant height and endogenous gibberellin and indole acetic acid production, but promoted abscisic acid accumulation. Furthermore, transcriptome analysis and qRT-PCR results showed that the expression levels of related genes involved in the phytohormone biosynthesis and signal transduction were differentially regulated by PpDXS1 in transgenic Poa pratensis. Overall, these results indicated that PpDXS1 has strong effects on plant height and accumulation of phytohormones, and provided a preliminary understanding of molecular characterization, expression and function of PpDXS1 in Poa pratensis.
  • Crops require a variety of nutrients for growth and nitrogen is particularly important. Nitrogen is the primary factor limiting plant growth and yield formation, and it also plays a significant role in improving product quality[14]. Nitrogen accounts for 1%−3% of the dry weight of plants and is a component of many compounds. For example, it is an important part of proteins, a component of nucleic acids, the skeleton of cell membranes, and a constituent of chlorophyll[5,6]. When the plant is deficient in nitrogen, the synthesis process of nitrogen-containing substances such as proteins decrease significantly, cell division and elongation are restricted, and chlorophyll content decreases, and this leads to short and thin plants, small leaves, and pale color[2,7,8]. If nitrogen in the plant is in excess, a large number of carbohydrates will be used for the synthesis of proteins, chlorophyll, and other substances, so that cells are large and thin-walled, and easy to be attacked by pests and diseases. At the same time, the mechanical tissues in the stem are not well developed and are prone to collapse[3,8,9]. Therefore, the development of new crop varieties with both high yields and improved nitrogen use efficiency (NUE) is an urgently needed goal for more sustainable agriculture with minimal nitrogen demand.

    Plants obtain inorganic nitrogen from the soil, mainly in the form of NH4+ and nitrate (NO3)[1013]. Nitrate uptake by plants occurs primarily in aerobic environments[3]. Transmembrane proteins are required for nitrate uptake from the external environment as well as for transport and translocation between cells, tissues, and organs. NITRATE TRANSPORTER PROTEIN 1 (NRT1)/PEPTIDE TRANSPORTER (PTR) family (NPF), NRT2, CHLORIDE CHANNEL (CLC) family, and SLOW ACTIVATING ANION CHANNEL are four protein families involved in nitrate transport[14]. One of the most studied of these is NRT1.1, which has multiple functions[14]. NRT1.1 is a major nitrate sensor, regulating many aspects of nitrate physiology and developmental responses, including regulating the expression levels of nitrate-related genes, modulating root architecture, and alleviating seed dormancy[1518].

    There is mounting evidence that plant growth and development are influenced by interactions across numerous phytohormone signaling pathways, including abscisic acid, gibberellins, growth hormones, and cytokinins[3,19,20]. To increase the effectiveness of plant nitrogen fertilizer application, it may be possible to tweak the signaling mediators or vary the content of certain phytohormones. Since the 1930s, research on the interplay between growth factors and N metabolism has also been conducted[3]. The Indole acetic acid (IAA) level of plant shoots is shown to decrease in early studies due to N shortage, although roots exhibit the reverse tendency[3,21]. In particular, low NO3 levels caused IAA buildup in the roots of Arabidopsis, Glycine max, Triticum aestivum, and Zea mays, indicating that IAA is crucial for conveying the effectiveness of exogenous nitrogen to the root growth response[20,22,23].

    Studies have shown that two families are required to control the expression of auxin-responsive genes: one is the Auxin Response Factor (ARF) and the other is the Aux/IAA repressor family[2426]. As the transcription factor, the ARF protein regulates the expression of auxin response genes by specifically binding to the TGTCNN auxin response element (AuxRE) in promoters of primary or early auxin response genes[27]. Among them, rice OsARF18, as a class of transcriptional repressor, has been involved in the field of nitrogen utilization and yield[23,28]. In rice (Oryza sativa), mutations in rice salt tolerant 1 (rst1), encoding the OsARF18 gene, lead to the loss of its transcriptional repressor activity and up-regulation of OsAS1 expression, which accelerates the assimilation of NH4+ to Asn and thus increases N utilization[28]. In addition, dao mutant plants deterred the conversion of IAA to OxIAA, thus high levels of IAA strongly activates OsARF18, which subsequently represses the expression of OsARF2 and OsSUT1 by directly binding to the AuxRE and SuRE promoter motifs, resulting in the inhibition of carbohydrate partitioning[23]. As a result, rice carrying the dao has low yields.

    Apples (Malus domestica) are used as a commercially important crop because of their high ecological adaptability, high nutritional value, and annual availability of fruit[29]. To ensure high apple yields, growers promote rapid early fruit yield growth by applying nitrogen. However, the over-application of nitrogen fertilizer to apples during cultivation also produces common diseases and the over-application of nitrogen fertilizer is not only a waste of resources but also harmful to the environment[29]. Therefore, it is of great significance to explore efficient nitrogen-regulated genes to understand the uptake and regulation of nitrogen fertilizer in apples, and to provide reasonable guidance for nitrogen application during apple production[30]. In this study, MdARF18 is identified which is a key transcription factor involved in nitrate uptake and transport in apples and MdARF18 reduces NO3 uptake and assimilation. Further analysis suggests that MdRF18 may inhibit the transcriptional level of MdNRT1.1 promoter by directly binding to its TGTCTT target, thus affecting normal plant growth.

    The protein sequence of apple MdARF18 (MD07G1152100) was obtained from The Apple Genome (https://iris.angers.inra.fr/gddh13/). Mutant of arf18 (GABI_699B09) sequence numbers were obtained from the official TAIR website (www.arabidopsis.org). The protein sequences of ARF18 from different species were obtained from the protein sequence of apple MdARF18 on the NCBI website. Using these data, a phylogenetic tree with reasonably close associations was constructed[31].

    Protein structural domain prediction of ARF18 was performed on the SMART website (https://smart.embl.de/). Motif analysis of ARF18 was performed by MEME (https://meme-suite.org/meme/tools/meme). Clustal was used to do multiple sequence comparisons. The first step was accessing the EBI web server through the Clustal Omega channel. The visualization of the results was altered using Jalview, which may be downloaded from www.jalview.org/download.[32]

    The apple 'Orin' callus was transplanted on MS medium containing 1.5 mg·L−1 6-benzylaminopurine (6-BA) and 0.5 mg·L−1 2,4 dichlorophenoxyacetic acid (2,4-D) at 25 °C, in the dark, at 21-d intervals. 'Royal Gala' apple cultivars were cultured in vermiculite and transplanted at 25 °C every 30 d. The Arabidopsis plants used were of the Columbia (Col-0) wild-type variety. Sowing and germinating Arabidopsis seeds on MS nutrient medium, and Arabidopsis seeds were incubated and grown at 25 °C (light/dark cycle of 16 h/8 h)[33].

    The nutrient solution in the base contained 1.0 mM CaCl2, 1.0 mM KH2PO4, 1.0 mM MgSO4, 0.1 mM FeSO4·7H2O 0.1 mM Na2EDTA·2H2O, 50 μM MnSO4·H2O, 50 μM H3BO3, 0.05 μM CuSO4·5H2O, 0.5 μM Na2MoO4·2H2O, 15 μM ZnSO4·7H2O, 2.5 μM KI, and 0.05 μM CoCl·6H2O, and 0.05 μM CoCl·6H2O, and 0.05 μM CoCl· 6H2O. 2H2O, 15 μM ZnSO4·7H2O, 2.5 μM KI and 0.05 μM CoCl·6H2O, and 0.05 μM CoCl·6H2O, supplemented with 0.5 mM, 2 mM, and 10 mM KNO3 as the sole nitrogen source, and added with the relevant concentrations of KCl to maintain the same K concentration[33,34].

    For auxin treatment, 12 uniformly growing apple tissue-cultured seedlings (Malus domestica 'Royal Gala') were selected from each of the control and treatment groups, apple seedlings were incubated in a nutrient solution containing 1.5 mg·L−1 6-BA, 0.2 mg·L−1 naphthalene acetic acid, and IAA (10 μM) for 50 d, and then the physiological data were determined. Apple seedlings were incubated and grown at 25 °C (light/dark cycle of 16 h/8 h).

    For nitrate treatment, Arabidopsis seedlings were transferred into an MS medium (containing different concentrations of KNO3) as soon as they germinated to test root development. Seven-day-old Arabidopsis were transplanted into vermiculite and then treated with a nutrient solution containing different concentrations of KNO3 (0.5, 2, 10 mM) and watered at 10-d intervals. Apple calli were treated with medium containing 1.5 mg·L−1 6-BA, 0.5 mg·L−1 2,4-D, and varying doses of KNO3 (0.5, 2, and 10 mM) for 25 d, and samples were examined for relevant physiological data. Apple calli were subjected to the same treatment for 1 d for GUS staining[35].

    To obtain MdARF18 overexpression materials, the open reading frame (ORF) of MdARF18 was introduced into the pRI-101 vector. To obtain pMdNRT1.1 material, the 2 kb segment located before the transcription start site of MdNRT1.1 was inserted into the pCAMBIA1300 vector. The Agrobacterium tumefaciens LBA4404 strain was cultivated in lysozyme broth (LB) medium supplemented with 50 mg·L−1 kanamycin and 50 mg·L−1 rifampicin. The MdARF18 overexpression vector and the ProMdNRT1.1::GUS vector were introduced into Arabidopsis and apple callus using the flower dip transformation procedure. The third-generation homozygous transgenic Arabidopsis (T3) and transgenic calli were obtained[36]. Information on the relevant primers designed is shown in Supplemental Table S1.

    Plant DNA and RNA were obtained using the Genomic DNA Kit and the Omni Plant RNA Kit (tDNase I) (Tiangen, Beijing, China)[37].

    cDNA was synthesized for qPCR by using the PrimeScript First Strand cDNA Synthesis Kit (Takara, Dalian, China). The cDNA for qPCR was synthesized by using the PrimeScript First Strand cDNA Synthesis Kit (Takara, Dalian, China). Quantitative real-time fluorescence analysis was performed by using the UltraSYBR Mixture (Low Rox) kit (ComWin Biotech Co. Ltd., Beijing, China). qRT-PCR experiments were performed using the 2−ΔΔCᴛ method for data analysis. The data were analyzed by the 2−ΔΔCᴛ method[31].

    GUS staining buffer contained 1 mM 5-bromo-4-chloro-3-indolyl-β-glutamic acid, 0.01 mM EDTA, 0.5 mM hydrogen ferrocyanide, 100 mM sodium phosphate (pH 7.0), and 0.1% (v/v) Triton X-100 was maintained at 37 °C in the dark. The pMdNRT1.1::GUS construct was transiently introduced into apple calli. To confirm whether MdNRT1.1 is activated or inhibited by MdARF18, we co-transformed 35S::MdARF18 into pMdNRT1.1::GUS is calling. The activity of transgenic calli was assessed using GUS labeling and activity assays[33,38].

    The specimens were crushed into fine particles, combined with 1 mL of ddH2O, and thereafter subjected to a temperature of 100 °C for 30 min. The supernatant was collected in a flow cell after centrifugation at 12,000 revolutions per minute for 10 min. The AutoAnalyzer 3 continuous flow analyzer was utilized to measure nitrate concentrations. (SEAL analytical, Mequon, WI, USA). Nitrate reductase (NR) activity was characterized by the corresponding kits (Solarbio Life Science, Beijing, China) using a spectrophotometric method[31].

    Y1H assays were performed as previously described by Liu et al.[39]. The coding sequence of MdARF18 was integrated into the pGADT7 expression vector, whereas the promoter region of MdNRT1.1 was included in the pHIS2 reporter vector. Subsequently, the constitutive vectors were co-transformed into the yeast monohybrid strain Y187. The individual transformants were assessed on a medium lacking tryptophan, leucine, and histidine (SDT/-L/-H). Subsequently, the positive yeast cells were identified using polymerase chain reaction (PCR). The yeast strain cells were diluted at dilution factors of 10, 100, 1,000, and 10,000. Ten μL of various doses were added to selective medium (SD-T/-L/-H) containing 120 mM 3-aminotriazole (3-AT) and incubated at 28 °C for 2−3 d[37].

    Dual-luciferase assays were performed as described previously[40]. Full-length MdARF18 was cloned into pGreenII 62-SK to produce MdARF18-62-SK. The promoter fragment of MdNRT1.1 was cloned into pGreenII 0800-LUC to produce pMdNRT1.1-LUC. Different combinations were transformed into Agrobacterium tumefaciens LBA4404 and the Agrobacterium solution was injected onto the underside of the leaves of tobacco (Nicotiana benthamiana) leaves abaxially. The Dual Luciferase Reporter Kit (Promega, www.promega.com) was used to detect fluorescence activity.

    Total protein was extracted from wild-type and transgenic apple calli with or without 100 μM MG132 treatment. The purified MdARF18-HIS fusion protein was incubated with total protein[41]. Samples were collected at the indicated times (0, 1, 3, 5, and 7 h).

    Protein gel blots were analyzed using GST antibody. ACTIN antibody was used as an internal reference. All antibodies used in this study were provided by Abmart (www.ab-mart.com).

    Unless otherwise noted, every experiment was carried out independently in triplicate. A one-way analysis of variance (ANOVA) was used to establish the statistical significance of all data, and Duncan's test was used to compare results at the p < 0.05 level[31].

    To investigate whether auxin affects the effective uptake of nitrate in apple, we first externally applied IAA under normal N (5 mM NO3) environment, and this result showed that the growth of Gala apple seedlings in the IAA-treated group were better than the control, and their fresh weights were heavier than the control group (Fig. 1a, d). The N-related physiological indexes of apple seedlings also showed that the nitrate content and NR activity of the root part of the IAA-treated group were significantly higher than the control group, while the nitrate content and NR activity of the shoot part were lower than the control group (Fig. 1b, c). These results demonstrate that auxin could promote the uptake of nitrate and thus promotes growth of plants.

    Figure 1.  Auxin enhances nitrate uptake of Gala seedlings. (a) Phenotypes of apple (Malus domestica 'Royal Gala') seedlings grown nutritionally for 50 d under IAA (10 μM) treatment. (b) Nitrate content of shoot and root apple (Malus domestica 'Royal Gala') seedlings treated with IAA. (c) NR activity in shoot and root of IAA treatment apple (Malus domestica 'Royal Gala') seedlings. (d) Seedling fresh weight under IAA treatment. Bars represent the mean ± SD (n = 3). Different letters above the bars indicate significant differences using the LSD test (p < 0.05).

    To test whether auxin affects the expression of genes related to nitrogen uptake and metabolism. For the root, the expression levels of MdNRT1.1, MdNRT2.1, MdNIA1, MdNIA2, and MdNIR were higher than control group (Supplemental Fig. S1a, f, hj), while the expression levels of MdNRT1.2, MdNRT1.6 and MdNRT2.5 were lower than control group significantly (Supplemental Fig. S1b, d, g). For the shoot, the expression of MdNRT1.1, MdNRT1.5, MdNRT1.6, MdNRT1.7, MdNRT2.1, MdNRT2.5, MdNIA1, MdNIA2, and MdNIR genes were significantly down-regulated (Supplemental Fig. S1a, cj). This result infers that the application of auxin could mediate nitrate uptake in plants by affecting the expression levels of relevant nitrate uptake and assimilation genes.

    Since the auxin signaling pathway requires the regulation of the auxin response factors (ARFs)[25,27], it was investigated whether members of ARF genes were nitrate responsive. Firstly, qPCR quantitative analysis showed that the five subfamily genes of MdARFs (MdARF9, MdARF2, MdARF12, MdARF3, and MdARF18) were expressed at different levels in various organs of the plant (Supplemental Fig. S2). Afterward, the expression levels of five ARF genes were analyzed under different concentrations of nitrate treatment (Fig. 2), and it was concluded that these genes represented by each subfamily responded in different degrees, but the expression level of MdARF18 was up-regulated regardless of low or high nitrogen (Fig. 2i, j), and the expression level of MdARF18 showed a trend of stable up-regulation under IAA treatment (Supplemental Fig. S3). The result demonstrates that MdARFs could affect the uptake of external nitrate by plants and MdARF18 may play an important role in the regulation of nitrate uptake.

    Figure 2.  Relative expression analysis of MdARFs subfamilies in response to different concentrations of nitrate. Expression analysis of representative genes from five subfamilies of MdARF transcription factors. Bars represent the mean ± SD (n = 3). Different letters above the bars indicate significant differences using the LSD test (p < 0.05).

    MdARF18 (MD07G1152100) was predicted through The Apple Genome website (https://iris.angers.inra.fr/gddh13/) and it had high fitness with AtARF18 (AT3G61830). The homologs of ARF18 from 15 species were then identified in NCBI (www.ncbi.nlm.nih.gov) and then constructed an evolutionary tree (Supplemental Fig. S4). The data indicates that MdARF18 was most closely genetically related to MbARF18 (Malus baccata), indicating that they diverged recently in evolution (Supplemental Fig. S4). Conserved structural domain analyses indicated that all 15 ARF18 proteins had highly similar conserved structural domains (Supplemental Fig. S5). In addition, multiple sequence alignment analysis showed that all 15 ARF18 genes have B3-type DNA-binding domains (Supplemental Fig. S6), which is in accordance with the previous reports on ARF18 protein structure[26].

    To explore whether MdARF18 could affect the development of the plant's root system. Firstly, MdARF18 was heterologously expressed into Arabidopsis, and an arf18 mutant (GABI_699B09) Arabidopsis was also obtained (Supplemental Fig. S7). Seven-day-old MdARF18 transgenic Arabidopsis and arf18 mutants were treated in a medium with different nitrate concentrations for 10 d (Fig. 3a, b). After observing results, it was found that under the environment of high nitrate concentration, the primary root of MdARF18 was shorter than arf18 and wild type (Fig. 3c), and the primary root length of arf18 is the longest (Fig. 3c), while there was no significant difference in the lateral root (Fig. 3d). For low nitrate concentration, there was no significant difference in the length of the primary root, and the number of lateral roots of MdARF18 was slightly more than wild type and arf18 mutant. These results suggest that MdARF18 affects root development in plants. However, in general, low nitrate concentrations could promote the transport of IAA by NRT1.1 and thus inhibit lateral root production[3], so it might be hypothesized that MdARF18 would have some effect on MdNRT1.1 thus leading to the disruption of lateral root development.

    Figure 3.  MdARF18 inhibits root development. (a) MdARF18 inhibits root length at 10 mM nitrate concentration. (b) MdARF18 promotes lateral root growth at 0.5 mM nitrate concentration. (c) Primary root length statistics. (d) Lateral root number statistics. Bars represent the mean ± SD (n = 3). Different letters above the bars indicate significant differences using the LSD test (p < 0.05).

    To investigate whether MdARF18 affects the growth of individual plants under different concentrations of nitrate, 7-day-old overexpression MdARF18, and arf18 mutants were planted in the soil and incubated for 20 d. It was found that arf18 had the best growth of shoot, while MdARF18 had the weakest shoot growth at any nitrate concentration (Fig. 4a). MdARF18 had the lightest fresh weight and the arf18 mutant had the heaviest fresh weight (Fig. 4b). N-related physiological indexes revealed that the nitrate content and NR activity of arf18 were significantly higher than wild type, whereas MdARF18 materials were lower than wild type (Fig. 4c, d). More detail, MdARF18 had the lightest fresh weight under low and normal nitrate, while the arf18 mutant had the heaviest fresh weight, and the fresh weight of arf18 under high nitrate concentration did not differ much from the wild type (Fig. 4b). Nitrogen-related physiological indexes showed that the nitrate content of arf18 was significantly higher than wild type, while MdARF18 was lower than wild type. The NR activity of arf18 under high nitrate did not differ much from the wild type, but the NR activity of MdARF18 was the lowest in any treatment (Fig. 4c, d). These results indicate that MdARF18 significantly inhibits plant growth by inhibiting plants to absorb nitrate, and is particularly pronounced at high nitrate concentrations.

    Figure 4.  Ectopic expression of MdARF18 inhibits Arabidopsis growth. (a) Status of Arabidopsis growth after one month of incubation at different nitrate concentrations. (b) Fresh weight of Arabidopsis. (c) Nitrate content of Arabidopsis. (d) NR activity in Arabidopsis. Bars represent the mean ± SD (n = 3). Different letters above the bars indicate significant differences using the LSD test (p < 0.05).

    In addition, to further validate this conclusion, MdARF18 overexpression calli were obtained and treated with different concentrations of nitrate (Supplemental Fig. S8). The results show that the growth of overexpressed MdARF18 was weaker than wild type in both treatments (Supplemental Fig. S9a). The fresh weight of MdARF18 was significantly lighter than wild type (Supplemental Fig. S9b), and its nitrate and NR activity were lower than wild type (Supplemental Fig. S9c, d), which was consistent with the above results (Fig. 4). This result further confirms that MdARF18 could inhibit the development of individual plants by inhibiting the uptake of nitrate.

    Nitrate acts as a signaling molecule that takes up nitrate by activating the NRT family as well as NIAs and NIR[3,34]. To further investigate the pathway by which MdARF18 inhibits plant growth and reduces nitrate content, qRT-PCR was performed on the above plant materials treated with different concentrations of nitrate (Fig. 5). The result shows that the expression levels of AtNRT1.1, AtNIA1, AtNIA2, and AtNIR were all down-regulated in overexpression of MdARF18, and up-regulated in the arf18 mutant (Fig. 5a, hj). There was no significant change in AtNRT1.2 at normal nitrate levels, but AtNRT1.2 expression levels were down-regulated in MdARF18 and up-regulated in arf18 at both high and low nitrate levels (Fig. 5b). This trend in the expression levels of these genes might be consistent with the fact that MdARF18 inhibits the expression of nitrogen-related genes and restricts plant growth. The trend in the expression levels of these genes is consistent with MdARF18 restricting plant growth by inhibiting the expression of nitrogen-related genes. However, AtNRT1.5, AtNRT1.6, AtNRT1.7, AtNRT2.1, and AtNRT2.5 did not show suppressed expression levels in MdARF18 (Fig. 5cg). These results suggest that MdARF18 inhibits nitrate uptake and plant growth by repressing some of the genes for nitrate uptake or assimilation.

    Figure 5.  qPCR-RT analysis of N-related genes. Expression analysis of N-related genes in MdARF18 transgenic Arabidopsis at different nitrate concentrations. Bars represent the mean ± SD (n = 3). Different letters above the bars indicate significant differences using the LSD test (p < 0.05).

    In addition, to test whether different concentrations of nitrate affect the protein stability of MdARF18. However, it was found that there was no significant difference in the protein stability of MdARF18 at different concentrations of nitrate (Supplemental Fig. S10). This result suggests that nitrate does not affect the degradation of MdARF18 protein.

    To further verify whether MdARF18 can directly bind N-related genes, firstly we found that the MdNRT1.1 promoter contains binding sites to ARF factors (Fig. 6a). The yeast one-hybrid research demonstrated an interaction between MdARF18 and the MdNRT1.1 promoter, as shown in Fig. 6b. Yeast cells that were simultaneously transformed with MdNRT1.1-P-pHIS and pGADT7 were unable to grow in selected SD medium. However, cells that were transformed with MdNRT1.1-P-pHIS and MdARF18-pGADT7 grew successfully in the selective medium. The result therefore hypothesizes that MdARF18 could bind specifically to MdNRT1.1 promoter to regulate nitrate uptake in plants.

    Figure 6.  MdARF18 binds directly to the promoter of MdNRT1.1. (a) Schematic representation of MdNRT1.1 promoter. (b) Y1H assay of MdARF18 bound to the MdNRT1.1 promoter in vitro. 10−1, 10−2, 10−3, and 10−4 indicate that the yeast concentration was diluted 10, 100, 1,000, and 10,000 times, respectively. 3-AT stands for 3-Amino-1,2,4-triazole. (c) Dual luciferase assays demonstrate the binding of MdARF18 with MdNRT1.1 promoter. The horizontal bar on the left side of the right indicates the captured signal intensity. Empty LUC and 35S vectors were used as controls. Representative images of three independent experiments are shown here.

    To identify the inhibition or activation of MdNRT1.1 by MdARF18, we analyzed their connections by Dual luciferase assays (Fig. 6c), and also analyzed the fluorescence intensity (Supplemental Fig. S11). It was concluded that the fluorescence signals of cells carrying 35Spro and MdNRT1.1pro::LUC were stronger, but the mixture of 35Spro::MdARF18 and MdNRT1.1pro::LUC injected with fluorescence signal intensity was significantly weakened. Next, we transiently transformed the 35S::MdARF18 into pMdNRT1.1::GUS transgenic calli (Fig. 7). GUS results first showed that the color depth of pMdNRT1.1::GUS and 35S::MdARF18 were significantly lighter than pMdnNRT1.1::GUS alone (Fig. 7a). GUS enzyme activity, as well as GUS expression, also indicated that the calli containing pMdnNRT1.1::GUS alone had a stronger GUS activity (Fig. 7b, c). In addition, the GUS activity of calli containing both pMdNRT1.1:GUS and 35S::MdARF18 were further attenuated under both high and low nitrate concentrations (Fig. 7a). These results suggest that MdARF18 represses MdNRT1.1 expression by directly binding to the MdNRT1.1 promoter region.

    Figure 7.  MdARF18 inhibits the expression of MdNRT1.1. (a) GUS staining experiment of pMdNRT1.1::GUS transgenic calli and transgenic calli containing both pMdNRT1.1::GUS and 35S::MdARF18 with different nitrate treatments. (b) GUS activity assays in MdARF18 overexpressing calli with different nitrate treatments. (c) GUS expression level in MdARF18 overexpressing calli with different nitrate treatments. Bars represent the mean ± SD (n = 3). Different numbers of asterisk above the bars indicate significant differences using the LSD test (*p < 0.05 and **p< 0.01).

    Plants replenish their nutrients by absorbing nitrates from the soil[42,43]. Previous studies have shown that some of the plant hormones such as IAA, GA, and ABA interact with nitrate[25,4445]. The effect of nitrate on the content and transport of IAA has been reported in previous studies, e.g., nitrate supply reduced IAA content in Arabidopsis, wheat, and maize roots and inhibited the transport of IAA from shoot to root[20,21]. In this study, it was found that auxin treatment promoted individual fresh weight gain and growth (Fig. 1a, b). Nitrate content and NR activity were also significantly higher in their root parts (Fig. 1c, d) and also affected the transcript expression levels of related nitrate uptake and assimilation genes (Supplemental Fig. S1). Possibly because IAA can affect plant growth by influencing the uptake of external nitrates by the plant.

    ARFs are key transcription factors to regulate auxin signaling[4649]. We identified five representative genes of the apple MdARFs subfamily and they all had different expression patterns (Supplemental Fig. S2). The transcript levels of each gene were found to be affected to different degrees under different concentrations of nitrate, but the expression level of MdARF18 was up-regulated under both low and high nitrate conditions (Fig. 2). The transcript level of MdARF18 was also activated under IAA treatment (Supplemental Fig. S3), so MdARF18 began to be used in the study of the mechanism of nitrate uptake in plants. In this study, an Arabidopsis AtARF18 homolog was successfully cloned and named MdARF18 (Supplemental Figs S4, S5). It contains a B3-type DNA-binding structural domain consistent with previous studies of ARFs (Supplemental Fig. S6), and arf18 mutants were also obtained and their transcript levels were examined (Supplemental Fig. S7).

    Plants rely on rapid modification of the root system to efficiently access effective nitrogen resources in the soil for growth and survival. The plasticity of root development is an effective strategy for accessing nitrate, and appropriate concentrations of IAA can promote the development of lateral roots[7,44]. The present study found that the length of the primary root was shortened and the number of lateral roots did increase in IAA-treated Gl3 apple seedlings (Supplemental Fig. S12). Generally, an environment with low concentrations of nitrate promotes the transport of IAA by AtNRT1.1, which inhibits the growth of lateral roots[14]. However, in the research of MdARF18 transgenic Arabidopsis, it was found that the lateral roots of MdARF18-OX increased under low concentrations of nitrate, but there was no significant change in the mutant arf18 (Fig. 3). Therefore, it was hypothesized that MdARF18 might repress the expression of the MdNRT1.1 gene or other related genes that can regulate root plasticity, thereby affecting nitrate uptake in plants.

    In rice, several researchers have demonstrated that OsARF18 significantly regulates nitrogen utilization. Loss of function of the Rice Salt Tolerant 1 (RST1) gene (encoding OsARF18) removes its ability to transcriptionally repress OsAS1, accelerating the assimilation of NH4+ to Asn and thereby increasing nitrogen utilization[28]. During soil incubation of MdARF18-OX Arabidopsis, it was found that leaving aside the effect of differences in nitrate concentration, the arf18 mutant grew significantly better than MdARF18-OX and had higher levels of nitrate and NR activity in arf18 than in MdARF18-OX. This demonstrates that MdARF18 may act as a repressor of nitrate uptake and assimilation, thereby inhibiting normal plant development (Fig. 4). Interestingly, an adequate nitrogen environment promotes plant growth, but MdARF18-OX Arabidopsis growth and all physiological indexes were poorer under high nitrate concentration than MdARF18-OX at other concentrations. We hypothesize that MdARF18 may be activated more intensively at high nitrate concentrations, or that MdARF18 suppresses the expression levels of genes for nitrate uptake or assimilation (genes that may play a stronger role at high nitrate concentrations), thereby inhibiting plant growth. In addition, we obtained MdARF18 transgenic calli (Supplemental Fig. S8) and subjected them to high and low concentrations of nitrate, and also found that MdARF18 inhibited the growth of individuals at both concentrations (Supplemental Fig. S9). This further confirms that MdARF18 inhibits nitrate uptake in individuals.

    ARF family transcription factors play a key role in transmitting auxin signals to alter plant growth and development, e.g. osarf1 and osarf24 mutants have reduced levels of OsNRT1.1B, OsNRT2.3a and OsNIA2 transcripts[22]. Therefore, further studies are needed to determine whether MdARF18 activates nitrate uptake through different molecular mechanisms. The result revealed that the transcript levels of AtNRT1.1, AtNIA1, AtNIA2, and AtNIR in MdARF18-OX were consistent with the developmental pattern of impaired plant growth (Fig. 5). Unfortunately, we attempted to explore whether variability in nitrate concentration affects MdARF18 to differ at the protein level, but the two did not appear to differ significantly (Supplemental Fig. S10).

    ARF transcription factors act as trans-activators/repressors of N metabolism-related genes by directly binding to TGTCNN/NNGACA-containing fragments in the promoter regions of downstream target genes[27,50]. The NRT family plays important roles in nitrate uptake, transport, and storage, and NRT1.1 is an important dual-affinity nitrate transporter protein[7,5052], and nitrogen utilization is very important for apple growth[53,54]. We identified binding sites in the promoters of these N-related genes that are compatible with ARF factors, and MdARF18 was found to bind to MdNRT1.1 promoter by yeast one-hybrid technique (Fig. 6a, b). It was also verified by Dual luciferase assays that MdARF18 could act as a transcriptional repressor that inhibited the expression of the downstream gene MdNRT1.1 (Fig. 6c), which inhibited the uptake of nitrate in plants. In addition, the GUS assay was synchronized to verify that transiently expressed pMdNRT1.1::GUS calli with 35S::MdARF18 showed a lighter staining depth and a significant decrease in GUS transcript level and enzyme activity (Fig. 7). This phenomenon was particularly pronounced at high concentrations of nitrate. These results suggest that MdARF18 may directly bind to the MdNRT1.1 promoter and inhibit its expression, thereby suppressing NO3 metabolism and decreasing the efficiency of nitrate uptake more significantly under high nitrate concentrations.

    In conclusion, in this study, we found that MdARF18 responds to nitrate and could directly bind to the TGTCTT site of the MdNRT1.1 promoter to repress its expression. Our findings provide new insights into the molecular mechanisms by which MdARF18 regulates nitrate transport in apple.

    The authors confirm contribution to the paper as follows: study conception and design: Liu GD; data collection: Liu GD, Rui L, Liu RX; analysis and interpretation of results: Liu GD, Li HL, An XH; draft manuscript preparation: Liu GD; supervision: Zhang S, Zhang ZL; funding acquisition: You CX, Wang XF; All authors reviewed the results and approved the final version of the manuscript.

    Data sharing not applicable to this article as no datasets were generated or analyzed during the current study.

    This work was supported by the National Natural Science Foundation of China (32272683), the Shandong Province Key R&D Program of China (2022TZXD008-02), the China Agriculture Research System of MOF and MARA (CARS-27), the National Key Research and Development Program of China (2022YFD1201700), and the National Natural Science Foundation of China (NSFC) (32172538).

  • The authors declare that they have no conflict of interest.

  • Supplemental Fig. S1 Bioinformative analysis for PpDXS1 protein. (a) Amino acid sequence alignment of DXS1. (b) Prediction of function domain. (c) Prediction of signal peptide. (d) Prediction of subcellular localization. (e) Prediction of transmembrane topological structures.
    Supplemental Fig. S2 The promoter sequence of PpDXS1 from Kentucky bluegrass.
    Supplemental Fig. S3 Differential expression genes of antiDXS1-102 vs CK. (a) Volcanic map of differential expression genes of antiDXS1-102 vs CK. (b) GO enrichment of down-regulated differentially expressed genes on antiDXS1-102 vs CK. (c) GO enrichment of up-regulated differentially expressed genes on antiDXS1-102 vs CK.
    Supplemental Fig. S4 The map of recombinant plasmid pCAMBIA1301-antiDXS1.
    Supplemental Fig. S5 Biolistic PDS-1000He Particle Delivery System.
    Supplemental Table S1 Analysis of gray value in the western blot.
    Supplemental Table S2 The other primers for the study.
  • [1] Bach TJ. 1995. Some new aspects of isoprenoid biosynthesis in plants − a review. Lipids 30:191−202 doi: 10.1007/BF02537822

    CrossRef   Google Scholar

    [2] Disch A, Hemmerlin A, Bach TJ, Rohmer M. 1998. Mevalonate-derived isopentenyl diphosphate is the biosynthetic precursor of ubiquinone prenyl side chain in tobacco BY-2 cells. Biochemical Journal 331:615−21 doi: 10.1042/bj3310615

    CrossRef   Google Scholar

    [3] Rodríguez-Concepción M, Boronat A. 2015. Breaking new ground in the regulation of the early steps of plant isoprenoid biosynthesis. Current Opinion in Plant Biology 25:17−22 doi: 10.1016/j.pbi.2015.04.001

    CrossRef   Google Scholar

    [4] Baker FC, Brooks CJW. 1976. Biosynthesis of the sesquiterpenoid, capsidiol, in sweet pepper fruits inoculated with fungal spores. Phytochemistry 15:689−94 doi: 10.1016/S0031-9422(00)94422-4

    CrossRef   Google Scholar

    [5] Vranová E, Coman D, Gruissem W. 2012. Structure and dynamics of the isoprenoid pathway network. Mol Plant 5:318−33 doi: 10.1093/mp/sss015

    CrossRef   Google Scholar

    [6] Ratcliffe RG, Shachar-Hill Y. 2006. Measuring multiple fluxes through plant metabolic networks. The Plant Journal 45:490−511 doi: 10.1111/j.1365-313X.2005.02649.x

    CrossRef   Google Scholar

    [7] Vranová E, Coman D, Gruissem W. 2013. Network analysis of the MVA and MEP pathways for isoprenoid synthesis. Annual Review of Plant Biology 64:665−700 doi: 10.1146/annurev-arplant-050312-120116

    CrossRef   Google Scholar

    [8] Estévez JM, Cantero A, Romero C, Kawaide H, Jiménez LF, et al. 2000. Analysis of the expression of CLA1, a gene that encodes the 1-deoxyxylulose 5-phosphate synthase of the 2-C-methyl-D-erythritol-4-phosphate pathway in Arabidopsis. Plant physiology 124:95−104 doi: 10.1104/pp.124.1.95

    CrossRef   Google Scholar

    [9] Walter MH, Hans J, Strack D. 2002. Two distantly related genes encoding 1-deoxy-D-xylulose 5-phosphate synthases: differential regulation in shoots and apocarotenoid-accumulating mycorrhizal roots. The Plant Journal 31:243−54 doi: 10.1046/j.1365-313X.2002.01352.x

    CrossRef   Google Scholar

    [10] Lois LM, Rodríguez-Concepción M, Gallego F, Campos N, Boronat A. 2000. Carotenoid biosynthesis during tomato fruit development: regulatory role of 1-deoxy-D-xylulose 5-phosphate synthase. The Plant Journal 22:503−13 doi: 10.1046/j.1365-313x.2000.00764.x

    CrossRef   Google Scholar

    [11] Kim BR, Kim SU, Chang YJ. 2005. Differential expression of three 1-deoxy-D-xylulose-5-phosphate synthase genes in rice. Biotechnology Letters 27:997−1001 doi: 10.1007/s10529-005-7849-1

    CrossRef   Google Scholar

    [12] Cordoba E, Porta H, Arroyo A, San Román C, Medina L, et al. 2011. Functional characterization of the three genes encoding 1-deoxy-D-xylulose 5-phosphate synthase in maize. Journal of Experimental Botany 62:2023−38 doi: 10.1093/jxb/erq393

    CrossRef   Google Scholar

    [13] Phillips MA, Walter MH, Ralph SG, Dabrowska P, Luck K, et al. 2007. Functional identification and differential expression of 1-deoxy-D-xylulose 5-phosphate synthase in induced terpenoid resin formation of Norway spruce (Picea abies). Plant Molecular Biology 65:243−57 doi: 10.1007/s11103-007-9212-5

    CrossRef   Google Scholar

    [14] Fan H, Wu Q, Wang X, Wu L, Cai Y, et al. 2016. Molecular cloning and expression of 1-deoxy-D-xylulose-5-phosphate synthase and 1-deoxy-D-xylulose-5-phosphate reductoisomerase in Dendrobium officinale. Plant Cell, Tissue and Organ Culture 125:381−85 doi: 10.1007/s11240-016-0945-1

    CrossRef   Google Scholar

    [15] Xu Y, Liu J, Liang L, Yang X, Zhang Z, et al. 2014. Molecular cloning and characterization of three cDNAs encoding 1-deoxy-D-xylulose-5-phosphate synthase in Aquilaria sinensis (Lour.) Gilg. Plant Physiology and Biochemistry 82:133−41 doi: 10.1016/j.plaphy.2014.05.013

    CrossRef   Google Scholar

    [16] Zhang F, Liu W, Xia J, Zeng J, Xiang L, et al. 2018. Molecular characterization of the 1-deoxy-D-xylulose 5-phosphate synthase gene family in Artemisia annua. Frontiers in Plant Science 9:952 doi: 10.3389/fpls.2018.00952

    CrossRef   Google Scholar

    [17] Mandel MA, Feldmann KA, Herrera-Estrella L, Rocha-Sosa M, León P. 1996. CLA1, a novel gene required for chloroplast development, is highly conserved in evolution. The Plant Journal 9:649−58 doi: 10.1046/j.1365-313X.1996.9050649.x

    CrossRef   Google Scholar

    [18] Wang Y, Yuan X, Li S, Chen W, Li J. 2018. Gene cloning and functional characterization of three 1-deoxy-D-xylulose 5-phosphate synthases in Simao pine. Bioresources 13:6370−82

    Google Scholar

    [19] Zhang M, Li K, Zhang C, Gai J, Yu D. 2009. Identification and characterization of class 1 DXS gene encoding 1-deoxy-D-xylulose-5-phosphate synthase, the first committed enzyme of the MEP pathway from soybean. Molecular Biology Reports 36:879−87 doi: 10.1007/s11033-008-9258-8

    CrossRef   Google Scholar

    [20] Jadaun JS, Sangwan NS, Narnoliya LK, Singh N, Bansal S, et al. 2017. Over-expression of DXS gene enhances terpenoidal secondary metabolite accumulation in rose-scented geranium and Withania somnifera: active involvement of plastid isoprenogenic pathway in their biosynthesis. Physiologia Plantarum 159:381−400 doi: 10.1111/ppl.12507

    CrossRef   Google Scholar

    [21] Okada A, Shimizu T, Okada K, Kuzuyama T, Koga J, et al. 2007. Elicitor induced activation of the methylerythritol phosphate pathway toward phytoalexins biosynthesis in rice. Plant Molecular Biology 65:177−87 doi: 10.1007/s11103-007-9207-2

    CrossRef   Google Scholar

    [22] Xi X, Zha Q, He Y, Tian Y, Jiang A. 2020. Influence of cluster thinning and girdling on aroma composition in 'Jumeigui' table grape. Scientific Reports 10:6877 doi: 10.1038/s41598-020-63826-7

    CrossRef   Google Scholar

    [23] Mansouri H, Asrar Z, Mehrabani M. 2009. Effects of gibberellic acid on primary terpenoids and Δ9-tetrahydrocannabinol in Cannabis sativa at flowering stage. Journal of Integrative Plant Biology 51:553−61 doi: 10.1111/j.1744-7909.2009.00833.x

    CrossRef   Google Scholar

    [24] Abraham EM, Huang B, Bonos SA, Meyer WA. 2004. Evaluation of drought resistance for Texas bluegrass, Kentucky bluegrass, and their hybrids. Crop Science 44:1746−53 doi: 10.2135/cropsci2004.1746

    CrossRef   Google Scholar

    [25] Turgeon AJ. 1991. Turfgrass management. USA: Prentice-Hall Inc
    [26] Hooley R. 1994. Gibberellins: perception, transduction and responses. Plant Mol Biol 26:1529−55 doi: 10.1007/BF00016489

    CrossRef   Google Scholar

    [27] Gan L, Di R, Chao Y, Han L, Chen X, et al. 2016. De novo transcriptome analysis for Kentucky Bluegrass dwarf mutants induced by space mutation. PLoS One 11:e0151768 doi: 10.1371/journal.pone.0151768

    CrossRef   Google Scholar

    [28] Wright LP, Rohwer JM, Ghirardo A, Hammerbacher A, Ortiz-Alcaide M, et al. 2014. 1-Deoxyxylulose 5-phosphate synthase controls flux through the 2-C-methylerythritol 4-phosphate pathway in Arabidopsis thaliana. Plant Physiology 165:1488−504 doi: 10.1104/pp.114.245191

    CrossRef   Google Scholar

    [29] Phillips MA, León P, Boronat A, Rodríguez-Concepción M. 2008. The plastidial MEP pathway: unified nomenclature and resources. Trends in Plant Science 13:619−23 doi: 10.1016/j.tplants.2008.09.003

    CrossRef   Google Scholar

    [30] Kim SM, Kuzuyama T, Chang YJ, Song KS, Kim SU. 2006. Identification of class 2 1-deoxy-D-xylulose 5-phosphate synthase and 1-deoxy-D-xylulose 5-phosphate reductoisomerase genes from Ginkgo biloba and their transcription in embryo culture with respect to ginkgolide biosynthesis. Planta Medica 72:234−40 doi: 10.1055/s-2005-916180

    CrossRef   Google Scholar

    [31] Zhou W, Huang F, Li S, Wang Y, Zhou C, et al. 2016. Molecular cloning and characterization of two 1-deoxy-D-xylulose-5-phosphate synthase genes involved in tanshinone biosynthesis in Salvia miltiorrhiza. Molecular Breeding 36:124 doi: 10.1007/s11032-016-0550-3

    CrossRef   Google Scholar

    [32] Hunter WN, Bond CS, Gabrielsen M, Kemp LE. 2003. Structure and reactivity in the non-mevalonate pathway of isoprenoid biosynthesis. Biochemical Society Transactions 31:537−42 doi: 10.1042/bst0310537

    CrossRef   Google Scholar

    [33] Henriquez MA, Soliman A, Li G, Hannoufa A, Ayele BT, et al. 2016. Molecular cloning, functional characterization and expression of potato (Solanum tuberosum) 1-deoxy-d-xylulose 5-phosphate synthase 1 (StDXS1) in response to Phytophthora infestans. Plant Science 243:71−83 doi: 10.1016/j.plantsci.2015.12.001

    CrossRef   Google Scholar

    [34] Srinath M, Shailaja A, Bhavani B, Bindu V, Giri CC. 2017. Characterization of 1-deoxy-D-xylulose 5-phosphate synthase (DXS) protein in Andrographis paniculata (Burm. f.) Wall. ex. Nees: A in silico appraisal. Ann Phytomedicine 6:63−73 doi: 10.21276/ap.2017.6.2.5

    CrossRef   Google Scholar

    [35] Yan N, Zhang H, Zhang Z, Shi J, Timko MP, et al. 2016. Organ- and growing stage-specific expression of solanesol biosynthesis genes inNicotiana tabacum reveals their association with solanesol content. Molecules 21:1536 doi: 10.3390/molecules21111536

    CrossRef   Google Scholar

    [36] Enfissi EMA, Fraser PD, Lois LM, Boronat A, Schuch W, et al. 2005. Metabolic engineering of the mevalonate and non-mevalonate isopentenyl diphosphate-forming pathways for the production of health-promoting isoprenoids in tomato. Plant Biotechnology Journal 3:17−27 doi: 10.1111/j.1467-7652.2004.00091.x

    CrossRef   Google Scholar

    [37] García-Alcázar M, Giménez E, Pineda B, Capel C, García-Sogo B, et al. 2017. Albino T-DNA tomato mutant reveals a key function of 1-deoxy-D-xylulose-5-phosphate synthase (DXS1) in plant development and survival. Scientific Reports 7:45333 doi: 10.1038/srep45333

    CrossRef   Google Scholar

    [38] Yang D, Ma P, Liang X, Wei Z, Liang Z, et al. 2012. PEG and ABA trigger methyl jasmonate accumulation to induce the MEP pathway and increase tanshinone production in Salvia miltiorrhiza hairy roots. Physiologia Plantarum 146:173−83 doi: 10.1111/j.1399-3054.2012.01603.x

    CrossRef   Google Scholar

    [39] Estévez JM, Cantero A, Reindl A, Reichler S, León P. 2001. 1-deoxy-D-xylulose-5-phosphate synthase, a limiting enzyme for plastidic isoprenoid biosynthesis in plants. Journal of Biological Chemistry 276:22901−9 doi: 10.1074/jbc.M100854200

    CrossRef   Google Scholar

    [40] Zhang S, Ding G, He W, Liu K, Luo Y, et al. 2020. Functional characterization of the 1-deoxy-D-xylulose 5-phosphate synthase genes in Morus notabilis. Frontiers in Plant Science 11:1142 doi: 10.3389/fpls.2020.01142

    CrossRef   Google Scholar

    [41] Kumar SR, Rai A, Bomzan DP, Kumar K, Hemmerlin A, et al. 2020. A plastid-localized bona fide geranylgeranyl diphosphate synthase plays a necessary role in monoterpene indole alkaloid biosynthesis in Catharanthus roseus. The Plant Journal 103:248−65 doi: 10.1111/tpj.14725

    CrossRef   Google Scholar

    [42] Gan L, Su H, Ling X, Yin S. 2017. Rust pathogen identification and mechanism of disease-resistance research on Kentucky bluegrass dwarf mutant. Journal of Beijing Forestry University 39:87−92

    Google Scholar

    [43] Sohpal VK, Dey A, Singh A. 2010. MEGA biocentric software for sequence and phylogenetic analysis: a review. International Journal of Bioinformatics Research and Applications 6:230−40 doi: 10.1504/IJBRA.2010.034072

    CrossRef   Google Scholar

    [44] Lebedeva I, Stein C. 2001. Antisense oligonucleotides: promise and reality. Annual Review of Pharmacology and Toxicology 41:403−19 doi: 10.1146/annurev.pharmtox.41.1.403

    CrossRef   Google Scholar

    [45] Ha CD, Lemaux PG, Cho MJ. 2001. Stable transformation of a recalcitrant Kentucky bluegrass (Poa pratensis L.) cultivar using mature seed-derived highly regenerative tissues. In Vitro Cellular & Developmental Biology - Plant 37:6−11 doi: 10.1007/s11627-001-0002-5

    CrossRef   Google Scholar

    [46] Arnon DI. 1949. Copper Enzymes in Isolated Chloroplasts. Polyphenoloxidase in Beta Vulgaris. Plant Physiology 24:1−15 doi: 10.1104/pp.24.1.1

    CrossRef   Google Scholar

    [47] Trapnell C, Williams BA, Pertea G, Mortazavi A, Kwan G, et al. 2010. Transcript assembly and quantification by RNA-Seq reveals unannotated transcripts and isoform switching during cell differentiation. Nature Biotechnology 28:511−5 doi: 10.1038/nbt.1621

    CrossRef   Google Scholar

    [48] Grabherr MG, Haas BJ, Yassour M, Levin JZ, Thompson DA, et al. 2011. Full-length transcriptome assembly from RNA-Seq data without a reference genome. Nature Biotechnology 29:644−52 doi: 10.1038/nbt.1883

    CrossRef   Google Scholar

  • Cite this article

    Gan L, Chao Y, Han L, Yin S. 2021. Underexpression of PpDXS1 gene decreased plant height and resulted in altered accumulation of phytohormones in Kentucky bluegrass. Grass Research 1: 9 doi: 10.48130/GR-2021-0009
    Gan L, Chao Y, Han L, Yin S. 2021. Underexpression of PpDXS1 gene decreased plant height and resulted in altered accumulation of phytohormones in Kentucky bluegrass. Grass Research 1: 9 doi: 10.48130/GR-2021-0009

Figures(8)  /  Tables(1)

Article Metrics

Article views(5448) PDF downloads(529)

Other Articles By Authors

ARTICLE   Open Access    

Underexpression of PpDXS1 gene decreased plant height and resulted in altered accumulation of phytohormones in Kentucky bluegrass

Grass Research  1 Article number: 9  (2021)  |  Cite this article

Abstract: 1-deoxy-D-xylulose-5-phosphate synthase (DXS) catalyzes the first and rate-limiting step of the plastidic 2-C-methyl-D-derythritol-4-phosphate (MEP) pathway which regulates the synthesis of terpenoids, such as gibberellins, abscisic acid, and chlorophyll. The objective of this study was to determine the functional role of PpDXS1 in plant growth and development in Kentucky bluegrass (Poa pratensis L.). The PpDXS1 gene has a 2139 bp open reading frame that encodes a polypeptide of 712 amino acids with a calculated molecular weight of 76.7 kDa. PpDXS1 gene expression was the highest in leaves. Moreover, the PpDXS1 promoter contained several hormone response elements and gene expression was induced by exogenous treatment with gibberellin, abscisic acid, jasmonate, and pathogen infection. Functional analysis indicated that underexpression of PpDXS1 gene in Poa pratensis decreased plant height and endogenous gibberellin and indole acetic acid production, but promoted abscisic acid accumulation. Furthermore, transcriptome analysis and qRT-PCR results showed that the expression levels of related genes involved in the phytohormone biosynthesis and signal transduction were differentially regulated by PpDXS1 in transgenic Poa pratensis. Overall, these results indicated that PpDXS1 has strong effects on plant height and accumulation of phytohormones, and provided a preliminary understanding of molecular characterization, expression and function of PpDXS1 in Poa pratensis.

    • Terpenoids constitute a large group of metabolites and have highly diverse structures and functions. Terpenoid primary metabolites, such as plastoquinone, phytosterol, chlorophyll, carotenoids, and phytohormones, participate in respiration, membrane fluidity, photosynthesis, and regulation of growth and development[13]. Some secondary metabolites, such as phytoalexin, participate in allelopathic and plant–pathogen interactions[4]. All terpenoids are derived from two common precursors, isopentenyl diphosphate (IPP) and dimethylallyl diphosphate (DMAPP), which are biosynthesized in plants through the cytosolic mevalonate (MVA) and plastidic methylerythritol phosphate (MEP) pathways[5]. The MVA pathway is involved in synthesis of sesquiterpene, triterpene, and sterols, while the MEP pathway produces monoterpene, diterpene, and other secondary metabolites[5]. Evidence suggests that there is metabolic flux between the two pathways via a metabolic network[6,7], but normal levels of the end products are maintained in disrupted pathways by the respective regulation.

      The first step of the MEP pathway is catalyzed by 1-deoxy-D-xylulose-5-phosphate (DXP) synthase (DXS) and produces DXP from glyceraldehyde-3-phosphate and pyruvate. As known, a series of enzymatic reactions was further presented in the MEP pathway (Fig. 1). The gene encoding DXS enzyme was first identified in Escherichia coli and DXS homologs were subsequently found in model plants and crops, including Arabidopsis[8], barrel clover[9], tomato[10], rice[11], and maize[12], suggesting that DXS genes are highly conserved in plants. Studies to date show that DXS enzyme is encoded by a small gene family. Multiple DXS genes have been found in Medicago truncatula[9], Oryza sativa[11], Picea abies[13], Zea mays[12], Salvia miltiorrhiza[14], Aquilaria sinensis[15], and Artemisia annua[16], and two or three DXS genes in these plants cluster into three independent clades. It has been shown that DXS genes can also be divided into two types based on DXS function. DXS1 type is thought to be involved in primary metabolism (e.g. chlorophyll synthesis, photosynthetic processes), and mainly expressed in photosynthetic tissues[9,1719]. Unlike DXS1 genes in other plants, studies in Aquilaria sinensis have shown that AsDXS1 is mainly expressed in the stems and were significantly induced by wound signals, indicating the involvement of AsDXS1 in sesquiterpene formation[15]. In addition, DXS1 gene also plays a role in carotenoid accumulation during fruit ripening in tomato and pepper[10,20]. On the other hand, DXS2 type enzyme is thought to be involved in biotic or abiotic resistance defenses and metabolism of special secondary metabolites. For instance, the expression of DXS2 in barrel clover (Medicago truncatula) and maize (Zea mays) make different influences in the apocarotenoid accumulation during mycorrhization[9,12]. The clade 3 of DXS gene, which is rarely identified in plants, often plays an interesting role in various plants. For example, DXS3 in rice has been suggested to also participate in defense responses[21]. In the accumulation of terpenes and linalool in 'Jumeigui' grape, only the higher transcript abundance of VvDXS3 showed significant correlation[22].

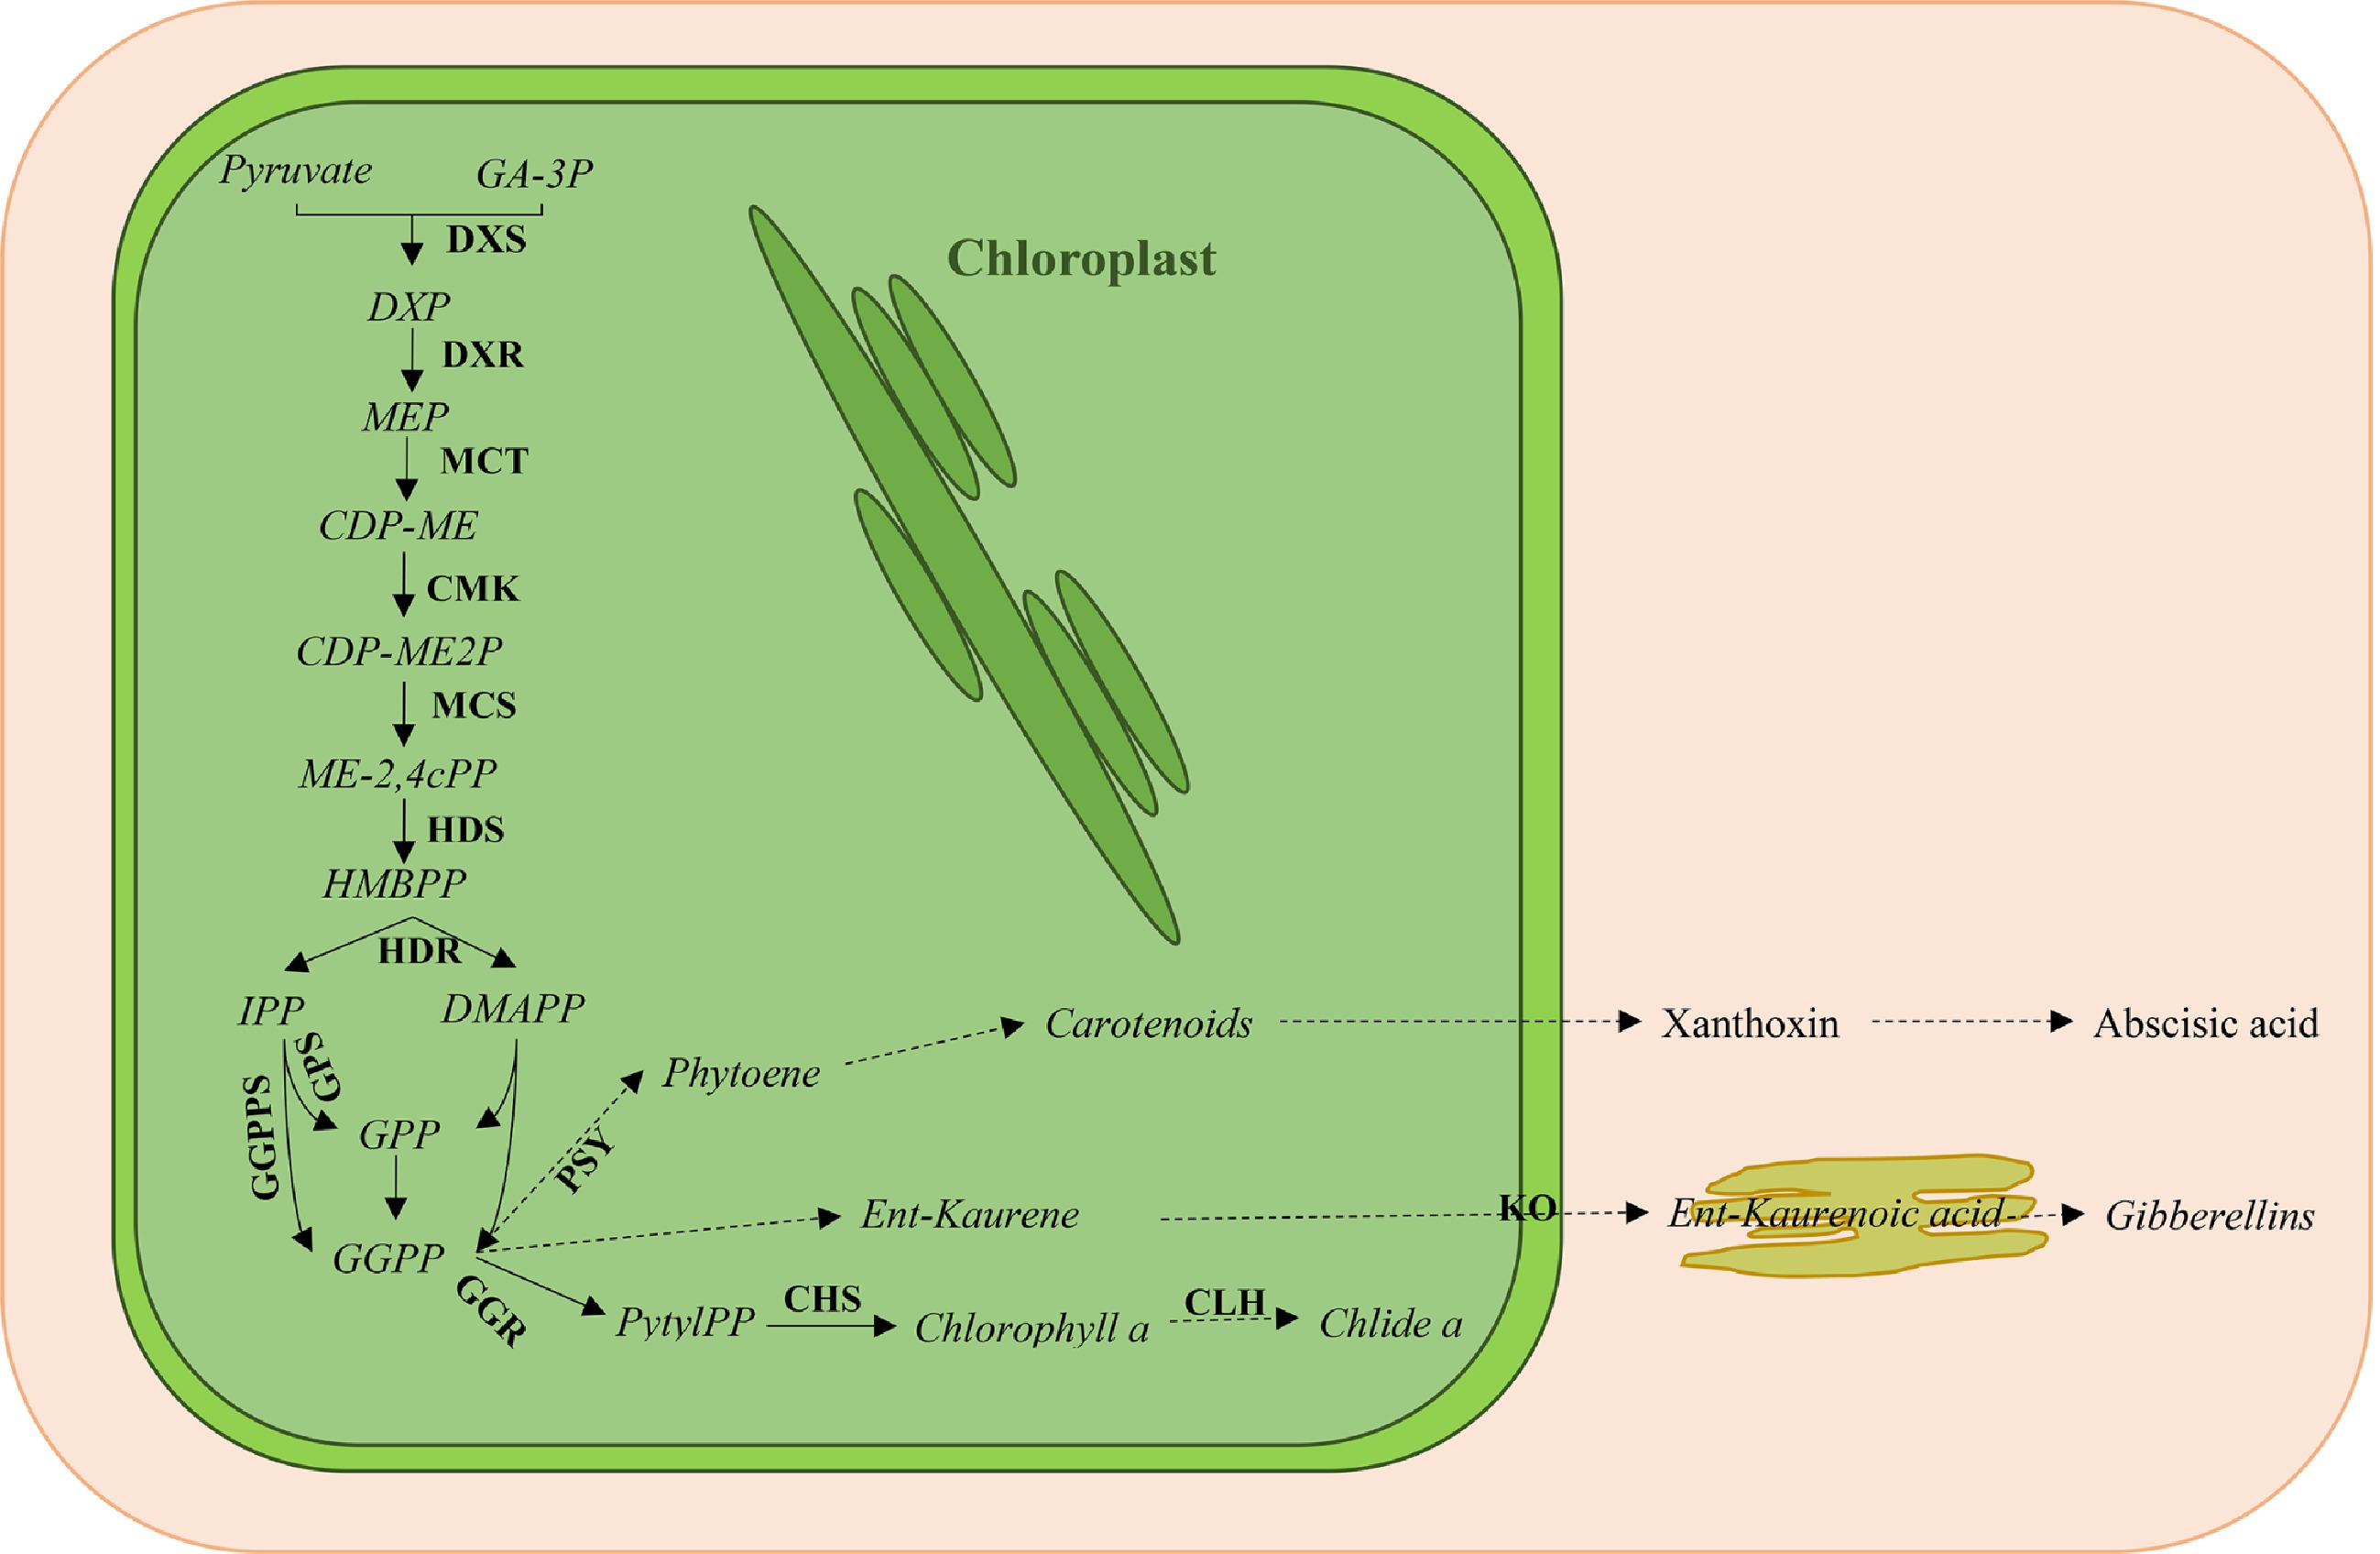
      Figure 1.  Overview of the plastidic methyl erythritol phosphate (MEP) pathway for isoprenoid biosynthesis. GA-3P, glyceraldehyde-3-phosphate; DXS, 1-deoxy-D-xylulose-5-phosphate synthase; DXP, 1-deoxy-D-xylulose-5-phosphate; DXR, 1-deoxy-D-xylulose reductase; MEP, methylerythritol phosphate; MCT, MEP cytidyltransferase; CDP-ME, 4-(cytidine 5’-diphosphate)-2-C-methylerythritol; CMK, CDP-ME kinase; CDP-ME2P, 2-Phospho-4-(cytidine 5’-diphospho)-2-C-methylerythritol; MCS, 2-C-methylerythritol 2,4-cyclodiphosphate (ME-2,4cPP) synthase; HDS, 1-hydroxy-2-methyl-2-butenyl 4-diphosphate (HMBPP) synthase; HDR, HMBPP reductase; IPP, isopentenyl diphosphate; DMAPP, dimethylallyl diphosphate; GPS, geranyl diphosphate (GPP) synthase; GGPPS, geranylgeranyl diphosphate (GGPP) synthase; PSY, phytoene synthase; GGR, geranylgeranyl reductase; PhytlPP, phytyl diphosphate; CHS, chlorophyll synthase; CLH, chlorophyllase; KO, ent-kaurene oxidase. Solid lines indicate a single enzymatic step, and dashed lines indicate several enzymatic steps.

      Additionally, post-transcriptional and post-translational regulation are also important objectives of DXS functional mechanism research, as well as DXS gene expression and activity which are also regulated by external factors[8]. For example, Mansouri et al. found that DXS enzymatic activity decreased after application of gibberellic acid[23]. While DXS appear to have a universal function and evolutionary conservation, their functional action is species-specific. So, it is worth further exploring the metabolic regulation and movement for the isoprenoid product in plant growth and development.

      While substantial progress has been made in understanding the function of the DXS in various plants (including model plants, crop and medicinal plants), little is known in the Poaceae family. There has been no research to date in the turfgrass field. Kentucky bluegrass, which belongs to the Poaceae family, is an important cool-season turfgrass in temperate and subarctic regions. Kentucky bluegrass has an aesthetic appearance and an excellent tolerance to low temperatures[24], but requires frequent mowing to maintain turf quality[25]. A preferred strategy is to use cultivars with shorter stature and good stress-resistance to reduce mowing frequency and improve quality. As previously reported, the MEP pathway and DXS genes play important roles in the biosynthesis of various metabolites, such as gibberellin (GAs), abscisic acid (ABA), and in regulating plant growth and development[7,26]. However, no DXS genes was isolated from Kentucky bluegrass, and little is known regarding the effects of DXS on growth and development in turfgrasses.

      Previously, our work reported that DXS1 homologous gene expression level is significantly lower in the dwarf mutant than in the wild-type[27]. The dwarf mutant was obtained from F3 plants derived from 'Baron' seeds exposed to space environment on the satellite which usually results in abundant and non-directional mutations. Additionally, there are differences in leaf color, plant height and other traits between mutant and wild-type plants. Therefore, we studied the relationship between DXS1 gene and plant growth, subsequently understanding the physiological differences between mutant and wild-type plants. In this study, we (a) isolated and characterized a DXS1 gene from Kentucky bluegrass, (b) identified its regulatory effects on the biosynthesis and metabolism of various isoprenoids, and (c) used an underexpressing transgenic line to examine the functional role of PpDXS1 in plant growth and development.

    • Three DXS homologous unigenes were selected from the P. pratensis transcriptome database (NCBI accession number: SRA315988) and then assembled for a fragment sequence for putative P. pratensis DXS gene. RACE primers were designed against the candidate sequence and used to clone the putative DXS ORF frame from Kentucky bluegrass 'Baron' cultivar. An ORF of 2139 bp was produced and named PpDXS1. Sequence alignments revealed that PpDXS1 amino acid sequence was very similar to DXS1 proteins from other plants (Supplemental Fig. S1a), including Hordeum vulgare (97% identity), Aegilops tauschii (97% identity), Brachypodium distachyon (95% identity), Setaria italica (90% identity), and Oryza brachyantha (90% identity).

      PpDXS1 amino acid sequence and structure were examined further to elucidate functional features. The PpDXS1 protein contained 712 amino acid residues and had a predicted molecular mass of 76.7 kDa and deduced isoelectric point of 6.5. Protein subcellular localization of PpDXS1 was predicted in the chloroplast by the WoLF PSORT server, which was consistent with previous studies in various plants[19,28]. Additional primary structure features are shown in Supplemental Fig. S1. The crystal structure of PpDXS1 was not available in the SWISS-MODEL database. Available protein sequences were therefore used with the Expasy server to deduce a 3D model for PpDXS1, with a model for AtDXS also constructed for comparison. Highly conserved functional residues in PpDXS1 and AtDXS were predicted using the InterPro server. Residues 62–259 were highly conserved and formed a thiamine diphosphate binding pocket. Additional common domains important for biological function were also identified (Fig. 2). Differences between AtDXS and PpDXS1 were observed from 648/654 residues onwards (Fig. 2; shown in red and yellow). Therefore, it is speculated whether the difference in DXS1 protein structure among different species will perform different functions in plants.

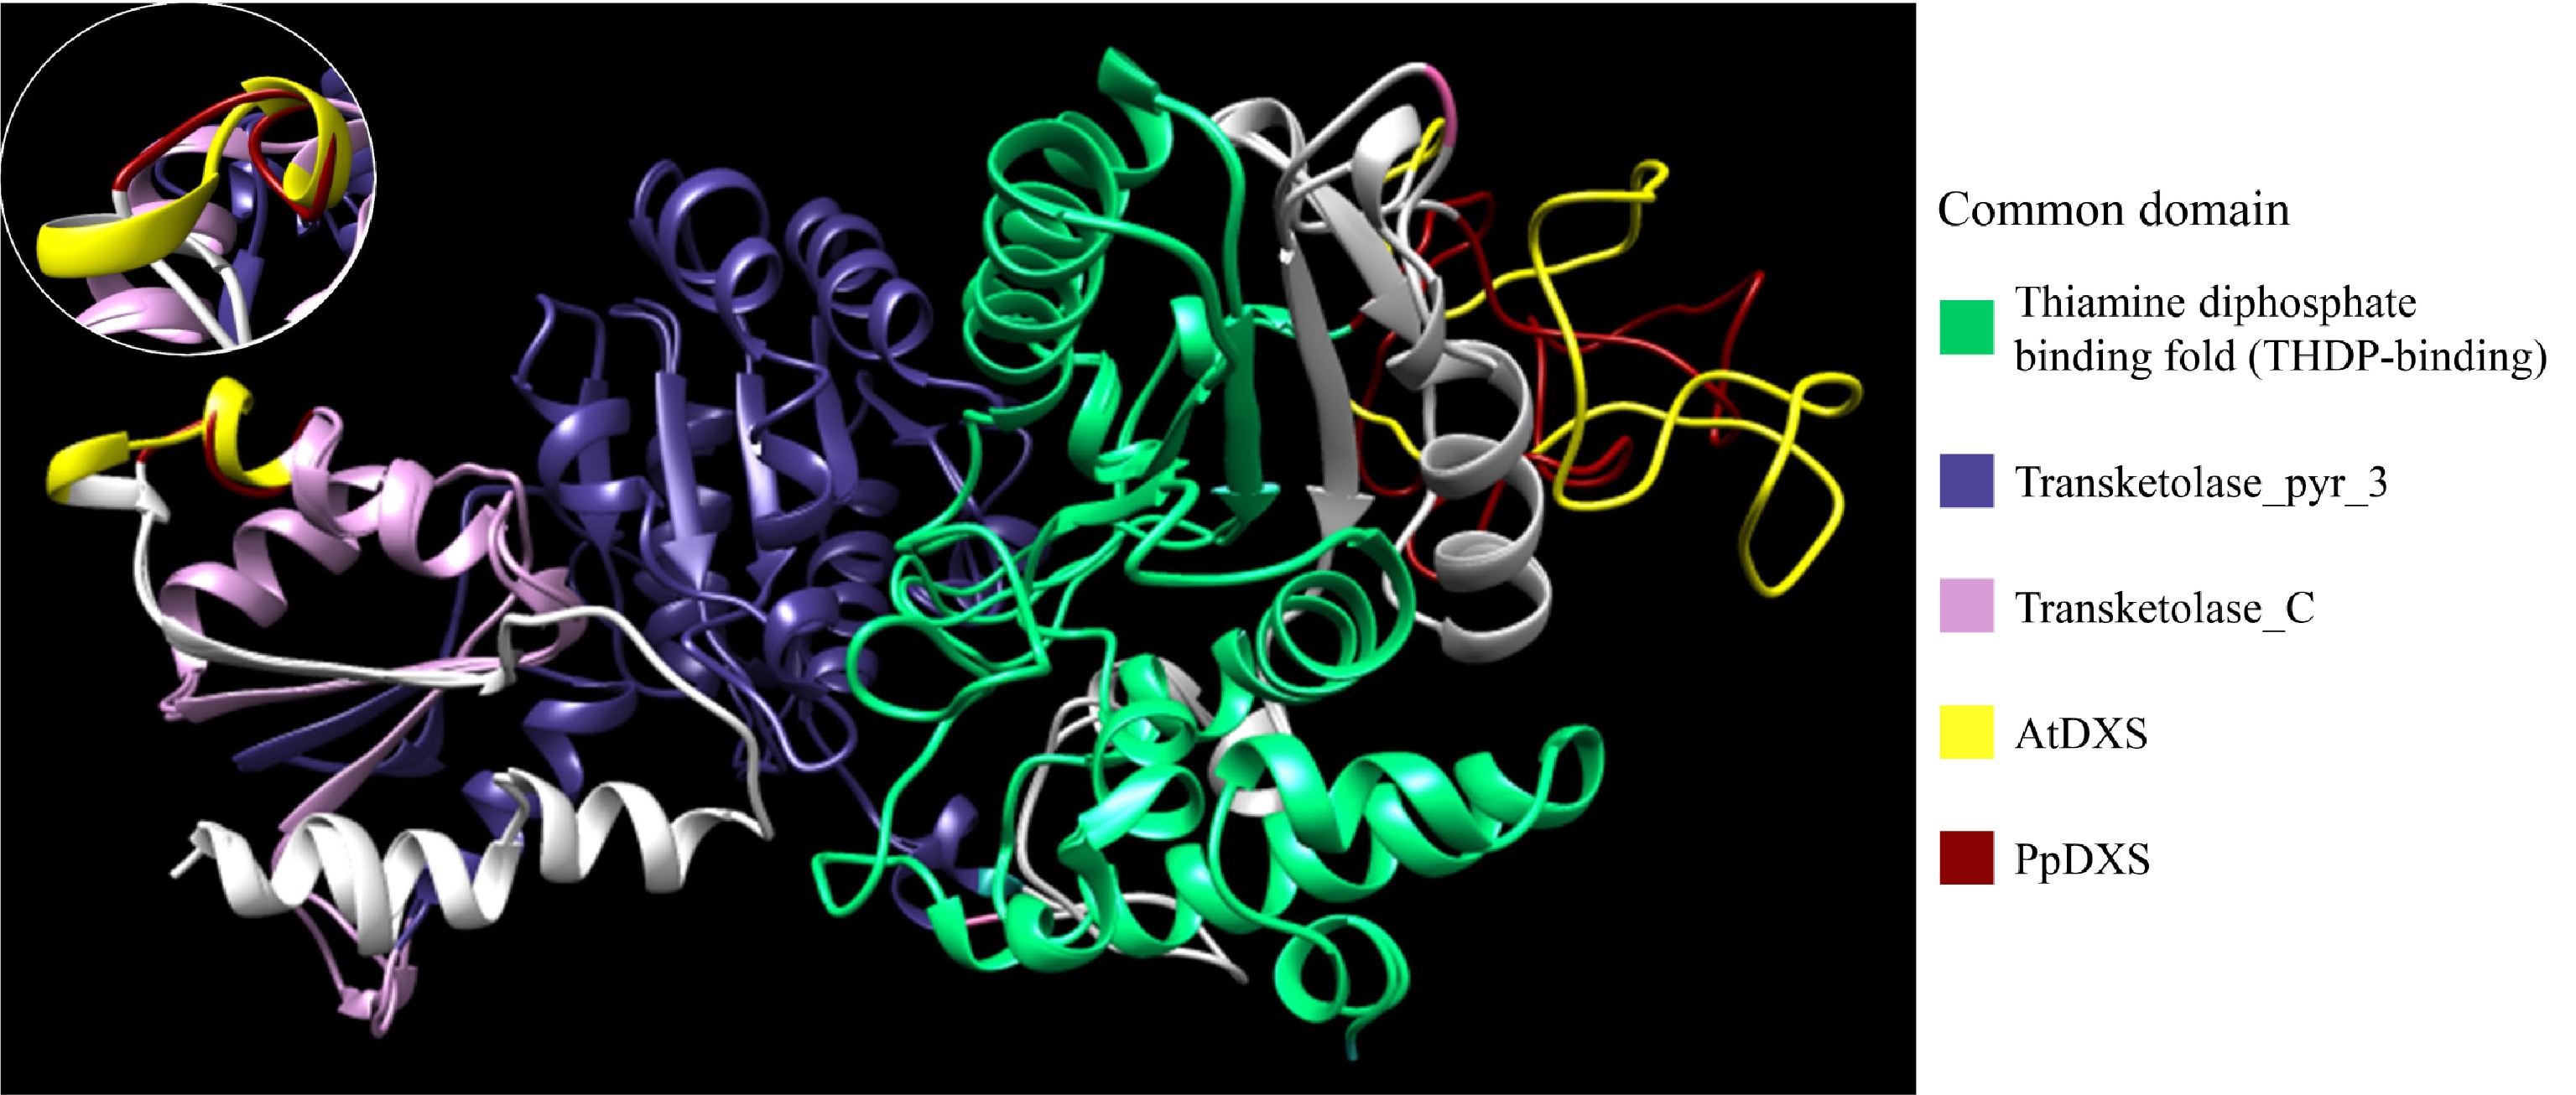
      Figure 2.  Expasy structure prediction models of PpDXS and AtDXS. Model images were generated using Chimera and conserved domains were analyzed using the InterPro server. Residues 62–259 (PpDXS) and 74–273 (AtDXS) represent the THDP-binding domain (green). Residues 387–552 (PpDXS) and 399–564 (AtDXS) represent the thansketolase_pyr_3 domain (blue). Residues 566–698 (PpDXS) and 578–701 (AtDXS) represent the thansketolase_C domain (pink). Differences between the PpDXS and AtDXS model are shown in red (PpDXS) and yellow (AtDXS).

    • PpDXS1 was shown to have a close relationship with Aegilops tauschili, Brachypodium distachyon and other Poaceae plants (Fig. 3). The phylogenetic tree grouped into three independent clades of DXS proteins conserved among plants. The first group referred to DXS1 proteins from a variety of dicots and monocots. However, a DXS-like protein from Arabidopsis (At3g21500) also belongs to this group and its function is still unknown[19, 29]. The clade 2 proteins are mainly involved in secondary metabolism and includes Oryza sativa DXS2 together with representatives from woody plants (e.g. Picea abies and Ginkgo biloba)[11,13,30]. Finally, the clade 3 proteins include Arabidopsis DXS3, rice DXS3, maize DXS3 and agarwood DXS3. As shown, the third branch is the distant phylogenetic DXS group. In this study, PpDXS1 belonged to the DXS1 clade, but PpDXS2 probably exists in Kentucky bluegrass because of its polyploidy. In rice and maize, two DXS1 proteins are also clustered into clade 1 and have been reported to participate in primary metabolism[11,12], while BdDXS1 in Brachypodium distachyon and AetDXS1 protein in Aegilops tauschili had not been reported for functions. DXS1 protein not only participates in photosynthesis in most plants, but has also been shown to be involved in sesquiterpene metabolism and plant protection in agarwood (Aquilaria sinensis) and potato (Solanum tuberosum L.)[15,18,31]. It is implied that DXS1 proteins among species perform conserved yet distinct functions. So, our findings in DXS1 would be beneficial to closely related Poaceae members associated with regulation of plant growth and development.

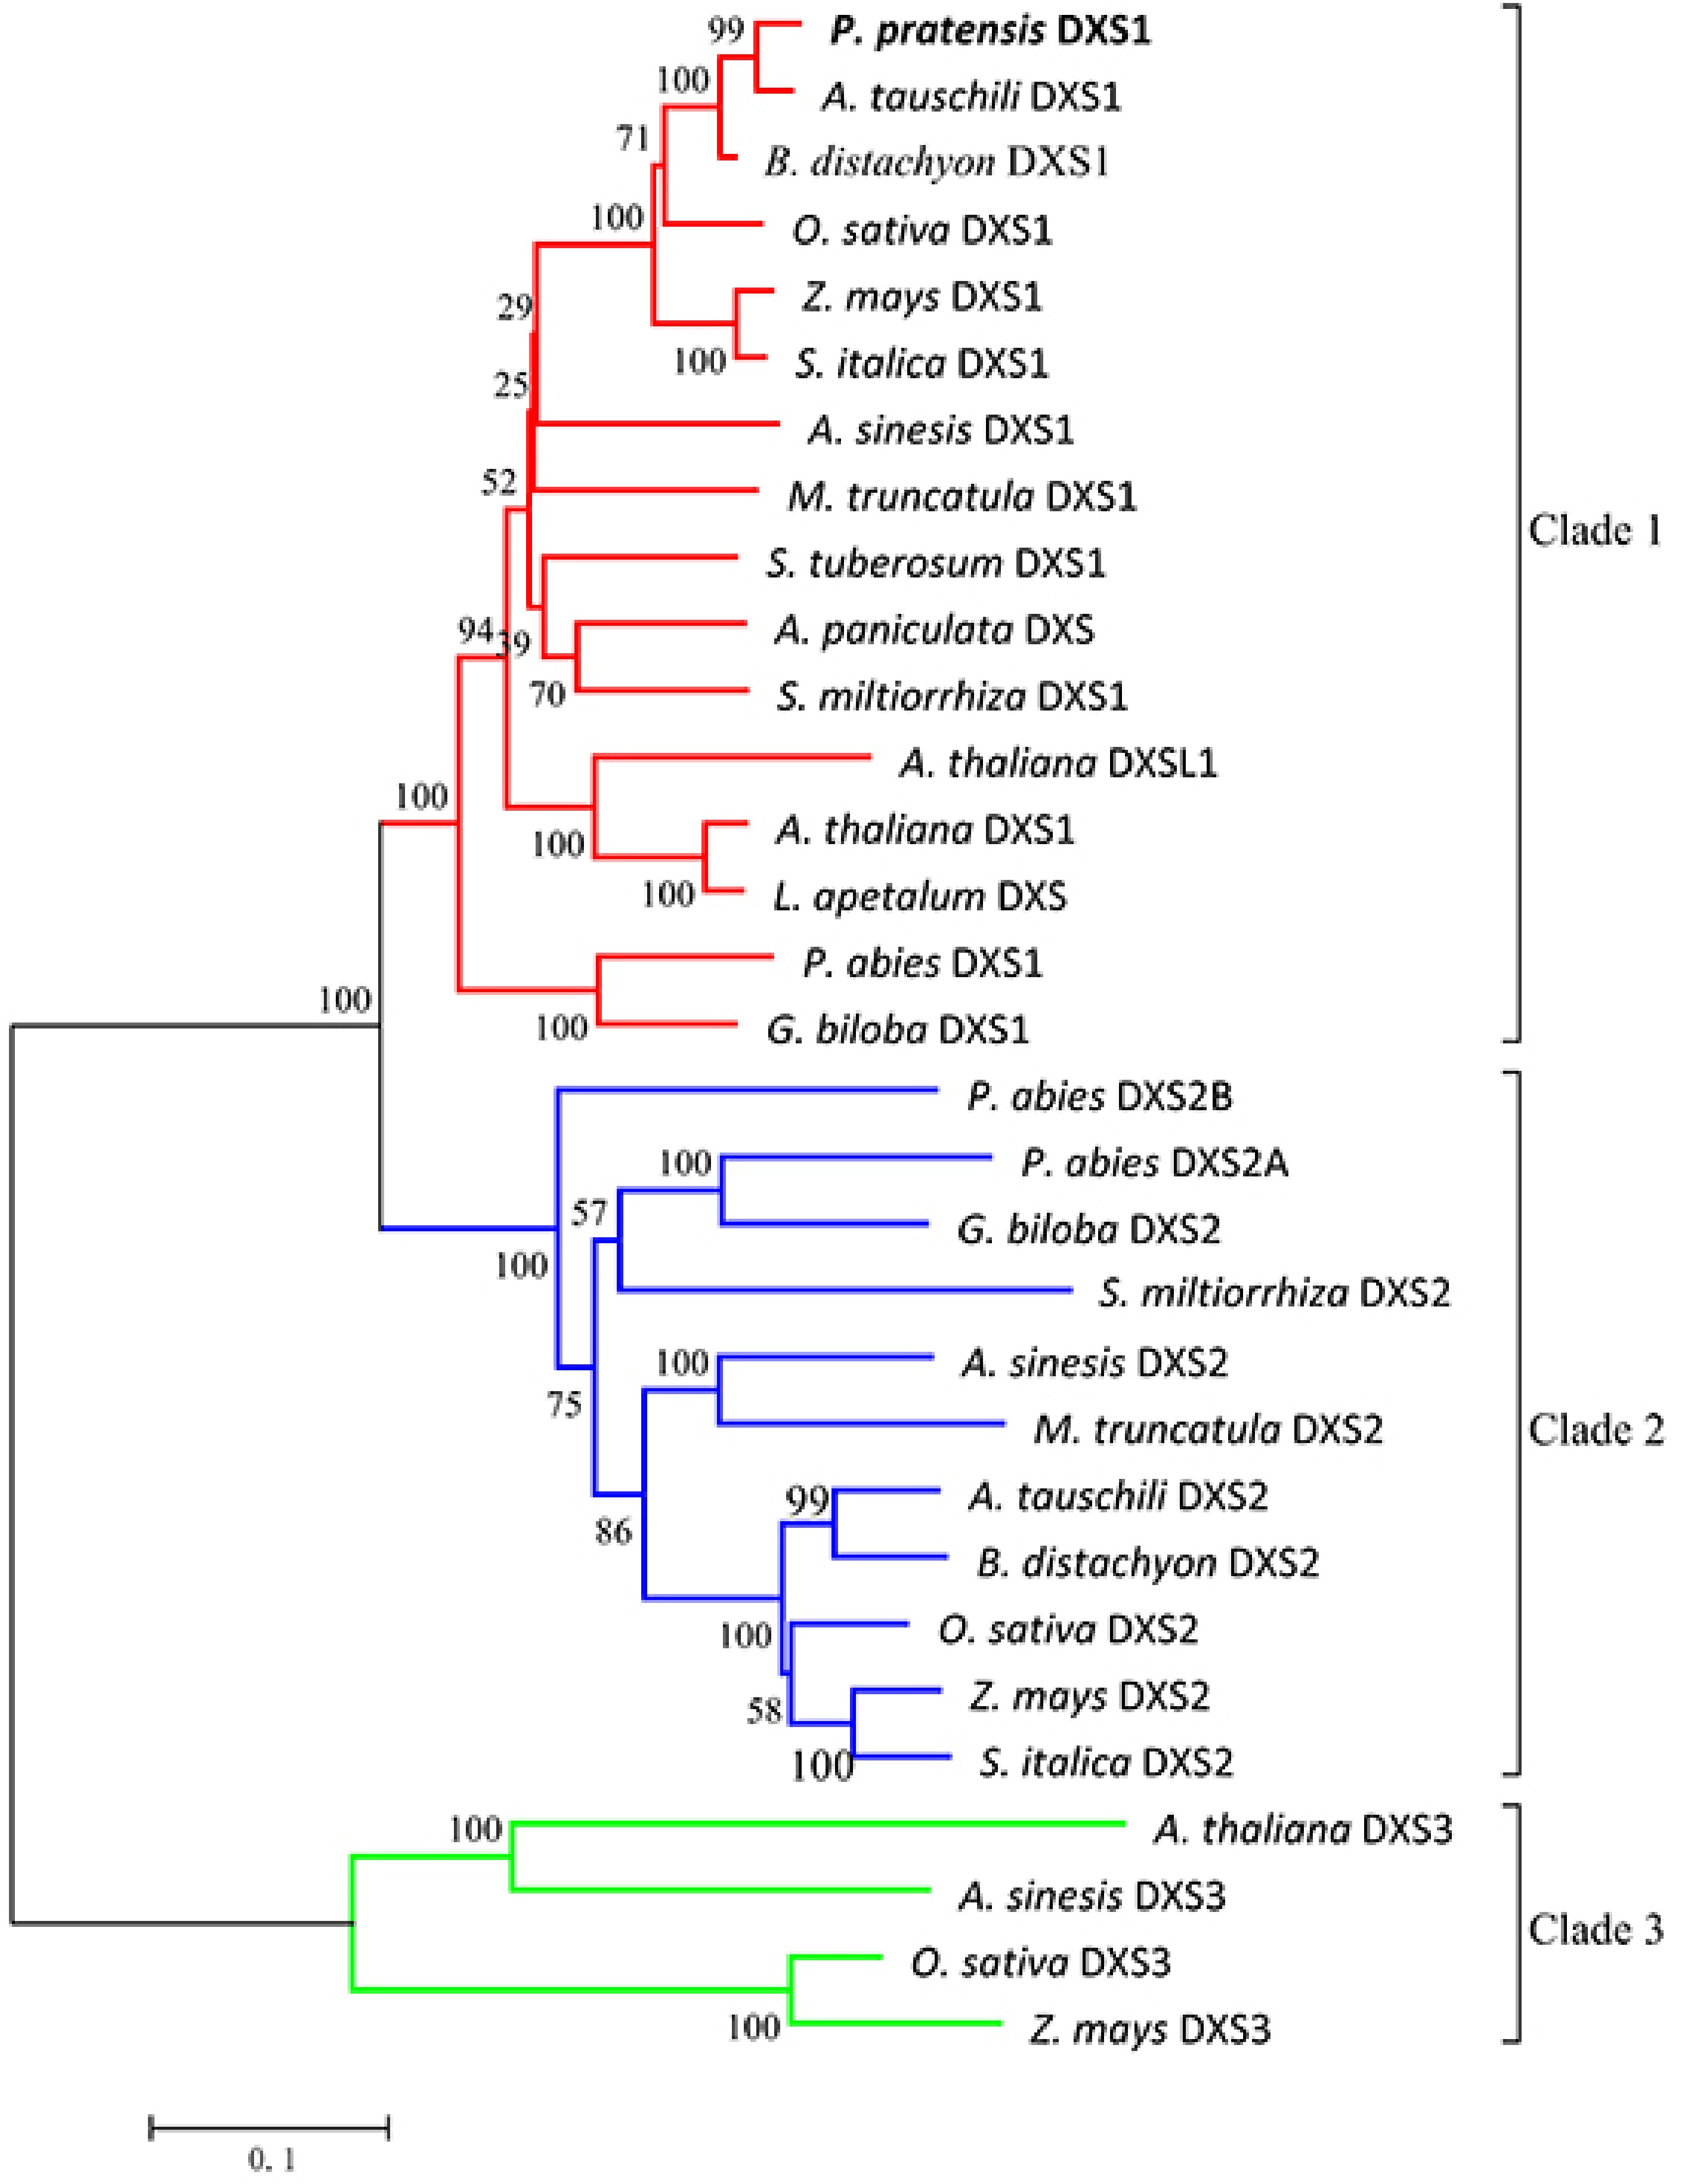
      Figure 3.  Phylogenetic tree of plant DXS proteins. The tree was constructed with the neighbor-joining method and the JTT model using MEGA 5.0 software with 1,000 bootstrap values. The TAIR or GenBank accession numbers of DXS amino acid sequences used for phylogenetic analysis are as follows: Arabidopsis thaliana (DXS1 clade At4g15560, DXSL1 clade At3g21500, DXS3 clade At5g11380); Oryza sativa (DXS1 clade NP_001055524.1, DXS2 clade NP_001059086.1, DXS3 clade BAA83576.1); Zea mays (DXS1 clade NP_001157805.1, DXS2 clade NP_001295426.1, DXS3 clade HQ113384.1); Aquilaria sinensis (DXS1 clade AFU75321.1, DXS2 clade AHI62962.1, DXS3 clade AFU75320); Andrographis paniculata (DXS, AAP14353.1); Lepidium apetalum (DXS, KU314760.1); Medicago truncatula (DXS1 clade CAD22530.1, DXS2 clade CAN89181.1); Picea abies (DXS1 clade ABS50518.1, DXS2A clade ABS50519.1, DXS2B clade ABS50520.1); Salvia miltiorrhiza (DXS1 clade ACF21004.1, DXS2 clade ACQ66107.1); Solanum tuberosum (DXS1 clade NP_001275130.1); Ginkgo biloba (DXS1 clade AAS89341.1, DXS2 clade AAR95699.1); Aegilops tauschili (DXS1 clade XP_020161542.1, DXS2 clade XP_020164020.1); Brachypodium distachyon (DXS1 clade XP_003568467.1, DXS2 clade XP_003557443.1); Setaria italica (DXS1 clade XP_004962111.1, DXS2 clade XP_004955719.1). Poa pratensis (DXS1 clade MG257788).

    • The 5’ upstream region of PpDXS1 gene (1,649 bp) were also isolated from Kentucky bluegrass (Supplemental Fig. S2). Cis-acting elements of the 5’ upstream region were predicted using the PlantCARE and MAT-INSPECTOR databases. The predicted elements corresponded to light response, hormone metabolism, and stress defense regulation (Fig. 4). Relevant response elements included the ABRE element (ABA response), CGTCA-motif (related to MeJA response), GARE-motif (gibberellin response), box-W1 (fungal responsive element), G-box and L-box (involved in light responsiveness), and protein binding sites (HD-ZIP3, and MBS). The impacts of the different motifs and elements on inducible PpDXS expression and function in Kentucky bluegrass were examined further.

      Figure 4.  PpDXS1 promoter from P. pratensis. Putative cis elements are labeled as shown, Element positions are shown proportional to the full length of the promoter.

    • To gain insight into the expression pattern of PpDXS1, several tissues at a range of growth stages were examined in a quantitative real-time PCR experiment. As shown in Fig. 5, PpDXS1 transcripts were detectable in different tissues (roots, leaf sheaths, and leaves), but accumulated predominantly in green tissues including young and mature leaves. The transcript abundance of PpDXS1 was highest in mature plants, followed by young leaves. It is evidenced that the PpDXS1 gene belonged to DXS1 type (consistent with phylogenetic analysis) and may be involved in photosynthesis. Additionally, the transcript level of PpDXS1 was lower at the heading stage than in the developing leaves.

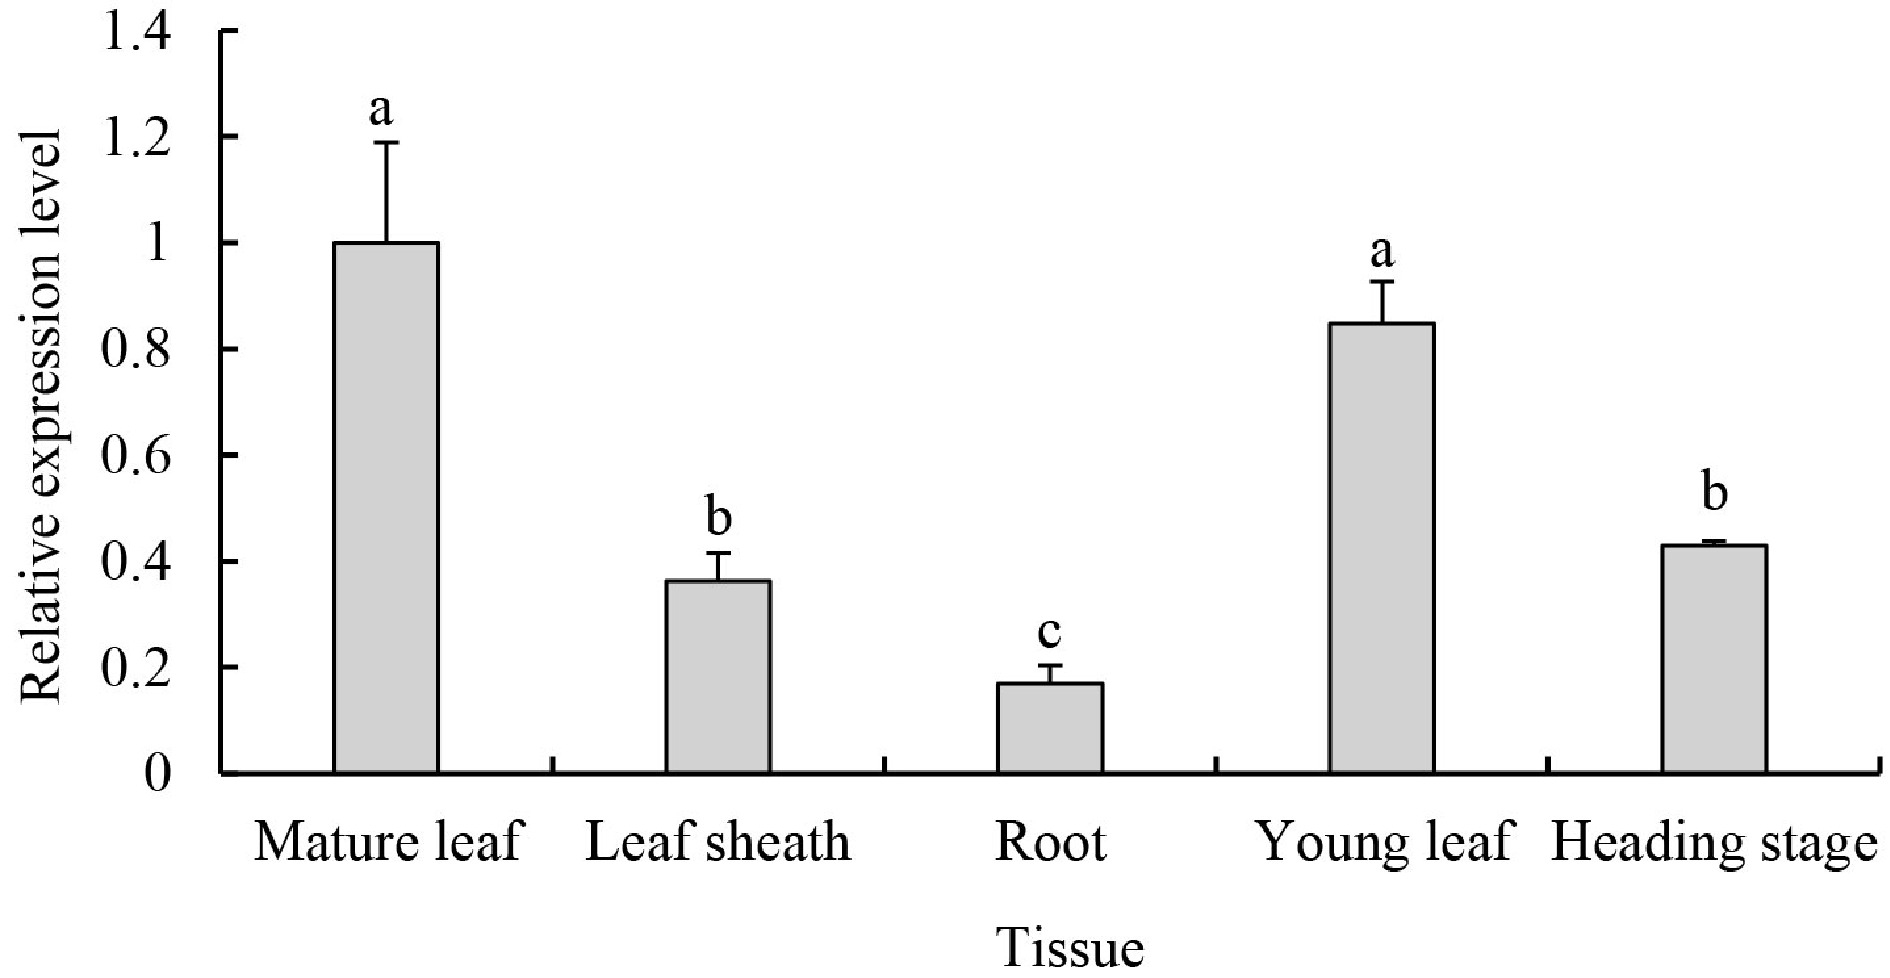
      Figure 5.  PpDXS1 expression analysis in P. pratensis. Quantitative RT-PCR analysis of PpDXS1 gene expression. Fully expanded leaves (named as mature leaf), leaf sheaths and roots at vigorous growth stage were used for gene organ/tissue-specific expression analysis. For the time-series gene expression analysis, young leaves at early growth stage (named as young leaf), mature leaves at vigorous growth stage (similarly named as mature leaf), and old leaves at heading stage (named heading stage) were used. All qRT-PCR reactions were performed from triplicate biological samples. The 2ΔΔCᴛ method was used to calculate the fold expression relative to the control (mature leaf). Means of three replicates ± standard error is shown. Bars superscripted with different letters are significantly different at p < 0.05.

    • DXS is the rate-limiting enzyme in the MEP pathway, which is involved in the formation of diverse terpenoids, including important phytohormones for plant growth. Results shown in Fig. 4 show that the response elements and motif of ABA (ABRE), JA (CGTCA-motif), GA(GARE-motif), and fungal (box-W1) were identified in the PpDXS1 promoter sequence. Therefore, we examined the effects of exogenous factors on PpDXS1 expression in P. pratensis. Plants were exposed to foliar applications of GA3, ABA, JA, or pathogen inoculation, and the relative expression level of PpDXS1 were determined in the leaves collected 0, 3, 6, and 12 h after treatment (Fig. 6).

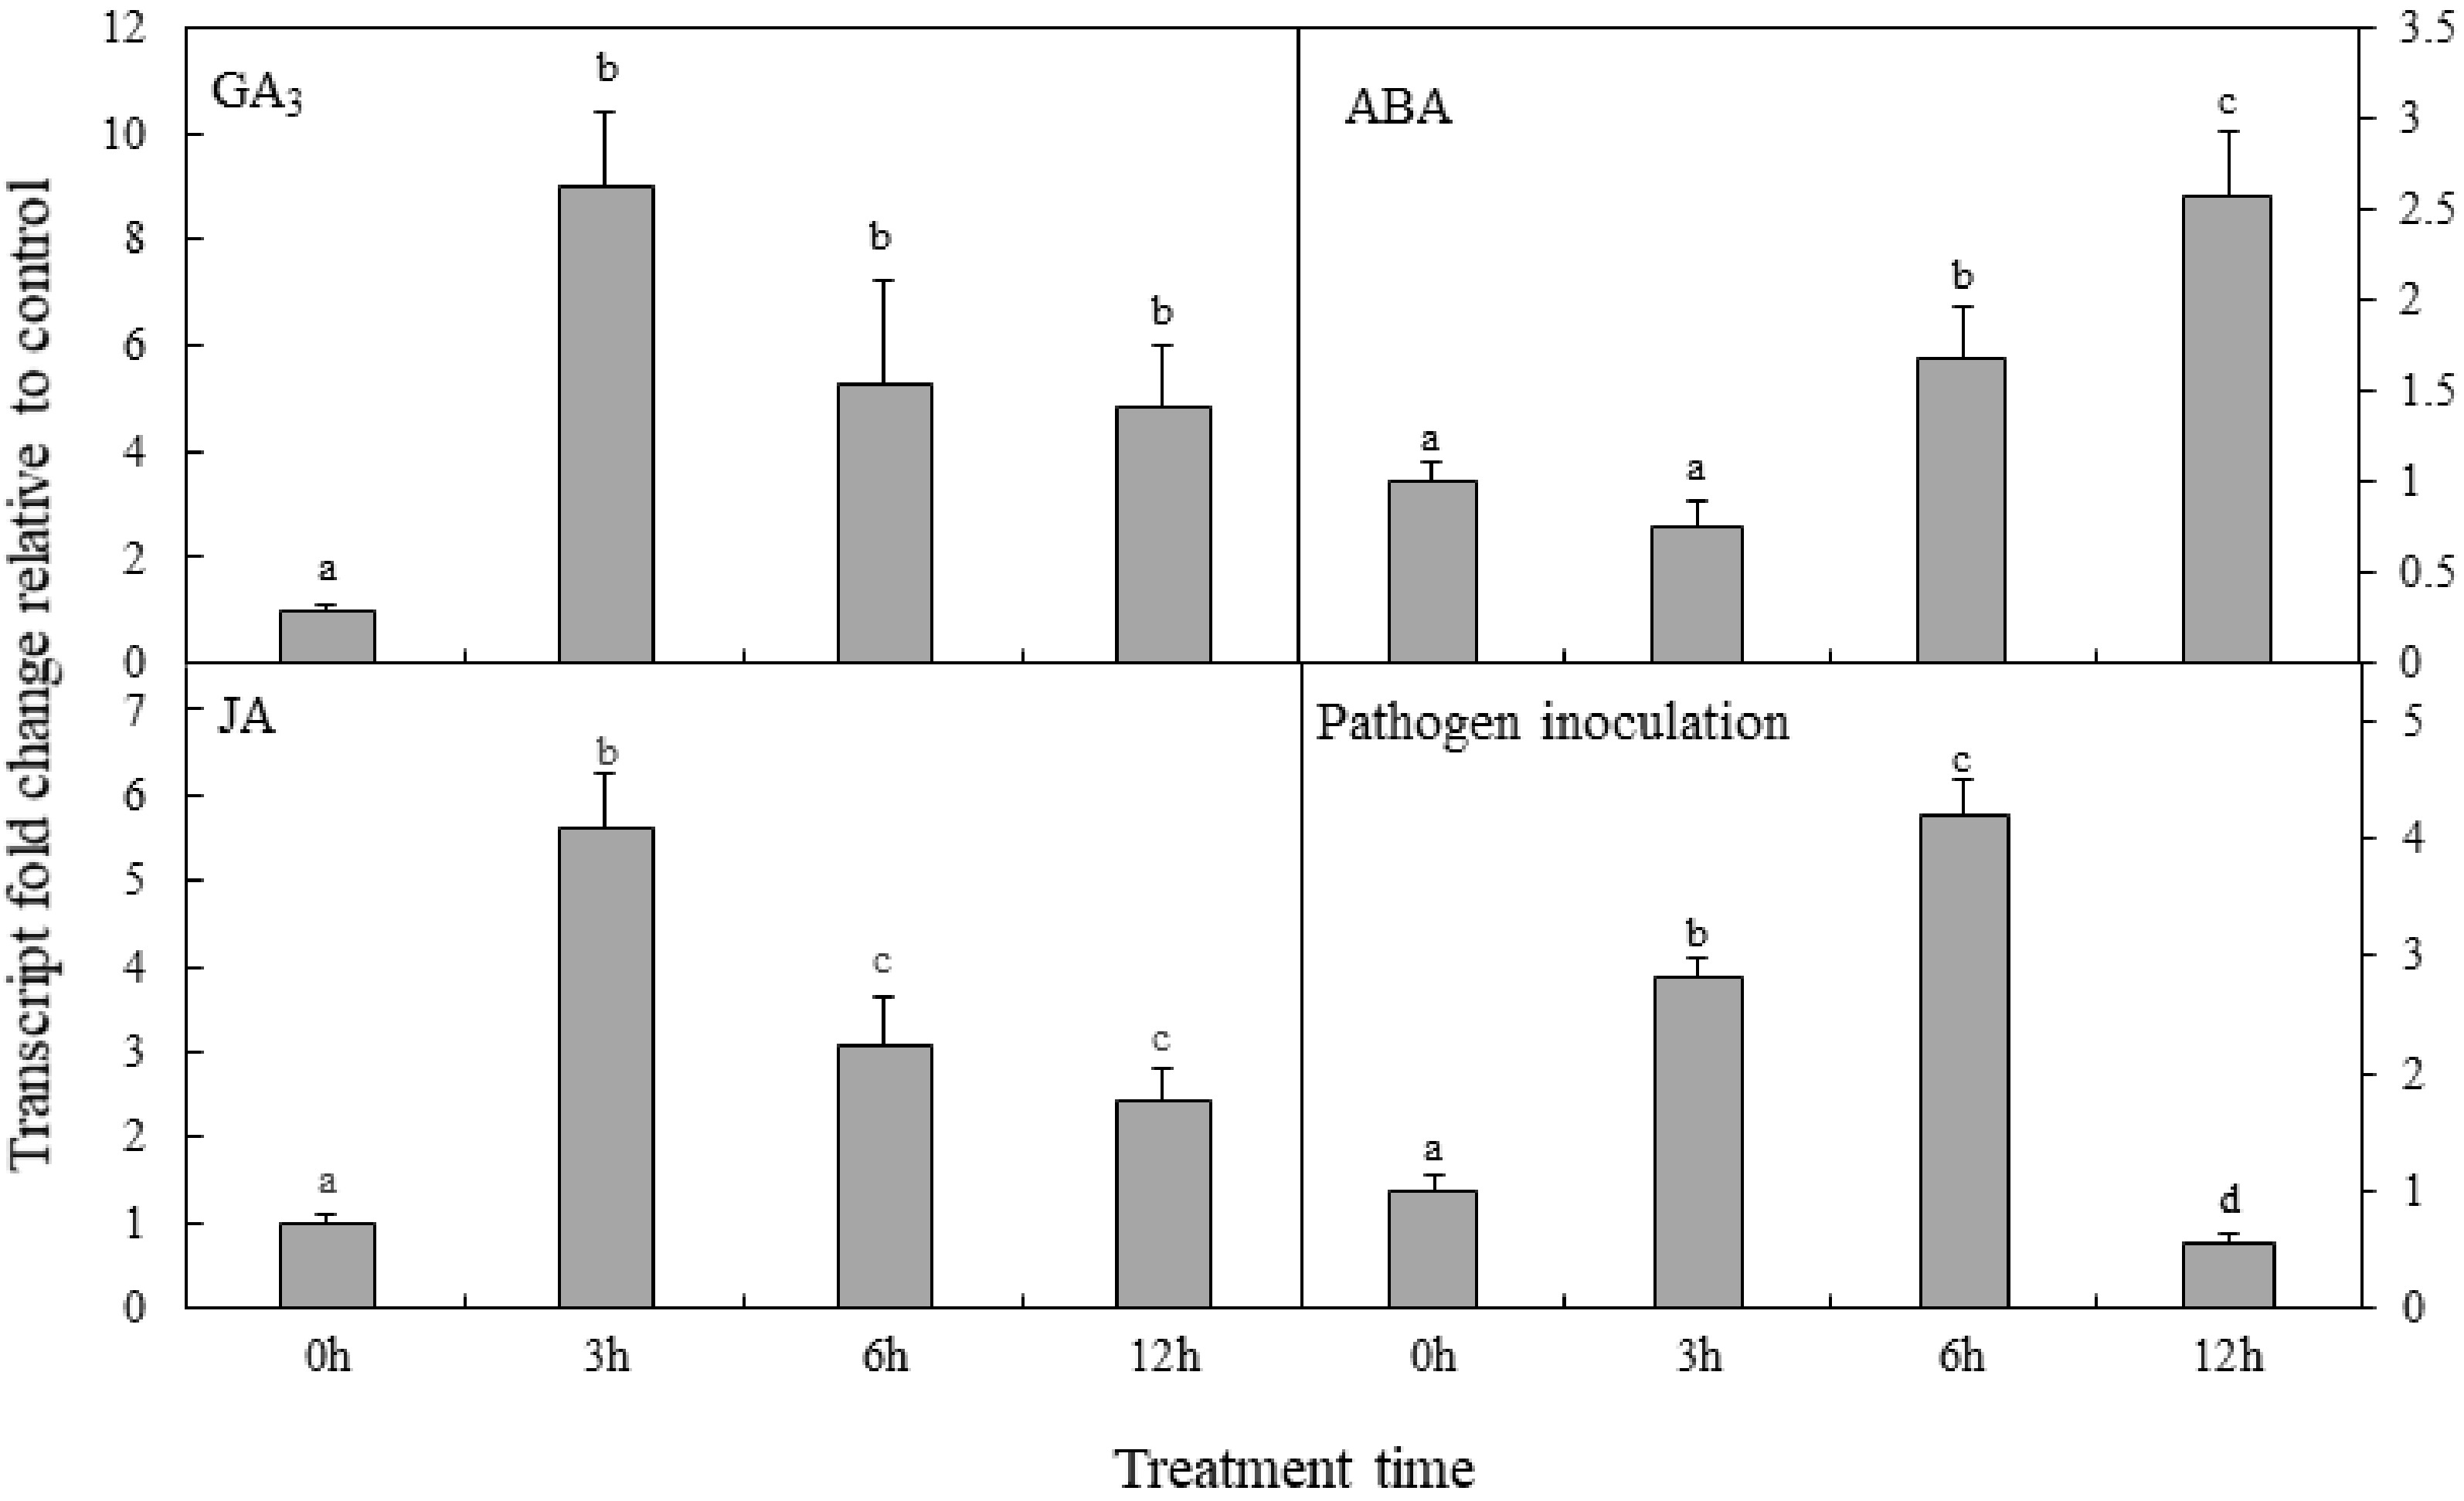
      Figure 6.  Analysis of PpDXS1 expression after exogenous phytohormone treatment or pathogen inoculation in P. pratensis. Quantitative real-time PCR analysis of relative PpDXS1 expression after foliar exposure to gibberellic acid (GA3), abscisic acid (ABA), jasmonate (JA), and pathogen inoculation. All qRT-PCR reactions were performed from triplicate biological samples. The 2ΔΔCᴛ method was used to calculate the fold expression relative to the control (0h-point). Mean of three replicates ± standard error is shown. Bars superscripted with different letters are significantly different at p < 0.05.

      As shown in Fig. 6, GA3 treatment had a positive effect on PpDXS1 gene expression and the level peaked 3 h after application. Meanwhile, increased transcript level of PpDXS1 6 h and 12 h after ABA treatment was observed, while the fold change of ABA regulation has a lower value, compared to GA3 treatment. It is predicted that exogenous ABA have a slight impact on PpDXS1 gene expression, compared with GA3 treatment. After JA treatment, PpDXS1 expression was induced and peaked at the 3h-point (5.6-fold). A similar response was seen after pathogen inoculation. Gene expression was stimulated, and peaked at 6 h after inoculation (4.2-fold). On the other hand, it is indicated that the inductive effect of exogenous JA was faster than the pathogen infection for P. pratensis.

    • To test the role of PpDXS1 in regulating the terpenoid biosynthetic pathway in P. pratensis, three transgenic lines with antisense expression of PpDXS1 gene and empty vector (CK) of Kentucky bluegrass were obtained by screening and identification.. In order to further determine the positive plants, western blot analysis was carried out for the extracted protein from transgenic plants and the CK plant (Fig. 7a). The result showed that the PpDXS1 protein level (the band of 76 kDa) decreased in the transgenic antiDXS1-56/-102 lines, except the antiDXS1-101 strain which was not used for further research (Fig. 7a and supplemental Table S1). It is indicated that DXS1 protein accumulation could be decreased by antisense expression of the PpDXS1 gene. It should be noted here that there is another band below the target band (i.e. 74 kDa) in Fig. 7a, which indicated that the second band could be the DXS2 protein of Kentucky bluegrass as the specificity of the PpDXS1 polyclonal antibody in this study was not very high.

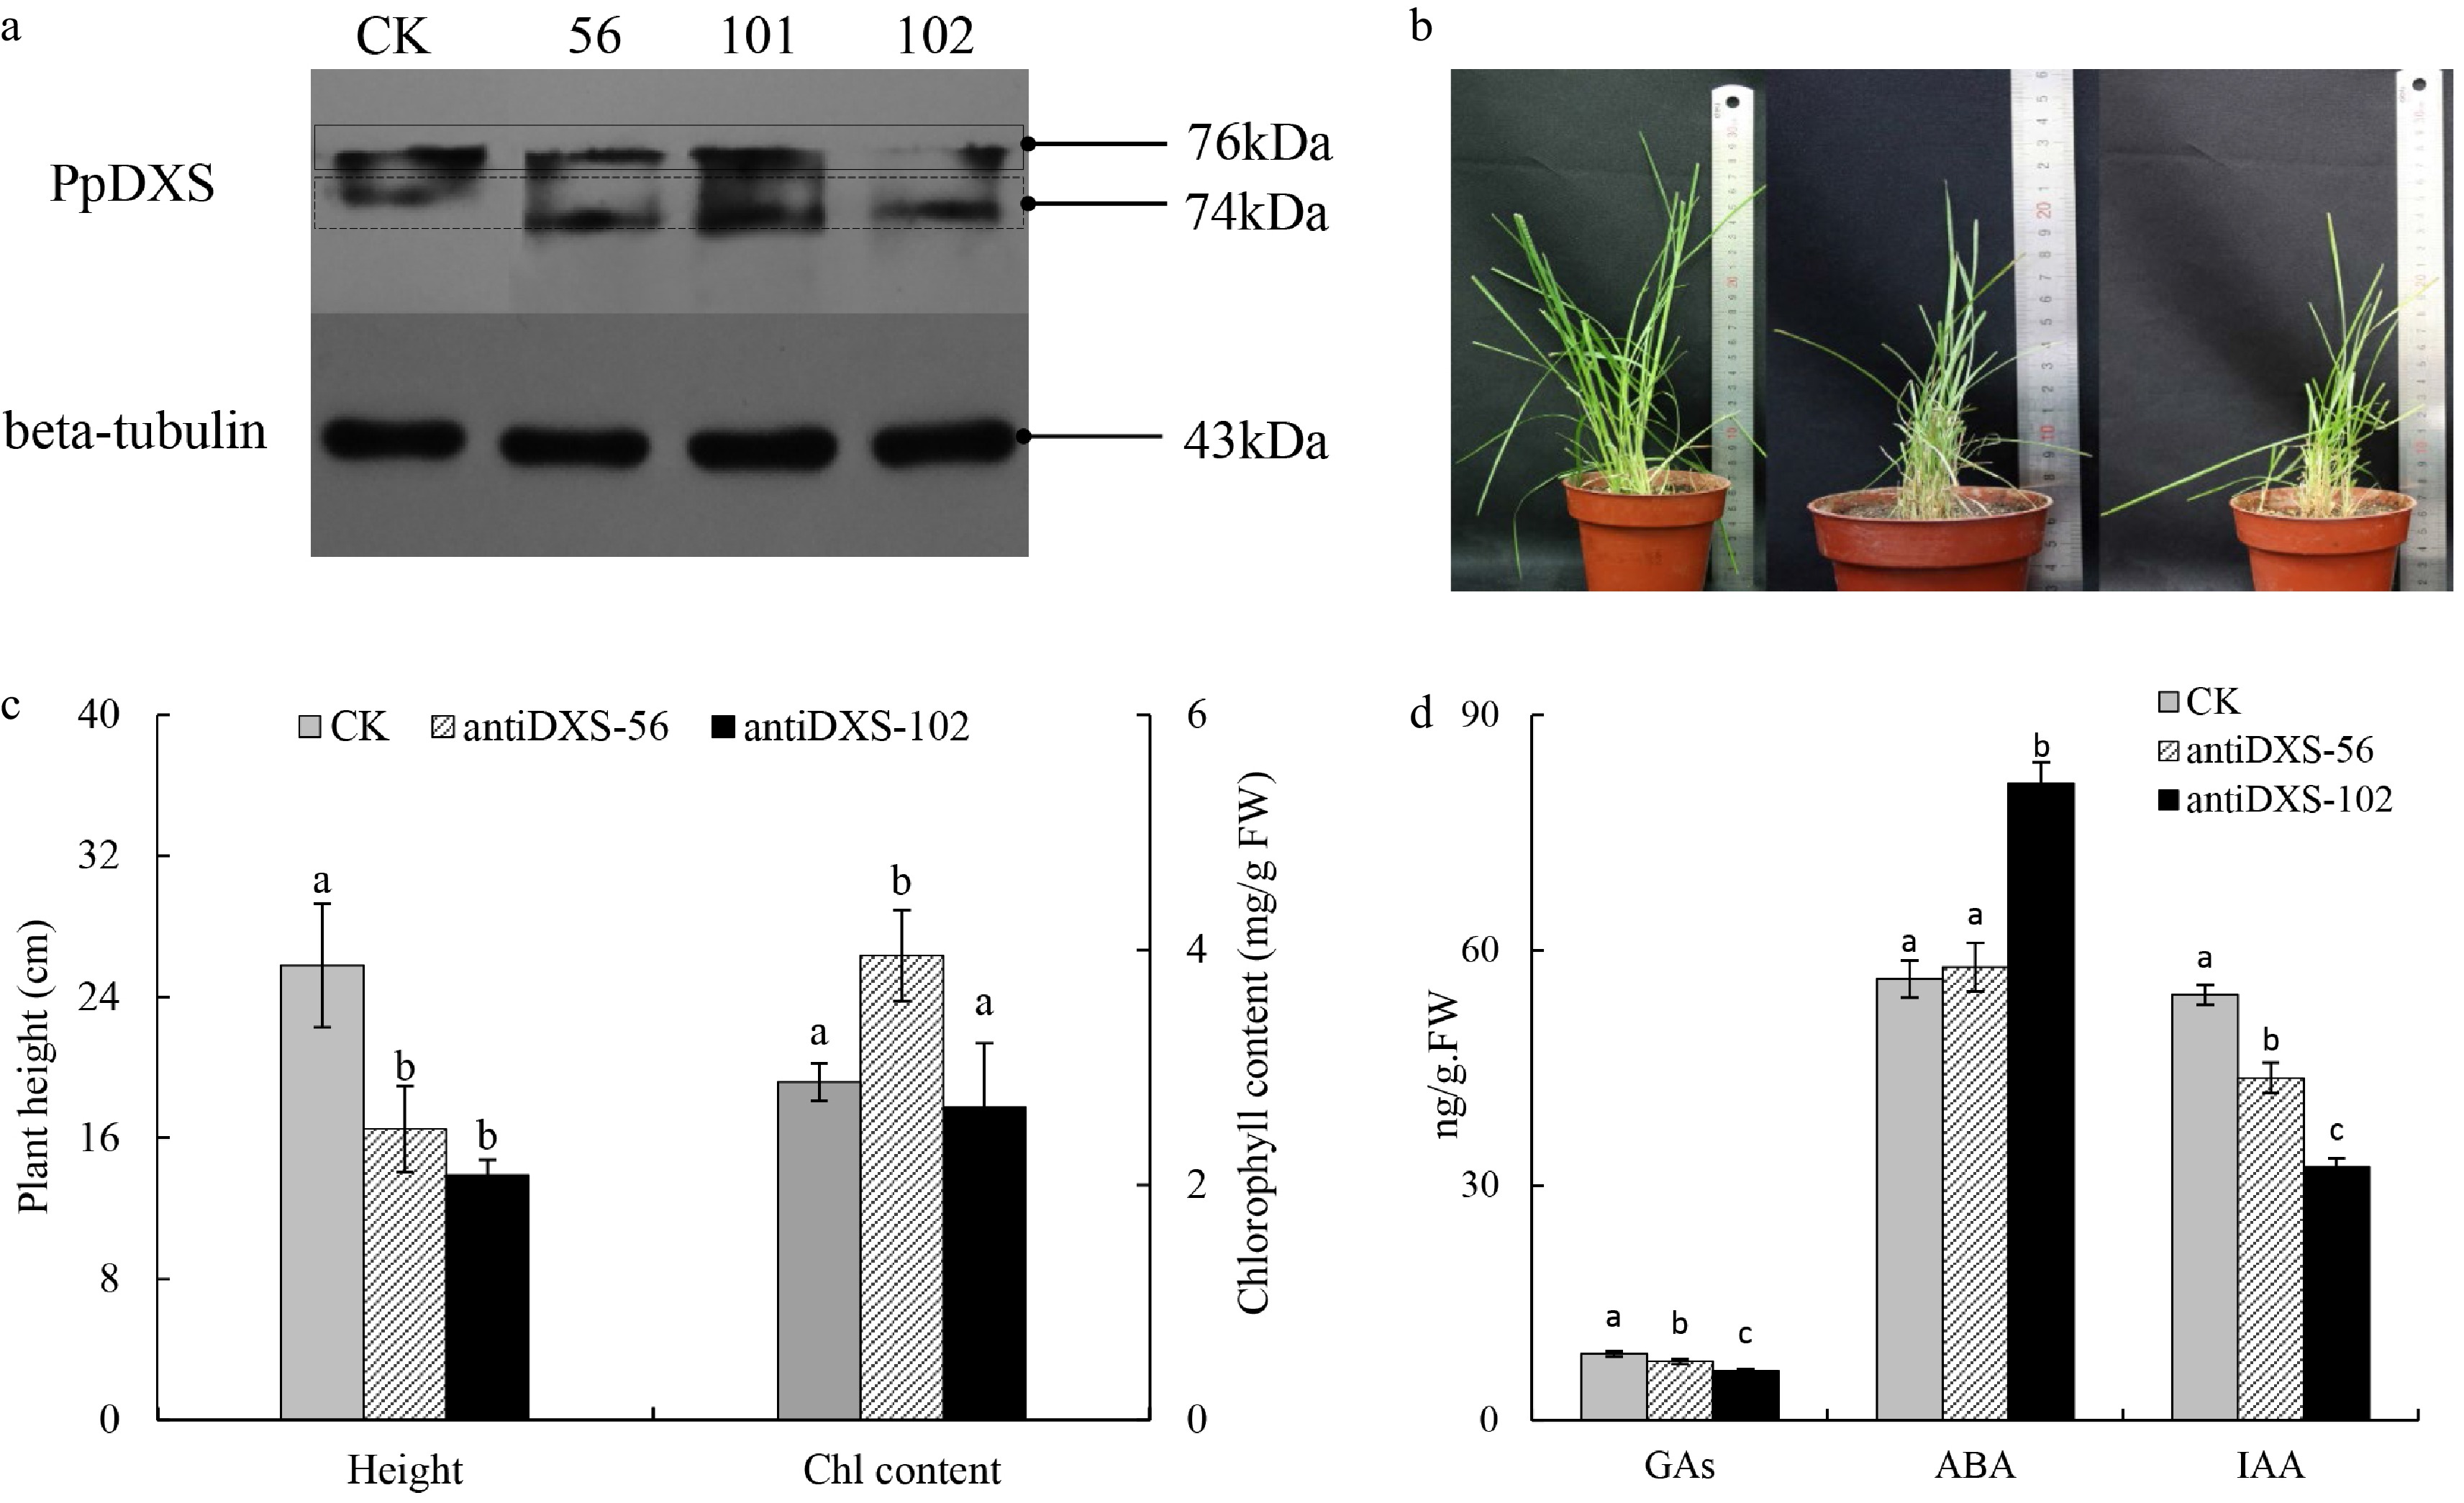
      Figure 7.  Comparison of CK and transgenic lines underexpressing PpDXS1 in Poa pratensis. (a) Western analysis of PpDXS1 protein levels in mature leaves of CK and antiDXS1-56, -101, and -102. (b) The photos of CK, antiDXS1-56 and antiDXS1-102 transgenic plants (left to right). (c) Plant height and total chlorophyll content of CK, antiDXS1-56 and antiDXS1-102 transgenic plants. Bars superscripted with different letters are significantly different at p < 0.05. (d) Phytohormone content of CK, antiDXS1-56 and antiDXS1-102 transgenic plants. Means of three replicates ± standard error is shown. The data were subjected to ANOVA test to determine the LSD between CK (control) and transgenic lines (antiDXS1-56 and antiDXS1-102) at p < 0.05.

      Additionally, transgenic lines displayed the phenotype of reduced plant height. As shown in Fig. 7b and c, Plant height was reduced in transgenic lines by approximately 40% relative to CK. For chlorophyll, the total pigment content of transgenic antiDXS1-56 is significantly higher than that of CK, but the difference between antiDXS1-102 and CK is not significant (Fig. 7c).

      Differences in phytohormones content between transgenic lines and the control plant were also analyzed. All DXS1-transformed lines showed decreased GAs and IAA content compared with that of the control (Fig. 7d). By contrast, the accumulation of ABA in the transgenic plant were increased. There are different accumulation among GAs, IAA and ABA content in transgenic P. pratensis, which may be related to the various regulation of DXS1 gene. In general, it is illustrated that PpDXS1 is an important gene in the regulation of phytohormone and chlorophyll accumulation.

    • To study the effects of PpDXS1 underexpression on plant growth and development, RNA-seq analysis was used to compare transcriptional level in CK and an underexpressing antisense line (antiDXS1-102). Differential gene expression analysis revealed a total of 3,800 genes whose expression significantly differed (log2 fold change ≥ 1 and q value < 0.005) between antiDXS1-102 and CK, 1845 and 1955 of which were up- and down-regulated in antiDXS1-102, respectively (Supplemental Fig. S3a). The differentially expressed genes (DEGs) were involved in diverse biological processes such as terpene synthase activity, protein kinase activity, and metabolic processes (Supplemental Fig. S3b, c). On the basis of enrichment analysis and related keywords of KEGG pathway and GO terms, some DEGs between CK and antiDXS1-102 line were summarized in Fig. 8a. Firstly, one DXS unigene was down-regulated in the transgenic line, while other related isoprenoid biosynthetic genes (e.g. FPS and SPS) are up-regulated. Secondly, the expression of genes related to auxin biosynthesis and signal transduction were affected, for example the transcripts encoding auxin responsive factor 9 (ARF9) was down-regulated. Similarily, the GA20ox2 gene involved in gibberellin biosynthesis was down-regulated in the transgenic line. Conversely, ABA biosynthetic genes were enriched in the transformed line compared to CK, such as phytoene synthase (PSY) gene and 9-cis-epoxycarotenoid dioxygenase 1 (NCED1) gene. Finally, in the pathway of chlorophyll biosynthesis and metabolism, the expression level of geranylgeranyl reductase (GGR) genes and chlorophyllide a oxygenase (CAO) genes that promoted chlorophyll a (or side chain) synthesis were increased. The CLH gene which directs chlorophyll degradation were down-regulated in the antiDXS1-102 line, while the increase of chlorophyll content in the antiDXS1-102 line was not significant. These observations were consistent with the above result of phenotype and physiological characteristics in the transgenic line, which indicate that PpDXS1 directly influences the production of physiological metabolites, particularly those producing GA, IAA, and ABA at the end of the MEP pathway.

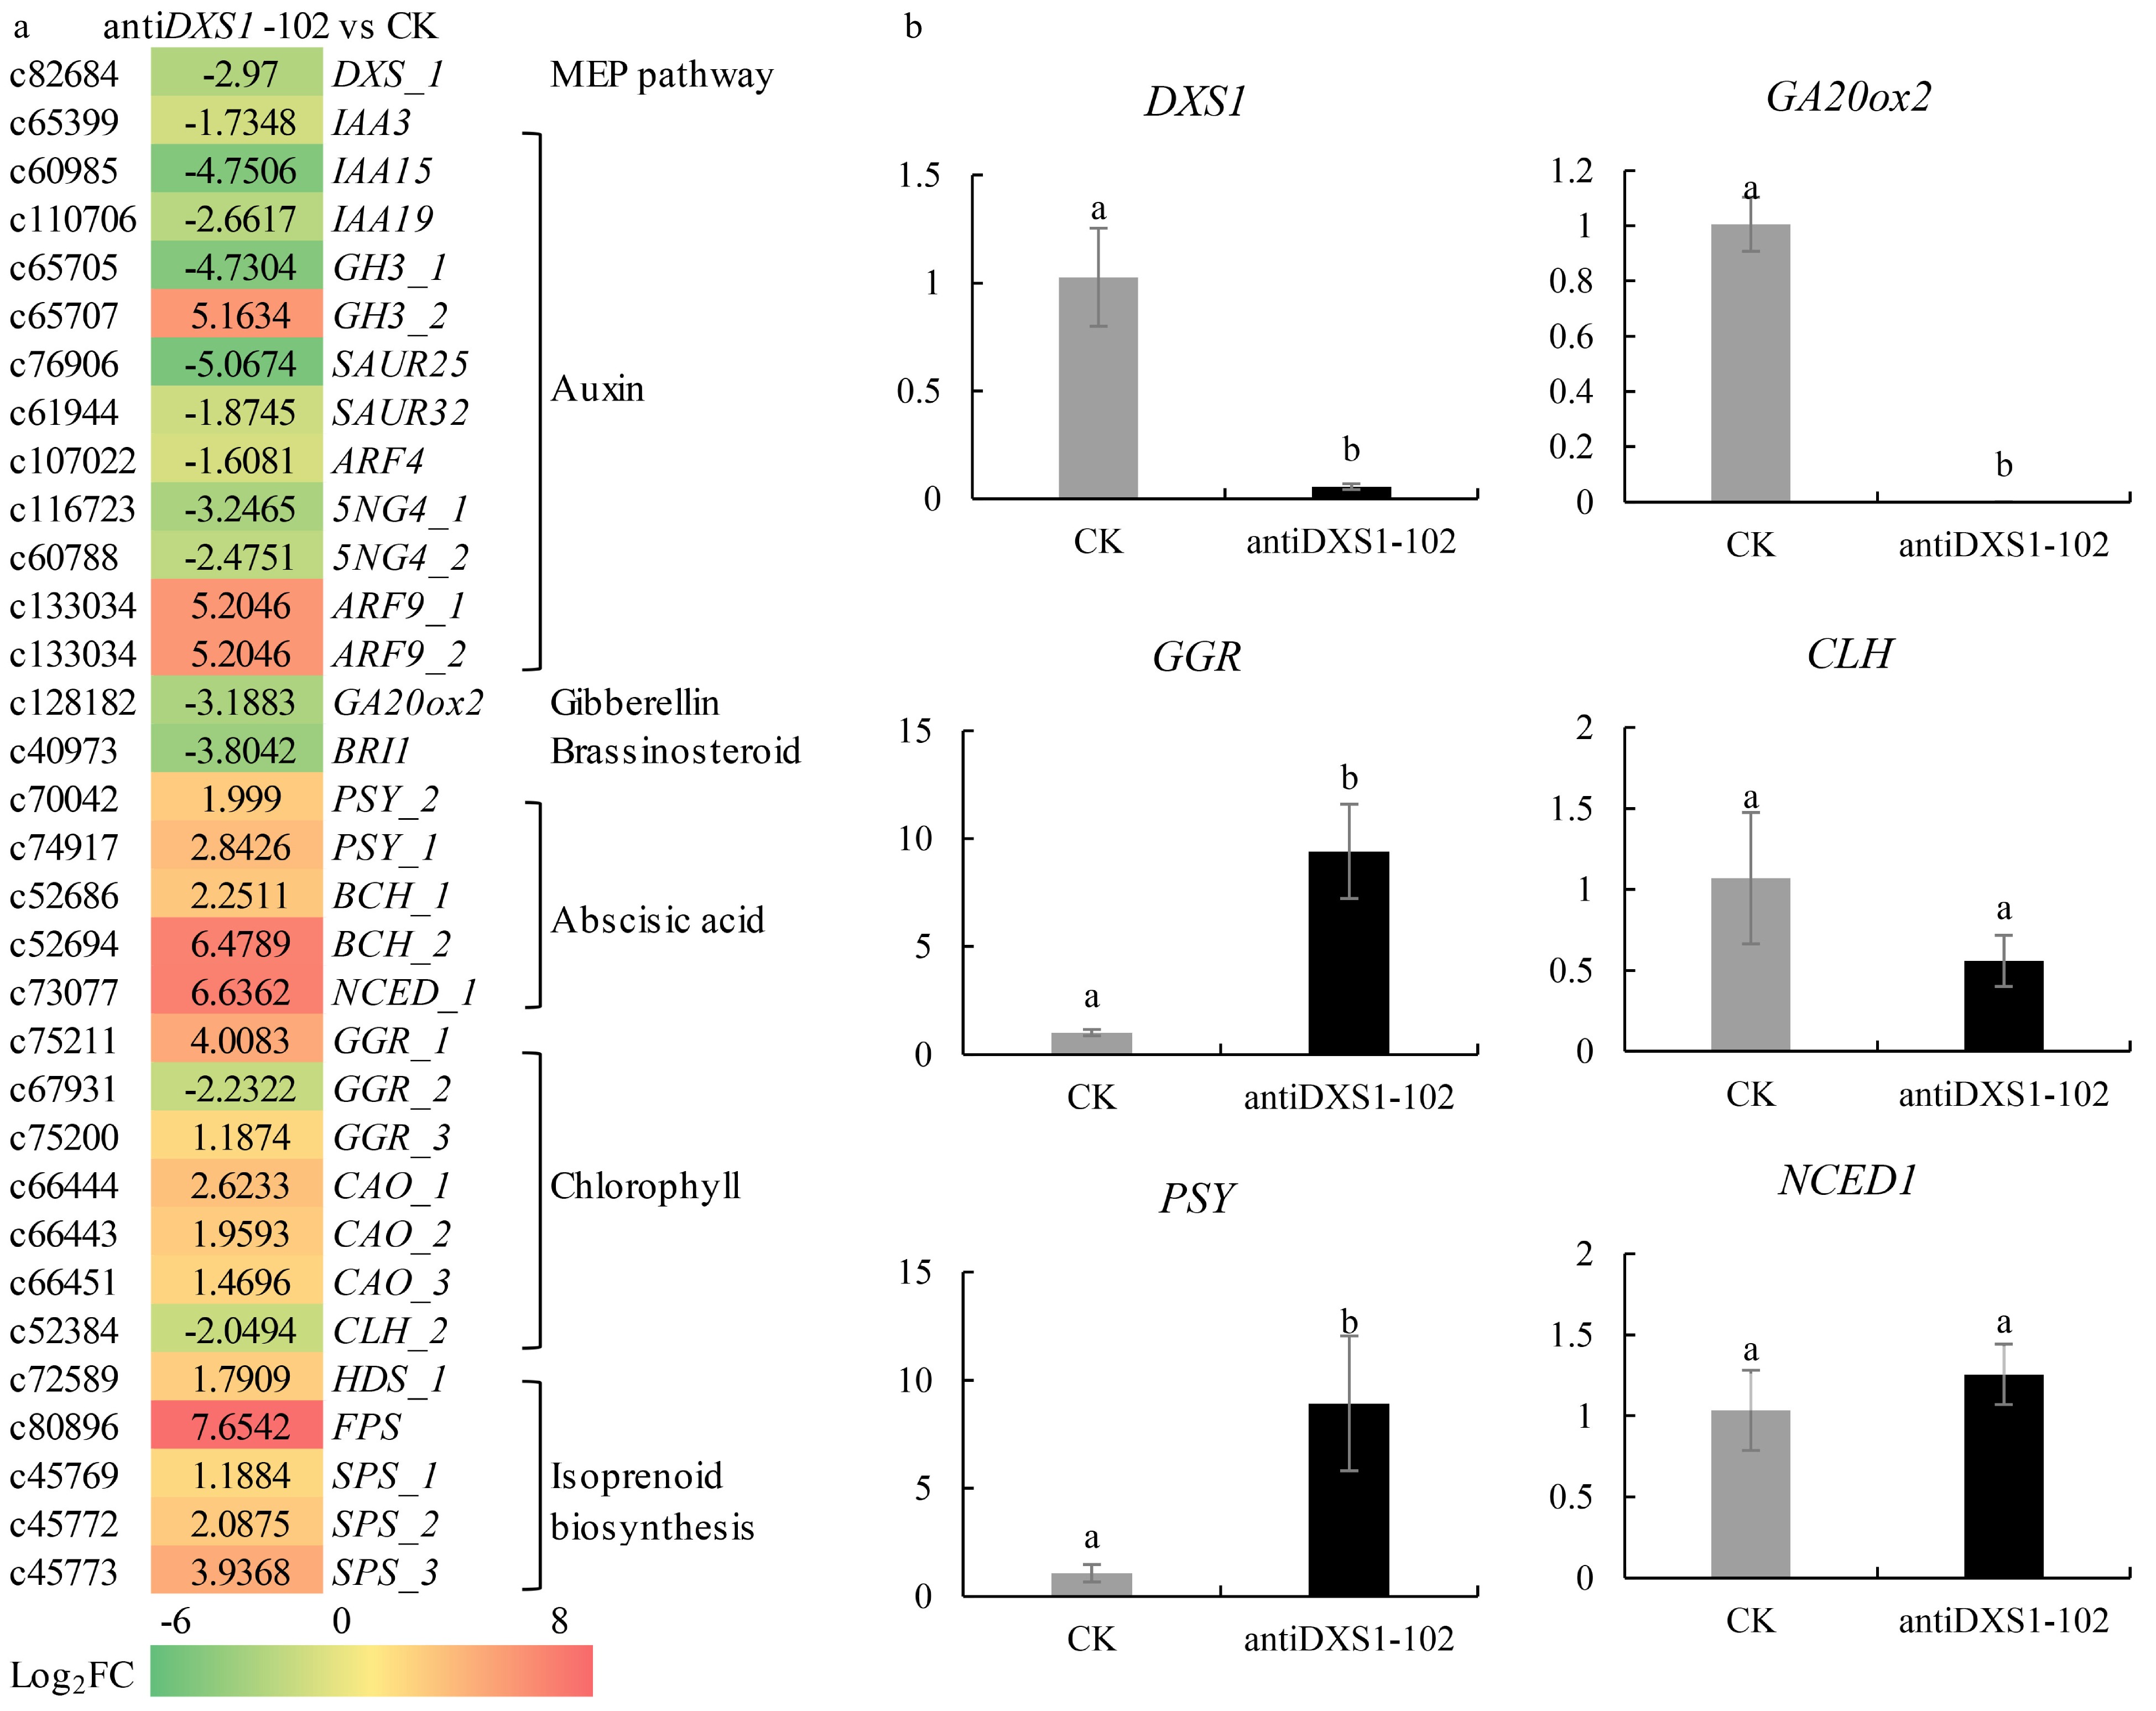
      Figure 8.  Differential expression analysis of related genes in CK and antiDXS1-102. (a) Heatmaps of differentially expressed genes (DEGs). DXS, 1-deoxy-D-xylulose-5-phosphate synthase; IAA3/15/19, auxin-responsive protein 3/15/19; GH3, indole-3-acetic acid-amido synthetase GH3 gene family; SAUR25/32, auxin-responsive SAUR protein family; ARF9, auxin responsive factor 9; GA20ox2, gibberellin 20 oxidase 1; BRI1, brassinosteroid-insensitive 1; PSY, phytoene synthase; BCH, beta-carotene hydroxylase; NCED1, 9-cis epoxycarotenoid dioxygenase 1; GGR, geranylgeranyl reductase; CLH, chlorophyllase; CAO, chlorophyllide a oxygenase; HDS, 1-hydroxy-2-methyl-2-butenyl 4-diphosphate (HMBPP) synthase; FPS, farnesyl diphosphate synthase; SPS, solanesyl-diphosphate synthase. Upregulation and downregulation in antiDXS1-102 compared to CK are shown using a color scale for log2 (antiDXS1-102/WT ratio) values. On the left side of the color block is the Unigene ID from the transcriptome database, and on the right side is the gene annotation in the database. (b) qRT-PCR results of selected six DEGs. The transformed line of empty vector (CK) is the control and the value is one. The 2ΔΔCᴛ method was used to calculate the value of fold change compared to the control (CK, the transformed line of empty vector). All qRT-PCR reactions were performed from triplicate biological samples. Mean of three replicates ± 1 standard error is shown. Bars with superscript letters are significantly different at p < 0.05.

      To verify the RNA-seq data and further investigate the above DEGs, quantitative real-time PCR assays were performed for selected genes with significantly different transcription levels between CK and antiDXS1-102, namely DXS1, GA20ox1, GGR, CLH, PSY1, and NCED1. Expression of DXS1 and GA20ox1 was lower in antiDXS1-102 than in CK (Fig. 8b), indicating that antisense expression of PpDXS1 impacted the lower transcription of genes involved in GA synthesis. Meanwhile, GGR gene, involved in the biosynthesis of phytyl diphosphate and chlorophyll a, exhibited higher expression in the antiDXS1-102 line. Higher expression of PSY was seen in antiDXS1-102 than in CK, which corresponded with the RNA-seq results.

    • The MEP pathway, also known as the non-mevalonate route, was identified as an alternative terpenoid biosynthesis pathway in Eubacteria and higher plants[32]. There has been substantial progress in the identification of DXS genes, the first rate-limiting enzyme of the MEP pathway[18,33,34]. Although DXS1 function has been studied in many plants, little is known about the Poaceae family and in particular turfgrasses. In this study, a 2139 bp ORF and the upstream region of the PpDXS1 gene were isolated from P. pratensis. To our knowledge, this is the first report of DXS1 isolation from turfgrass, and the first study to examine metabolic regulation of isoprenoid biosynthesis in this plant.

      DXS1 has also been annotated in Aegilops tauschii (AetDXS1) and Brachypodium distachyon (BdDXS1) with its nucleotide sequence released in NCBI, which show high similarity to PpDXS1 as found in this study, however, the physiological functions of AetDXS1 and BdDXS1 have not been previously reported. In this study, it was found that PpDXS1 possesses a conserved motif with a thiamine diphosphate binding site and transketolase motif. Bioinformatic subcellular localization prediction suggested that PpDXS1 is located in the chloroplast. In the present study, the PpDXS1 gene expression occurred in the leaves, leaf sheath, and root with the highest transcription level in leaves (Fig. 5). In Medicago truncatula and tobacco plants, DXS1 gene was also relatively higher in leaves and stems than in the roots[9,35]. As shown in the results of the phylogenetic tree and expression assay in different tissues (Fig. 3 & 5), it is indicated that PpDXS1 gene is probably in clade 1 of the DXS gene family, and is mainly expressed in leaves. Previous studies also suggest that DXS1 type are responsible for the primary metabolism, including chlorophyll biosynthesis and photosynthetic process, and mainly performed the function in leaves[12,36]. Additionally, Lois et al. reported that DXS1 is probably involved in fruit ripening and sesquiterpene formation[10]. However, in the recent report by García et al., it showed that DXS1 gene plays a key role in plant development and survival at the early growth stage besides being related to fruit carotenoid synthesis[37]. Therefore, it is indicated that DXS1 perform conserved but species-specific function, and it is important to explore the concrete roles of DXS isoforms in the regulation of plant growth and development.

      On the basis of prediction analysis on the 5’ upstream region which often contains binding sites of regulatory factors, PpDXS1 gene expression increased after treatment with GA3 and ABA. Similarly, Yang et al. reported that ABA treatment upregulated SmDXS transcription in Salvia miltiorrhiza hairy roots[38]. Interestingly, the fold change of GA treatment were generally higher than those of other induced treatments, which indicated that GA3 had more effect on PpDXS1 expression than ABA in P. pratensis. Also, plants produce secondary metabolites to adapt to unfavorable conditions, such as pathogen attack. JA and fungal infection act as signals to induce secondary metabolite biosynthesis by elevating expression of related genes. For example, StDXS1 transcript levels were lower in Solanum tuberosum with symptoms of late blight (caused by the oomycete Phytophthora infestans), but expression was induced up to 12 h post-infection[33]. Similarly, exogenous JA treatment stimulated the GrDXS expression in rose-scented geranium[20]. In our study, PpDXS1 transcript expression in leaves after JA treatment was highest at the 3h-point, increasing up to 6 h after pathogen inoculation. It is indicated that the pathogen infection has longer inductive effect of the expression of PpDXS1 compared with the JA treatment. Although these changes are only observed in the leaves, it can not be ignored that the low level of PpDXS1 gene expression is correlated with the pathogen inoculation and the accumulation of phytoalexin[21].

      DXS, as the rate-limiting enzyme of the MEP pathway, regulates the flux of the plant MEP pathway but how does it affect the biosynthesis of downstream terpenoids? The genetic transformation experiment described in the study was designed to evaluate the effects on plant growth and isoprenoid abundance. In this work, GAs and IAA levels were decreased, but higher accumulation of ABA occurred in the underexpression mutant compared to the CK plants of Kentucky bluegrass. In Arabidopsis, plants with DXS either overexpressed or suppressed different levels of the final isoprenoid products[39]. In brief, the total chlorophyll and ABA contents of DXS-suppressed plants were significantly lower than those of the control plants, but the expression of GA4 gene was up-regulated, and the overexpressed plants were the opposite. However, the GA content showed a higher level in Arabidopsis overexpressing the DXS1 gene from Morus notabilis[40]. Also, it is found that overexpression of DXS1 from potato (Solanum tuberosum) resulted in a higher accumulation of chlorophyll and decreased ABA and GA4 content in the transgenic Arabidopsis lines compared to control plants[37]. Although various research of homologous or heterologous expression found that overexpression or underexpression of DXS1 was linked to the same changes in isoprenoid levels[20], it was not clear whether lower expression of DXS necessarily led to decreased production of all isoprenoid end products, which merited further investigation.

      Aside from the measured changes in phytohormones content in this work, the significant decrease was observed in plant height of the antiDXS1-102 mutant compared to CK. These differences are likely due, in part, to observed changes in IAA and GA levels as changes in these hormones result in dwarf phenotype (Fig. 7d). Although DXS is the first rate-limiting enzyme in the MEP pathway, additional limiting and regulatory enzymes or genes also play indispensable roles in regulation of downstream terpenoids. For example, geranylgeranyl diphosphate synthase can also control the flow of intermediates[41]. So, to further identify the regulatory and control points of DXS1 in the MEP pathway, RNA-seq was used to examine the expression of key MEP and related isoprenoid biosynthetic pathway genes in CK and antiDXS1-102 plants, to determine the effects of lowered PpDXS1 levels on isoprenoid synthesis. DEG analysis revealed that genes involved in GA and IAA biosynthesis and signal transduction pathways were downregulated in the antiDXS1-102 mutant compared to CK, which is consistent with the GA and IAA content. The antiDXS1-102 plant exhibited enhanced expression of ABA biosynthetic genes, again consistent with the ABA content. The state of the MEP pathway or intermediates were assumed to be in equilibrium with these decreased or increased downstream terpenoids. On the other hand, the overexpression or suppression of PpDXS1 gene may influence the content of downstream isoprenoids, but each of these post-IPP biosynthetic pathways may have its own set of rate-limiting and regulatory steps[5].

    • In the present study, functional analysis of DXS1 in P. pratensis revealed that underexpression of PpDXS1 on the MEP pathway have different impacts on terpenoid biosynthesis and physiology, including decreased plant height, endogenous GAs and IAA production, but promoted ABA accumulation, as well as the expression levels of related genes. This work provides not only important guidance to further study the role of DXS1 in response to environmental stresses in turfgrass, but also an addition to the knowledge of DXS1 enzyme in plants in general and Poa pratensis in particular.

    • Kentucky bluegrass cultivar ‘Baron’ was used as wild type (WT). WT plants were grown in soil-sand-perlite (1:1:1, v/v) in SC-10 single-cell containers (12 cm diameter × 10 cm depth) at 25 °C with 14/10 h day/night photoperiod. In the WT growth process, young leaves at early growth stage, mature leaves at vigorous growth stage, and old leaves at heading stage were used for gene expression analysis of the time-series sample. In addition, fully expanded leaves, leaf sheaths and roots at vigorous growth stage were also used for gene organ/tissue-specific expression analysis. Plants were also foliar sprayed with 30 mg/L gibberellic acid (GA3), 10 mg/L abscisic acid (ABA), 535 mg/L jasmonate (JA), and a spore suspension of Puccinia graminis[42]. The leaf samples were collected 3, 6, and 12 h after treatment and used for gene expression analysis.

    • Candidate nucleotide sequences of DXS unigenes from relatives of P. pratensis were used in Blastn searches of P. pratensis transcriptome sequences (NCBI accession number: SRA315988). Three candidate DXS unigenes were assembled and specific primers were designed to amplify the middle fragment. Then, specific primers (Table 1) for amplification of 5′ and 3′ fragments using a SMART RACE cDNA Amplification Kit (Clontech, USA). Fragments were amplified and 10 clones of full ORF sequence were confirmed by sequencing and blast. Finally, PpDXS1 gene ORF sequence of one consistent clone are deposited in GenBank (accession numbers: MG257788).

      Table 1.  Nucleotide sequences of gene-specific primers

      Primer nameSequence (5'-3')Description
      3'-GSPCGACGACCTCATCACCATCCTCCG3'-RACE primer
      5'-GSPGTCTTGGTGCCCTTGACCTCCCG5'-RACE-out-primer
      5'-NESTTCCGCCTATTTGCTTCGTCACTCC5'-RACE-in-primer
      DXS-FATGGCGCTCTCGACGACGTTCTORF-F
      DXS-RCTAAACATTCTGCACCGTCATGORF-R
      antiDXS-F(BstEII)GGGTNACCATGGCGCTCTCGACGACGTTCTPrimers for vector construction
      antiDXS-R(BglII)GAAGATCTAACATTCTGCACCGTCATG
      SP1CCGTCGGTCTGCCGCATCGTCPrimer for promoter amplification
      SP2TCGCTTGTCCTGAGGGGTGTTG
      SP3TGAGGGACAGGTTCTTCATGTGGA

      Genomic DNA was extracted from WT leaves using a modified CTAB method. To clone the promoter region of PpDXS, high-efficiency thermal asymmetric interlaced PCR were performed using degenerate primers and specific nested-primers (Table 1, Supplemental Table S2) designed against the PpDXS ORF sequence. Amplified fragments produced by the nested PCR were cloned and then sequenced. Sequences (shown in Supplemental Fig. S2) that extended upstream of PpDXS were isolated and used for the further analysis. The 5′ upstream sequence was analyzed for putative cis-acting regulatory elements using the Plant CARE database.

    • DXS1 protein sequences were collected using the BLASTp program and were aligned using the ClustalW program (http://www.ddbj.nig.ac.jp) with standard parameters. The physical and chemical characteristics of the amino acid sequence were conducted in ProtParam program (http://web.expasy.org/protparam) and the subcellular localization were analyzed by TargetP 1.1 Server. The phylogenetic tree was generated by the neighbor-joining method on the MEGA5 software and bootstrap values were obtained from 1,000 replicates[43]. Signal peptide and transmembrane topological structures were predicted by SignalP (http://www.cbs.dtu.dk/services/SignalP) and TMHMM 2.0 server (http://www.cbs.dtu.dk/services/TMHMM). Crystal structure of PpDXS and AtDXS were modeled using the Expasy server and conserved protein domains were analyzed by searching the deduced amino acid sequences against the NCBI Conserved Domain Database (CDD, http://www.ncbi.nlm.nih.gov/Structure/cdd/wrpsb.cgi). The subcellular localization was predicted using the WoLF PSORT server.

    • Total RNA from root, leaf sheath and leaf were obtained with TRIzol reagent kit (Invitrogen, USA) using 100~500 mg tissue homogenized in liquid nitrogen. Its quantity and purity were assessed using the NanoDrop 2000 (Thermo, USA) and reverse transcriptional reaction was carried out with 0.5 μg total RNA using PrimeScriptTM RT reagent Kit (Perfect Real Time) (Takara, Japan) according to the supplier’s instruction.

      Quantitative real-time PCR was carried out using a SYBR Green assay (Takara, Dalian, China) on a Bio-Rad CFX96 System (Roche, USA). Each 25 μL assay contained 12.5 μL SYBR Premix Ex Taq, 2 μL cDNA and 100 nM of each primer (Supplemental Table S2). For exogenous application, the relative mRNA abundance was calculated by using the comparative CT method (2ΔΔCᴛ) and normalization to 18S gene. The analysis included three biological replicates and three technical replicates for each sample. The data were statistically analyzed via the SPSS21.0 software, and subjected to one-way analysis of variance (ANOVA) to determine the least significant difference (LSD) among the treatments at p < 0.05.

    • Antisense oligonucleotides have been used for more than a decade to downregulate gene expression[44]. So, in the study, an RNA antisense-expressing cassette targeting the PpDXS1 gene was placed under the control of the CaMV 35S promoter and NOS terminator in the pCAMBIA1301 vector. The PpDXS1 gene was amplified from a pGEMT-easy plasmid clone using gene-specific full-length primers that incorporated BglII and BstEII restriction sites in the forward and reverse primers, respectively (Table 1). After amplification and restriction digestion, the PpDXS1 gene was inserted into the entry plasmid pCAMBIA1301 to form recombinant plasmid pCAMBIA1301-antiDXS (Supplemental Fig. S4).

      Embryogenic calli (approximately 100 small pieces of callus) were placed as a 2.5 cm diameter monolayer in a 5.0 cm Petri dish containing subculture medium (MS basal medium plus 30 g/L sucrose, 1 mg/L 2,4-D, 0.5 mg/L 6-BA, and 0.2 M mannitol) for 4–8 h of osmotic treatment prior to bombardment. Gold particles (0.6 μm, Bio-Rad, CA) were DNA-coated essentially as described by Ha et al.[45]. The bombardment mixture contained 0.6 mg gold particles and 1 μg plasmid DNA per shot. Bombardment was carried out using a Biolistic PDS-1000/He Particle Delivery System (Bio-Rad, Supplemental Fig. S5) with a target distance of 6 cm. Bombarded calli were incubated on subculture medium overnight.

      Callus bombarded with pCAMBIA1301-antiDXS1 and pCAMBIA1301 empty vector were incubated in subculture medium for 7 d and then transferred to selected regeneration medium containing 100 mg/L hygromycin and a certain amount of 6-BA and KT. After two selection rounds with 100 mg/L hygromycin under dark conditions, hygromycin resistance callus was transferred to regeneration medium supplemented with 50 mg/L hygromycin and incubated under a 16/8-h (light/dark) photoperiod. Fully recovered plantlets were transferred to containers for further root development and, finally, green plants were transferred to soil in a greenhouse. Transformed plants of pCAMBIA1301-antiDXS1 were identified in T0 plants by PCR with three pairs of specific primers for the hygromycin gene (Hyg-F/R, 517 bp), 35S promoter regions (35S-F/R, 195 bp) and compound primers (35S-F and antiDXS1-F), see details in Supplemental Table S2. And the transformed plants of empty vector (used as controls, namely CK) were identified by two pairs of primers of hygromycin gene and 35S promoter regions.

    • Total plant protein extracts were obtained from 50–100 mg of fresh tissue. Samples were ground in liquid nitrogen, suspended in 500–1,000 μL ice-cold RIPA buffer supplemented with 1 mM PMSF, and ultrasonicated. Resuspended samples were then centrifuged at 12,000 rpm for 10 min at 4 °C, and then the supernatant was recovered and re-centrifuged. Supernatant protein concentration was determined using the bicinchoninic acid (BCA) method. Proteins were separated using SDS-PAGE and then electrotransferred to polyvinylidene fluoride membranes (PALL, America). Membranes were incubated overnight at 4°C with primary antibody (diluted 1:500) then with horseradish peroxidase-conjugated secondary antibody (diluted 1:5,000) for 2 h at room temperature. The objective protein is a polyclonal antibody on the basis of designed immunogen fragments according to the predicted DXS protein sequence and synthesized by Abmart (Shanghai, China). Imaging and quantification were performed using Quantity One (Bio-Rad).

    • Firstly, plant height of one CK and two antiDXS1-transformed lines was recorded and five replications were set in each pot. Then, fresh samples comprising the terminal bud and young leaves (0.3–1 g) from plants at the same stage of development were collected and used to determine endogenous hormone content. Levels of total GAs, ABA, IAA, and JA were determined using the ELISA method according to the manufacturer’s protocol (supplied by the Crop Chemical Control Laboratory at China Agricultural University). Chlorophyll was extracted by soaking 50 mg of fresh leaves in 8 mL acetone (95%, v/v) for 72 h in the dark, followed by spectrophometric quantification at 470, 645, and 663 nm (Beckman, CA, USA). Total chlorophyll content was calculated using the Arnon method[46]. These data were statistically analyzed via the SPSS21.0 software, and subjected to one-way analysis of variance (ANOVA) to determine the least significant difference (LSD) between CK and antiDXS1 transgenic plants at p < 0.05.

    • Kentucky bluegrass leaf blades were collected from the control (CK) and transformed plant of target gene (antiDXS1-102) and used for sequencing. Total mRNA was extracted using TRIzol Reagent (Invitrogen, USA) according to the manufacturer’s instructions, and cDNA library construction and normalization were performed as described previously[47]. Total RNA samples were sequenced using the Illumina HiSeq platform. Cleaned and qualified reads were assembled de novo using Trinity software, as described previously[48], and mapped to reference transcriptome libraries using RSEM (v 0.7) alignment. Read counts of transcripts with a reciprocal match to the reference transcriptome were extracted and calculated using FPKM (expected number of Fragments per Kilobase of transcript sequence per Million base pairs sequenced) values for gene expression analysis. The matrix of read counts was used with the DESeq R statistical package to identify transcripts with significant expression differences between antiDXS-102 and CK (FDR < 0.05). Log2 (FPKM-antiDXS-102/FPKM-CK ratio) values were shown in heatmaps representing expression profiles of DEGs.

      • All authors gratefully acknowledge the Forestry Central Laboratory of Beijing Forestry University for providing the research facilities. This study was supported by the National Natural Science Foundation of China (No. 31302016).
      • The authors declare that they have no conflict of interest.
      • Supplemental Fig. S1 Bioinformative analysis for PpDXS1 protein. (a) Amino acid sequence alignment of DXS1. (b) Prediction of function domain. (c) Prediction of signal peptide. (d) Prediction of subcellular localization. (e) Prediction of transmembrane topological structures.
      • Supplemental Fig. S2 The promoter sequence of PpDXS1 from Kentucky bluegrass.
      • Supplemental Fig. S3 Differential expression genes of antiDXS1-102 vs CK. (a) Volcanic map of differential expression genes of antiDXS1-102 vs CK. (b) GO enrichment of down-regulated differentially expressed genes on antiDXS1-102 vs CK. (c) GO enrichment of up-regulated differentially expressed genes on antiDXS1-102 vs CK.
      • Supplemental Fig. S4 The map of recombinant plasmid pCAMBIA1301-antiDXS1.
      • Supplemental Fig. S5 Biolistic PDS-1000He Particle Delivery System.
      • Supplemental Table S1 Analysis of gray value in the western blot.
      • Supplemental Table S2 The other primers for the study.
      • Copyright: © 2021 by the author(s). Exclusive Licensee Maximum Academic Press, Fayetteville, GA. This article is an open access article distributed under Creative Commons Attribution License (CC BY 4.0), visit https://creativecommons.org/licenses/by/4.0/.
    Figure (8)  Table (1) References (48)
  • About this article
    Cite this article
    Gan L, Chao Y, Han L, Yin S. 2021. Underexpression of PpDXS1 gene decreased plant height and resulted in altered accumulation of phytohormones in Kentucky bluegrass. Grass Research 1: 9 doi: 10.48130/GR-2021-0009
    Gan L, Chao Y, Han L, Yin S. 2021. Underexpression of PpDXS1 gene decreased plant height and resulted in altered accumulation of phytohormones in Kentucky bluegrass. Grass Research 1: 9 doi: 10.48130/GR-2021-0009

Catalog

  • About this article

/

DownLoad:  Full-Size Img  PowerPoint
Return
Return