


-
Zoysiagrass (Zoysia spp. Willd.), a warm-season turfgrass, can provide similar aesthetic and functional properties as other turfgrass species, but with reduced inputs (e.g. water, fertilizer, and pesticides)[1]. Zoysiagrass is generally regarded as a low maintenance turfgrass due to its slow growth rate[2−4], low nutritional requirements[5], and excellent resistance to weed encroachment[1]. In addition, zoysiagrass species as a group have good tolerance to heat[6,7], shade[8−10], and salt[11,12]; however, differences occur in levels of tolerance among the different Zoysia ssp.[1]. Therefore, zoysiagrass provides an excellent sod-forming, low-maintenance turf surface, especially for golf course areas, lawns, and grounds in the transitional and warm climatic regions of the United States[1].
There are three primary species of zoysiagrass [Z. japonica Steud., Z. matrella (L.) Merr., and Z. pacifica (Goudswaard) M. Hotta & S. Kuroki] utilized today as turf or used by turfgrass breeders in the development of advanced lines[1]. These grasses are native to the humid continental and subtropical climates of East Asia and the Pacific Islands where their distribution is highly influenced by latitude[1]. Leaf blade width (i.e. leaf texture) is one key difference between these species, with widest to narrowest leaf blade width ranking as follows: Z. japonica ≥ Z. matrella > Z. pacifica[1]. Another major difference among the three species is cold hardiness (i.e. winter survival and freeze tolerance), which can be a strength or shortcoming depending on the species. Ranking of cold hardiness by species is Z. japonica > Z. matrella > Z. pacifica[1,13,14]. However, cold hardiness can also be variable among cultivars within a species[14,15], which highlights the importance of selecting cultivars based on geographic location[16]. Compared to other warm-season turfgrasses, Z. japonica has superior cold hardiness, which enables its use farther north in the transitional climatic zone and even in cool-humid regions of the United States[5].
One of the most cold hardy (or winter-hardy) zoysiagrass cultivars is 'Meyer' zoysiagrass (Z. japonica)[14], which has also been the most widely used cultivar since its release in 1951[1,17]. In the last decade, breeding programs have made some progress in the development of zoysiagrass hybrids with comparable cold hardiness to Meyer, but with superior establishment rate, turf quality, shade tolerance, finer leaf texture, or improved tolerance to pests[18−21]. Current breeding programs are generally focused on developing finer-textured zoysiagrass progeny for golf course fairways, tees, and putting greens[22]. Meanwhile, coarse (i.e. wider leaf blade), aggressive zoysiagrass germplasm is often discarded by breeders as unacceptable when it may in fact be of tremendous value, especially for lower-maintenance areas such as, lawns, or golf course rough[1]. Further, zoysiagrass use in the United States is primarily in the transition zone and southeast, but demand for low-input grasses is also high in the southwestern United States. There is need for breeding advancements in zoysiagrass with less of a focus on leaf texture, and more focus on minimal-to-no inputs to reduce long-term management costs in low-maintenance areas. Preliminary local screenings of collections of "coarse-textured" germplasm from three universities have shown to have excellent stress and pest tolerance and fast establishment when managed with no inputs. We hypothesized that there would be genotypes of these coarse-textured, experimental germplasm that outperform the standard cultivars across multiple environments. Therefore, the objective of this experiment was to evaluate the performance and playability of coarse-textured zoysiagrass genotypes in comparison to commercially available turfgrass cultivars maintained as a low-maintenance turf area in Arizona, California, Georgia, Indiana, and North Carolina.
-
Climate (as described by the Köppen–Geiger classification[23,24]) differences led to variations in performance among entries across locations, which are further discussed herein (Tables 1−6 and Fig. 1).
Table 1. Site information.
Indiana North Carolina Georgia Arizona California Location, City W.H. Daniel Turfgrass Research and Diagnostic Center, West Lafayette Lake Wheeler Turfgrass Field Lab, Raleigh Coastal Plain Experiment Station, Tifton Evergreen Turf, Stanfield American Sod Farms, Escondido Latitude and Longitude 40°26′31″N; 86°55′47″W 35°44′18″N; 78°40′39″W 31°28′30″N; 83°31′34″W 32°55′23″N; 111°56′17″W 33°5′26″N; 117°0′24″W Soil type Silt loam Sandy loam Loamy sand Sandy loam Sandy loam Climate classificationa Warm temperate, no dry season, hot summer (Cfa) Warm temperate, no dry season, hot summer (Cfa) Warm temperate, no dry season, hot summer (Cfa) Hot arid, desert, hot summer (BWh) Arid, steppe, hot dry summer, cool wet winter, (BSk) USDA plant hardiness zoneb 5b
(−26.1 to −23.3 °C)7b
(−15 to −12.2 °C)8b
(−12.2 to −9.4 °C)9b
(−3.9 to −1.1 °C)10a
(−1.1 to 1.7 °C)2018 planting date 22 May 10 July 1 June 29 May 30 May a From Köppen-Geiger climate map[23,24]. Map retrieved from http://koeppen-geiger.vu-wien.ac.at.
b Average annual extreme minimum temperature in parentheses and USDA map retrieved from https://planthardiness.ars.usda.gov.Table 2. Year 2019 to 2020 data and cumulative turf performance index (TPI) for treatments in West Lafayette, Indiana, treatments that ranked in the top statistical group in ≥ 50% of the parameters are highlighted in bold
Entry Winterkilla Turf colorb Densityc 2019
Uniformityd2019
Drought resistanceeAvg turf qualityf Avg ball lieg Avg leaf textureh TPIi 2019 2020 Spring 2019 Summer 2019 Autumn 2019 Spring 2020 Summer 2020 Autumn 2020 2019 2020 PURZ 1602 6.3 a-dj 7.0 a-d 5.7 ab 6.3 d-f 6.0 b-f 6.0 bc 7.3 ab 7.0 efg 5.0 b-e 8.7 a 5.7 cde 5.7 b-f 6.8 abc 38.9 b-e 5.2 de 6 PURZ 1603 6.0 bcd 6.3 a-e 6.7 a 4.7 h 4.7 fg 5.7 bcd 6.0 cd 6.0 hi 5.3 bcd 6.3 b-e 6.0 bcd 4.7 e-h 6.5 a-d 32.0 d-h 4.2 fg 3 PURZ 1606 7.3 ab 6.0 b-f 6.7 a 5.0 gh 5.0 efg 6.0 bc 6.0 cd 6.3 gh 5.7 abc 6.3 b-e 7.0 abc 4.3 e-h 6.8 abc 32.0 d-h 3.3 h 5 PURZ 1701 7.0 abc 7.3 abc 7.0 a 5.0 gh 5.0 efg 6.3 b 6.0 cd 6.7 fgh 6.0 ab 8.0 ab 8.3 a 7.0 abc 7.5 a 24.1 ghi 4.0 g 8 PURZ 1702 5.0 def 5.3 d-g 4.3 bc 6.3 d-f 4.3 g 6.0 bc 6.3 bcd 5.3 ij 4.0 c-g 5.7 c-f 4.7 d-g 3.7 gh 5.3 d-g 38.4 b-e 4.7 ef 0 XZ14055 4.0 efg 7.3 abc 3.3 cd 9.0 a 7.0 abc 6.0 bc 8.0 a 8.0 bcd 3.7 d-h 8.0 ab 4.3 d-h 6.0 b-e 6.0 a-e 49.2 ab 6.5 b 7 XZ14069 2.7 g-j 6.0 b-e 1.3 e 8.7 ab 7.3 ab 5.3 b-e 7.0 abc 8.3 abc 2.0 hi 5.3 def 2.7 ghi 6.3 a-d 4.0 gh 52.3 a 7.2 a 6 XZ14070 5.3 cde 6.3 a-e 4.0 bc 6.7 c-f 5.7 c-g 5.3 b-e 6.7 bcd 8.0 bcd 4.0 c-g 6.3 b-e 5.0 def 6.7 abc 5.8 b-f 47.5 ab 5.5 cd 3 XZ14071 2.7 g-j 5.6 c-g 3.0 cde 8.2 abc 7.5 ab 4.7 c-g 6.4 bcd 8.5 abc 3.1 e-i 6.1 b-f 4.1 d-i 6.1 a-e 5.5 c-g 41.5 a-d 6.8 ab 5 XZ14072 5.0 def 6.3 a-e 3.3 cd 7.0 b-e 5.7 c-g 4.7 c-g 6.0 cd 6.7 fgh 4.7 b-f 8.7 a 5.7 cde 7.0 abc 6.8 abc 34.3 c-g 6.7 ab 4 XZ14074 1.3 ij −k − − − − − − − − − − − − − 0 XZ14092 3.7 efg 5.5 c-g 2.5 cde 6.9 b-f 5.0 efg 5.0 b-f 7.0 abc 6.5 fgh 2.9 f-i 4.3 ef 3.4 f-i 4.5 e-h 4.1 gh 37.6 b-f 6.8 ab 1 ZG09004 8.0 a 6.0 b-f 7.0 a 5.0 gh 5.0 efg 5.0 b-f 6.3 bcd 6.0 hi 7.3 a 5.7 c-f 8.7 a 6.7 abc 7.0 abc 17.2 i 4.2 fg 6 ZG09055 7.3 ab 6.0 b-f 6.7 a 6.0 e-h 5.3 d-g 5.3 b-e 6.0 cd 5.3 ij 5.7 abc 5.3 def 7.7 ab 6.0 b-e 6.9 abc 22.0 hi 4.0 g 5 ZG09062 1.7 hij 5.9 b-g 1.5 de 8.7 ab 5.5 c-g 2.8 ij 8.0 a 7.5 c-f 1.5 i 6.7 bcd 2.6 ghi 6.4 a-d 5.0 d-h 39.4 a-e 6.4 b 4 09-TZ-54-9 1.7 hij 6.0 b-f 2.0 de 7.5 a-e 5.5 c-g 5.0 b-f 6.5 bcd 9.0 a 1.9 hi 6.3 b-e 2.4 hi 7.0 abc 4.6 e-h 51.1 ab 5.8 c 4 09-TZ-89-73 1.7 hij 4.0 g 1.7 de 6.3 d-f 6.0 b-f 2.0 j 4.0 e 7.3 def 1.7 i 4.7 ef 2.7 ghi 5.3 c-g 3.8 h 45.8 abc 5.8 c 1 10-TZ-994 7.3 ab 7.7 ab 7.0 a 6.0 e-h 5.7 c-g 6.0 bc 7.3 ab 7.0 efg 7.3 a 9.0 a 8.0 a 6.7 abc 7.4 a 48.8 ab 4.5 fg 10 10-TZ-1254 2.7 g-j 5.7 c-g 2.0 de 9.0 a 8.0 a 3.3 hi 7.3 ab 8.0 bcd 2.3 ghi 7.3 a-d 4.0 e-i 8.0 a 6.2 a-d 29.5 e-h 5.5 cd 7 15-TZ-11766 1.0 j −k − − − − − − − − − − − − − 0 16-TZ-12036 3.7 efg 4.3 fg 3.0 cde 6.3 d-f 4.7 fg 3.0 ij 7.3 ab 7.7 cde 3.7 d-h 5.3 def 3.3 f-i 3.3 h 4.5 fgh 46.7 ab 6.5 b 1 16-TZ-12783 1.0 j −k − − − − − − − − − − − − − 0 16-TZ-13463 1.0 j −k − − − − − − − − − − − − − 0 16-TZ-14114 3.5 e-h 6.0 b-f 2.0 de 7.0 b-e 6.3 b-e 3.7 ghi 6.7 bcd 7.7 cde 2.7 ghi 8.3 ab 5.7 cde 8.0 a 7.0 ab 30.2 d-h 5.2 de 3 Chisholm 4.0 efg 6.0 b-f 4.3 bc 6.7 c-f 5.3 d-g 4.7 d-g 5.7 d 7.0 efg 3.7 d-h 7.3 a-d 4.7 d-g 7.3 ab 6.4 a-d 28.4 e-h 4.7 ef 3 Meyer 7.3 ab 8.0 a 6.3 a 5.3 fgh 5.7 c-g 6.3 b 6.7 bcd 6.7 fgh 6.3 ab 8.7 a 7.0 abc 6.0 b-e 7.5 a 36.8 b-f 5.5 cd 7 Empire 2.7 g-j 6.7 a-d 2.0 de 8.3 ab 6.7 a-d 4.3 e-h 6.3 bcd 8.0 bcd 2.0 hi 8.0 ab 3.3 f-i 6.7 abc 6.0 a-e 43.1 abc 5.3 cd 7 Jamur 3.3 fgh 7.0 a-d 2.0 de 7.7 a-d 6.7 a-d 4.3 e-h 6.7 bcd 8.7 ab 2.7 ghi 8.0 ab 5.0 def 7.3 ab 7.0 abc 38.3 b-e 5.3 cd 7 Zenith 3.0 ghi 4.7 efg 2.7 cde 6.7 c-f 5.7 c-g 4.0 f-i 6.7 bcd 7.0 efg 2.0 hi 4.0 f 2.3 i 4.0 fgh 3.7 h − 5.3 cd 0 'Riviera' bermudagrass 2.3 g-j 7.5 abc 2.0 de 8.5 ab 2.5 h 8.0 a 8.0 a 4.5 j 2.4 ghi 7.8 abc 5.4 c-f 8.0 a 6.0 a-e 33.8 c-g 6.8 ab 7 P-value < 0.0001 0.0035 < 0.0001 < 0.0001 < 0.0001 < 0.0001 < 0.0001 < 0.0001 < 0.0001 < 0.0001 < 0.0001 < 0.0001 < 0.0001 < 0.0001 < 0.0001 a Winterkill ratings: 9 = fully green; 1 = no green tissue.
b Spring green-up/seasonal color/color retention ratings: 9 = darkest green; 6 = minimally acceptable color; 1 = straw brown turf.
c Density: 9 = maximum density; 6 = minimally acceptable density; 1 = lowest density.
d Uniformity: 9 = maximum uniform turf; 1 = lowest uniformity.
e Drought stress resistance: 9 = no wilting or leaf firing; 100% green-no dormancy; 1 = complete wilting, 100% leaf firing or complete dormancy
f Quality: 9 = maximum quality; 6 = minimum acceptable quality; 1 = lowest quality. Turf quality means (n = 33) calculated from 11 collection dates during 2019−2020.
g Ball lie: Percentage visible golf ball within the turf canopy. Means (n = 45) calculated from five collection dates in 2019−2020 where percentage of three visible golf balls were measured within each plot from using the method developed by Richardson et al.[25].
h Leaf texture: 9 = fine and 1 = coarse. Leaf texture means (n = 6) calculated from two collection dates during 2019−2020.
i TPI is the turf performance index representing the number of times an entry occurred in the top statistical group (max 14), not including leaf texture ratings.
j Means within each column (except TPI) with a common letter are not significantly different according to Fisher's protected LSD (α = 0.05).
k Entry or check either did not survive 2018−2019 winter or not enough replications remaining to analyze.Table 3. Year 2018 to 2020 data and cumulative turf performance index for treatments in Raleigh, North Carolina, treatments that ranked in the top statistical group in ≥ 50% of the parameters are highlighted in bold.
Entry Winterkilla Turf colorb Densityc Uniformityd Avg turf
qualityeAvg ball
liefAvg Leaf
texturegTPIh 2019 2020 Autumn 2018 Summer 2019 Autumn 2019 Summer 2020 Autumn 2020 2019 2020 2019 2020 PURZ 1602 3.3 ji 7.3 abc 2.7 fgh 8.0 a 4.7 c-f 7.1 bcd 4.5 e-i 7.0 bcd 6.5 b-f 7.0 a-d 6.0 bcd 5.9 d-g 59.2 6.3 efg 3 PURZ 1603 4.3 ij 7.0 abc 2.0 h 6.7 cd 4.0 efg 6.7 cde 4.0 ghi 6.0 ef 5.3 fg 7.0 a-d 6.7 a-d 4.9 ij 50.1 5.3 hi 3 PURZ 1606 4.3 ij 7.7 ab 2.0 h 7.7 ab 3.7 fgh 6.7 cde 3.3 i 6.0 ef 4.3 gh 7.3 abc 7.7 a 4.8 j 51.2 4.5 j 4 PURZ 1701 5.3 f-i 8.0 a 2.3 gh 7.0 bcd 3.7 fgh 5.7 ef 3.3 i 6.3 de 5.3 fg 7.3 abc 7.3 ab 4.9 ij 47.2 5.2 i 3 PURZ 1702 4.3 ij 6.5 a-d 2.0 h 7.0 bcd 2.5 h −j − 6.0 ef − 7.0 a-d − 5.5 e-i 59.7 6.1 fg 2 XZ14055 5.3 f-i 6.0 a-d 4.7 b-f 8.0 a 5.0 b-f 7.6 abc 6.0 bcd 7.3 ab 5.5 efg 6.7 a-d 5.5 d 5.7 e-h 59.1 7.2 cd 5 XZ14069 8.7 a 8.0 a 6.0 ab 8.0 a 6.3 a 7.3 bc 6.7 ab 8.0 a 8.0 a 7.0 a-d 6.3 bcd 7.1 a 74.9 8.0 a 10 XZ14070 8.0 ab 6.7 abc 4.0 b-h 8.0 a 5.0 b-f 7.6 abc 5.0 c-g 7.7 ab 7.0 a-d 6.7 a-d 6.5 a-d 5.8 d-g 57.2 6.8 de 8 XZ14071 6.7 b-f 7.3 abc 5.0 a-e 7.7 ab 5.7 abc 6.7 cde 5.3 c-f 7.3 ab 6.3 c-f 7.0 a-d 6.7 a-d 6.1 de 52.6 7.2 cd 7 XZ14072 7.7 abc 7.7 ab 3.7 c-h 8.0 a 4.3 d-g 5.1 f 4.5 e-i 8.0 a 7.5 abc 7.7 ab 6.5 a-d 6.2 cde 59.2 7.3 bcd 7 XZ14074 7.0 b-e 3.0 ef 4.0 b-h −j − − − − − − − − − − 0 XZ14092 4.7 hij 4.0 def 2.7 fgh 8.0 a 3.9 e-h − − 6.9 b-e − 6.0 cde − 5.2 g-j 49.3 6.9 de 1 ZG09004 6.7 b-f 7.3 abc 2.7 fgh 7.3 abc 3.3 gh 6.7 cde 4.3 f-i 5.3 f 4.3 gh 7.0 a-d 6.7 a-d 4.8 j 37.4 5.0 ij 4 ZG09055 5.0 ghi 5.3 cde 2.3 gh 7.3 abc 3.3 gh 7.3 bc 3.7 hi 6.3 de 4.0 h 7.0 a-d 7.7 a 5.1 hij 50.9 5.2 i 3 ZG09062 5.3 f-i 2.7 f 4.0 b-h 7.7 ab 4.3 d-g 7.3 bc 6.3 abc 7.0 bcd 7.7 ab 6.3 bcd 7.0 abc 6.4 bcd 52.4 7.7 abc 4 09-TZ-54-9 6.7 b-f 7.7 ab 4.3 b-g 8.0 a 6.0 abc 7.0 bcd 6.7 ab 8.0 a 8.0 a 6.0 cde 6.0 bcd 7.0 ab 47.8 7.8 ab 7 09-TZ-89-73 6.7 b-f 3.0 ef 5.3 a-d 6.3 d 4.3 d-g 6.1 def 5.5 b-f 7.0 bcd 6.5 b-f 7.0 a-d 6.0 bcd 5.7 e-h 60.5 6.5 ef 2 10-TZ-994 6.0 d-h 6.0 a-d 3.7 c-h 8.0 a 4.0 efg 8.7 a 5.0 c-g 6.3 de 6.7 b-e 6.0 cde 7.3 ab 5.6 e-h 44.2 6.0 fg 4 10-TZ-1254 7.3 a-d 6.3 a-d 7.0 a 7.7 ab 4.7 c-f 6.7 cde 7.5 a 7.3 ab 7.3 abc 8.0 a 7.7 a 6.4 bcd 52.7 6.5 ef 9 15-TZ-11766 7.0 b-e 6.3 a-d 4.0 b-h 8.0 a 5.4 a-e −j − 6.4 cde − 7.0 a-d − 5.9 def 65.7 6.2 fg 4 16-TZ-12036 6.0 d-h 4.0 def 5.0 a-e 7.7 ab 5.5 a-d 7.1 bcd 5.0 c-g 6.7 cde 6.5 b-f 6.0 cde 7.0 abc 6.1 cde 50.7 6.8 de 4 16-TZ-12783 5.7 e-i 4.0 def 5.7 abc 8.0 a 4.0 efg 8.0 ab 6.7 ab 7.7 ab 7.3 abc 7.7 ab 5.7 d 6.8 abc 57.1 7.2 cd 8 16-TZ-13463 5.7 e-i 5.5 b-e 4.0 b-h 8.0 a 5.1 a-f −j − 6.1 def − 4.0 f − 5.8 d-g − 7.3 bcd 2 16-TZ-14114 6.0 d-h 6.0 a-d 5.7 abc 7.3 abc 3.0 gh 7.1 bcd 6.0 bcd 6.7 cde 7.0 a-d 7.7 ab 8.0 a 5.9 def 60.3 6.2 fg 6 Chisholm 6.7 b-f 6.7 abc 3.7 c-h 7.3 abc 4.7 c-f 7.0 bcd 5.3 c-f 6.0 ef 6.7 b-e 5.7 def 6.7 a-d 5.7 e-h 42.3 5.8 gh 3 Meyer 6.3 c-g 7.0 abc 3.3 d-h 7.7 ab 4.0 efg 8.0 ab 4.7 d-h 6.7 cde 6.7 b-e 7.0 a-d 7.7 a 5.7 e-h 54.0 6.3 efg 5 Empire 5.3 f-i 6.7 abc 4.0 b-h 8.0 a 4.0 efg 7.3 bc 5.7 b-e 6.3 de 6.0 def 7.3 abc 7.7 a 5.7 e-h 54.6 5.8 gh 4 Jamur 6.0 d-h 5.7 bcd 5.7 abc 7.0 bcd 3.7 fgh 7.0 bcd 6.0 bcd 7.0 bcd 7.3 abc 8.0 a 7.7 a 6.1 cde 51.3 6.3 efg 4 Zenith 6.0 d-h 5.3 cde 3.0 e-h 7.7 ab 5.3 a-e 7.7 abc 4.7 d-h 6.0 ef 6.0 def 4.7 ef 6.0 bcd 5.3 f-j 52.7 5.8 gh 3 'Riviera' bermudagrass 3.3 j −j 4.7 b-f − − − − − − − − − − − 0 P-value < 0.0001 < 0.0001 0.0009 0.0003 < 0.0001 0.0003 < 0.0001 < 0.0001 < 0.0001 0.0064 0.0046 < 0.0001 0.0602 < 0.0001 a Winterkill ratings: 9 = fully green; 1 = no green tissue.
b Seasonal color/color retention ratings: 9 = darkest green; 6 = minimally acceptable color; 1 = straw brown turf.
c Density: 9 = maximum density; 6 = minimally acceptable density; 1 = lowest density.
d Uniformity: 9 = maximum uniform turf; 1 = lowest uniformity.
e Quality: 9 = maximum quality; 6 = minimum acceptable quality; 1 = lowest quality. Turf quality means (n = 12) calculated from four collection dates during 2018−2020.
f Ball lie: Percentage visible golf ball within the turf canopy. Means (n = 54) calculated from six collection dates in 2019−2020 where percentage of three visible golf balls were measured within each plot from using the method developed by Richardson et al.[25].
g Leaf texture: 9 = fine and 1 = coarse. Leaf texture means (n = 6) calculated from two collection dates during 2019−2020.
h TPI is the turf performance index representing the number of times an entry occurred in the top statistical group (max 12), not including leaf texture ratings.
i Means within each column (except TPI) with a common letter or no letters are not significantly different according to Fisher's protected LSD (α = 0.05).
j Entry or check did not survive establishment in 2018 or winter, and not enough replications remaining to analyze.Table 4. Year 2018 to 2020 data and cumulative turf performance index for treatments in Tifton, Georgia, treatments that ranked in the top statistical group in ≥ 50% of the parameters are highlighted in bold.
Entry Turf colora Avg dark green color indexb Uniformityc Avg turf qualityd Avg ball liee TPIf Spring 2019 Summer 2019 Autumn 2019 Autumn 2020 PURZ 1602 3.0 jkg 0.730 f-j 4.0 fg 3.7 h-l 5.7 b-f 4.7 f-i 55.3 e-k 0 PURZ 1603 3.0 jk 0.736 f-i 3.0 g 3.0 jkl 3.7 h 3.9 hi 53.0 g-k 0 PURZ 1606 2.7 jk 0.796 a 4.0 fg 5.0 d-i 4.7 e-h 4.7 f-i 51.8 h-k 1 PURZ 1701 3.3 ijk 0.737 e-i 4.0 fg 3.7 h-l 5.3 c-g 4.2 hi 48.7 jk 0 PURZ 1702 3.0 jk 0.750 c-g 4.0 fg 3.3 i-l 4.3 efg 3.8 i 62.8 a-h 1 XZ14055 3.7 h-k 0.741 d-h 5.7 cde 4.3 f-k 4.3 efg 4.3 ghi 68.5 a-d 1 XZ14069 8.0 a 0.736 f-i 7.7 a 6.0 c-f 6.3 a-d 6.7 abc 60.7 b-i 4 XZ14070 3.0 jk 0.791 ab 6.0 b-e 5.7 c-g 5.3 c-g 5.8 c-f 56.3 e-j 1 XZ14071 4.0 g-j 0.709 ijk 6.0 b-e 4.7 e-j 3.7 h 4.5 ghi 64.2 a-g 1 XZ14072 5.3 d-g 0.699 k 4.7 ef 4.0 g-l 5.3 c-g 4.6 ghi 66.0 a-f 1 XZ14074 6.7 a-d 0.698 k 5.0 ef 2.3 l 4.0 gh 3.8 i 71.4 ab 2 XZ14092 3.7 h-k 0.738 e-i 5.0 ef 3.7 h-l 5.0 d-h 4.0 hi 72.0 ab 1 ZG09004 1.0 l 0.747 c-g 5.3 def 5.3 c-h 5.3 c-g 5.4 d-g 55.7 e-k 0 ZG09055 1.0 l 0.759 c-f 4.7 ef 4.0 g-l 4.7 e-h 4.2 hi 60.2 c-i 0 ZG09062 5.7 c-f 0.716 h-k 6.0 b-e 8.0 ab 7.0 ab 6.4 a-d 58.1 d-j 3 09-TZ-54-9 6.3 b-e 0.757 c-g 6.7 a-d 6.7 bcd 7.0 ab 6.8 abc 63.7 a-g 4 09-TZ-89-73 7.0 abc 0.705 jk 6.0 b-e 7.0 abc 6.0 a-e 6.0 b-e 54.3 g-k 3 10-TZ-994 5.0 e-h 0.756 c-g 4.0 fg 2.7 kl 5.7 b-f 4.1 hi 68.7 a-d 1 10-TZ-1254 7.7 ab 0.729 g-j 5.7 cde 3.7 h-l 4.7 e-h 4.4 ghi 62.1 a-h 2 15-TZ-11766 5.0 e-h 0769 a-d 7.0 abc 8.7 a 6.0 a-e 7.2 ab 53.6 g-k 5 16-TZ-12036 3.0 jk 0.744 c-h 5.7 cde 7.0 abc 6.7 abc 6.1 b-e 66.4 a-e 3 16-TZ-12783 7.0 abc 0.790 ab 7.3 ab 7.0 abc 6.7 abc 7.3 a 73.5 a 7 16-TZ-13463 7.3 ab 0.744 c-h 7.3 ab 5.0 d-i 5.3 c-g 6.2 a-e 73.2 a 4 16-TZ-14114 5.0 e-h 0.771 abc 5.7 cde 6.7 bcd 5.7 b-f 6.0 b-e 54.9 f-k 1 Chisholm 3.0 jk 0.733 f-j 5.0 ef 6.0 c-f 7.3 a 5.8 c-f 60.2 c-i 1 Meyer 2.3 kl 0.765 b-e 5.0 ef 5.0 d-i 5.0 d-h 5.1 e-h 56.1 e-j 1 Empire 4.7 f-i 0.768 a-d 6.0 b-e 6.3 b-e 6.3 a-d 6.1 b-e 49.4 ijk 2 Jamur 4.7 f-i 0.768 a-d 5.3 def 6.3 b-e 6.3 a-d 6.0 b-e 53.5 g-k 2 Zenith 4.7 f-i 0.694 k 4.0 fg 3.3 i-l 5.0 d-h 3.8 i 59.0 d-j 0 'Riviera' bermudagrass 4.0 g-j 0.758 c-g 5.3 def 6.0 c-f 4.0 gh 4.8 f-i 44.5 k 0 P-value < 0.0001 < 0.0001 < 0.0001 < 0.0001 < 0.0001 < 0.0001 < 0.0001 a Seasonal color ratings: 9 = darkest green; 6 = minimally acceptable color; 1 = straw brown turf.
b Dark green color index: digital images calculated on a 0 to 1 scale with higher values corresponding to darker green color.
c Uniformity: 9 = maximum uniform turf; 1 = lowest uniformity.
d Quality: 9 = maximum quality; 6 = minimum acceptable quality; 1 = lowest quality. Turf quality means (n = 12) calculated from four collection dates during 2019−2020.
e Ball lie: Percentage visible golf ball within the turf canopy. Means (n = 18) calculated from two collection dates in 2019−2020 where percentage of three visible golf balls were measured within each plot from using the method developed by Richardson et al.[25].
f TPI is the turf performance index representing the number of times an entry occurred in the top statistical group (max 7).
g Means within each column (except TPI) with a common letter are not significantly different according to Fisher's protected LSD (α = 0.05).Table 5. Year 2018 to 2020 data and cumulative turf performance index for treatments in Stanfield, Arizona, treatments that ranked in the top statistical group in ≥ 50% of the parameters are highlighted in bold.
Entry 2019 Winterkilla Turf colorb 2019
Densityc2019
UniformitydAvg turf
qualityeTPIf Autumn 2018 Spring 2019 Autumn 2019 Summer 2020 PURZ 1602 6.0g 6.0 cde 5.7 b-f 3.7 ghi −i 4.7 ghi 5.0 4.9 hi 0 PURZ 1603 6.0 4.0 f 5.7 b-f 2.3 jk 4.0 3.0 j 5.0 3.8 jk 0 PURZ 1606 7.3 5.6 c-f 5.0 c-g 2.0 k 3.0 4.0 ij 4.7 3.6 k 0 PURZ 1701 6.7 4.7 ef 3.3 g 3.3 hij 4.0 4.0 ij 4.7 4.0 jk 0 PURZ 1702 7.0 5.0 def 5.3 b-f 2.7 ijk 4.5 4.0 ij 5.0 3.9 jk 0 XZ14055 7.3 6.0 cde 4.3 efg 6.3 bc 5.0 4.3 hi 5.5 5.3 e-h 0 XZ14069 8.0 7.3 abc 8.0 a 7.7 a 7.5 7.3 ab 6.3 6.8 a 5 XZ14070 6.7 6.3 bcd 6.3 a-d 5.3 c-e 5.5 5.3 e-h 6.0 5.8 b-f 1 XZ14071 6.3 5.3 def 4.3 fg 4.7 efg 6.0 6.0 c-f 6.3 5.0 c-h 0 XZ14072 7.0 5.0 def 6.0 b-e 5.3 c-e 6.0 5.7 d-g 6.0 5.1 f-i 0 XZ14074 7.7 7.3 abc 3.3 g 6.3 bc 5.0 6.7 a-d 5.0 6.3 ab 3 XZ14092 5.3 6.3 bcd 7.0 ab 4.7 efg 6.5 6.0 c-f 5.7 5.6 c-h 1 ZG09004 6.3 5.7 cde 5.3 b-f 3.3 hij 5.0 5.0 f-i 6.3 4.4 ij 0 ZG09055 −h − − − − − − − − ZG09062 8.0 7.0 abc 6.7 abc 5.3 c-e 6.0 6.0 c-f 5.3 6.0 bcd 2 09-TZ-54-9 8.7 7.0 abc 6.3 a-d 7.0 ab 7.5 7.0 abc 6.3 6.9 a 5 09-TZ-89-73 8.0 5.3 def 5.7 b-f 6.0 bcd 5.5 6.0 c-f 6.3 5.9 b-e 0 10-TZ-994 5.0 5.0 def 4.3 efg 3.7 ghi 5.0 4.3 hi 5.0 3.8 jk 0 10-TZ-1254 9.0 7.7 ab 5.7 b-f 5.0 def 6.5 6.0 c-f 6.0 6.0 bcd 1 15-TZ-11766 7.7 6.3 bcd 6.0 b-e 4.7 efg 6.0 6.3 b-e 7.0 5.6 c-h 0 16-TZ-12036 7.7 5.7 cde 5.3 b-f 5.3 c-e 5.5 5.3 e-h 6.0 5.4 d-h 0 16-TZ-12783 8.0 7.3 abc 5.3 b-f 6.3 bc 7.0 7.0 abc 7.0 6.2 abc 3 16-TZ-13463 7.0 8.0 a 6.7 abc 7.0 ab 6.0 7.7 a 6.3 6.3 ab 5 16-TZ-14114 7.7 6.3 bcd 6.0 b-e 6.0 bcd 7.0 5.7 d-g 5.7 5.7 b-g 0 Chisholm 8.3 5.3 def 6.7 abc 5.3 c-e 5.5 5.3 e-h 6.3 5.9 b-e 1 Meyer 5.3 5.0 def 5.0 c-g 4.7 efg 4.0 4.7 ghi 5.7 4.9 hi 0 Empire 7.7 7.0 abc 6.0 b-e 5.3 c-e 7.0 6.0 c-f 6.0 5.4 d-h 1 Jamur 7.7 6.0 cde 6.0 b-e 5.7 cde 6.5 5.7 d-g 5.7 5.7 b-g 0 Zenith 7.5 6.3 bcd 4.8 d-g 4.3 fgh − 5.0 f-i 4.8 5.1 ghi 0 'Riviera' bermudagrass −h − − − − − − − − P-value 0.0524 0.0002 0.0013 < 0.0001 1.000 < 0.0001 0.0746 < 0.0001 a Winterkill ratings: 9 = fully green; 1 = no green tissue.
b Spring green-up/seasonal color/color retention ratings: 9 = darkest green; 6 = minimally acceptable color; 1 = straw brown turf.
c Density: 9 = maximum density; 6 = minimally acceptable density; 1 = lowest density.
d Uniformity: 9 = maximum uniform turf; 1 = lowest uniformity.
e Quality: 9 = maximum quality; 6 = minimum acceptable quality; 1 = lowest quality. Turf quality means (n = 9) calculated from three collection dates during 2018−2020.
f TPI is the turf performance index representing the number of times an entry occurred in the top statistical group (max 5).
g Means within each column (except TPI) with a common letter or no letters are not significantly different according to Fisher's protected LSD (α = 0.05).
h Entry or check not planted at site.
i Entry did not survive or not enough replications remaining to analyze.Table 6. Year 2018 to 2019 data and cumulative turf performance index for treatments in Escondido, California, treatments that ranked in the top statistical group in ≥ 50% of the parameters are highlighted in bold.
Entry 2019 Winterkilla Turf colorb 2019 Densityc 2019 Uniformityd Avg turf qualitye TPIf Autumn 2018 Spring 2019 PURZ 1602 7.0 bcdg 3.0 f 6.7 5.3 d-g 4.7 5.3 f-i 0 PURZ 1603 6.3 cde 4.0 ef 6.0 4.0 gh 6.0 4.5 ij 0 PURZ 1606 6.0 cde 2.5 f 5.4 3.0 h 5.9 3.0 k 0 PURZ 1701 8.0 abc 2.7 f 6.0 4.0 gh 5.0 4.2 j 1 PURZ 1702 −h − − − − − 0 XZ14055 −i − − − − − − XZ14069 8.7 ab 6.0 a-d 7.3 8.0 a 6.0 7.7 a 4 XZ14070 4.7 e 3.3 f 6.3 5.7 c-f 6.3 5.0 g-j 0 XZ14071 6.3 cde 6.3 abc 6.7 6.7 a-d 6.0 6.5 bcd 2 XZ14072 8.0 abc 4.0 ef 7.0 5.7 c-f 5.7 6.3 cde 1 XZ14074 9.0 a 6.7 ab 8.0 8.0 a 6.0 7.7 a 4 XZ14092 5.3 cd 3.0 f 6.7 4.7 efg 5.7 5.3 f-i 0 ZG09004 6.0 cde 4.7 c-f 7.0 4.0 gh 6.7 4.7 hij 0 ZG09055 5.0 e 5.3 b-e 6.7 4.8 efg 5.5 4.2 j 0 ZG09062 8.3 ab 6.3 abc 8.0 5.7 c-f 5.7 6.5 bcd 2 09-TZ-54-9 8.0 abc 6.0 a-d 6.7 7.7 a 6.3 7.3 ab 4 09-TZ-89-73 8.3 ab 7.0 ab 6.7 6.0 b-e 7.0 6.2 def 2 10-TZ-994 5.0 e 3.3 f 7.7 4.3 fgh 5.3 4.7 hij 0 10-TZ-1254 8.0 abc 7.0 ab 7.3 6.7 a-d 6.7 6.0 def 3 15-TZ-11766 7.3 abc 5.7 b-e 7.0 7.3 ab 7.3 7.2 abc 3 16-TZ-12036 8.3 ab 5.3 b-e 6.7 6.0 b-e 6.0 6.0 def 1 16-TZ-12783 7.0 bcd 7.7 a 6.0 7.7 a 6.7 6.5 bcd 2 16-TZ-13463 8.0 abc 4.3 def 8.0 7.0 abc 6.7 6.7 bcd 2 16-TZ-14114 7.0 bcd 4.7 c-f 7.7 5.7 c-f 5.7 5.5 e-h 0 Chisholm 7.7 abc 6.3 abc 8.0 6.0 b-e 5.3 5.8 d-g 2 Meyer 5.0 e 3.3 f 7.0 5.0 efg 5.0 5.5 e-h 0 Empire 8.0 abc 6.0 a-d 7.7 5.7 c-f 5.7 6.0 def 2 Jamur 7.7 abc 6.0 a-d 8.3 6.0 b-e 6.0 6.0 def 2 Zenith 7.2 abc 4.5 def 7.7 5.2 efg 5.2 4.9 hij 1 'Riviera' bermudagrass −i − − − − − − P-value < 0.0001 < 0.0001 0.1874 < 0.0001 0.1741 < 0.0001 a Winterkill ratings: 9 = fully green; 1 = no green tissue.
b Spring green-up/seasonal color/color retention ratings: 9 = darkest green; 6 = minimally acceptable color; 1 = straw brown turf.
c Density: 9 = maximum density; 6 = minimally acceptable density; 1 = lowest density.
d Uniformity: 9 = maximum uniform turf; 1 = lowest uniformity.
e Quality: 9 = maximum quality; 6 = minimum acceptable quality; 1 = lowest quality. Turf quality means (n = 6) calculated from two collection dates during 2018−2019.
f TPI is the turf performance index representing the number of times an entry occurred in the top statistical group (max 4).
g Means within each column (except TPI) with a common letter or no letters are not significantly different according to Fisher's protected LSD (α = 0.05).
h Entry did not survive establishment in 2018 and not enough remaining replications to analyze.
i Entry or check not planted at site.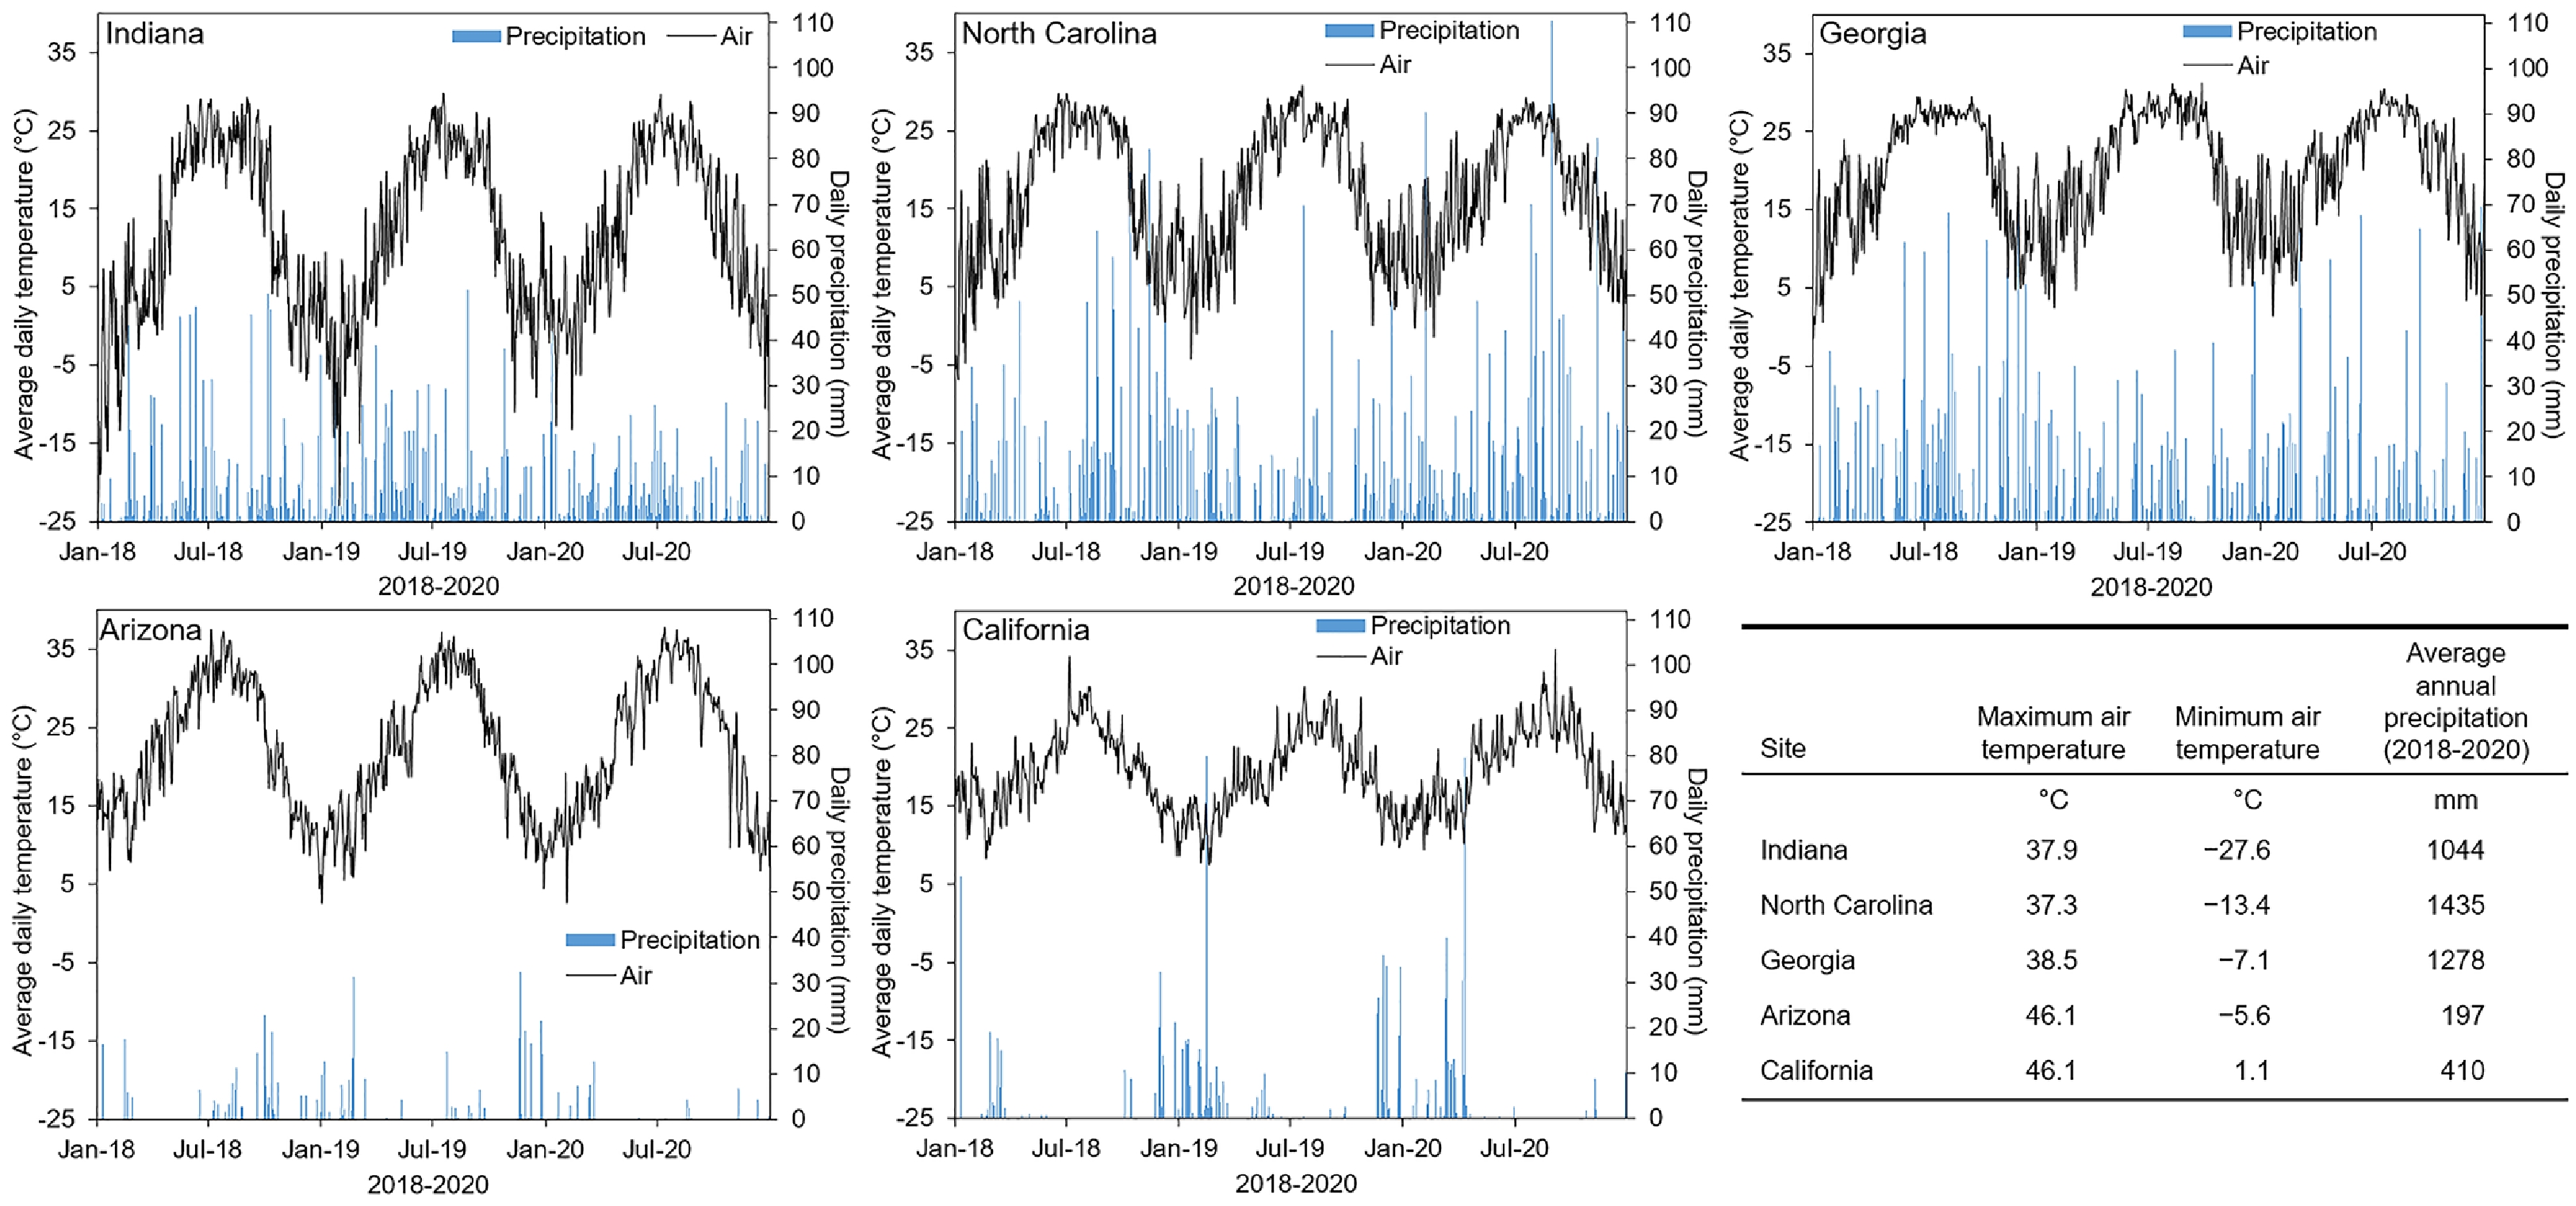
Figure 1. Average daily air temperature and daily precipitation from January 2018 to December 2020; and in the bottom right the maximum and minimum recorded air temperature and average annual precipitation during the experiment period from on-site or nearby weather stations for each site during 2018 to 2020.
The colder continental climate for the Indiana site, which is consistent with the Köppen-Geiger climate classification of Cfa and USDA plant hardiness zone of 5b led to greater winterkill during the 2018−2019 winter season, which had a minimum recorded air temperature of −27.6 °C (Tables 1 & 2 and Fig. 1). Specifically, four treatments (XZ14074, 15-TZ-11766, 16-TZ-12783, and 16-TZ-13463) suffered either complete or excessive plant death to the point that not enough plant material remained to allow for future ratings as indicated by 2019 winterkill data (Table 2). There were differences in winterkill ratings following the 2019−2020 winter, but minimum temperatures were not as extreme as the previous winter and thus, less damage occurred (Table 2 and Fig. 1). Treatments that ranked in the top statistical group in ≥ 50% of the parameters measured in Indiana were: PURZ 1701, XZ14055, 10-TZ-994, and 10-TZ-1254 (Table 2). In addition, commercially available zoysiagrass cultivar checks that ranked in the top statistical group in ≥ 50% of the parameters measured in Indiana were: Meyer, 'Empire', and 'Jamur'; and 'Riviera' bermudagrass (Cynodon dactylon (L.) Pers. var. dactylon) (Table 2). Furthermore, PURZ 1701 and 10-TZ-994 had higher cumulative TPI than all cultivar checks indicating better overall turfgrass performance under low maintenance conditions in Indiana. The next best-performing genotypes that ranked in the top statistical group in 25% to 49% of the parameters measured in Indiana were: PURZ 1602, XZ14069, ZG09004, PURZ1606, XZ14071, ZG09055, XZ14072, ZG09062, and 09-TZ-54-9 (Table 2).
The North Carolina location falls within the same Köppen-Geiger climate classification of Cfa as Indiana but the USDA plant hardiness zone of 7b and weather data supports the observation of less winterkill following both winters of 2018−2019 and 2019−2020 (Tables 1 & 3 and Fig. 1). Particularly, while recorded minimum air temperatures were as low as −13.4 °C in North Carolina, winter injury was generally not as severe as Indiana, where air temperatures were as low as −27.6 °C. Although some genotypes had winterkill ratings of ≤ 4 at this location, most fully recovered. In addition, genotypes that received lower winterkill ratings did not consistently rank in the top statistical group across parameters, which is similar to the findings in Indiana (Tables 2 & 3). Treatments that ranked in the top statistical group in ≥ 50% of the parameters measured in North Carolina were: XZ14069, XZ14070, XZ14071, XZ14072, 09-TZ-54-9, 10-TZ-1254, 16-TZ-12783, and 16-TZ-14114 (Table 3). Additionally, these eight treatments also had higher cumulative TPI than all cultivar checks indicating better overall turfgrass performance under low maintenance conditions in North Carolina. The next best-performing treatments that ranked in the top statistical group in 25% to 49% of the parameters measured in North Carolina were: PURZ 1602, PURZ 1603, PURZ 1606, PURZ 1701, XZ14055, ZG09004, ZG09055, ZG09062, 10-TZ-994, 15-TZ-11766, and 16-TZ-12036; and the cultivars 'Chisholm', Meyer, Empire, Jamur, and 'Zenith' (Table 3).
The Georgia location falls within the same Köppen-Geiger climate classification of Cfa as Indiana and North Carolina, but the USDA plant hardiness zone of 8b and weather data supports the observation of no winterkill injury for any of the treatments following the 2018−2019 and 2019−2020 winters (Tables 1 & 4 and Fig. 1). Treatments that ranked in the top statistical group in ≥ 50% of the parameters measured in Georgia were: XZ14069, 09-TZ-54-9, 15-TZ-11766, 16-TZ-12783, and 16-TZ-13463 (Table 4). These five entries had higher cumulative TPI than all six cultivar checks indicating better overall turfgrass performance when managed as a low-input site in Georgia. The next best-performing treatments that ranked in the top statistical group in 25% to 49% of the parameters measured in Georgia were: XZ14074, ZG09062, 09-TZ-89-73, 10-TZ-1254, and 16-TZ-12036; and cultivar checks Empire and Jamur.
The Arizona and California sites with Köppen-Geiger climate classifications of BWh and BSk, respectively, had the most arid climate conditions of all five sites (Table 1 and Fig. 1). Additionally, these sites are in USDA hardiness zones 9b (AZ) and 10a (CA) and the higher minimum recorded air temperatures explain the minimal-to-no winterkill injury observed among genotypes at these sites (Tables 1, 5 & 6 and Fig. 1). The treatments that ranked in the top statistical group in ≥ 50% of the parameters measured were: XZ14069, XZ14074, 09-TZ-54-9, 16-TZ-12783, and 16-TZ-13463 in Arizona; and XZ14069, XZ14071, XZ14074, ZG09062, 09-TZ-54-9, 09-TZ-89-73, 10-TZ-1254, 15-TZ-11766, 16-TZ-12783, 16-TZ-13463, and cultivar checks Chisholm, Empire, and Jamur in California, which indicates these genotypes had the best overall performance under low maintenance conditions at these sites (Tables 5 & 6). The next best-performing treatments that ranked in the top statistical group in 25% to 49% of the parameters measured were: ZG09062 in Arizona; and PURZ 1701, XZ14072, 16-TZ-12036, and cultivar check Zenith in California. Cultivar checks ranked in the top statistical group in ≤ 20% of the parameters measured in Arizona and in ≤ 50% of the parameters measured in California.
Turf establishment
-
When visual turf cover was evaluated at three to six months after planting, there differences in establishment rates among genotypes and cultivar checks at each site were recorded (Table 7). There were multiple instances when genotypes exhibited greater turf cover (i.e. faster establishment) at three to six months after planting compared to ≥ 2 zoysiagrass commercial checks at each respective site. The differences in establishment were more pronounced in the southern United States, especially the arid climates of Arizona and California. Moreover, at four of the five sites, a faster establishment was exhibited by some genotypes when compared to Meyer, the most widely used cultivar since 1951.
Table 7. Establishment differences among treatments based on visual turf cover (0−100%) at three to six months after planting (MAP) in 2018 for each site.
Entry Indiana 5 MAP North Carolina 4 MAP Georgia 3 MAP Arizona 6 MAP California 6 MAP PURZ 1602 52 f-ja 52 c-g 48 e-i 51 fgh 32 gh PURZ 1603 55 e-i 62 b-e 16 kl 29 i 35 gh PURZ 1606 60 d-h 50 d-g 41 hij 28 i 29 gh PURZ 1701 53 f-j 43 d-g 32 ijk 40 ghi 18 h PURZ 1702 48 g-j 33 fg 26 jkl 28 i −b XZ14055 52 f-j 48 d-g 39 hij 50 fgh −c XZ14069 58 d-i 77 abc 80 abc 90 ab 82 a-d XZ14070 52 f-j 57 c-f 61 c-g 76 a-d 80 a-e XZ14071 48 g-j 62 b-e 84 a 62 def 57 ef XZ14072 58 d-i 62 b-e 51 e-i 73 b-e 72 b-e XZ14074 45 hij 45 d-g 46 f-i 82 abc 45 fg XZ14092 38 j 27 g 49 e-i 55 fg 28 gh ZG09004 65 c-f 33 fg 80 abc 80 abc 90 abc ZG09055 60 d-h 52 c-g 79 abc −c 72 b-e ZG09062 67 b-f 40 d-g 62 c-f 83 abc 78 a-e 09-TZ-54-9 45 ij 40 d-g 56 d-h 91 a 92 abc 09-TZ-89-73 55 e-i 48 d-g 64 b-f 86 abc 93 ab 10-TZ-994 52 f-j 32 fg 8 l 44 ghi 32 gh 10-TZ-1254 70 a-e 37 efg 42 g-j 84 abc 92 abc 15-TZ-11766 52 f-j 40 d-g 70 a-d 92 a 93 ab 16-TZ-12036 55 e-i 37 efg 40 hij 86 abc 85 abc 16-TZ-12783 52 f-j 63 a-d 42 g-j 91 a 97 a 16-TZ-13463 43 ij 50 d-g 19 kl 84 abc 88 abc 16-TZ-14114 82 ab 87 ab 80 abc 87 abc 88 abc Chisholm 48 g-j 43 d-g 56 d-h 72 cde 58 def Meyer 63 c-g 47 d-g 66 a-e 57 efg 32 gh Empire 72 a-d 50 d-g 80 abc 83 abc 87 abc Jamur 83 a 88 a 84 a 86 abc 88 abc Zenith 38 j 30 g 18 kl 37 hi 47 fg 'Riviera' bermudagrass 78 abc 83 ab 66 a-f −c −c P-value < 0.0001 < 0.0001 < 0.0001 < 0.0001 < 0.0001 a Means within each column with a common letter are not significantly different according to Fisher's protected LSD (α = 0.05).
b Entry did not survive establishment in 2018 and not enough remaining replications to analyze.
c Entry or check not planted at site.Turf playability
-
Measurements of the percent of golf ball visible within the turf canopy indicated there were differences among treatments in Indiana and Georgia, but not North Carolina, most likely because of greater variability in measurements in North Carolina (Tables 2−4). A higher ball lie percentage is generally the result of the turfgrass leaves providing better support of a golf ball to keep it largely above the turf canopy. The following five treatments ranked in the top statistical group (i.e. greatest percent ball lie) in both Indiana and Georgia: XZ14055, XZ14071, 09-TZ-54-9, 10-TZ-994, and16-TZ-12036. There were five and seven additional treatments in Indiana and Georgia, respectively, that ranked in the top statistical group for ball lie within each site (Tables 2 & 4). Another commonality between sites is that the following treatments ranked in the lowest statistical group (i.e. lowest percent ball lie) in both Indiana and Georgia: PURZ 1701, ZG09004, and 16-TZ-14114. Therefore, there were similar trends in average golf ball lie across sites. Overall, average visible golf ball lie across all treatments was 38%, 54%, and 60% in Indiana, North Carolina and Georgia, respectively. In addition, the greatest difference between the average maximum and minimum golf ball lie at each site was 35%, 37%, and 29% in Indiana, North Carolina, and Georgia, respectively.
-
The unique climate for each site led to differences in performance across sites (Tables 1−7 and Fig. 1). However, consistencies across sites, which are illustrated more clearly in Fig. 2, could also be observed. Particularly, North Carolina was the most comparable to Indiana than any of the other sites, a trend that is evident when comparing TPI scores (Fig. 2). Furthermore, North Carolina and Georgia have comparable humid climates in the southern United States, and this led to some similarities in overall TPI between these two sites. There was more consistency in TPI scores among Georgia, Arizona, and California, especially between the latter two sites, because of similar climates.
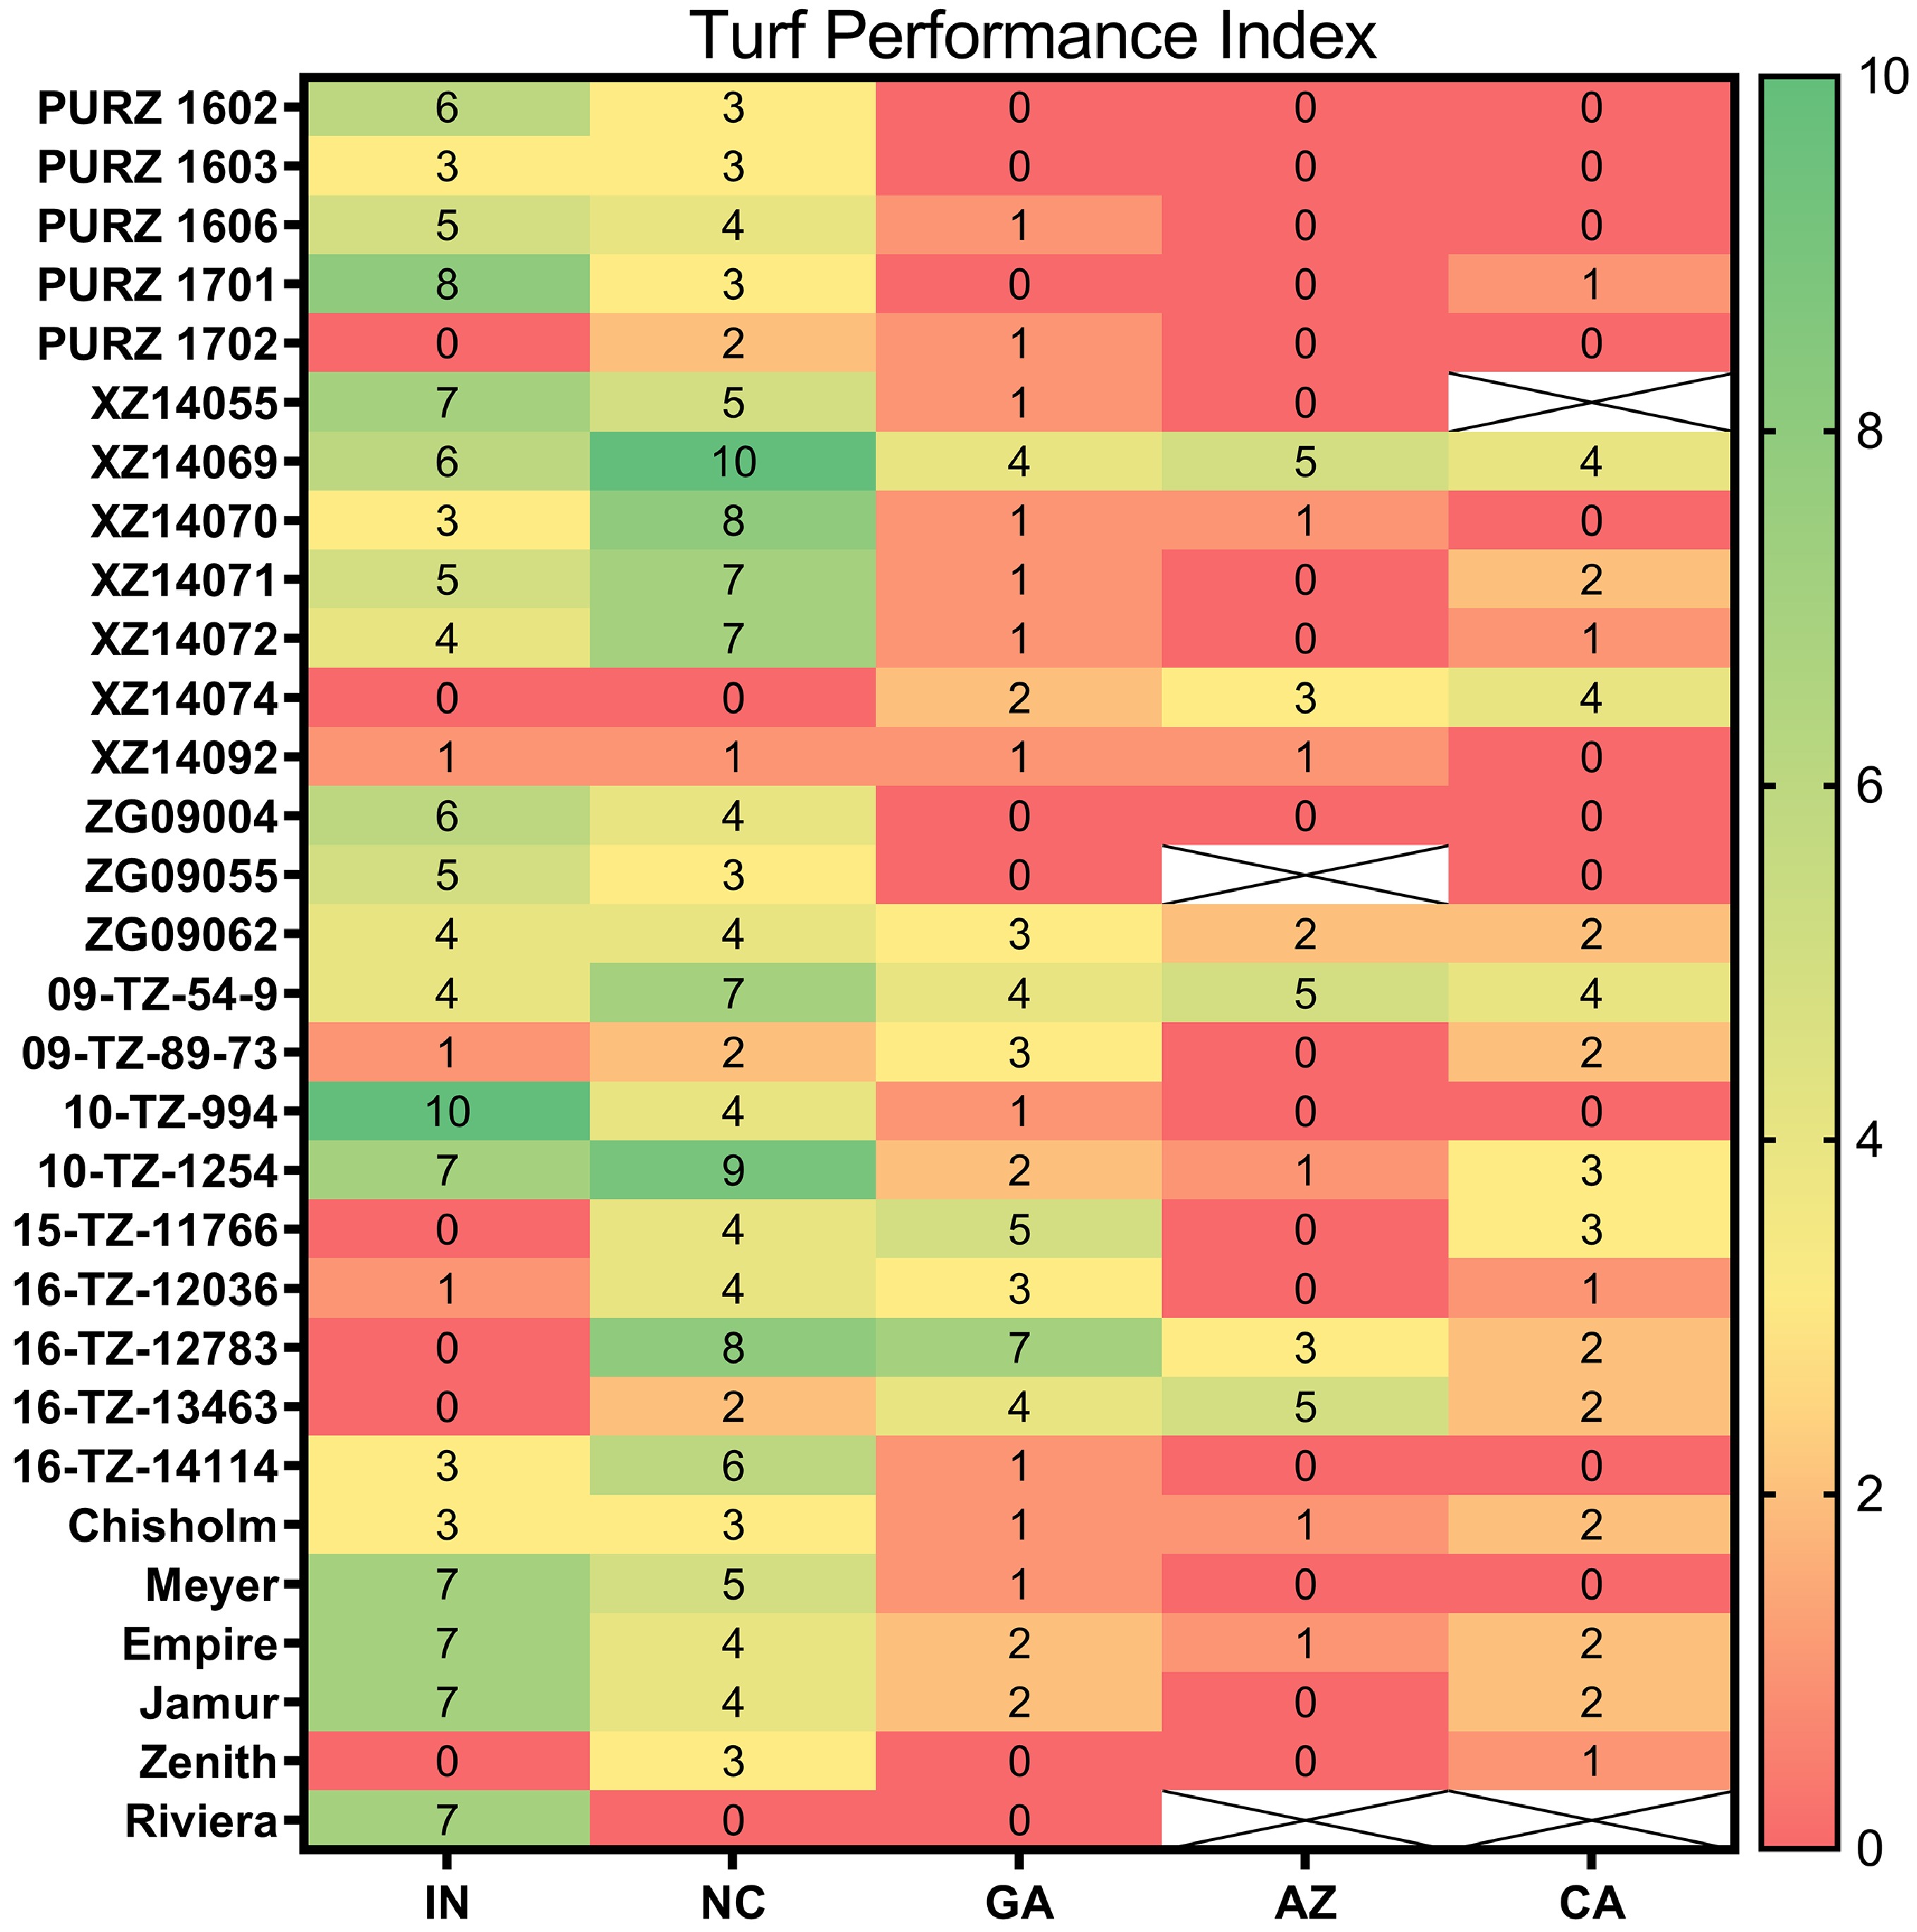
Figure 2. Cumulative turf performance index score at each location, which is the number of times a treatment occurred in the top statistical group across all parameters. The maximum possible turf performance index number is the following: Indiana (14), North Carolina (12), Georgia (7), Arizona (5), and California (4). Treatments with a blank cell with x indicate the entry or check was not planted at the location.
The more northern location of Indiana allowed evaluation of potential differences in cold hardiness, which was an important trait in determining which treatments may have better success in the northern transition zone (Table 1 and Fig. 2). Meanwhile, with less likelihood of the extreme minimum temperatures during winter than Indiana and little-to-no winterkill damage, the more southern and humid climates of North Carolina and Georgia, and the more southern and arid climates of Arizona and California resulted in other treatments generally performing better, as indicated by TPI scores (Fig. 2). However, entries such as XZ14069 and 09-TZ-54-9 had moderate-to-good performance across all five sites; and entries such as ZG09062 and 10-TZ-1254 had only slightly lower performance than the first two across all five sites. These four entries are the only ones that did not receive a TPI score of zero at any site. If cold hardiness is not a concern, then results indicate additional entries such as 16-TZ-12783, 16-TZ-13463, and 15-TZ-11766 could perform well at low-maintenance sites. Currently, entry XZ14069 is planned for commercial release in 2021 (S. Milla-Lewis, personal communication, 2021).
The five zoysiagrass and one bermudagrass cultivar checks included in the experiment for standard comparison are known to have good cold hardiness[14,26]. We observed similar cold hardiness (i.e. minimal winterkill damage) performance among cultivar checks, and the majority of these continued to perform well in Indiana under low-input conditions. However, their overall performance compared to the experimental genotypes declined when grown farther south and/or in more arid climates (Fig. 2). Particularly, these six cultivars had middle-to-lower tier performance in North Carolina, and generally were some of the worst performing treatments in the warmer and humid (i.e. Georgia) or arid sites (i.e. Arizona and California). In addition, with the exception of Indiana, there were at least five entries that had a higher TPI score than the best performing cultivar check at each respective site. There were at least two entries in Indiana with a higher TPI score than the best performing cultivar check. Moreover, one to five other entries had a similar TPI score than the best performing cultivar checks at each respective site. Overall, the poor performance of commercially available coarse-textured zoysiagrass cultivars receiving minimal inputs in hot humid or arid climates indicates multiple opportunities for breeding programs to develop zoysiagrass genotypes for these climates.
Differences in establishment among genotypes and cultivar checks were more pronounced in the southern United States, especially the arid climates of Arizona and California. Interestingly, a faster establishment was exhibited by some genotypes at four of the five sites when compared to Meyer, the most widely used cultivar since 1951. Overall, there were a few consistencies in establishment rate among genotypes across sites, and results indicate opportunities for breeding programs to utilize and develop these faster establishing genotypes.
For ball lie measurements, which is an indication of the potential to hit a quality golf shot[27], the range of ball lie percentages slightly differed among sites, which was likely due to minor differences in mowing heights of ± 1.3 cm among sites. Regardless, there were some consistencies, and results indicate some entries may provide a better ball lie (i.e. more visible or exposed ball) for golf course rough areas. Strunk et al.[27] reported a golfer could expect a decrease in carry distance by 4.6 and 9.1 m when ball lie was below 55 and 30%, respectively. Past research by Richardson et al.[25] and Trappe et al.[3] reported generally > 91% of the golf ball is exposed above the turf canopy on mown fairway height (1.3 cm) zoysiagrass and bermudagrass cultivars and 73% to 84% of the golf ball is visible at a mowing height of 2.5 cm. It may be practical for golf course rough areas to provide an intermediate golf ball lie (40%−70%) as a way to penalize golfers for errant golf shots. Average visible golf ball ranged from 17% to 75% across sites in our experiment, which is to be expected because of the higher mowing height (7.6 ± 1.3 cm) implemented[27]. Regardless, all treatments were mown at the same height within each site and results indicate some genotypes provided a turf surface that was able to hold the golf ball higher up in the turf canopy than other treatments for an intermediate golf ball lie in Indiana and Georgia. This was most likely because these genotypes generally had greater turf density or uniformity, and also potentially leaf blades of these entries may have been more stiff and able to suspend the golf ball at the top of the zoysiagrass canopy, which is a known strength of zoysiagrass[1]; however, leaf blade stiffness was not measured.
-
Given that many zoysiagrasses have lower mowing requirements and often resist weed encroachment better than other warm-season species, expanded use of this grass could have a significant environmental impact. However, current breeding efforts in the United States are largely focused on golf course 'fairway' and 'putting green' zoysiagrass types. Little breeding effort has been placed towards the creation of aggressive, vegetatively established zoysiagrass cultivars well adapted for golf course roughs, lawns, roadsides, airports, and other infrequently mown areas where function and stress tolerance tend to be less important than aesthetics. The present study identified breeding lines with exceptional ability to persist under very low inputs. Furthermore, some of these lines showed superior performance to commercially available cultivars under warm-temperate, warm-humid and hot-arid climates, demonstrating wide adaptability. Aggressive zoysiagrass germplasm that has excellent stress tolerance when managed with low to no inputs would increase the prevalence of zoysiagrass use in new markets. Additionally, to fully realize the benefits of zoysiagrasses and develop more sustainable golf course roughs and landscapes, there is a significant need to broaden the pool of winter hardy and freeze tolerant commercial cultivars that are better adapted to warmer regions in order to expand the commercial adoption of zoysiagrass north of the transition zone north. A couple of the lines identified in our research combined excellent persistence with the ability to withstand the cold winters of Indiana. Breeding efforts between collaboration institutions, each with unique germplasm, should be initiated to hybridize germplasm with the genetic potential for wider adaptation in environments that will likely force management of turfgrass with lower inputs in the future.
-
Field experiments were established in full-sun areas between May and July in 2018 at five sites in the United States located in multiple climates (i.e. warm-arid, warm-humid, northern transition zone). Table 1 provides site, soil, and climate specifications for each location. Thirty entries were arranged in a randomized, complete-block design with three complete blocks totaling 90 plots at each site, with the exception that one entry and commercially available cultivar were not planted at the Arizona and California sites due to lack of plant material (Table 8). Twenty-four of the entries consisted of Zoysia spp. experimental breeding lines from Purdue University, North Carolina State University, and University of Georgia, and the other six entries consisted of commercially available cultivars of zoysiagrass and bermudagrass for standard comparison (Table 8).
Table 8. Experimental zoysiagrass entries and commercially available cultivars evaluated at five locations for overall performance under minimal inputs.
Entry Species Source PURZ 1602 Z. japonica Purdue University PURZ 1603 Z. japonica Purdue University PURZ 1606 Z. japonica Purdue University PURZ 1701 Z. japonica Purdue University PURZ 1702 Z. japonica Purdue University XZ14055 Z. japonica × Z. matrella North Carolina State University XZ14069 Z. japonica × Z. matrella North Carolina State University XZ14070 Z. japonica × Z. matrella North Carolina State University XZ14071 Z. japonica × Z. matrella North Carolina State University XZ14072 Z. japonica × Z. matrella North Carolina State University XZ14074 Z. japonica × Z. matrella North Carolina State University XZ14092 Z. japonica × Z. matrella North Carolina State University ZG09004 Z. japonica × Z. matrella North Carolina State University ZG09055 Z. japonica × Z. matrella North Carolina State University ZG09062 Z. japonica × Z. matrella North Carolina State University 09-TZ-54-9 Z. japonica × Z. matrella University of Georgia 09-TZ-89-73 Z. matrella × Z. japonica University of Georgia 10-TZ-994 Z. japonica University of Georgia 10-TZ-1254 Z. macrantha Desvaux University of Georgia 15-TZ-11766 Z. matrella University of Georgia 16-TZ-12036 Z. japonica × Z. matrella University of Georgia 16-TZ-12783 Z. japonica × Z. matrella University of Georgia 16-TZ-13463 Z. matrella × Z. japonica University of Georgia 16-TZ-14114 Z. japonica University of Georgia Commercially available cultivars Species Source 'Chisholm' zoysiagrass Z. japonica Texas A&M AgriLife Research and Kansas State University 'Meyer' Z. japonica United States Department of Agricultre 'Empire' zoysiagrass Z. japonica Sod Solutions, Inc. 'Jamur' zoysiagrass Z. japonica Bladerunner Farms, Inc. 'Zenith' zoysiagrass Z. japonica Patten Seed Co. 'Riviera' bermudagrass C. dactylon var. dactylon Oklahoma State University At planting, genotypes were transplanted as 20 × 25.8 cm2 grass plugs (5.1 × 5.1 cm) into the center of each 1.5 by 1.5 m plot with 0.5 m borders. To promote establishment after planting in 2018, the study areas were irrigated and one month after planting the plots received fertilizer at a rate of 49 kg N ha−1 (urea; 46-0-0). Additional pest (e.g. weeds) control was applied only on an as needed basis during the first year to promote establishment. During the 2019 and 2020 growing seasons, plots were maintained with minimal-to-no inputs (i.e. N fertilization, pesticides, irrigation) to simulate a low-maintenance turf area. Irrigation was applied at the Arizona and California locations when wilt became severe in plots. Plots were mown as needed at typical golf course rough or home lawn heights (7.6 ± 1.3 cm), with the exception of the Arizona site which was managed at 5.1 cm.
Data collection began in the autumn of 2018 and continued through 2020. Data collected included ratings of quality, density, and uniformity rated visually on a 1 to 9 scale in which 9 = highest possible, 6 = minimally acceptable, and 1 = undesirable; seasonal color (i.e. spring green-up, summer, autumn) rated visually on a 1 to 9 scale in which 9 = dark green; 6 = minimally acceptable color; 1 = straw brown; winter kill rated visually on a 1 to 9 scale in which 9 = fully green and 1 = no green tissue; leaf texture on a 1 to 9 scale in which 9 = fine and 1 = coarse; and drought stress resistance rated visually on a 1 to 9 scale in which 9 = no wilting or leaf firing, 100% green-no dormancy and 1 = complete wilting, 100% leaf firing or complete dormancy. Turf cover was rated visually on 0−100% scale. Collection ratings and timings were conducted in accordance to National Turfgrass Evaluation Program guidelines[28]. Average turf quality for each plot was calculated from multiple collection timings for each site. Digital images were taken in Georgia using a lighted camera box and analyzed with SigmaScan Pro 5.0 (ver 5.0, SPSS Science Marketing Dept., Chicago, IL) using the method developed by Karcher and Richardson[29] to calculate dark green color index (DGCI) on a 0 to 1 scale with higher values corresponding to darker green color. Average DGCI for each plot was then calculated from five collection timings during the 2018, 2019, and 2020 growing seasons. Golf ball lie on a 0 to 100% scale was measured at five, six, or two dates during the 2019 and 2020 growing seasons in Indiana, North Carolina, and Georgia, respectively, using the method developed by Richardson et al.[25]. Average ball lie for each plot was then calculated from the multiple collection timings at each site. Additional data included digital images collected at the other four sites with a mounted digital camera and analyzed with ImageJ version 1.52a[30] to assess green vegetation cover (0−100%) to determine establishment rate differences and changes in turf cover over time. Due to the COVID-19 pandemic and travel restrictions, less data collection events occurred in 2020 compared to 2019, especially in Georgia, Arizona, and California. At the conclusion of the study, a cumulative turf performance index (TPI) score was generated for each treatment within each location, representing the number of times it occurred in the top statistical grouping across all parameters (except leaf texture ratings because of research objectives) and all sampling dates similar to the methods of Wherley et al.[12]. Weather data was collected from either an on-site or nearby weather station for each location.
Statistical analysis
-
Data for each parameter were analyzed for each location separately with SAS version 9.4 (SAS Institute Inc.), utilizing the GLIMMIX procedure with block as a random effect. Residual normality was tested with the w statistic of the Shapiro–Wilk[31] test via the UNIVARIATE procedure of SAS. Means were separated with Fisher's Protected LSD test (α = 0.05) when the F-tests were significant (P ≤ 0.05).
- The authors wish to acknowledge the funding support by the United States Golf Association. We thank Jimmy Fox and Jonathon Fox; and personnel at Lake Wheeler Turfgrass Field Laboratory, W. H. Daniel Turfgrass Research and Diagnostic Center, and Coastal Plain Experiment Station for their efforts in this research.
- The authors declare that they have no conflict of interest.
- Copyright: © 2021 by the author(s). Exclusive Licensee Maximum Academic Press, Fayetteville, GA. This article is an open access article distributed under Creative Commons Attribution License (CC BY 4.0), visit https://creativecommons.org/licenses/by/4.0/.
-
About this article
Cite this article
Braun RC, Milla-Lewis SR, Carbajal EM, Schwartz BM, Patton AJ. 2021. Performance and playability of experimental low-input coarse-textured zoysiagrass in multiple climates. Grass Research 1: 10 doi: 10.48130/GR-2021-0010

Performance and playability of experimental low-input coarse-textured zoysiagrass in multiple climates
- Received: 16 July 2021
- Accepted: 28 September 2021
- Published online: 20 October 2021
Abstract: A 3-year experiment was conducted to evaluate the performance and playability of 24 coarse-textured zoysiagrass (Zoysia spp. Willd.) experimental genotypes in comparison to five commercially available cultivars maintained as a low-maintenance turf across multiple climates (Indiana, North Carolina, Georgia, Arizona, and California). Following establishment in 2018, plots were maintained under low-maintenance regimes and evaluated for quality, density, uniformity, color, winterkill damage, drought resistance, and golf ball lie in 2019 and 2020. A turf performance index (TPI) was calculated for each treatment at each site, which represented the number of times the treatment occurred in the top statistical group. The unique climate for each site led to differences in TPI scores. For instance, the arid climates of Arizona and California resulted in distinct differences in performance among treatments compared to the other sites. However, consistencies in performance across sites were also observed. For example, the 2018−2019 winter resulted in winterkill differences among entries in both Indiana and North Carolina, which led to some similarities in TPI. Furthermore, the southern humid climates of North Carolina and Georgia produced consistencies in overall TPI. Under the minimal inputs and the hot-humid or arid climates evaluated in this study, all of the check cultivars were some of the poorest performing treatments, which clearly illustrates there is a need for breeding programs to develop zoysiagrass genotypes for these climates. However, experimental lines that exhibited excellent persistence under these conditions were identified indicating the genetic potential for wider adaptation to lower input environments exists within the species.
-
Key words:
- Turfgrass /
- Breeding /
- Zoysiagrass /
- Warm-season