-
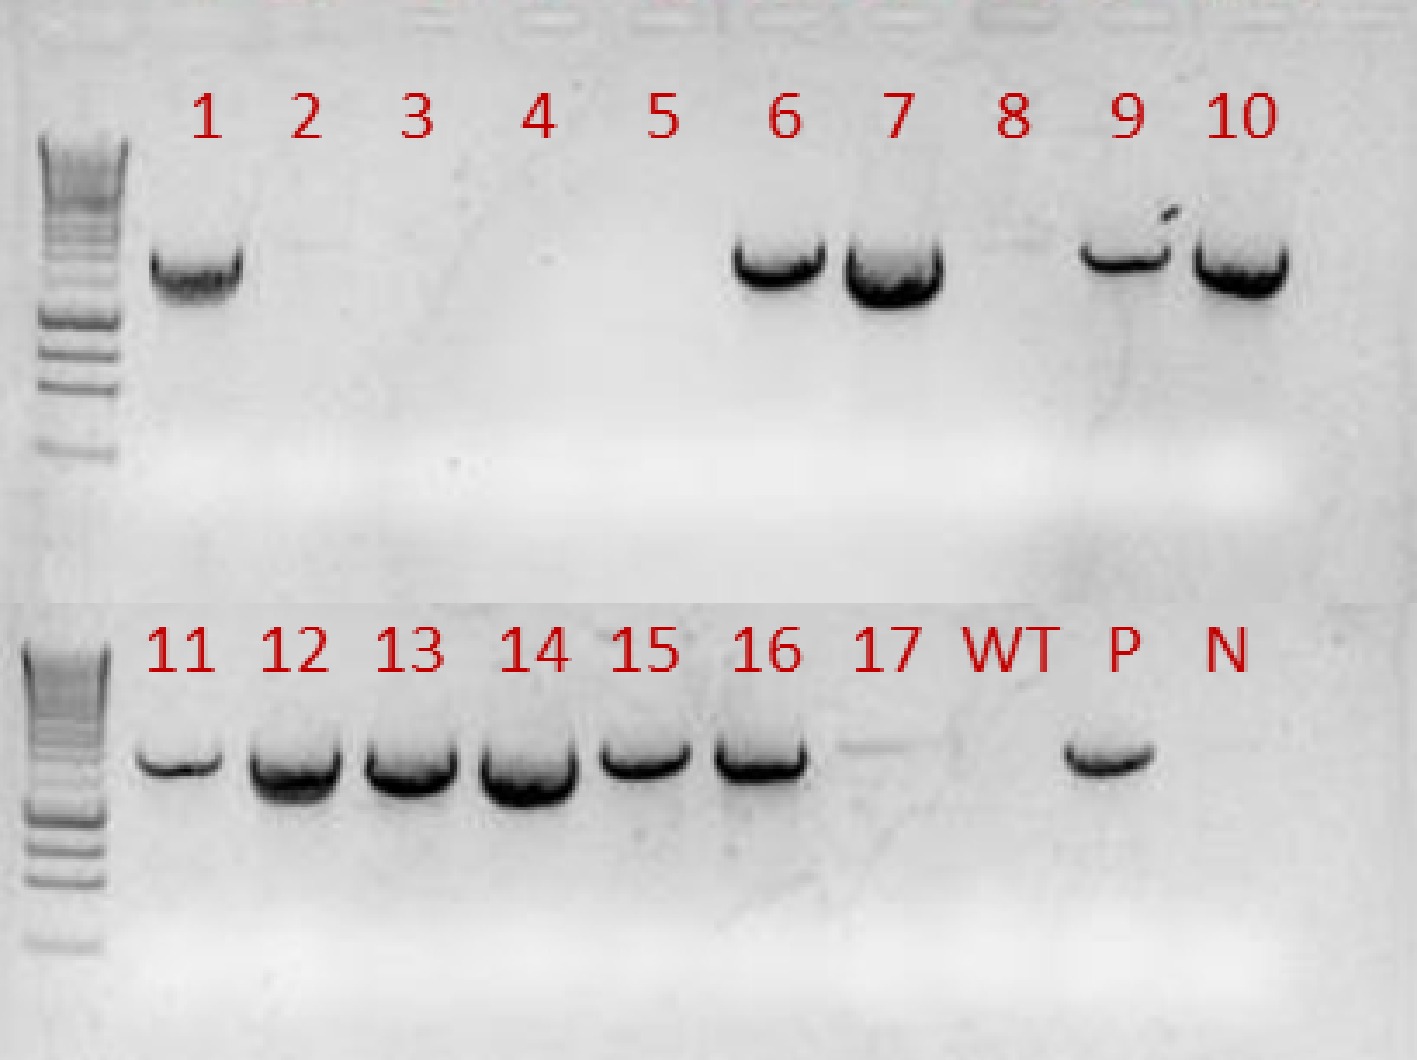
Figure 1. A total of 17 independent putative transgenic T0 lines were generated. Genomic DNA was extracted from leaves of these lines. PCR-based genotyping was performed to confirm the presence of the transgene using Forward Primer: 5’-CTAGAAAACAATCAGGAATAAAGGGT-3’ from RD29A and Reverse Primer: 5’-ATACTAGTCTAATTGGTGGAG AG-3’ from gai-1. Results showed that at least 11 lines contained the transgene. WT: non-transgenic wild-type; P: positive control using the plasmid DNA containing transgene gai; N: negative control.
-

Figure 2. Transgenic plants show normal growth and development under non-stress conditions. The L1 line with the leaky expression of the transgene displayed a dwarf plant phenotype compared with the transgenic lines L7, L9 and wild type.
-

Figure 3. Semi-quantitative PCR analysis of gai-1 expression in transgenic petunia plants. Expression of the gai-1 transgene was strongly induced after 5 h in the petals (a) and 5 d in the leaves (b) after drought treatment. The RD29A:gai L1 line showed strong leaky gai expression even without drought treatment (a).
-
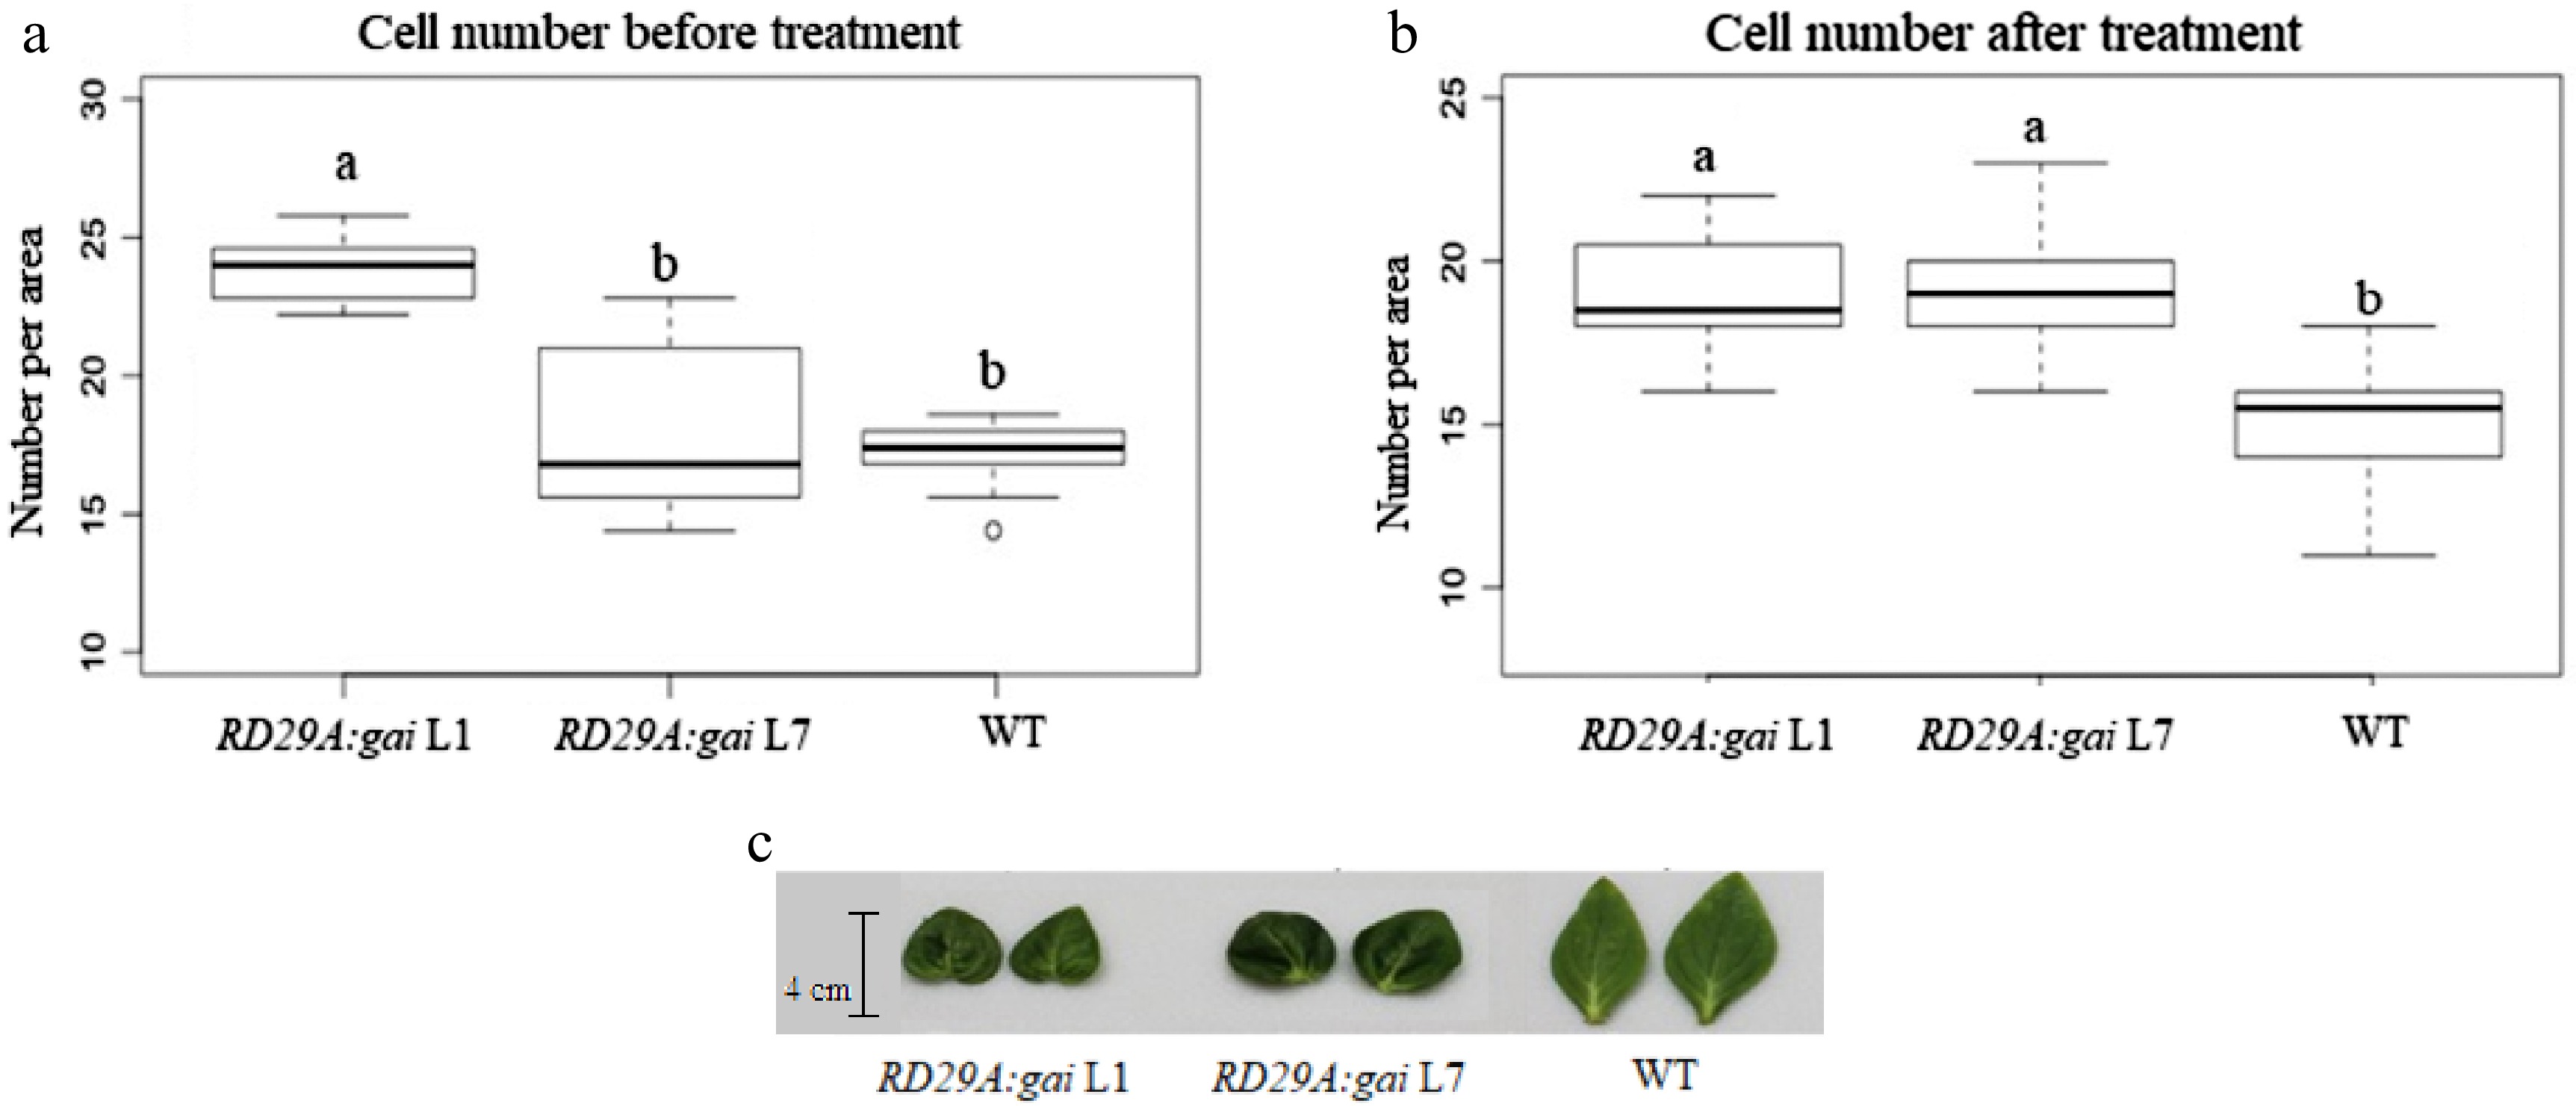
Figure 4. Cell number and morphology of leaves in response to drought treatment. (a) Plants were grown in the growth chamber at 22 °C with regular irrigation. (b) Plants were grown in the greenhouse at approximately 35 °C with drought treatment. Abaxial epidermis cells (1 cm2 samples) from the fully opened flower petals were counted in each view area under a microscope with a camera for recording cell images. (c) Representative leaves from transgenic plants under drought and heat treatments showed darker green phenotype and were smaller than the wild type control. Different lower case letters represent groups that are statistically different from each other at p < 0.05.
-

Figure 5. Flower fresh and dry weights before (a) and after (b) drought treatments. Fully opened flowers are selected and fresh weights were measured. After that, the flowers were placed in a drying-oven at 37 °C for 5 d for measuring the dry weight. Ratios of Dry weight/Fresh weight were calculated. Different lower case letters represent groups that are statistically different from each other at p < 0.05.
-
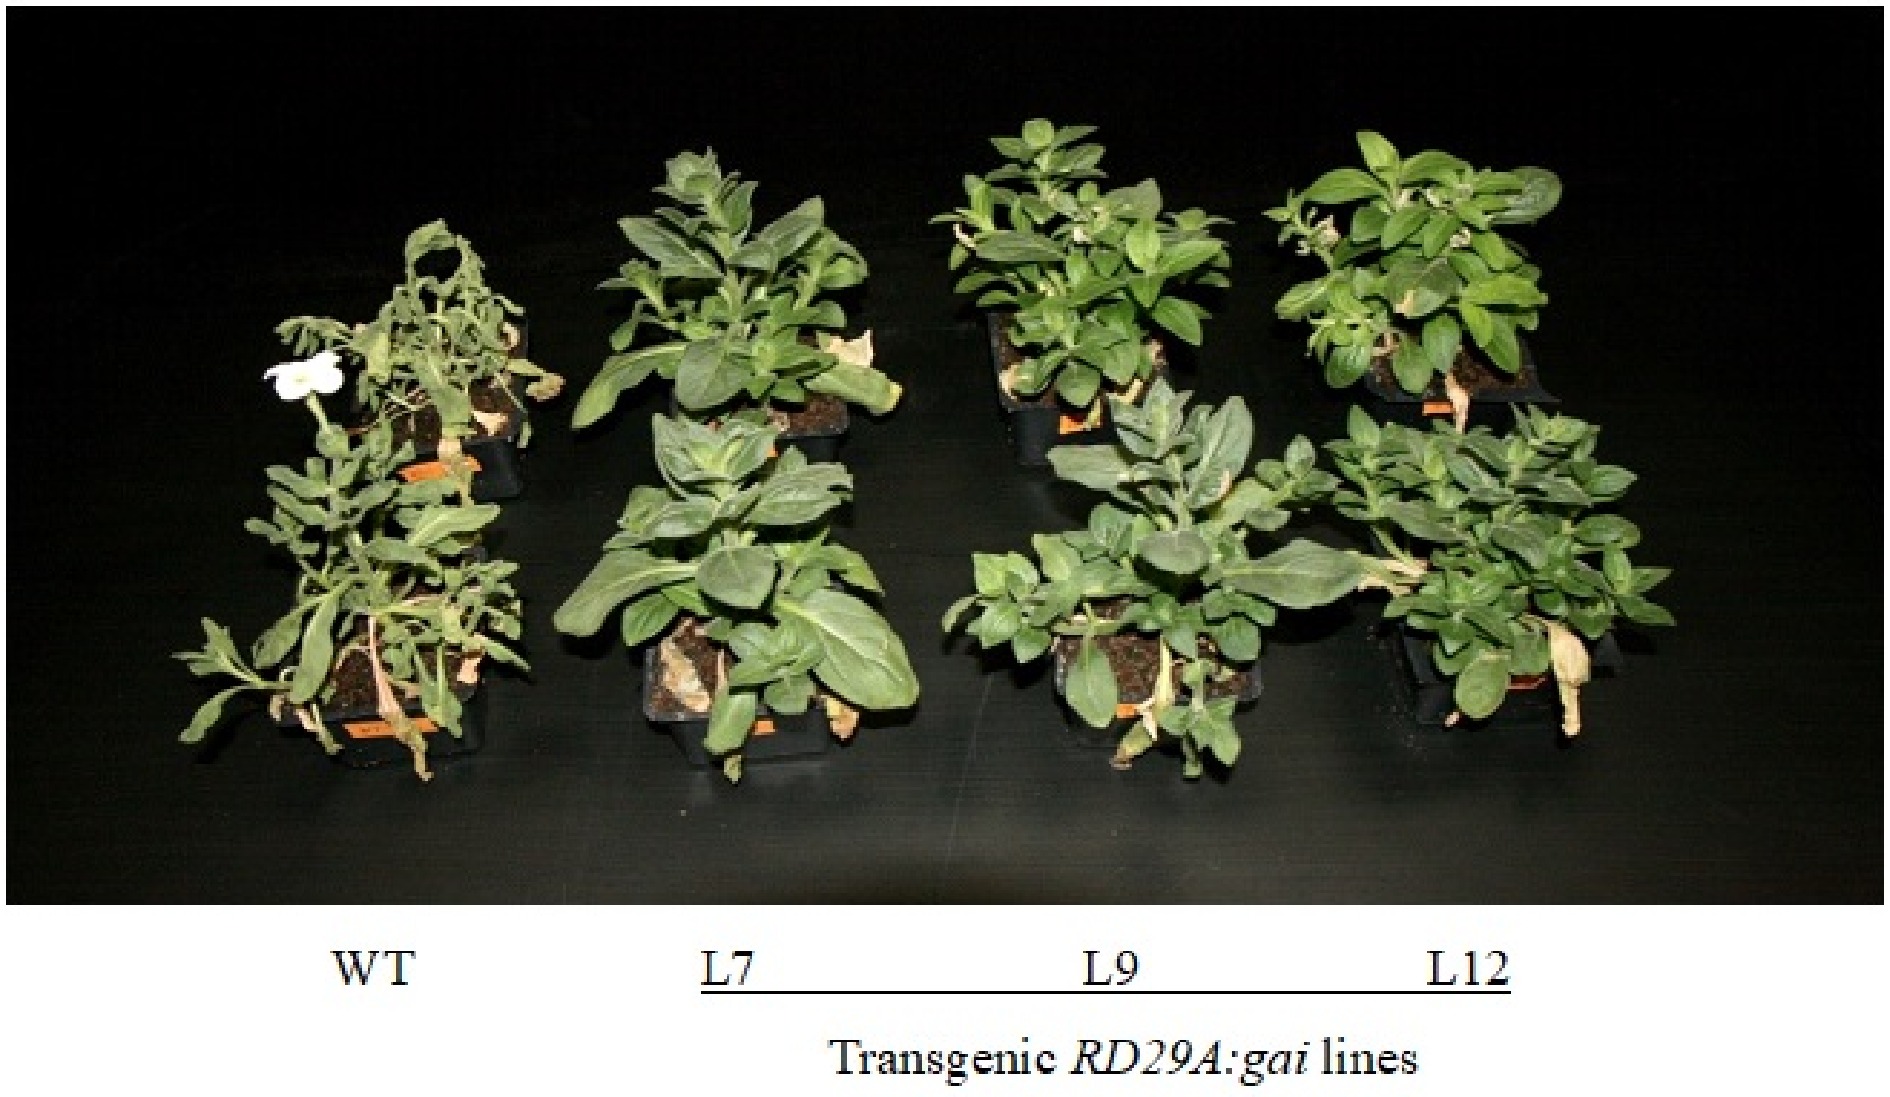
Figure 6. Enhanced drought resistance in the transgenic plants. Plants were grown in the greenhouse in a tray for limited irrigation and watered once a week with 500 mL water per tray for a month. Plants were then subjected to drought treatment by withholding irrigation for 18 d. The phenotypes of plants were photographed one week after re-watering.
Figures
(6)
Tables
(0)