-
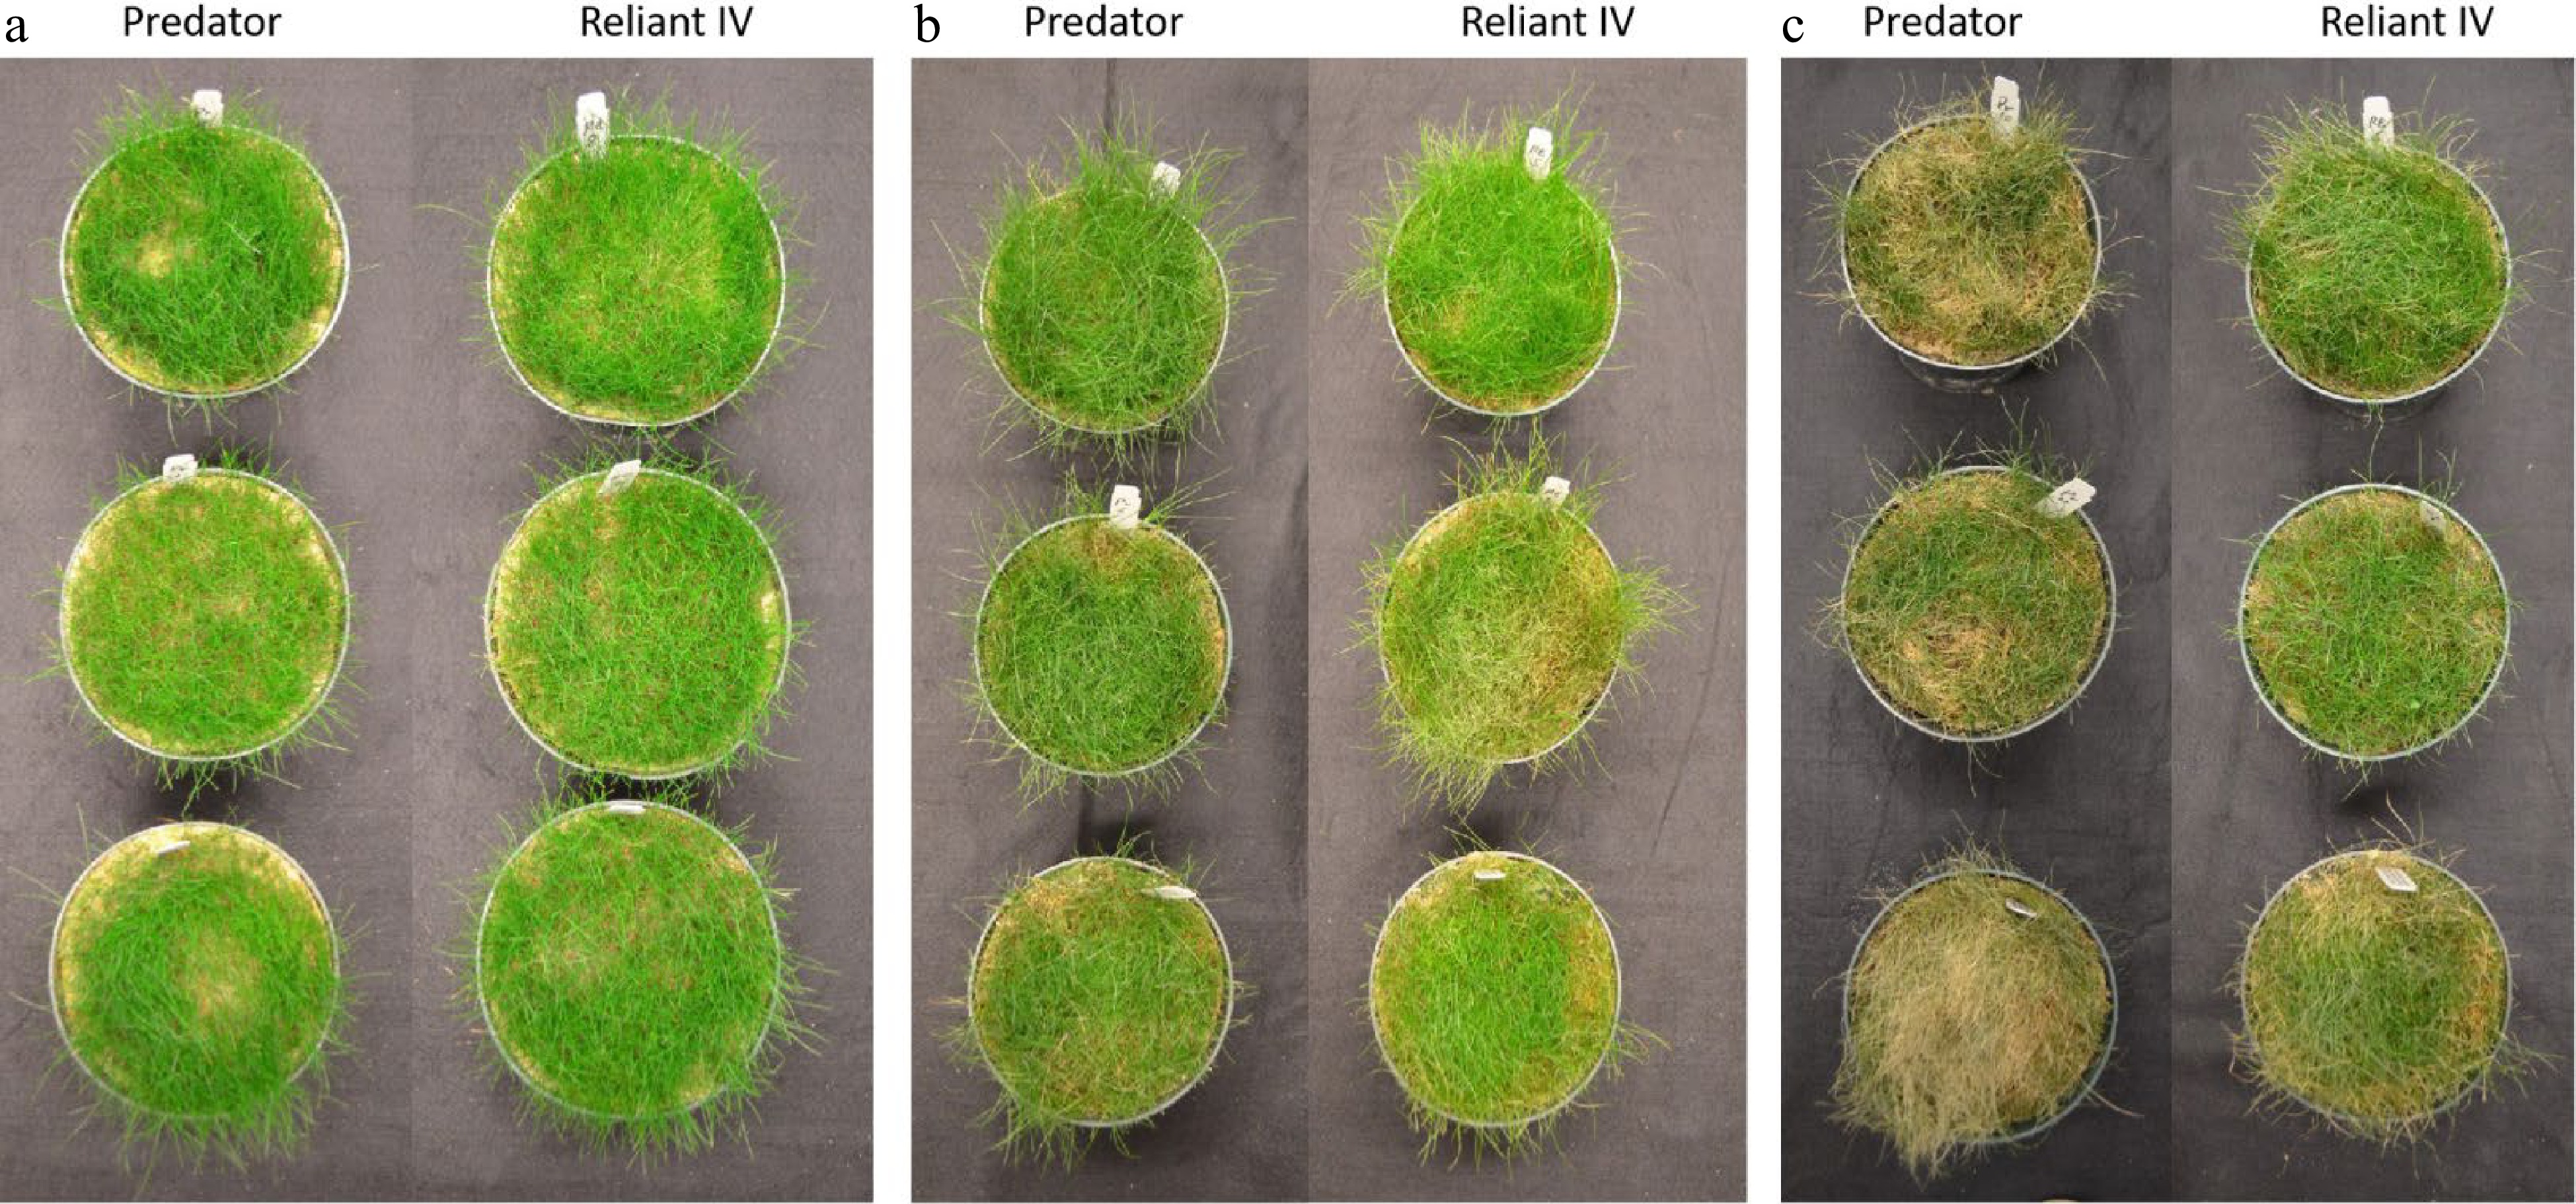
Figure 1. Plants of 'Predator' and 'Reliant IV' grown under (a) normal temperature (0 d of heat stress), (b) 7 d of heat stress, (c) 14 d of heat stress.
-
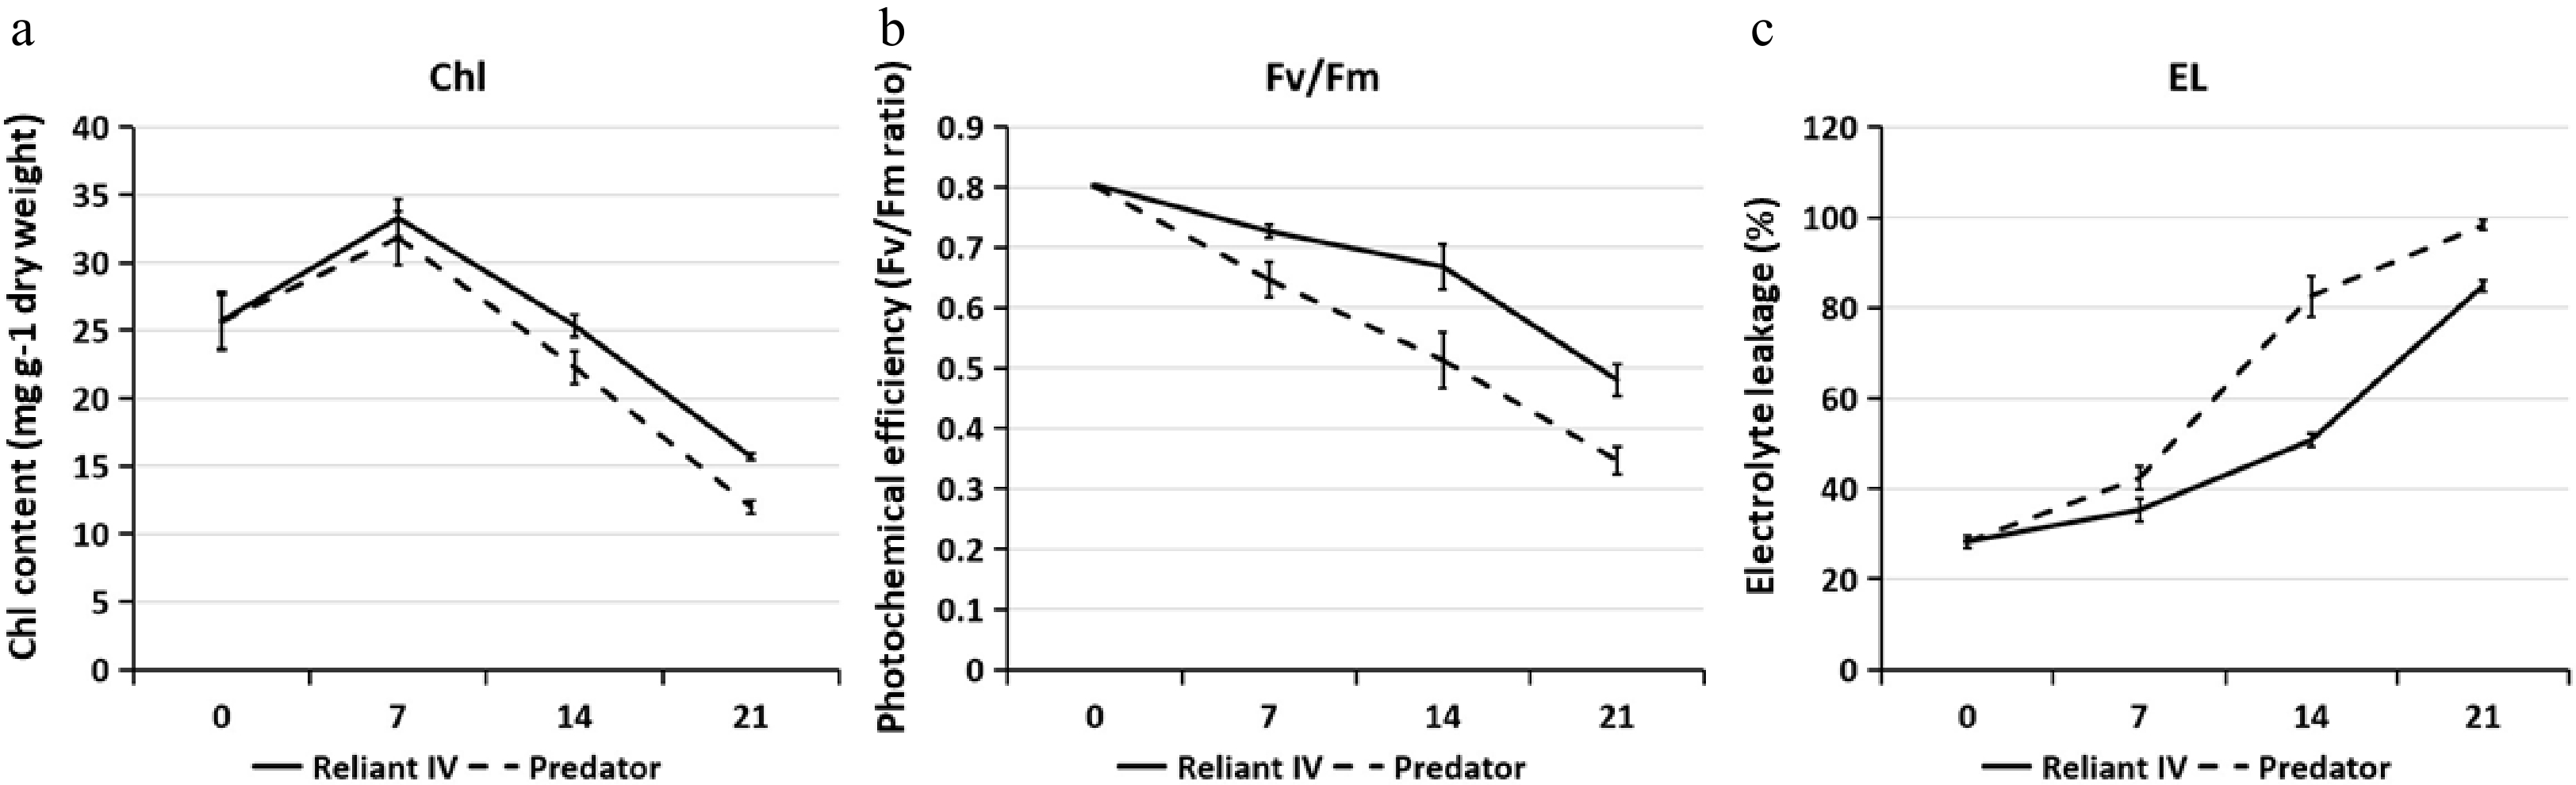
Figure 2. (a) Leaf chlorophyll (Chl) content, (b) photochemical efficiency (Fv/Fm), and (c) electrolyte leakage (EL) of 'Predator' and 'Reliant IV' in response to heat stress. The error bars represent standard error (SE) for three biological replicates (n = 3).
-
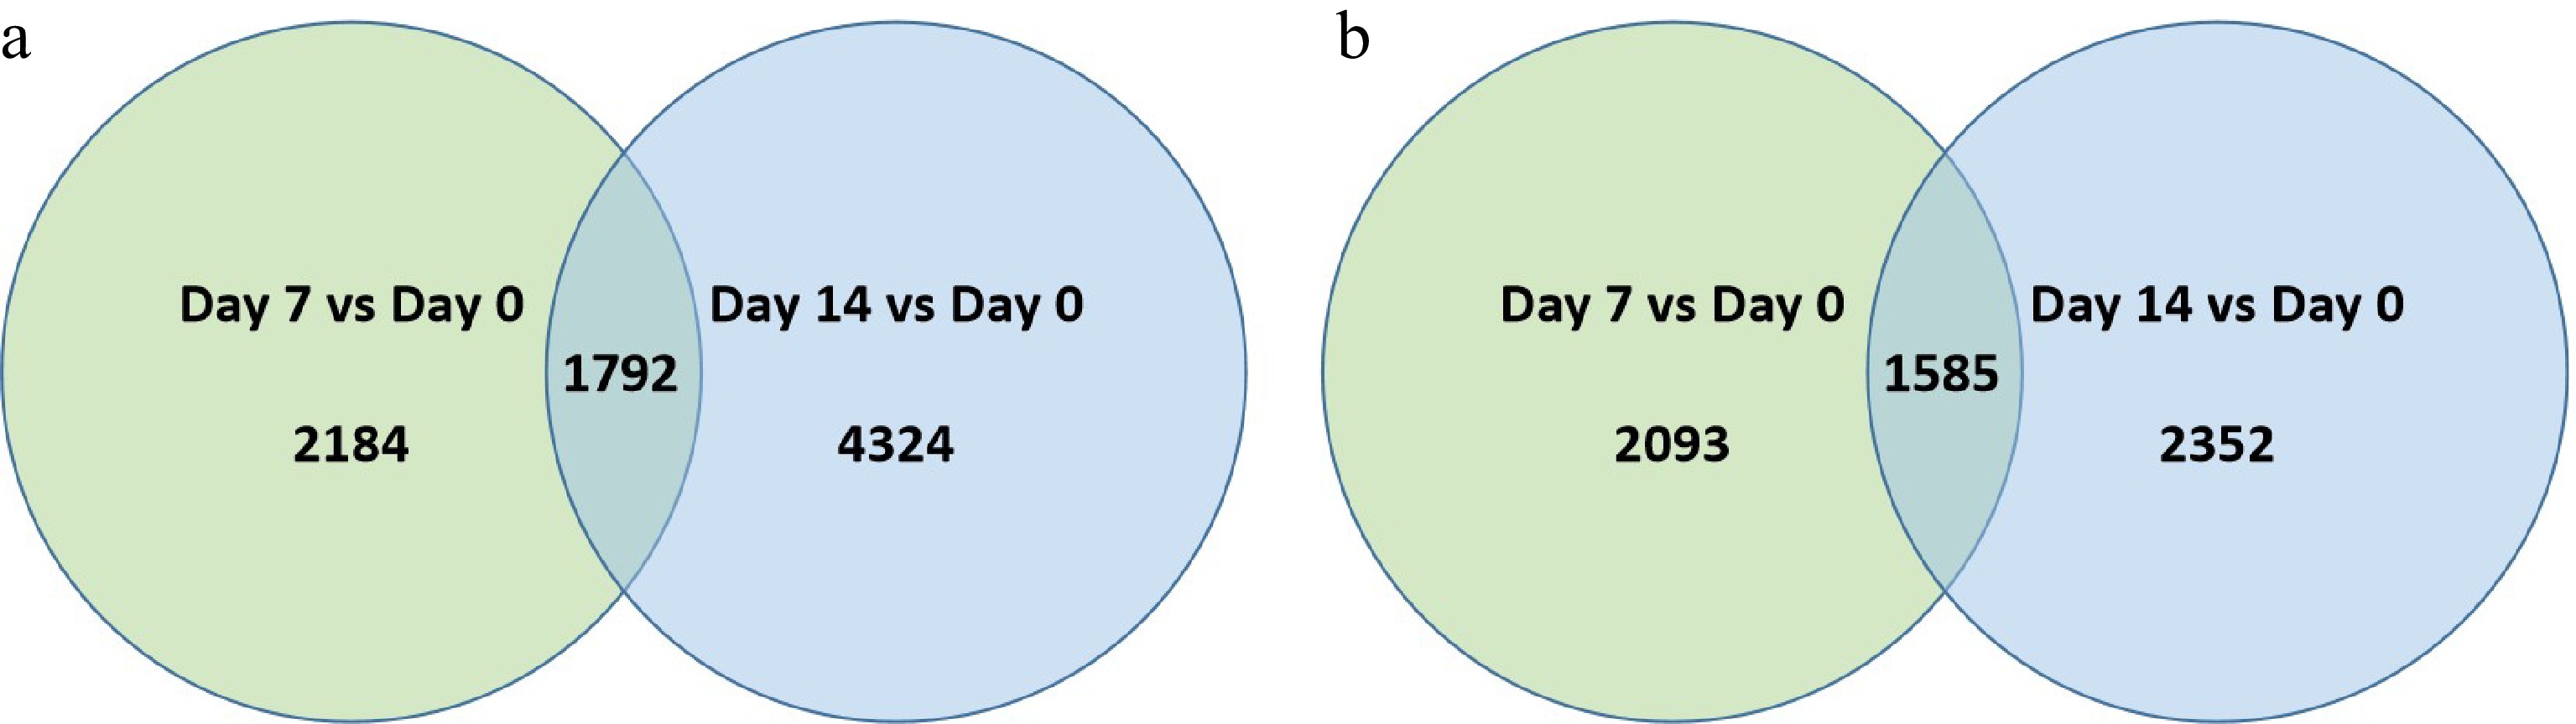
Figure 3. Venn diagram illustrating the number of differentially expressed genes (DEGs) that were (a) up-regulated or, (b) down-regulation at 7 d or 14 d of heat stress in comparison to that at 0 d of heat stress (Day 7 vs. Day 0 or Day 14 vs. Day 0) for 'Predator'. The numbers in each circle and overlapping area represent unique and common DEGs between days of heat stress, respectively.
-
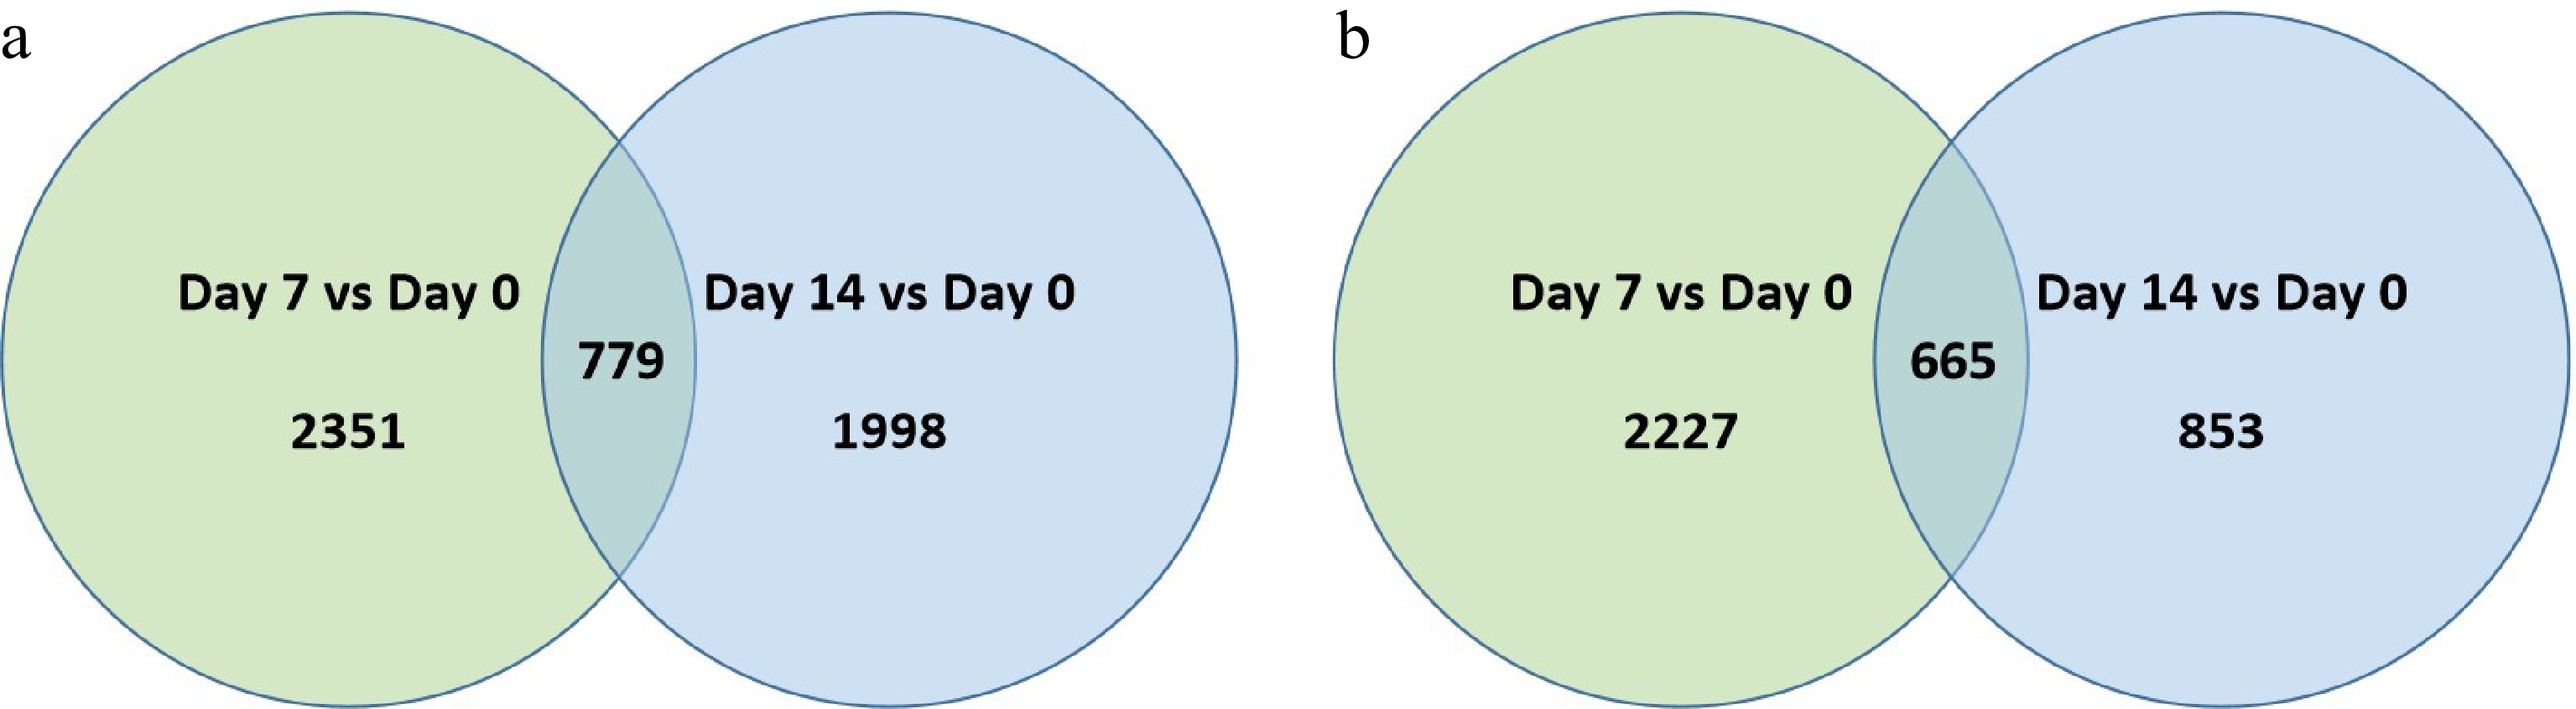
Figure 4. Venn diagram illustrating the number of differentially expressed genes (DEGs) that were (a) up-regulated or, (b) down-regulation at 7 d or 14 d of heat stress in comparison to that at 0 d of heat stress (Day 7 vs. Day 0 or Day 14 vs. Day 0) for 'Reliant IV'. The numbers in each circle and overlapping area represent unique and common DEGs between days of heat stress, respectively.
-
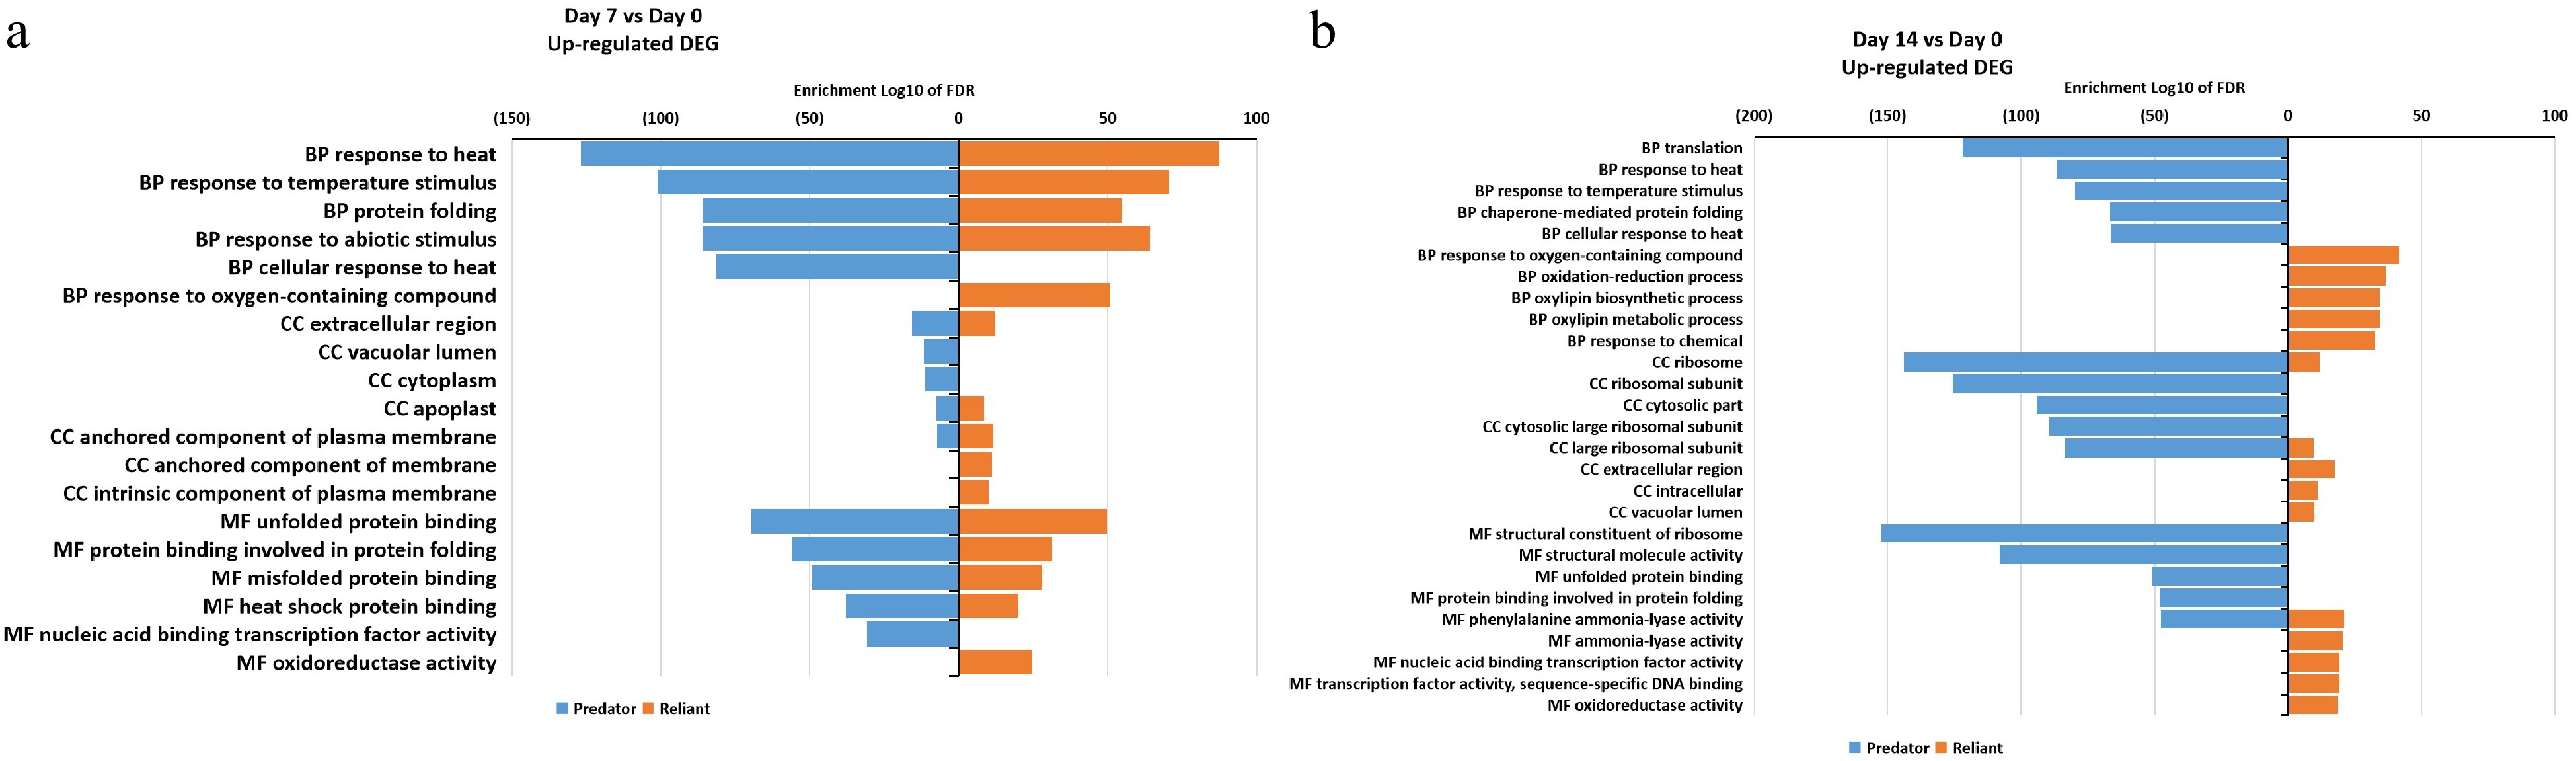
Figure 5. Gene ontology (GO) enrichment analysis of DEGs that were up-regulated at (a) 7 d of heat stress and (b) 14 d of heat stress in 'Predator' and 'Reliant IV'.
-
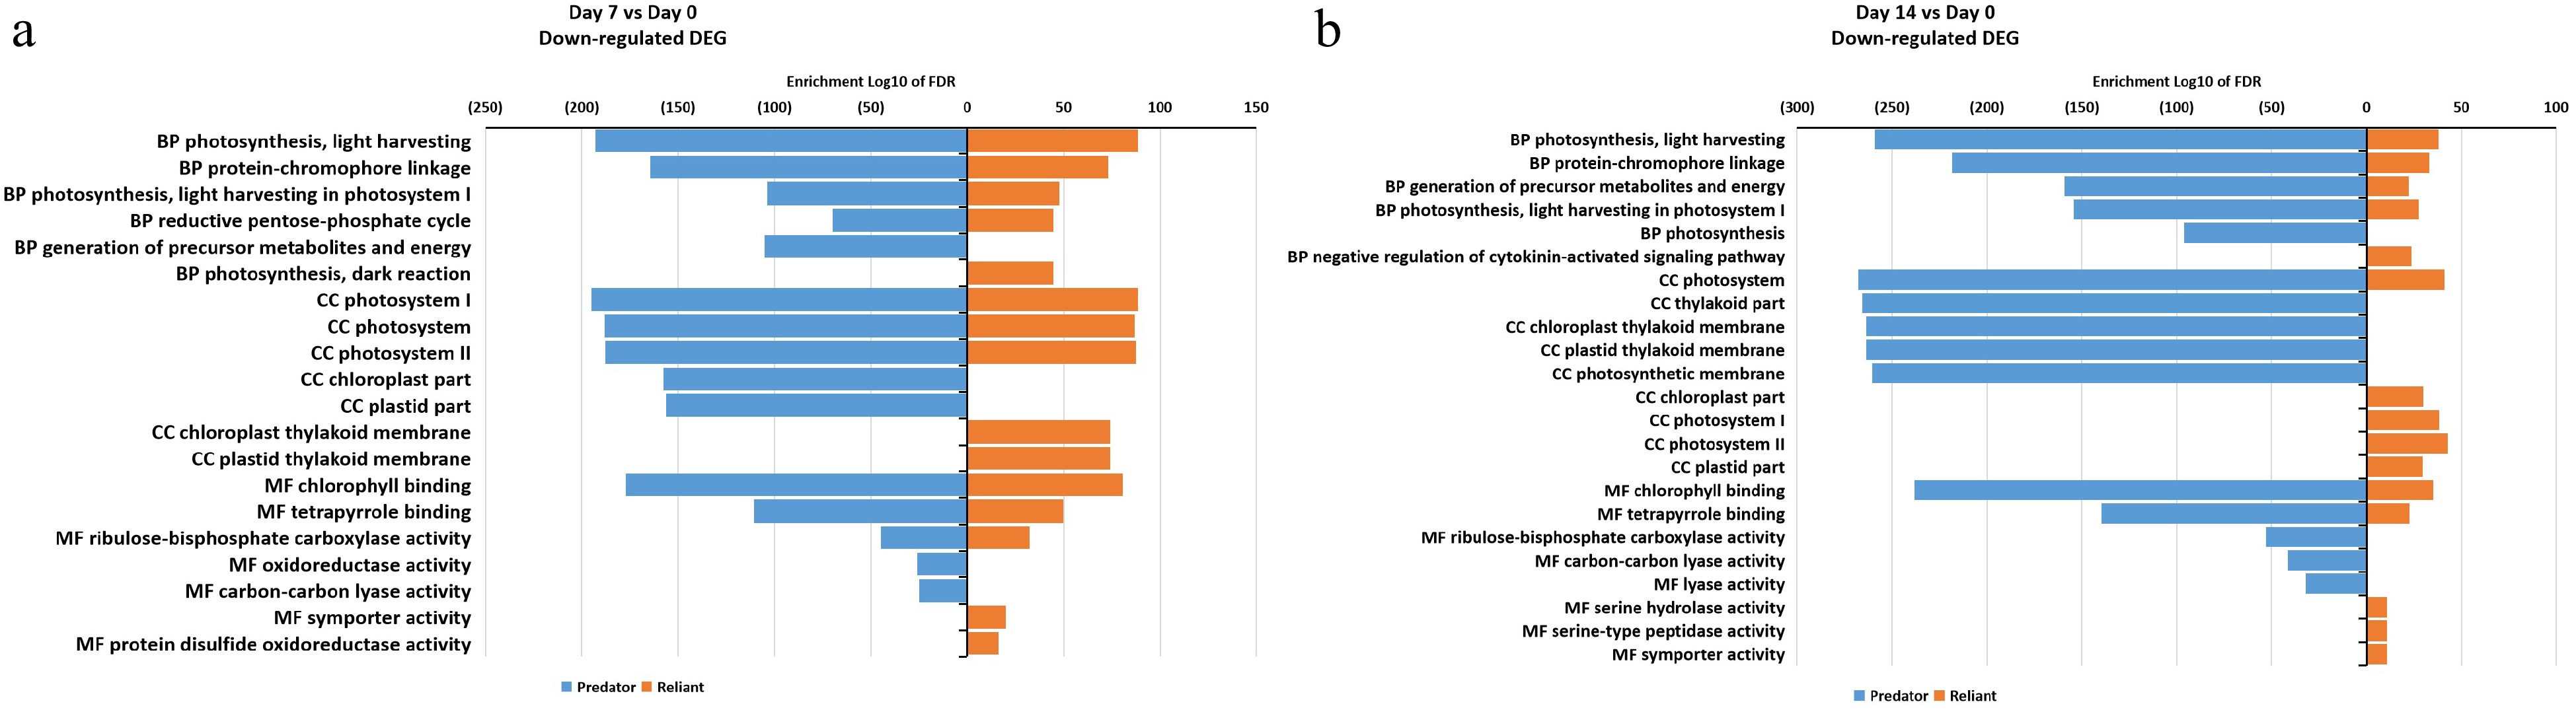
Figure 6. Gene ontology (GO) enrichment analysis of DEGs that were down-regulated at (a) 7 d of heat stress and (b) 14 d of heat stress in 'Predator' and 'Reliant IV'.
-
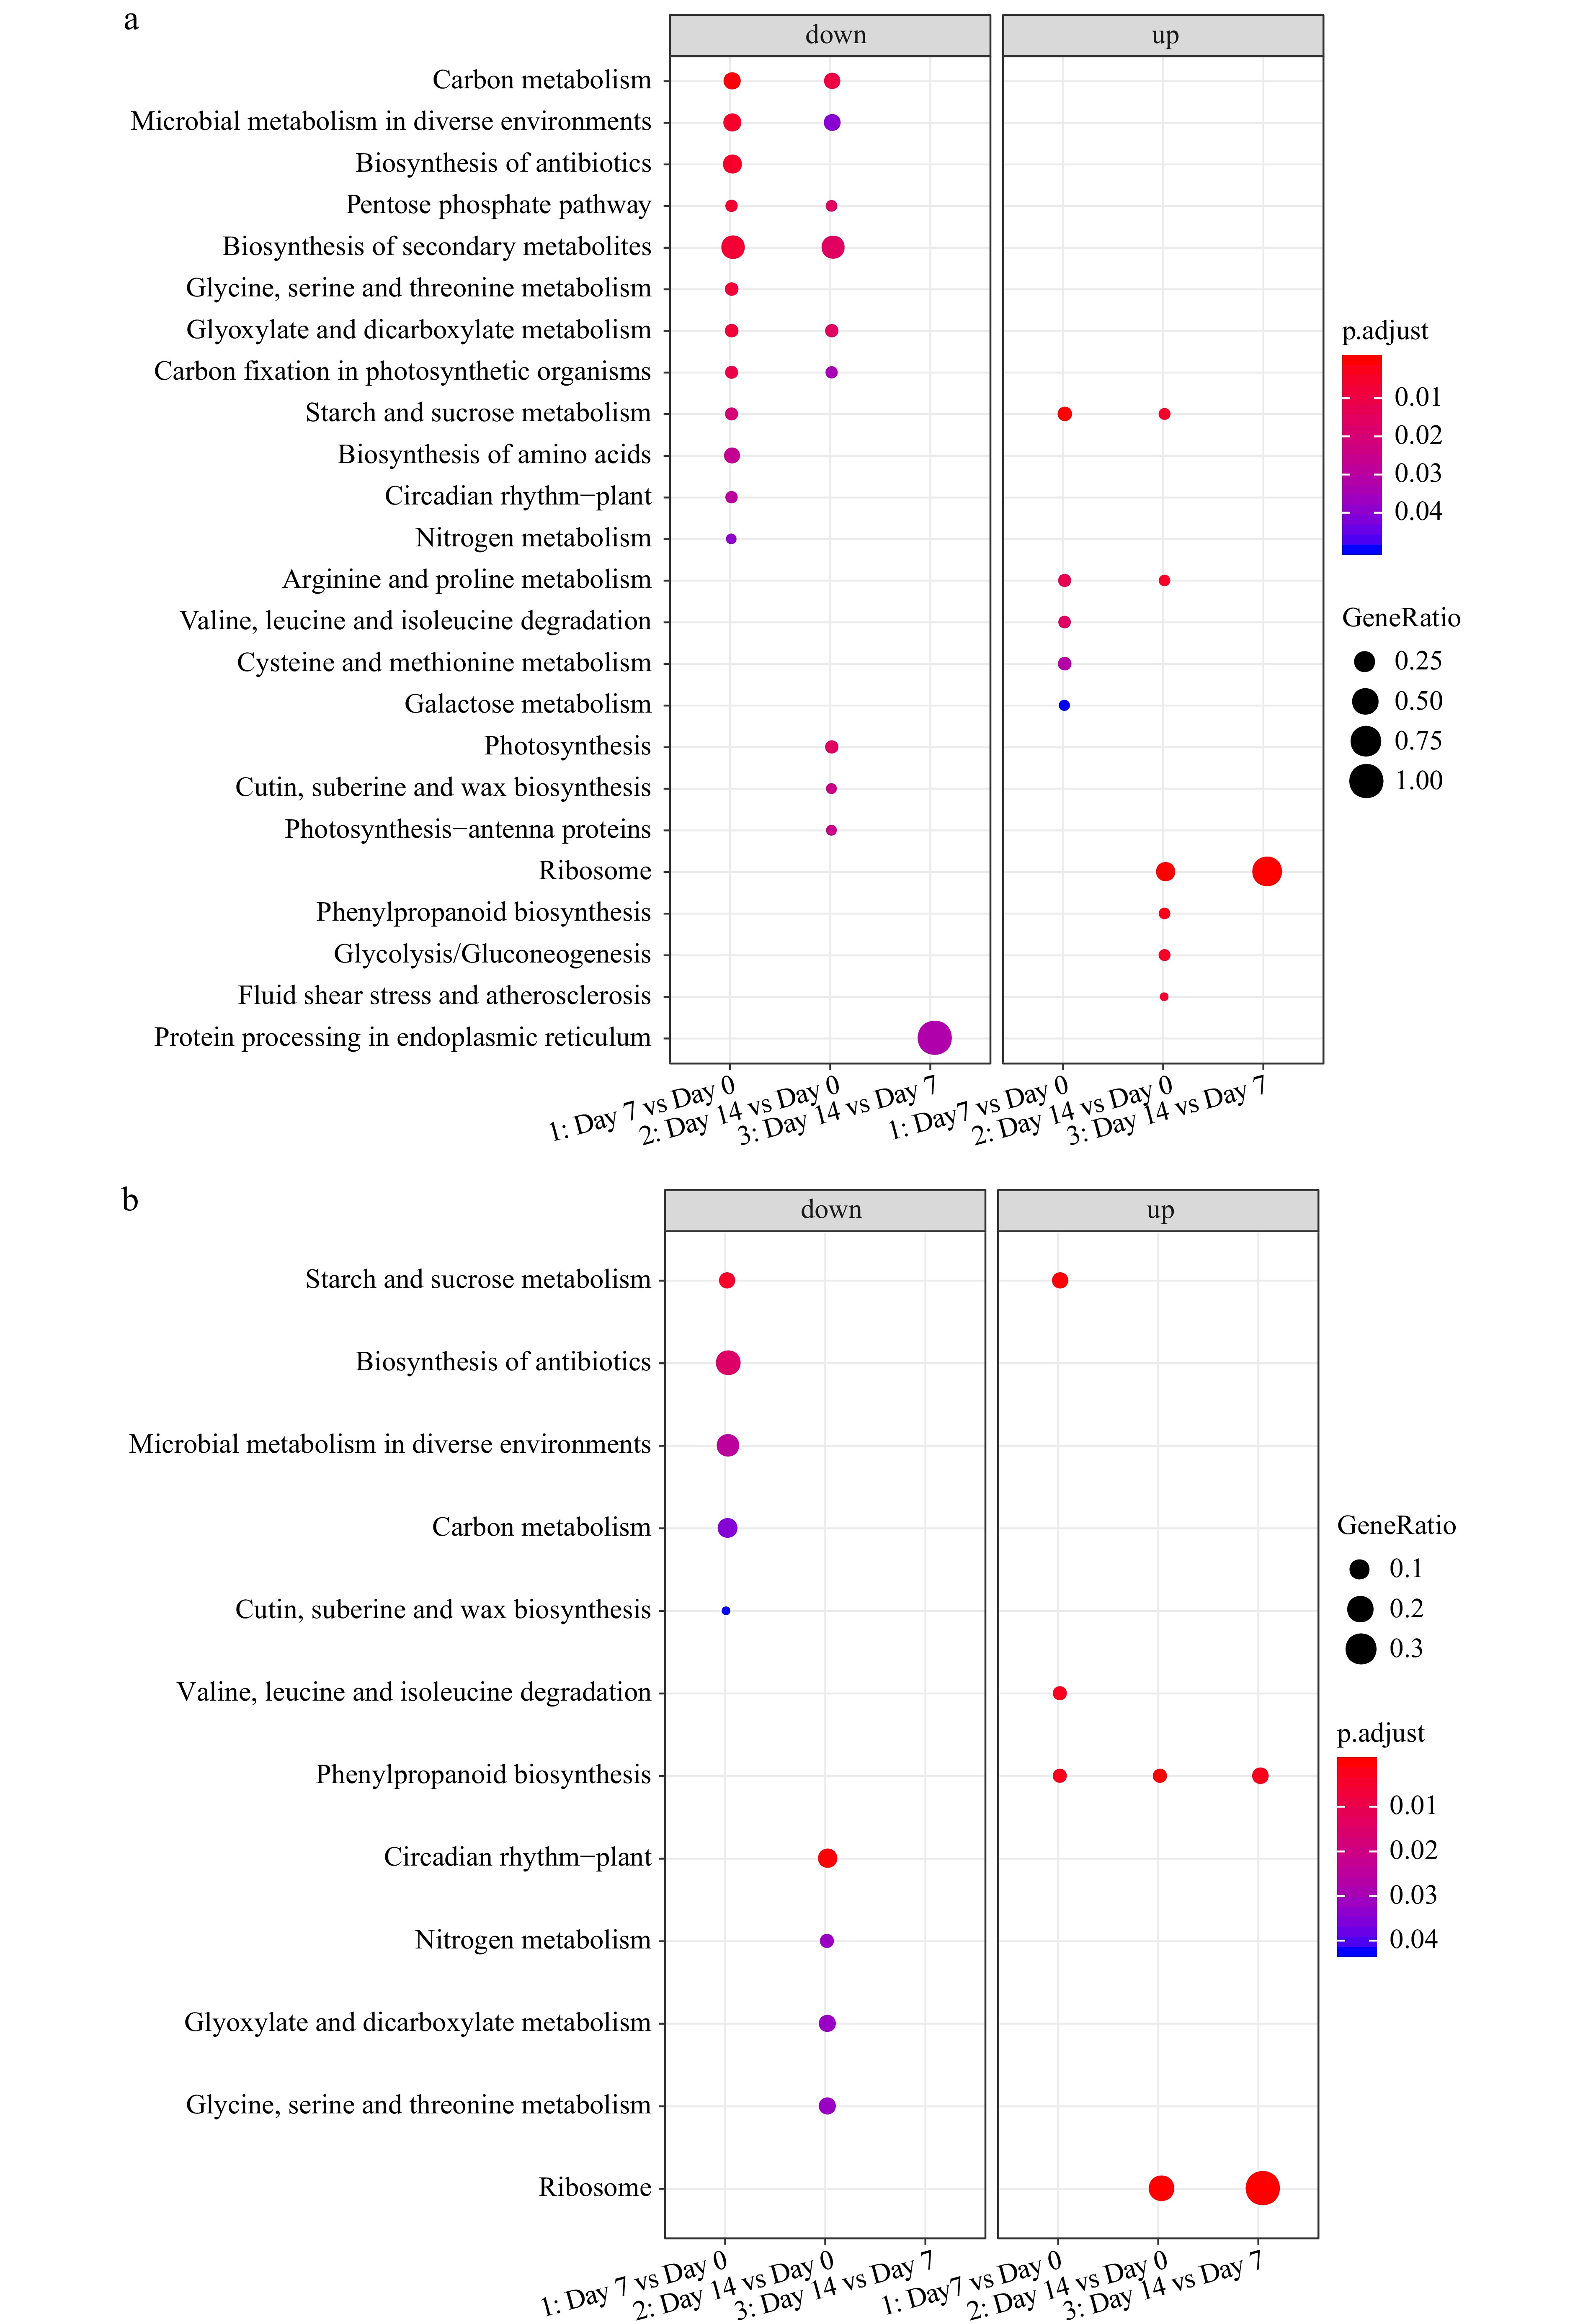
Figure 7. KEGG enrichment analysis of DEGs for (a) 'Predator' and (b) 'Reliant IV' at 7 and 14 d of heat stress in comparison to 0 d of heat stress.
-
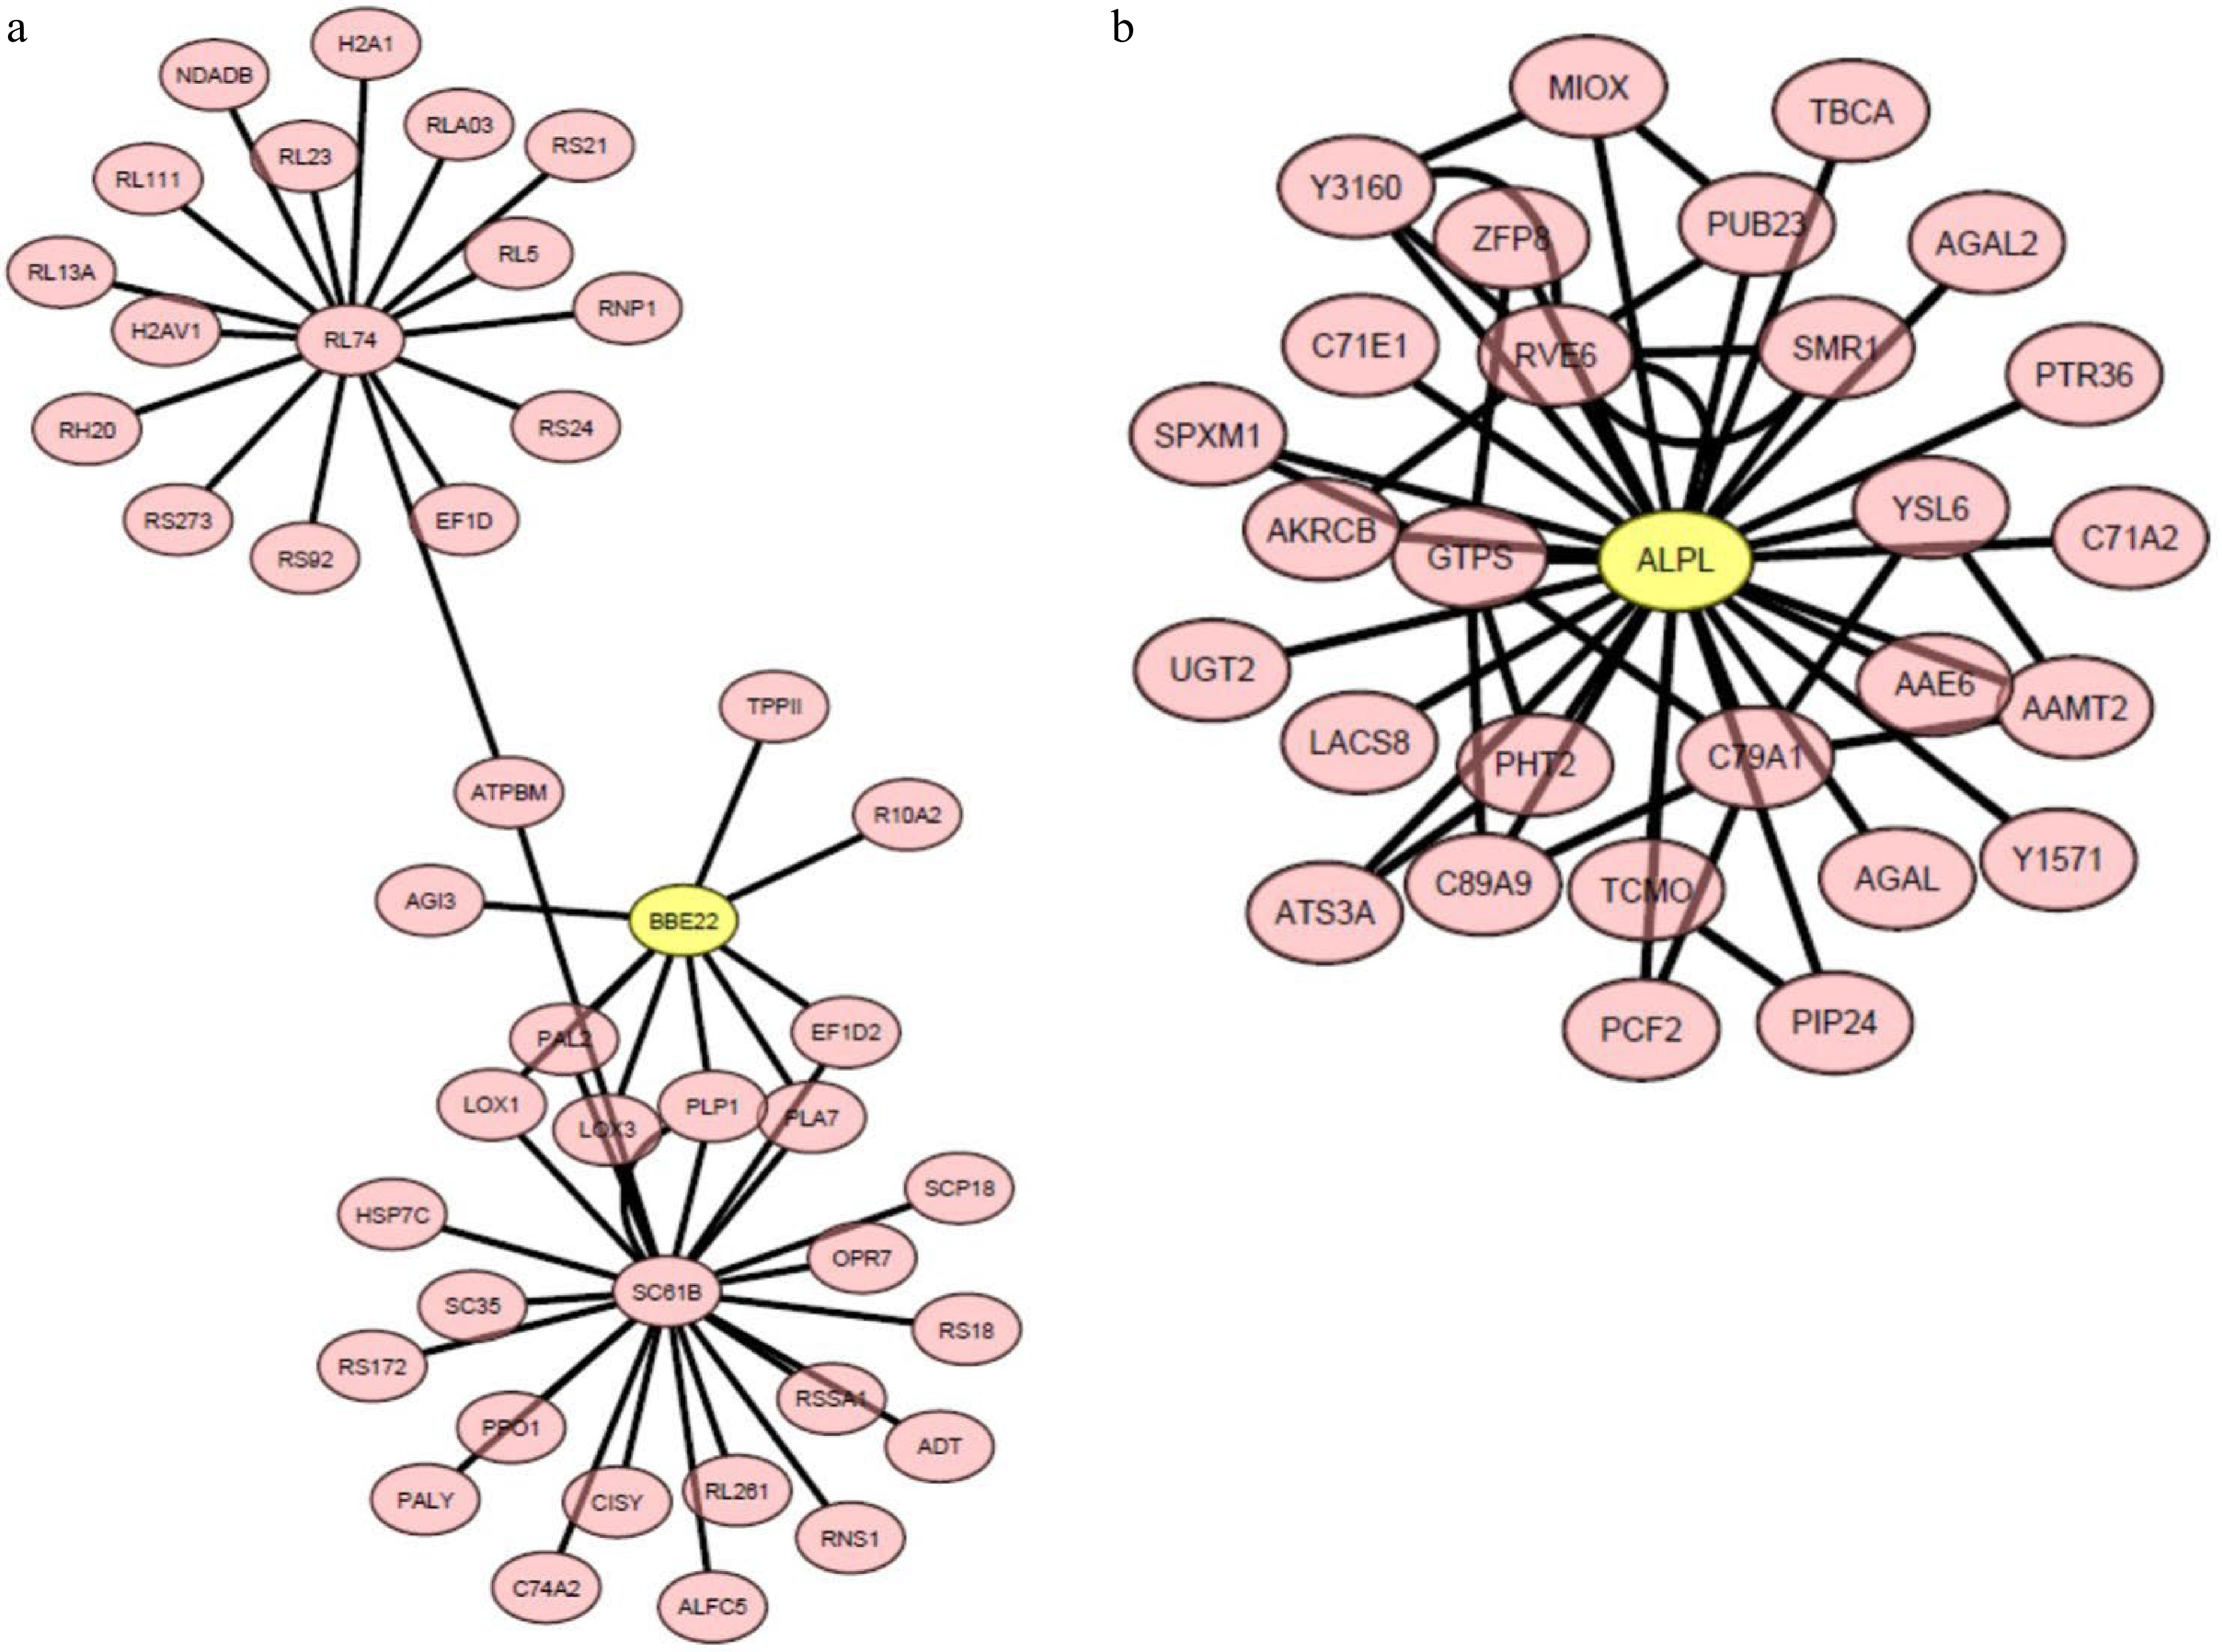
Figure 8. The heat-upregulated central hub genes and the connecting genes in module (a) MElightcyan and (b) MEdarkmagenta in 'Reliant IV' exposed to 7 and 14 d of heat stress. The genes in the yellow circles represent central hub genes.
Figures
(8)
Tables
(0)