-
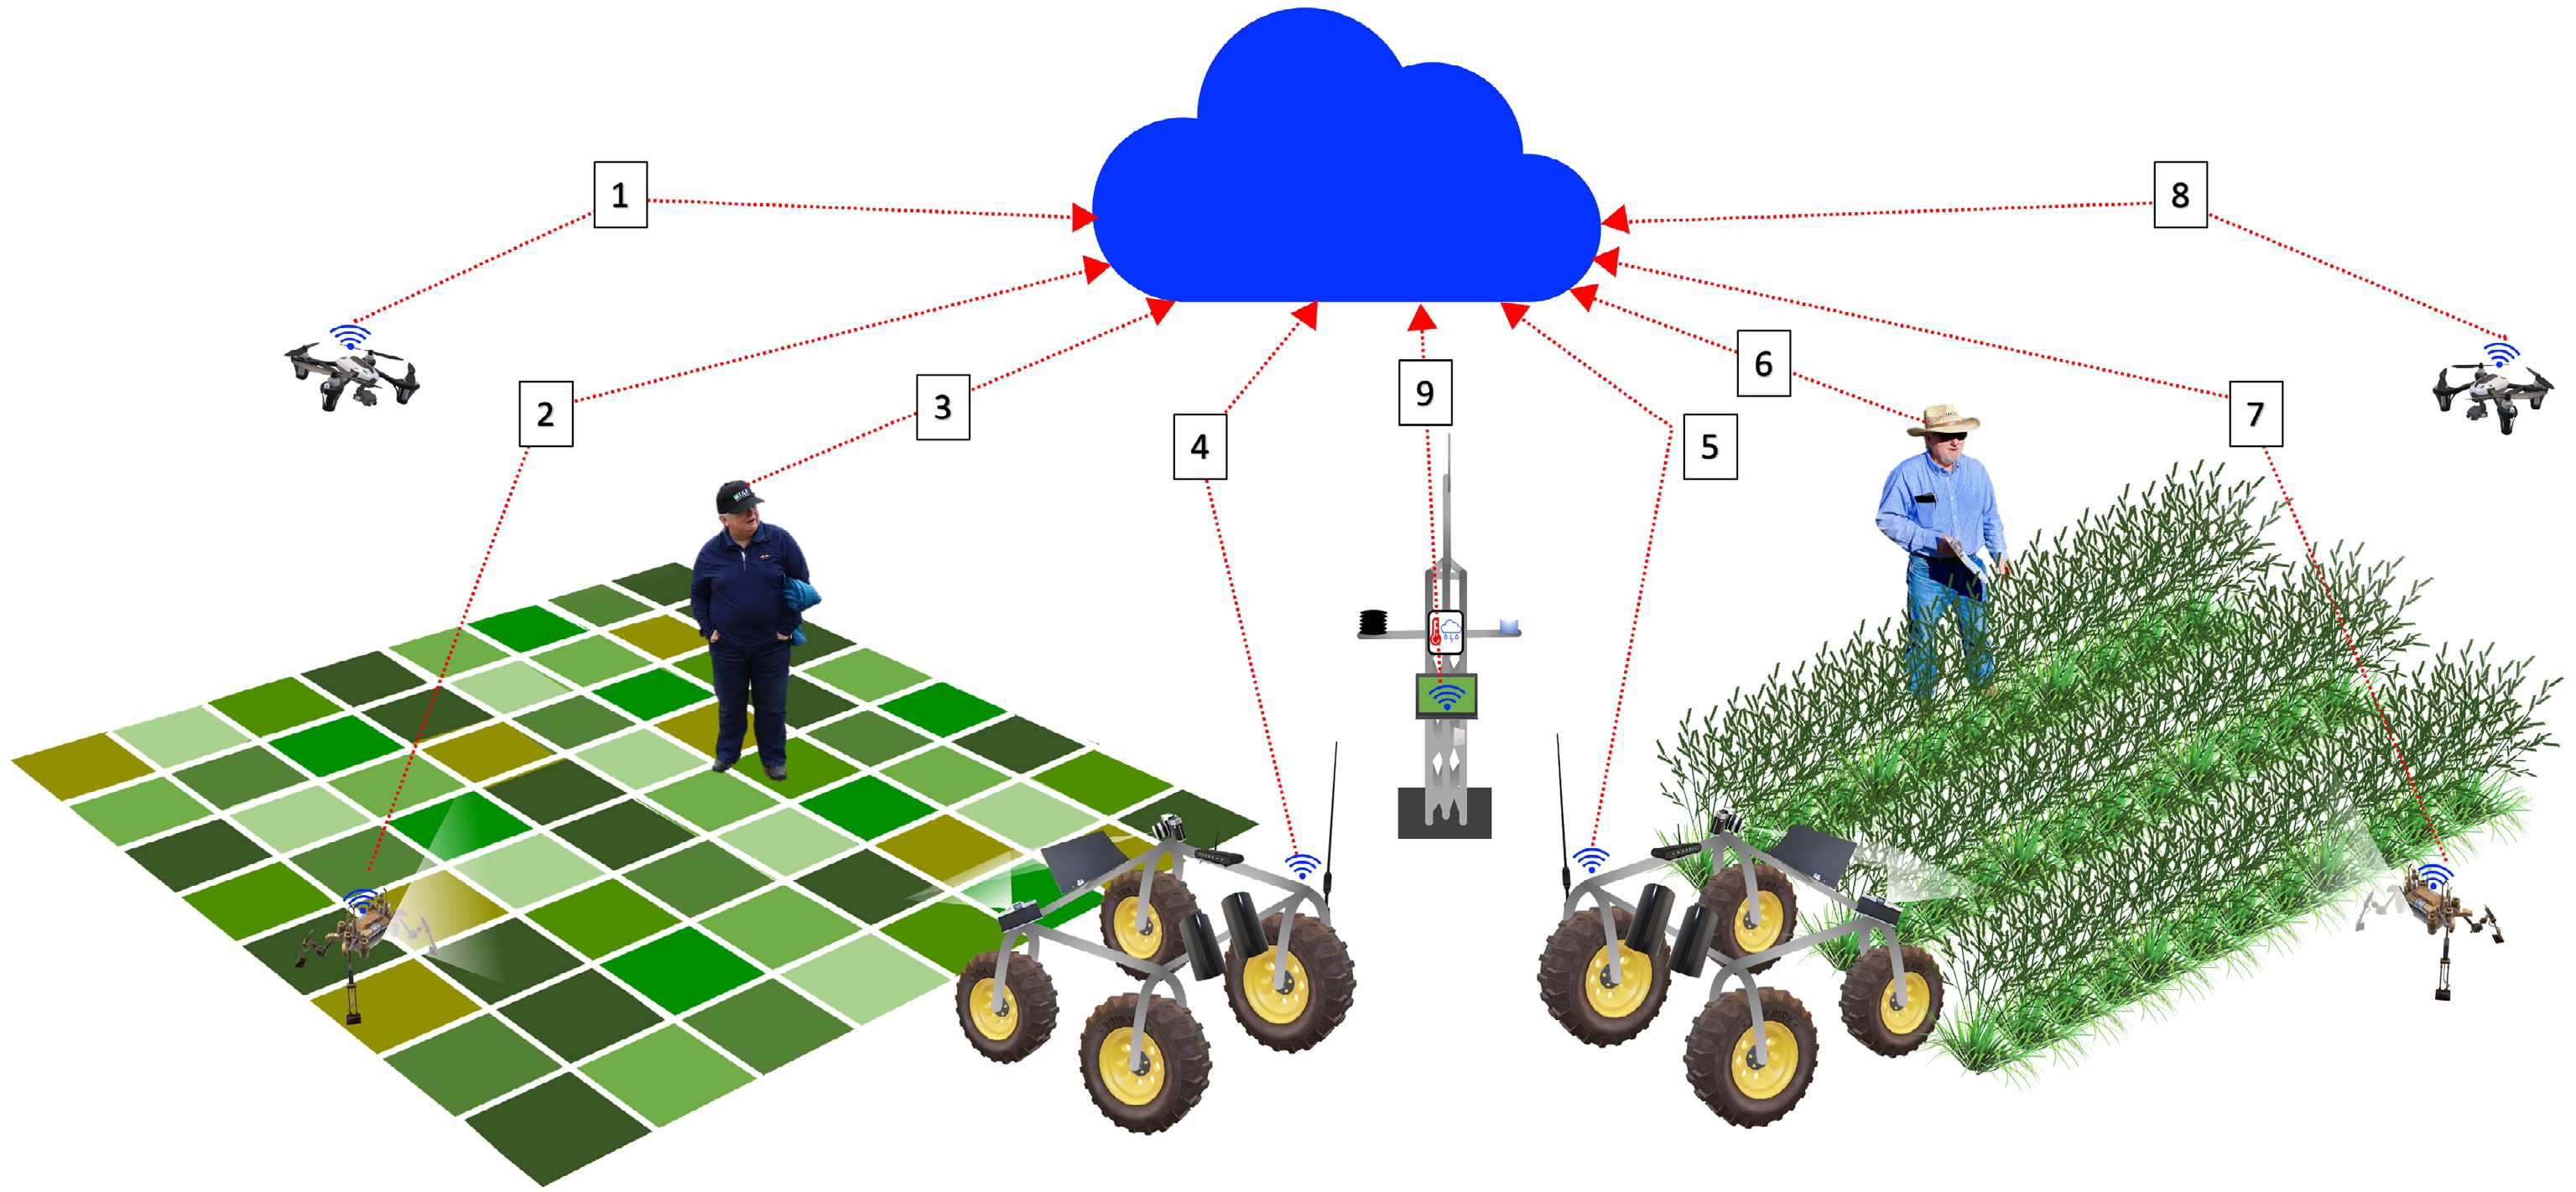
Figure 1.
Overview of high-throughput phenotyping tools for modern turfgrass breeding programs. 1: UAS for remote sensing data collection on mowed turf plot trials; 2: ground robot for proximal sensing data collection on mowed turf plot trials; 3: turfgrass breeder for visual assessment and oversight of various data collection practices on mowed turf plot trials; 4: ground vehicle for proximal sensing data collection on mowed turf plot trials; 5: ground vehicle for proximal sensing data collection on turfgrass nursery trials; 6: turfgrass breeder for visual assessment and oversight of various data collection practices on turfgrass nursery trials; 7: ground robot for proximal sensing data collection on turfgrass nursery trials; 8: UAS for remote sensing data collection on turfgrass nursery trial; 9: weather station for environmental data collection. All data is stored and processed via cloud computing services.
-
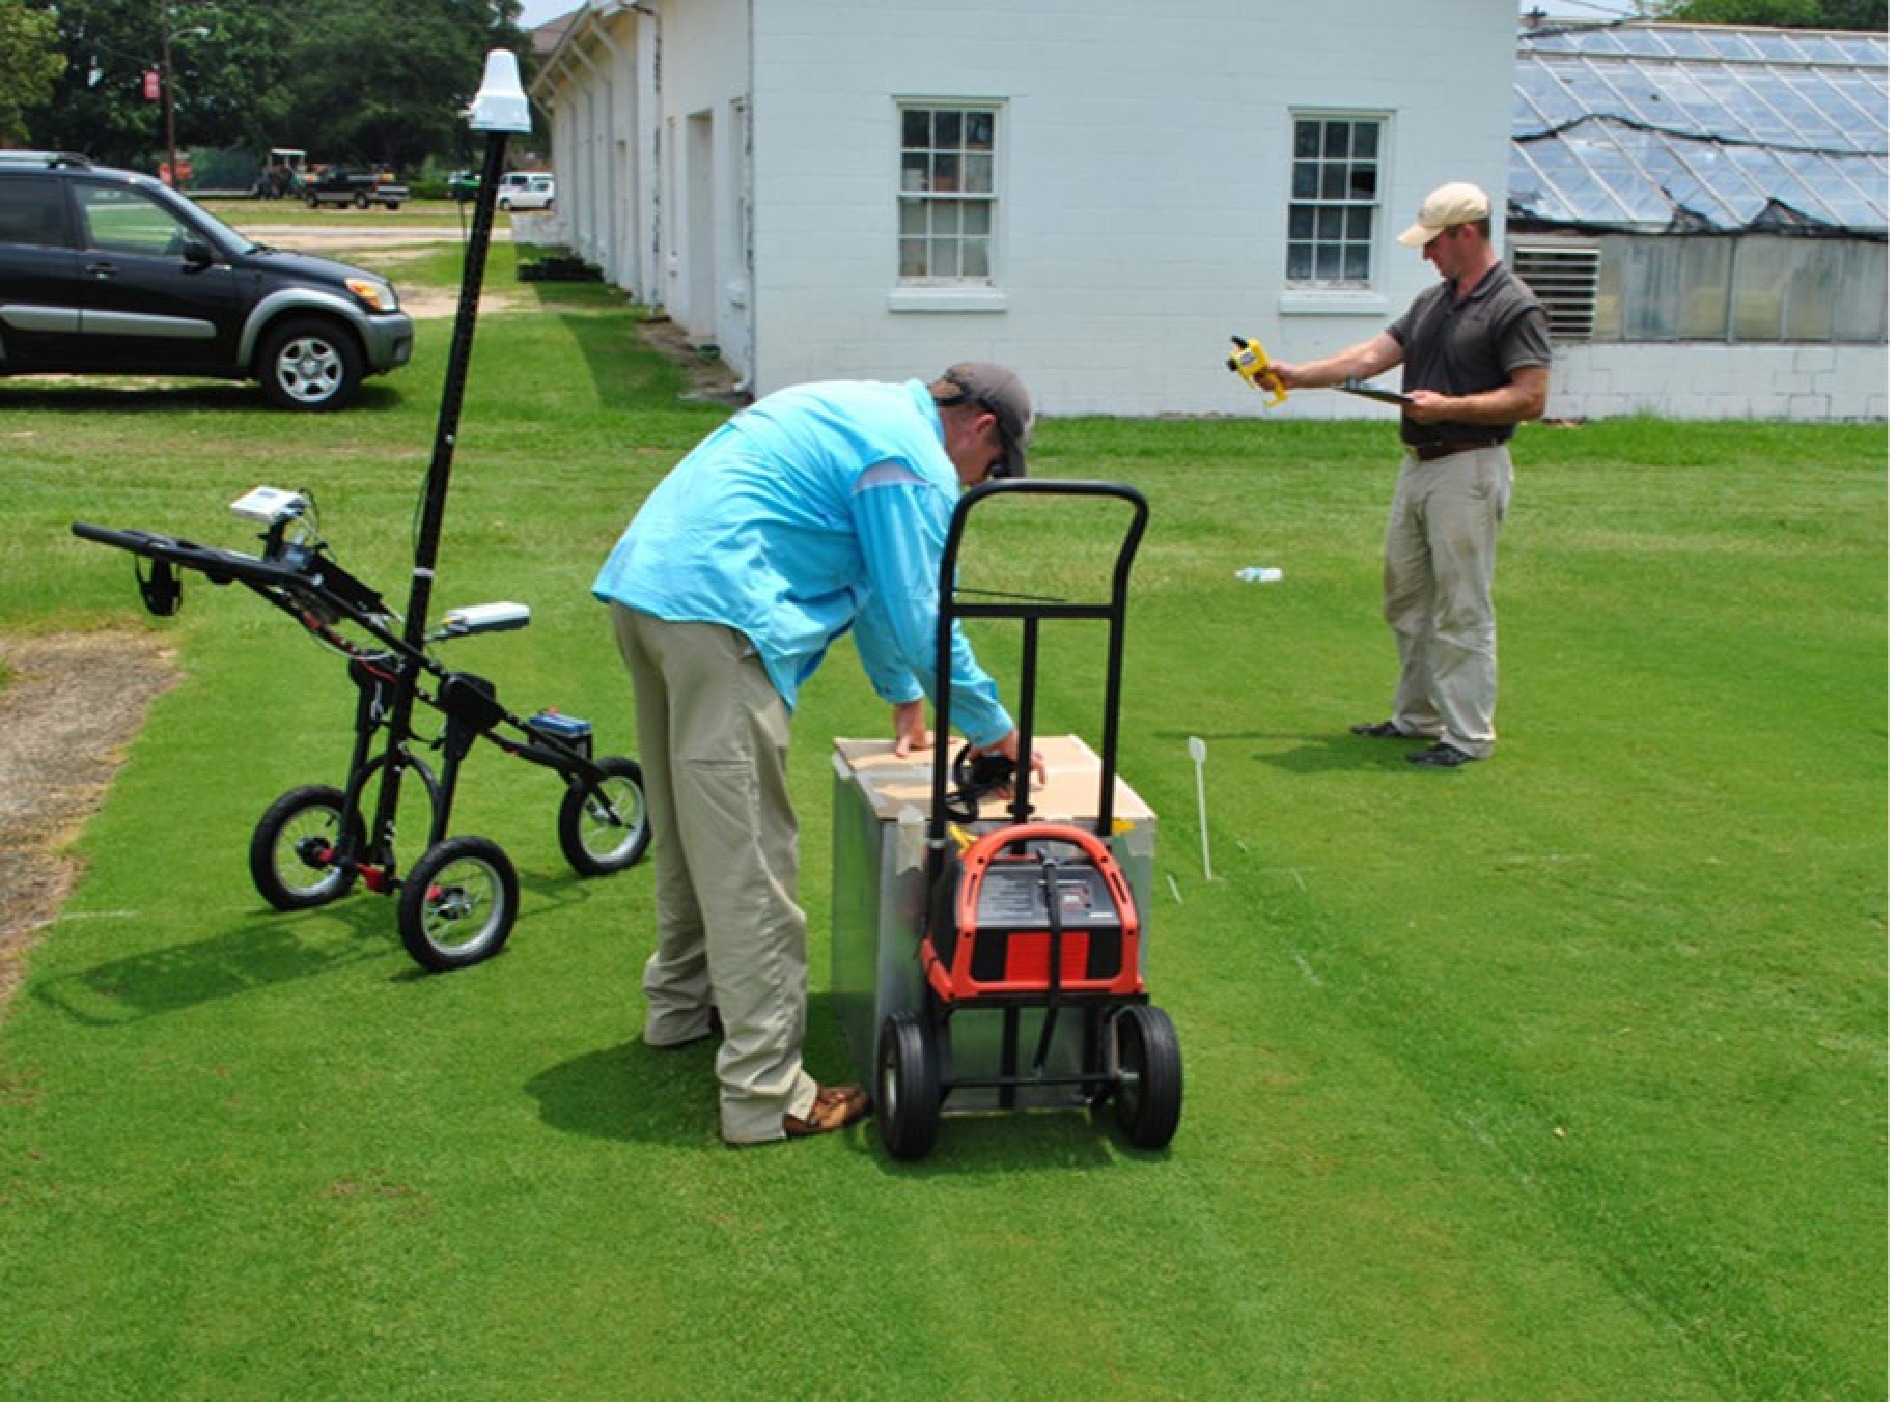
Figure 2.
Examples of ground-based phenotyping devices used in turfgrass breeding and research. Left: pushcart with multispectral sensor; middle: light box with digital camera; right: hand-held NDVI meter. (Photo credit: Brian Schwartz).
-
-

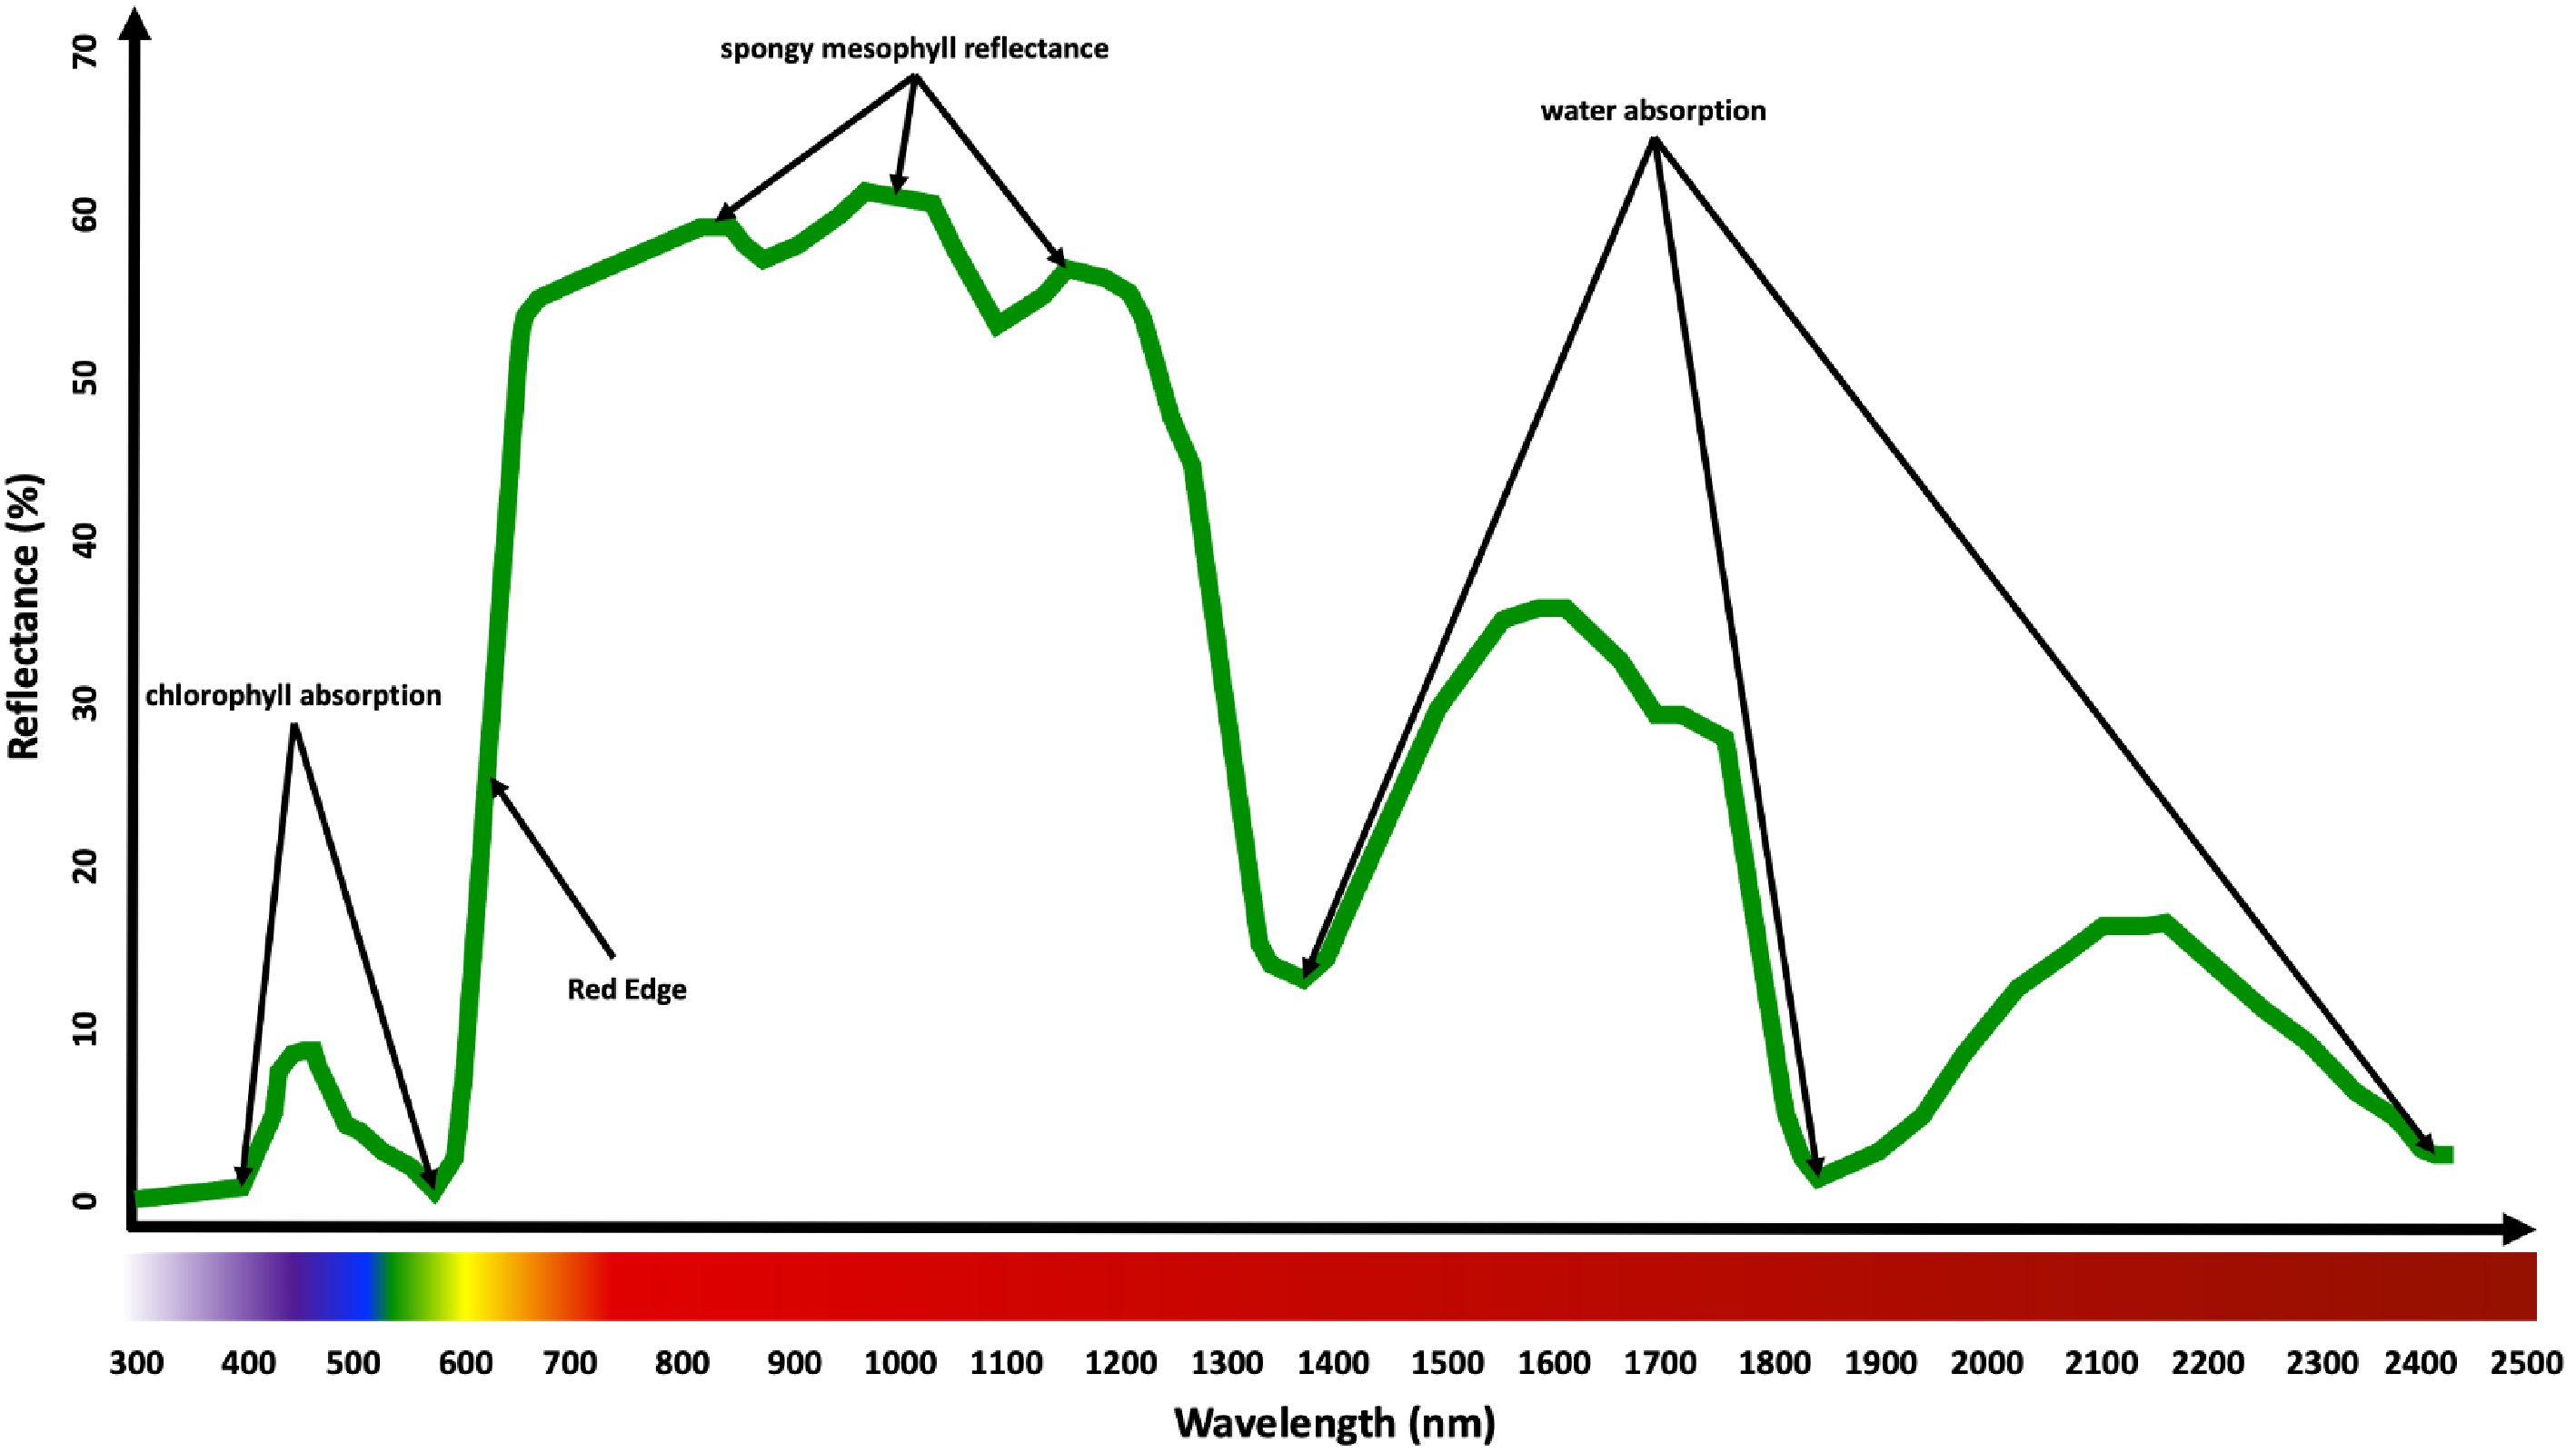
Figure 4.
Light wavelengths along the electromagnetic spectrum captured by various optical sensors. Visible light imaging sensors for 400 nm to 700 nm, spectral imaging sensors for 400 nm to 2,500 nm, and infrared thermal imaging sensors for 7,500 nm to 13,000 nm[17].
-
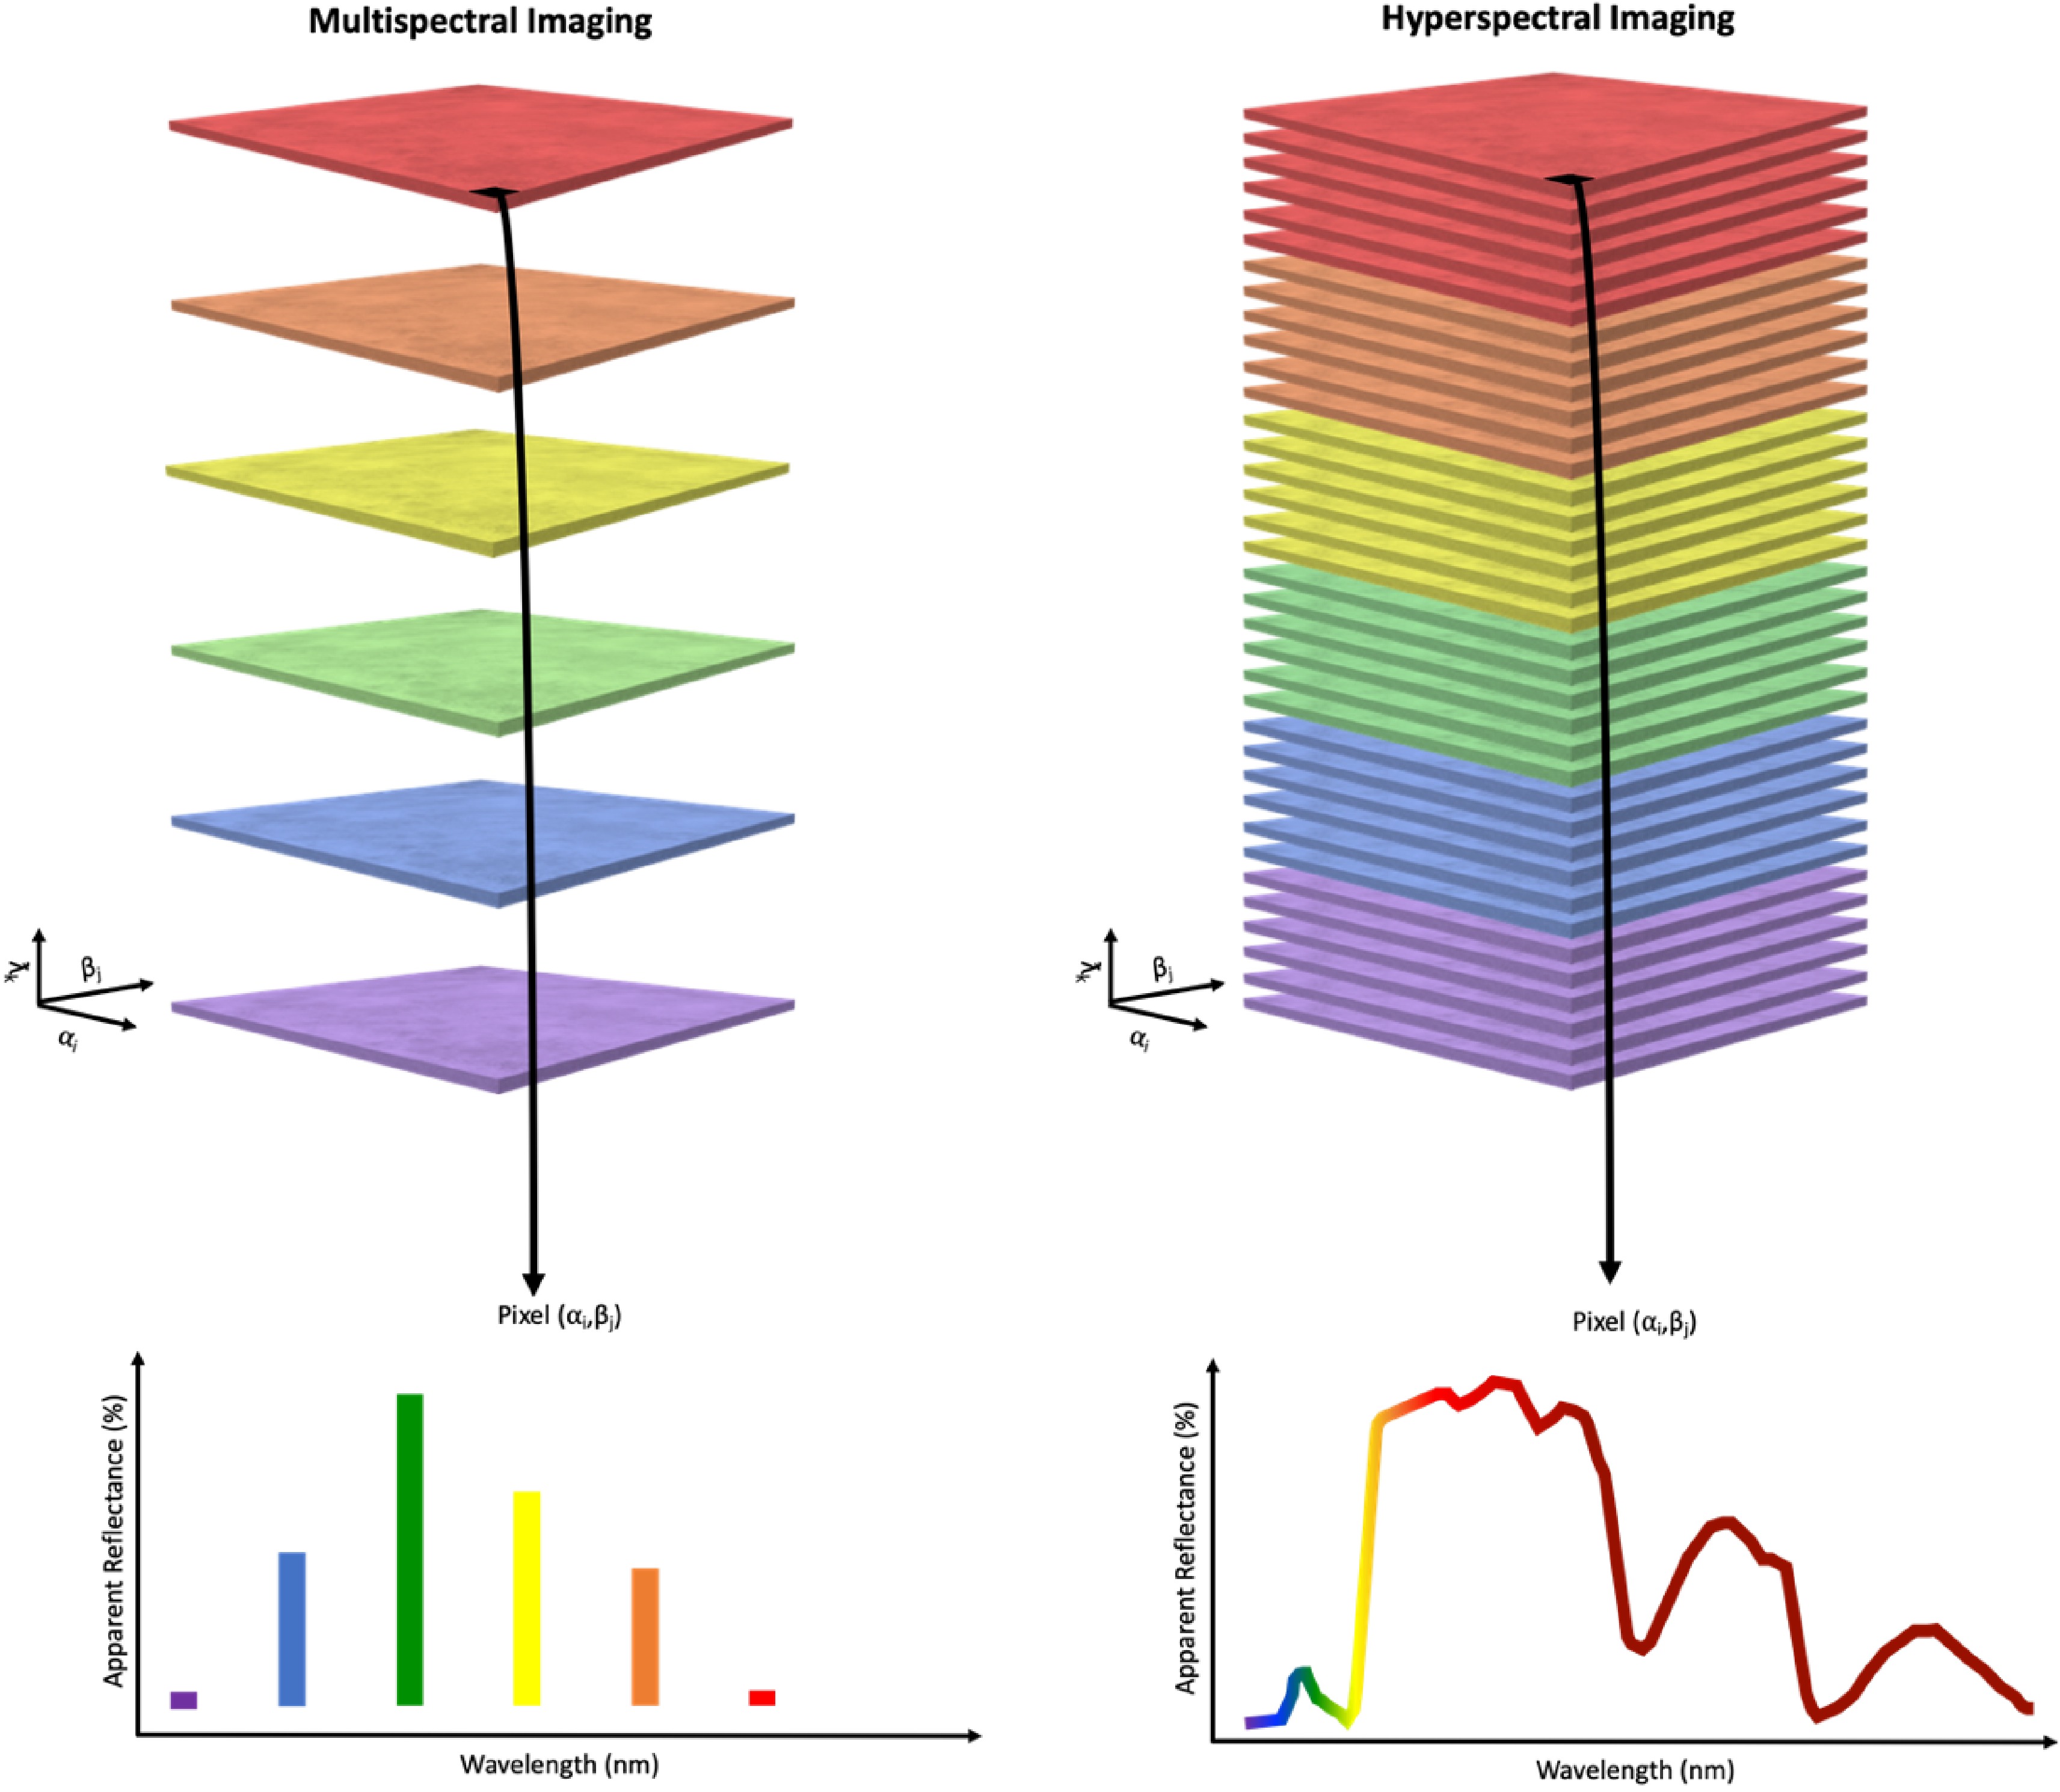
Figure 5.
Comparison of multispectral imaging and hyperspectral imaging. Discrete light reflectance data is generated from multispectral sensors whereas continuous light reflectance data is generated from hyperspectral sensors[170].
-
Index Formula Reference Canopy-Air Temperature Difference (CATD) TL – TA [162] Canopy Temperature Variability (CTV) σTC [163] Crop Water Stress Index (CWSI) $ \dfrac{\left(\mathrm{T}\mathrm{C}-\mathrm{T}\mathrm{A}\right)-\left(TC-TA\right)ll}{(TC-TA)ul-(TC-TA)ll} $ 

[164] Dark Green Color Index (DGCI) $ \dfrac{\left(\dfrac{\mathrm{H}\mathrm{u}\mathrm{e}-60}{60+\left(1-\mathrm{S}\mathrm{a}\mathrm{t}\mathrm{u}\mathrm{r}\mathrm{a}\mathrm{t}\mathrm{i}\mathrm{o}\mathrm{n}\right)+(1-\mathrm{B}\mathrm{r}\mathrm{i}\mathrm{g}\mathrm{h}\mathrm{t}\mathrm{n}\mathrm{e}\mathrm{s}\mathrm{s})}\right)}{3} $ 

[61] Difference Vegetation Index (DVI) Near Infrared − Red [108] Enhanced Vegetation Index (EVI) $ 2.5\dfrac{\mathrm{N}\mathrm{e}\mathrm{a}\mathrm{r}\;\mathrm{I}\mathrm{n}\mathrm{f}\mathrm{r}\mathrm{a}\mathrm{r}\mathrm{e}\mathrm{d}-\mathrm{R}\mathrm{e}\mathrm{d}}{\mathrm{N}\mathrm{e}\mathrm{a}\mathrm{r}\;\mathrm{I}\mathrm{n}\mathrm{f}\mathrm{r}\mathrm{a}\mathrm{r}\mathrm{e}\mathrm{d}\;+\left(6\mathrm{R}\mathrm{e}\mathrm{d}\right)-\left(7.5\mathrm{B}\mathrm{l}\mathrm{u}\mathrm{e}\right)+1} $ 

[110] Excess Green Index (ExG) 2Green – Red – Blue [165] Green Chlorophyll Index (GCI) $ \dfrac{\mathrm{N}\mathrm{e}\mathrm{a}\mathrm{r}\;\mathrm{I}\mathrm{n}\mathrm{f}\mathrm{r}\mathrm{a}\mathrm{r}\mathrm{e}\mathrm{d}}{\mathrm{G}\mathrm{r}\mathrm{e}\mathrm{e}\mathrm{n}}-1 $ 

[111] Green Difference Vegetation Index (GDVI) Near Infrared – Green [113] Green Index (GI) $ \dfrac{\mathrm{G}\mathrm{r}\mathrm{e}\mathrm{e}\mathrm{n}}{\mathrm{R}\mathrm{e}\mathrm{d}} $ 

[166] Green Leaf Index (GLI) $ \dfrac{2\mathrm{G}\mathrm{r}\mathrm{e}\mathrm{e}\mathrm{n}-\mathrm{R}\mathrm{e}\mathrm{d}-\mathrm{B}\mathrm{l}\mathrm{u}\mathrm{e}}{2\mathrm{G}\mathrm{r}\mathrm{e}\mathrm{e}\mathrm{n}+\mathrm{R}\mathrm{e}\mathrm{d}+\mathrm{B}\mathrm{l}\mathrm{u}\mathrm{e}} $ 

[83] GreenBlue (GB) $ \dfrac{\mathrm{G}\mathrm{r}\mathrm{e}\mathrm{e}\mathrm{n}-\mathrm{B}\mathrm{l}\mathrm{u}\mathrm{e}}{\mathrm{G}\mathrm{r}\mathrm{e}\mathrm{e}\mathrm{n}+\mathrm{B}\mathrm{l}\mathrm{u}\mathrm{e}} $ 

[85] Normalized Difference Index (NDI) $ \dfrac{\mathrm{G}\mathrm{r}\mathrm{e}\mathrm{e}\mathrm{n}-\mathrm{R}\mathrm{e}\mathrm{d}}{\mathrm{G}\mathrm{r}\mathrm{e}\mathrm{e}\mathrm{n}+\mathrm{R}\mathrm{e}\mathrm{d}} $ 

[167] Normalized Difference Red Edge (NDRE) $ \dfrac{\mathrm{N}\mathrm{e}\mathrm{a}\mathrm{r}\;\mathrm{I}\mathrm{n}\mathrm{f}\mathrm{r}\mathrm{a}\mathrm{r}\mathrm{e}\mathrm{d}-\mathrm{R}\mathrm{e}\mathrm{d}\;\mathrm{E}\mathrm{d}\mathrm{g}\mathrm{e}}{\mathrm{N}\mathrm{e}\mathrm{a}\mathrm{r}\;\mathrm{I}\mathrm{n}\mathrm{f}\mathrm{r}\mathrm{a}\mathrm{r}\mathrm{e}\mathrm{d}+\mathrm{R}\mathrm{e}\mathrm{d}\;\mathrm{E}\mathrm{d}\mathrm{g}\mathrm{e}} $ 

[112] Normalized Difference Vegetation Index (NDVI) $ \dfrac{\mathrm{N}\mathrm{e}\mathrm{a}\mathrm{r}\;\mathrm{I}\mathrm{n}\mathrm{f}\mathrm{r}\mathrm{a}\mathrm{r}\mathrm{e}\mathrm{d}-\mathrm{R}\mathrm{e}\mathrm{d}}{\mathrm{N}\mathrm{e}\mathrm{a}\mathrm{r}\;\mathrm{I}\mathrm{n}\mathrm{f}\mathrm{r}\mathrm{a}\mathrm{r}\mathrm{e}\mathrm{d}+\mathrm{R}\mathrm{e}\mathrm{d}} $ 

[106] Optimized Soil Adjusted Vegetation Index (OSAVI) $ \dfrac{\mathrm{N}\mathrm{e}\mathrm{a}\mathrm{r}\;\mathrm{I}\mathrm{n}\mathrm{f}\mathrm{r}\mathrm{a}\mathrm{r}\mathrm{e}\mathrm{d}-\mathrm{R}\mathrm{e}\mathrm{d}}{\mathrm{N}\mathrm{e}\mathrm{a}\mathrm{r}\;\mathrm{I}\mathrm{n}\mathrm{f}\mathrm{r}\mathrm{a}\mathrm{r}\mathrm{e}\mathrm{d}+\mathrm{R}\mathrm{e}\mathrm{d}+0.16} $ 

[109] Ratio Vegetation Index (RVI) $ \dfrac{\mathrm{R}\mathrm{e}\mathrm{d}}{\mathrm{N}\mathrm{e}\mathrm{a}\mathrm{r}\;\mathrm{I}\mathrm{n}\mathrm{f}\mathrm{r}\mathrm{a}\mathrm{r}\mathrm{e}\mathrm{d}} $ 

[104] Simple Ratio (SR) $ \dfrac{\mathrm{N}\mathrm{e}\mathrm{a}\mathrm{r}\;\mathrm{I}\mathrm{n}\mathrm{f}\mathrm{r}\mathrm{a}\mathrm{r}\mathrm{e}\mathrm{d}}{\mathrm{R}\mathrm{e}\mathrm{d}} $ 

[105] Temperature Stress Day (TSD) Tstress – Tnon-stress [168] Transformed Vegetation Index (TVI) $ \dfrac{\mathrm{N}\mathrm{e}\mathrm{a}\mathrm{r}\;\mathrm{I}\mathrm{n}\mathrm{f}\mathrm{r}\mathrm{a}\mathrm{r}\mathrm{e}\mathrm{d}-\mathrm{R}\mathrm{e}\mathrm{d}}{\mathrm{N}\mathrm{e}\mathrm{a}\mathrm{r}\;\mathrm{I}\mathrm{n}\mathrm{f}\mathrm{r}\mathrm{a}\mathrm{r}\mathrm{e}\mathrm{d}+\mathrm{R}\mathrm{e}\mathrm{d}} $ 

[107] Visible atmospherically resistant index (VARI) $ \dfrac{\mathrm{G}\mathrm{r}\mathrm{e}\mathrm{e}\mathrm{n}-\mathrm{R}\mathrm{e}\mathrm{d}}{\mathrm{G}\mathrm{r}\mathrm{e}\mathrm{e}\mathrm{n}+\mathrm{R}\mathrm{e}\mathrm{d}-\mathrm{B}\mathrm{l}\mathrm{u}\mathrm{e}} $ 

[84] Table 1.
Color, temperature, and vegetation indices used in plant remote sensing research and breeding applications.
Figures
(5)
Tables
(1)