


-
Turfgrasses are utilized throughout inhabited regions of the world for home lawns, athletic field and golf course turf, parks and recreational areas, and roadside vegetation[1]. In addition, turfgrass seed and sod production contribute to the significant economic, ecological, and environmental values of the turf industry[2]. It is estimated that maintained turfgrass in the U.S. covers approximately 20 million hectares of managed land[3]. The annual economic value of the turfgrass industry is approximately $60 billion, making a large contribution to the national economy[4]. The value of turfgrass continues to grow due to strong demand for use in landscape, recreation, and sports areas, as well as environmental and aesthetic benefits of turfgrasses such as moderating temperatures, preventing soil erosion, reducing noise and air pollution, and increasing property values[1,5].
Extensive efforts in turfgrass breeding have resulted in persistent, attractive varieties with improved turf quality characteristics, pests and stress tolerance, and reduced maintenance requirements[6]. Breeding objectives currently focus on improving tolerance to abiotic stress factors such as drought, heat, cold, and salinity and biotic stresses such as diseases and insects[7−10]. In addition, efforts are also aimed at developing grasses that will perform at high levels with limited inputs of fertility, irrigation, pesticides, and mowing[7−9]. Breeders of seed propagated species continue to focus on improving seed yield characteristics and identifying grasses with resistance to seed production diseases such as stem rust, caused by Puccinia graminis, while for sod propagated species, breeders focus on developing varieties with improved sod-forming ability[7−9]. In addition to the aforementioned objectives, breeders are working to maintain the high turf quality characteristics that have been bred into all major turfgrass species to date[9].
Modern breeding programs strive to incorporate advanced breeding strategies such as DNA sequencing and high-throughput phenotyping with traditional breeding strategies to identify and select germplasm and genes of interest[11−14]. In recent years, DNA sequencing and molecular biology methods have rapidly increased, and, as a result, plant phenotyping is currently a bottleneck in the process of advancing breeding programs[15−17]. Recent advances in remote sensing have offered improved, non-destructive plant phenotyping approaches[18−20]. These advancements have been coupled with improvements in robotics and unmanned aerial systems (UAS) technology to provide mobile, time efficient platforms for remote sensors that have contributed to high-throughput plant phenotyping applications across large fields (Fig. 1).
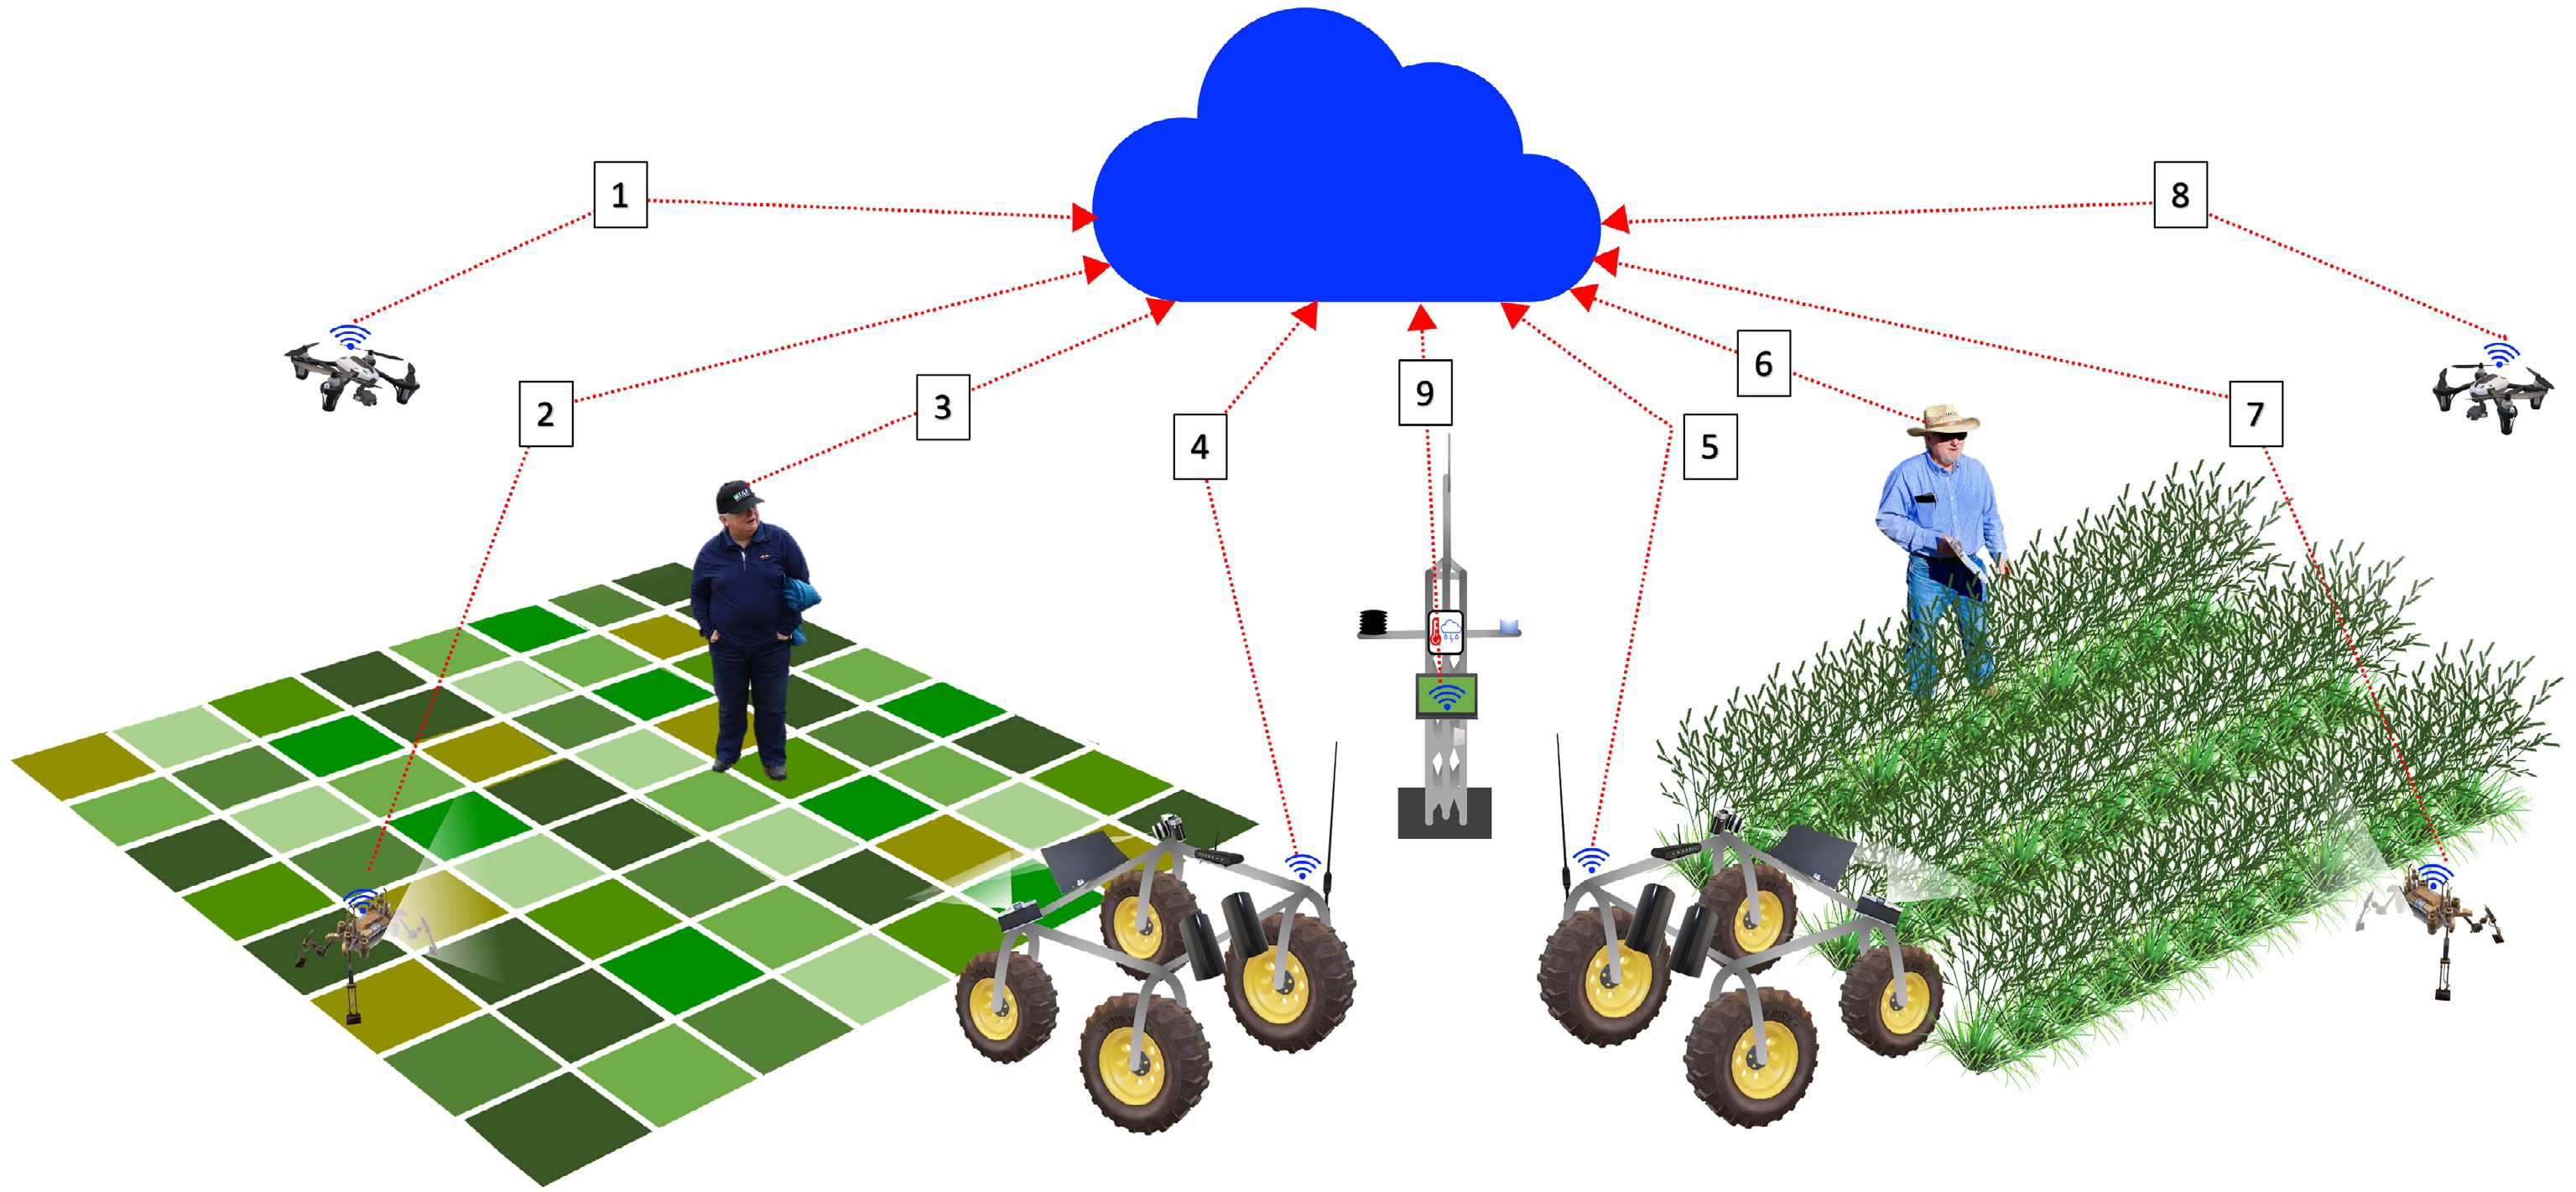
Figure 1.
Overview of high-throughput phenotyping tools for modern turfgrass breeding programs. 1: UAS for remote sensing data collection on mowed turf plot trials; 2: ground robot for proximal sensing data collection on mowed turf plot trials; 3: turfgrass breeder for visual assessment and oversight of various data collection practices on mowed turf plot trials; 4: ground vehicle for proximal sensing data collection on mowed turf plot trials; 5: ground vehicle for proximal sensing data collection on turfgrass nursery trials; 6: turfgrass breeder for visual assessment and oversight of various data collection practices on turfgrass nursery trials; 7: ground robot for proximal sensing data collection on turfgrass nursery trials; 8: UAS for remote sensing data collection on turfgrass nursery trial; 9: weather station for environmental data collection. All data is stored and processed via cloud computing services.
The use of ground- and aerial-based platforms and imaging technologies for high-throughput phenotyping applications have been thoroughly reviewed previously[13,16,17,19,21−26]. This review provides an overview of ground- and aerial-based plant phenotyping platforms, with particular emphasis placed on applications to turfgrass breeding practices. Similarly, imaging technologies that have been used in various plant breeding programs are discussed, with indications as to how those technologies could be applicable to turfgrass breeding programs.
-
A phenotype is the physical appearance of a plant; this includes complex traits related to architecture, growth, development, physiology, ecology, yield, and tolerance to abiotic and biotic stresses[23,27]. Plant phenotyping is the act of assessing phenotypic plant traits in order to rank or compare germplasm to identify elite lines for breeding purposes[28]. Traditionally, plant phenotyping has involved the use of manual and visual assessments, which are labor intensive, time consuming, and variable due to observational bias and preference[29]. These limitations, in light of genotyping advancements[30−32], have led to a phenotyping bottleneck in plant breeding programs[15, 33−36]. However, many breeding programs have combined efforts from biological science, computer science, mathematics, physics, data science, and statistics to develop more efficient phenotyping methods, which is an area of research commonly known as high-throughput plant phenotyping[37]. The high-throughput phenotyping approaches employed in breeding programs consist of both ground- and aerial-based platforms that are equipped with various remote sensors to efficiently collect quantitative and geospatial data across large geographic areas[38].
-
Ground-based plant phenotyping involves the assessment of plant phenotypes using proximal sensors, which are located close to the plants of interest[19]. For this application, sensors may be handheld or mounted on phenotyping platforms such as stationary towers, cable suspensions, and ground vehicles[39,40]. Handheld sensors are convenient to use but require long periods of time to phenotype large fields, which can result in significant environmental variation during the data collection process[23,24,41]. Moreover, data collection is not always consistent among different evaluators using handheld devices, and this adds systematic error to resulting datasets[42]. Another limitation of handheld sensors is that only one sensor may be used at a time, which does not provide the best solution for a high-throughput, time efficient means of plant phenotyping[23]. Stationary towers and cable suspensions are also acceptable for certain phenotyping applications, but their use is limited by aspects such as inability to cover large field areas and angle distortion issues that arise from having a single viewpoint and collecting data across large fields[22].
Several ground vehicle plant phenotyping platforms have been developed for various breeding applications in crops such as cotton (Gossypium barbadense L.)[43], maize (Zea mays L.)[44], triticale (× Triticosecale Wittmack L.)[45], and wheat (Triticum aestivum L.)[46,47]. These ground vehicle platforms range from simple pushcart designs to more sophisticated motor-driven buggies and are capable of accommodating multiple sensors and other data recording devices[43,45,46,48−50]. For turfgrass applications, there are different types of ground-based platforms with various sensors and cameras to be used in field phenotyping (Fig. 2). Researchers have demonstrated the usability of ground-based mobile platforms to accurately and precisely monitor characteristics such as soil moisture[51−53], turfgrass health[51−54], and turfgrass disease symptoms[54]. A major benefit of ground-based platforms is that they generate high spatial resolution data, which is required for plant science research and breeding programs. However, field-scale applications of these ground-based approaches are limited by the time to phenotype large areas and the fact that soil conditions immediately following irrigation or precipitation events can limit access to ground-based platforms[22−24,41].
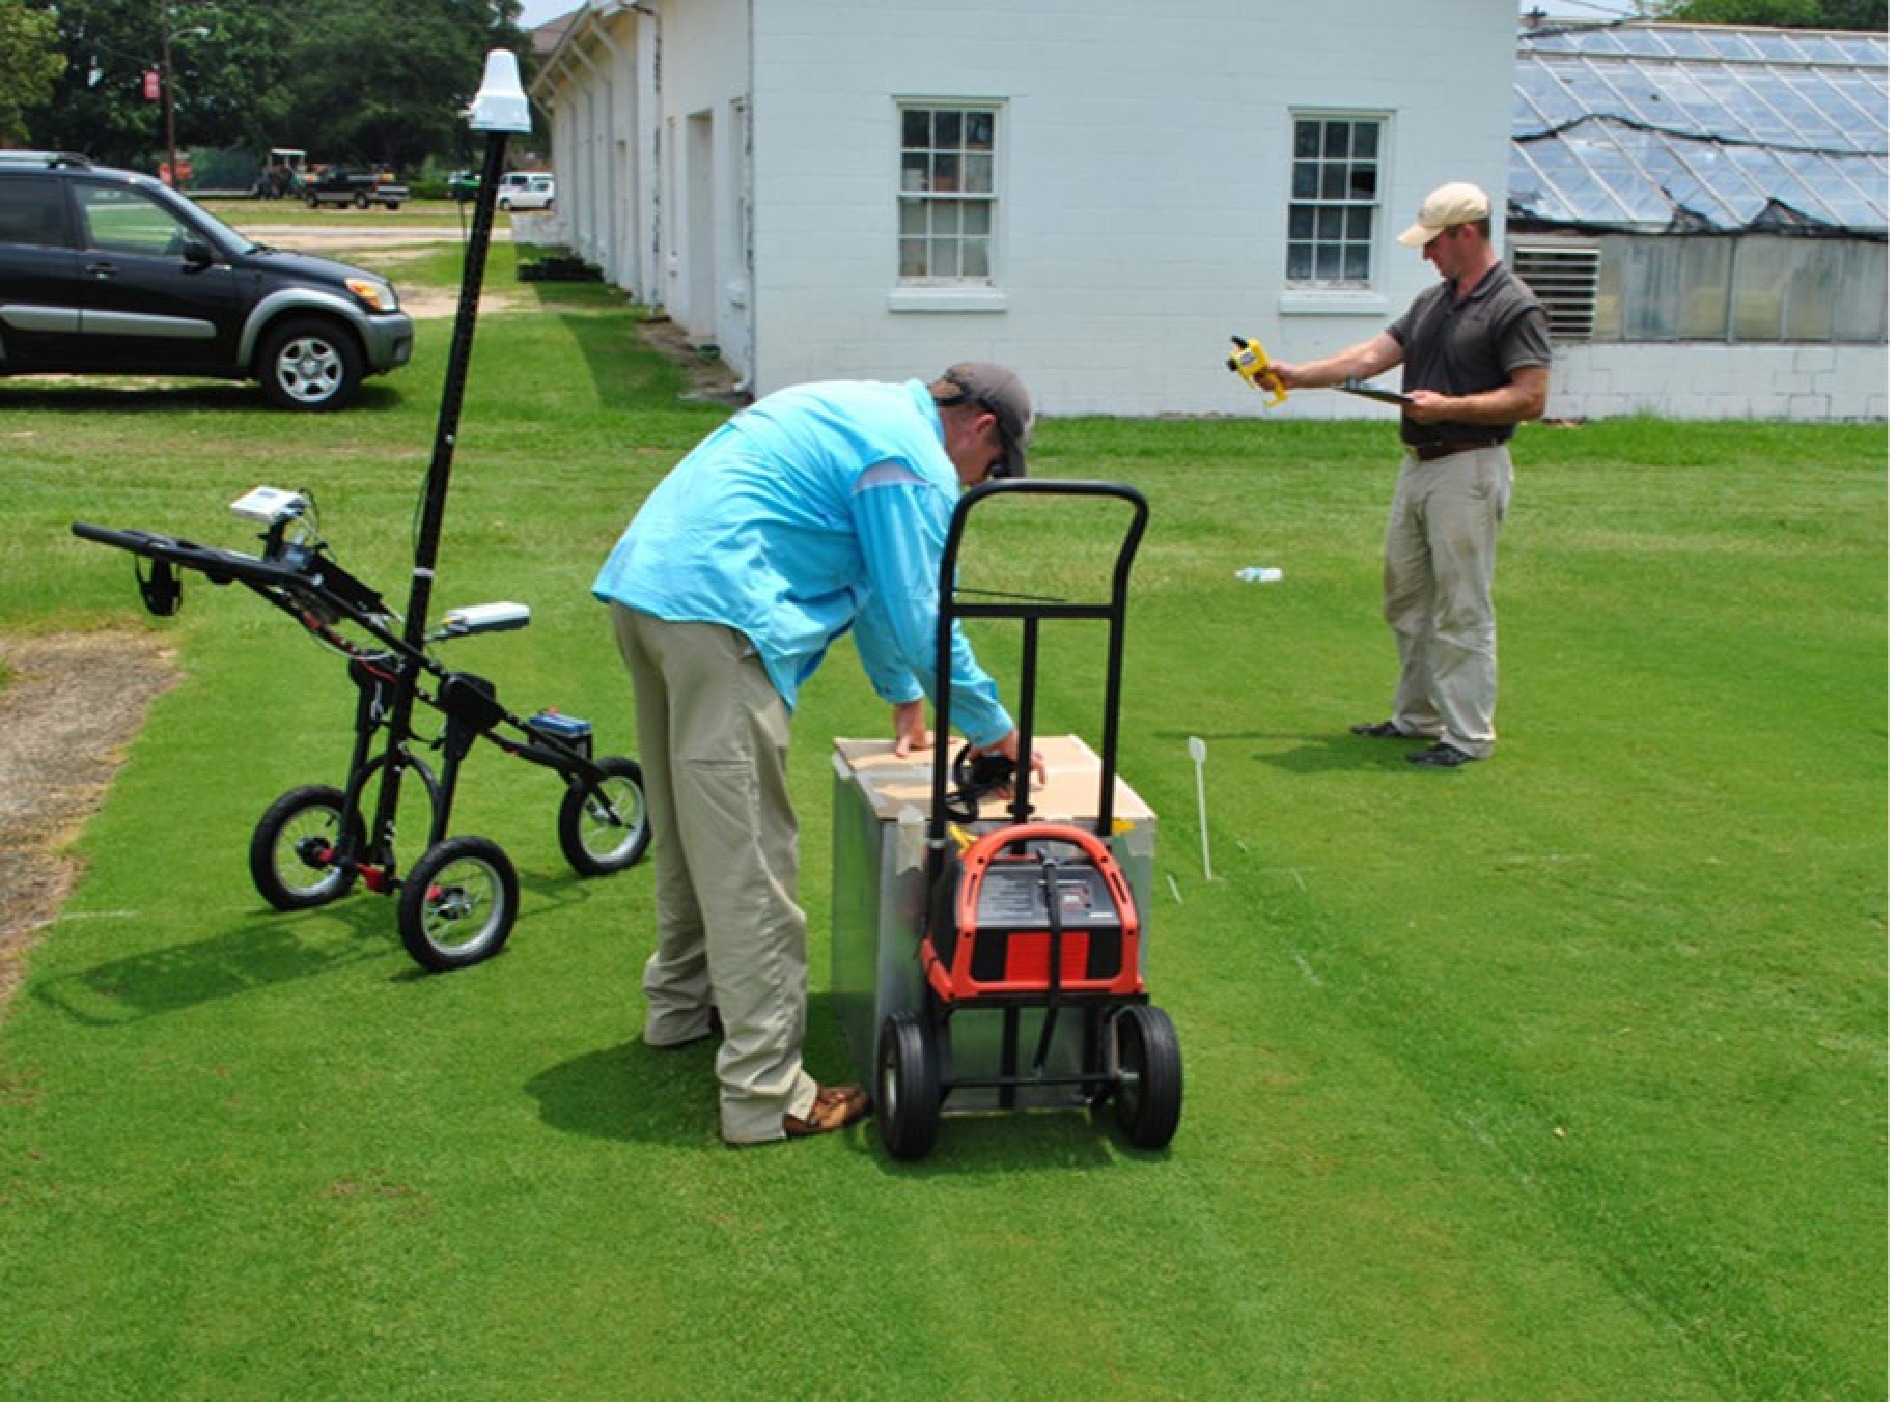
Figure 2.
Examples of ground-based phenotyping devices used in turfgrass breeding and research. Left: pushcart with multispectral sensor; middle: light box with digital camera; right: hand-held NDVI meter. (Photo credit: Brian Schwartz).
-
Aerial-based plant phenotyping involves the assessment of plant phenotypes using aerial, remote sensors, which are located farther away from the plants of interest than proximal sensors[26]. Aerial-based plant phenotyping efforts began by using traditional, manned vehicles such as small airplanes, blimps, and parachutes, which all remain useful for certain phenotyping applications today[23]. However, advancements in UASs have increased rapidly in recent years, and these platforms have become routinely used for remote sensing-based plant phenotyping applications.
Traditional aerial vehicles such as small airplanes and blimps require a person to be onboard for operational purposes[23]. These vehicles have higher payloads than UASs but generally require relatively higher operational altitudes and speeds. Such limitations have given rise to a widespread use of UAS technology. By definition, a UAS consists of a vehicle that can travel through the air without a person onboard for operation[55]. The UASs are typically categorized as either fixed wing or multicopter aircrafts. The selection of one platform over the other is dependent upon a specific application and available resources, as these platforms vary widely in terms of maneuverability, initial costs, maintenance costs, run time, and payload[23].
Fixed wing UASs, compared to multicopter UASs, have faster flight speeds, longer flight times, and can carry a heavier payload[56]. This means that fixed wing systems can cover more land area and can accommodate more sensors and other data recording devices onboard. The limitations to fixed wing UASs are also attributed to the fast travel speeds; operators must be aware of image blurring risks and ensure onboard sensors are compatible with the fast speeds of travel[56]. In addition, fixed wing aircrafts cannot hover, and, with exception to some fixed wing aircrafts that have vertical takeoff and landing capabilities, they require relatively large areas for takeoff and landing[56]. Multicopter UASs, on the other hand, have slower flight speeds, shorter flight times, and cannot carry as heavy of a payload as fixed wing systems[57]. The ability of multicopter platforms to maintain stable positions at slower travel speeds and lower altitudes gives them an advantage for use in plant science research and breeding programs[58].
-
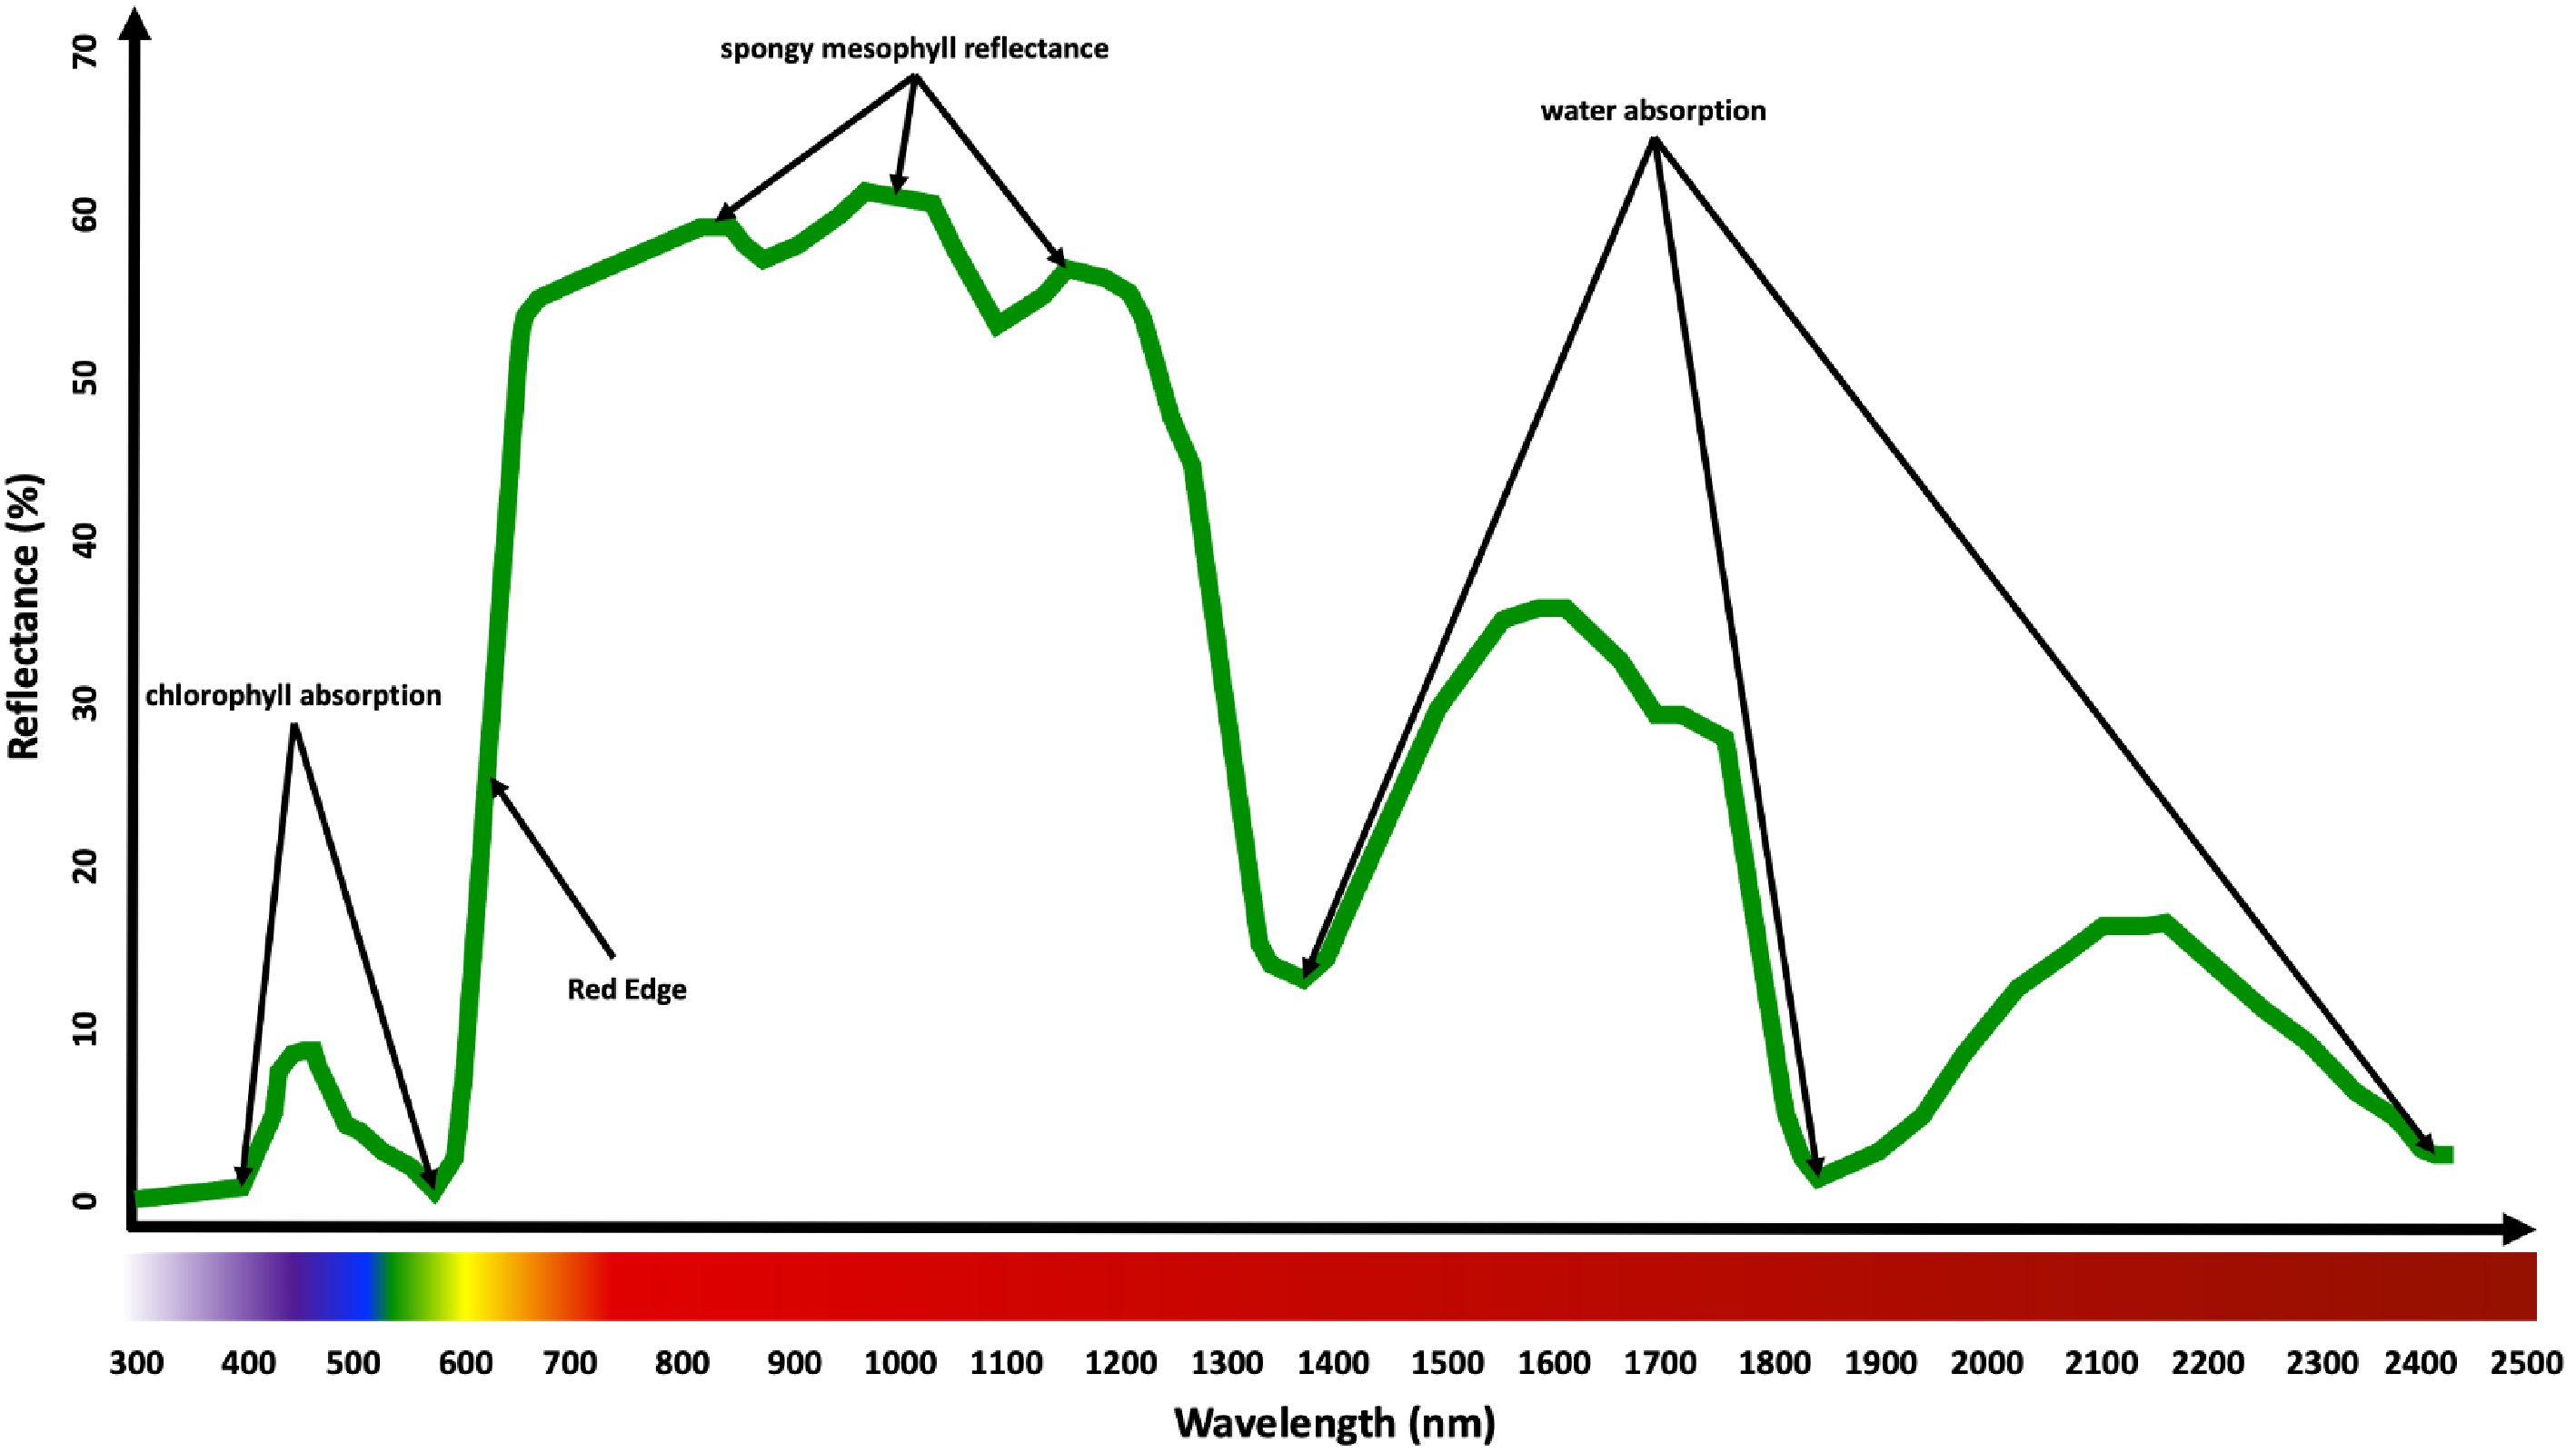
Various remote sensing technologies have been explored for plant phenotyping applications. Many of these technologies are based on plant interactions with light at wavelengths that span much of the electromagnetic spectrum (Fig. 3). The following sections provide detailed descriptions of visible light imaging, spectral imaging, infrared thermal imaging, and fluorescence imaging technologies with particular emphasis on their usefulness in high-throughput plant phenotyping for turfgrass breeding applications. These remote sensing approaches are primarily used to assess two-dimensional plant characteristics but can be used to assess limited three-dimensional plant traits as well. However, light ranging and detection (LiDAR) and ultrasonic sensors represent much more appropriate options for assessing three-dimensional plant architecture and are also discussed herein.
Visible light imaging
-
Visible light imaging is based on plant interactions with light intensities in the 400 nm to 700 nm wavelength range (Fig. 4) and is meant to mimic human perception[23]. For phenotyping purposes, visible light imaging is primarily used to capture plant characteristics such as color, morphology, and architecture[23,25]. This is an affordable and convenient imaging solution and has been extensively used for plant phenotyping applications among various crop species[13,26]. Standard digital cameras are typically used for visible light imaging to capture raw data that correspond with photon fluxes in the red (~650 nm), green (~550 nm), and blue (~450 nm) spectral bands (Fig. 4); for this reason, these images are often called RGB images.

Figure 4.
Light wavelengths along the electromagnetic spectrum captured by various optical sensors. Visible light imaging sensors for 400 nm to 700 nm, spectral imaging sensors for 400 nm to 2,500 nm, and infrared thermal imaging sensors for 7,500 nm to 13,000 nm[17].
Once RGB data are captured, there are different approaches that can be taken to process the data depending on the objectives of a given project. One approach for analyzing these data is to convert RGB images into color indices such as excess green index, green index, green leaf index, greenblue, normalized difference index, or visible atmospherically resistant index, which can be done using gray-scale, single band data (Table 1). This approach can also be used to obtain measurements of percentage green cover by thresholding, which is a pixel classification procedure whereby pixels with values above a threshold are classified as green and pixels below a threshold are classified as non-green[59]. A second approach is to convert RGB pixel values to hue, saturation, and brightness (HSB) pixel values, which can subsequently be used to generate measurements including percentage ground cover[60] and plant color[61]. The HSB data can also be used to calculate the dark green color index (Table 1). In addition to plant characteristics such as green cover and plant color, plant breeders can also obtain plant height information using the Structure-from-Motion technique, which combines computing algorithms, digital cameras, and aerial vehicles to reconstruct a three-dimensional digital surface model of the target[62,63]. This approach is challenging to use in mowed turfgrass research because of the low canopy height (< 10 cm) but does offer some promise in estimating yield for seed production research and breeding programs.
Table 1. Color, temperature, and vegetation indices used in plant remote sensing research and breeding applications.
Index Formula Reference Canopy-Air Temperature Difference (CATD) TL – TA [162] Canopy Temperature Variability (CTV) σTC [163] Crop Water Stress Index (CWSI) $ \dfrac{\left(\mathrm{T}\mathrm{C}-\mathrm{T}\mathrm{A}\right)-\left(TC-TA\right)ll}{(TC-TA)ul-(TC-TA)ll} $ [164] Dark Green Color Index (DGCI) $ \dfrac{\left(\dfrac{\mathrm{H}\mathrm{u}\mathrm{e}-60}{60+\left(1-\mathrm{S}\mathrm{a}\mathrm{t}\mathrm{u}\mathrm{r}\mathrm{a}\mathrm{t}\mathrm{i}\mathrm{o}\mathrm{n}\right)+(1-\mathrm{B}\mathrm{r}\mathrm{i}\mathrm{g}\mathrm{h}\mathrm{t}\mathrm{n}\mathrm{e}\mathrm{s}\mathrm{s})}\right)}{3} $ [61] Difference Vegetation Index (DVI) Near Infrared − Red [108] Enhanced Vegetation Index (EVI) $ 2.5\dfrac{\mathrm{N}\mathrm{e}\mathrm{a}\mathrm{r}\;\mathrm{I}\mathrm{n}\mathrm{f}\mathrm{r}\mathrm{a}\mathrm{r}\mathrm{e}\mathrm{d}-\mathrm{R}\mathrm{e}\mathrm{d}}{\mathrm{N}\mathrm{e}\mathrm{a}\mathrm{r}\;\mathrm{I}\mathrm{n}\mathrm{f}\mathrm{r}\mathrm{a}\mathrm{r}\mathrm{e}\mathrm{d}\;+\left(6\mathrm{R}\mathrm{e}\mathrm{d}\right)-\left(7.5\mathrm{B}\mathrm{l}\mathrm{u}\mathrm{e}\right)+1} $ [110] Excess Green Index (ExG) 2Green – Red – Blue [165] Green Chlorophyll Index (GCI) $ \dfrac{\mathrm{N}\mathrm{e}\mathrm{a}\mathrm{r}\;\mathrm{I}\mathrm{n}\mathrm{f}\mathrm{r}\mathrm{a}\mathrm{r}\mathrm{e}\mathrm{d}}{\mathrm{G}\mathrm{r}\mathrm{e}\mathrm{e}\mathrm{n}}-1 $ [111] Green Difference Vegetation Index (GDVI) Near Infrared – Green [113] Green Index (GI) $ \dfrac{\mathrm{G}\mathrm{r}\mathrm{e}\mathrm{e}\mathrm{n}}{\mathrm{R}\mathrm{e}\mathrm{d}} $ [166] Green Leaf Index (GLI) $ \dfrac{2\mathrm{G}\mathrm{r}\mathrm{e}\mathrm{e}\mathrm{n}-\mathrm{R}\mathrm{e}\mathrm{d}-\mathrm{B}\mathrm{l}\mathrm{u}\mathrm{e}}{2\mathrm{G}\mathrm{r}\mathrm{e}\mathrm{e}\mathrm{n}+\mathrm{R}\mathrm{e}\mathrm{d}+\mathrm{B}\mathrm{l}\mathrm{u}\mathrm{e}} $ [83] GreenBlue (GB) $ \dfrac{\mathrm{G}\mathrm{r}\mathrm{e}\mathrm{e}\mathrm{n}-\mathrm{B}\mathrm{l}\mathrm{u}\mathrm{e}}{\mathrm{G}\mathrm{r}\mathrm{e}\mathrm{e}\mathrm{n}+\mathrm{B}\mathrm{l}\mathrm{u}\mathrm{e}} $ [85] Normalized Difference Index (NDI) $ \dfrac{\mathrm{G}\mathrm{r}\mathrm{e}\mathrm{e}\mathrm{n}-\mathrm{R}\mathrm{e}\mathrm{d}}{\mathrm{G}\mathrm{r}\mathrm{e}\mathrm{e}\mathrm{n}+\mathrm{R}\mathrm{e}\mathrm{d}} $ [167] Normalized Difference Red Edge (NDRE) $ \dfrac{\mathrm{N}\mathrm{e}\mathrm{a}\mathrm{r}\;\mathrm{I}\mathrm{n}\mathrm{f}\mathrm{r}\mathrm{a}\mathrm{r}\mathrm{e}\mathrm{d}-\mathrm{R}\mathrm{e}\mathrm{d}\;\mathrm{E}\mathrm{d}\mathrm{g}\mathrm{e}}{\mathrm{N}\mathrm{e}\mathrm{a}\mathrm{r}\;\mathrm{I}\mathrm{n}\mathrm{f}\mathrm{r}\mathrm{a}\mathrm{r}\mathrm{e}\mathrm{d}+\mathrm{R}\mathrm{e}\mathrm{d}\;\mathrm{E}\mathrm{d}\mathrm{g}\mathrm{e}} $ [112] Normalized Difference Vegetation Index (NDVI) $ \dfrac{\mathrm{N}\mathrm{e}\mathrm{a}\mathrm{r}\;\mathrm{I}\mathrm{n}\mathrm{f}\mathrm{r}\mathrm{a}\mathrm{r}\mathrm{e}\mathrm{d}-\mathrm{R}\mathrm{e}\mathrm{d}}{\mathrm{N}\mathrm{e}\mathrm{a}\mathrm{r}\;\mathrm{I}\mathrm{n}\mathrm{f}\mathrm{r}\mathrm{a}\mathrm{r}\mathrm{e}\mathrm{d}+\mathrm{R}\mathrm{e}\mathrm{d}} $ [106] Optimized Soil Adjusted Vegetation Index (OSAVI) $ \dfrac{\mathrm{N}\mathrm{e}\mathrm{a}\mathrm{r}\;\mathrm{I}\mathrm{n}\mathrm{f}\mathrm{r}\mathrm{a}\mathrm{r}\mathrm{e}\mathrm{d}-\mathrm{R}\mathrm{e}\mathrm{d}}{\mathrm{N}\mathrm{e}\mathrm{a}\mathrm{r}\;\mathrm{I}\mathrm{n}\mathrm{f}\mathrm{r}\mathrm{a}\mathrm{r}\mathrm{e}\mathrm{d}+\mathrm{R}\mathrm{e}\mathrm{d}+0.16} $ [109] Ratio Vegetation Index (RVI) $ \dfrac{\mathrm{R}\mathrm{e}\mathrm{d}}{\mathrm{N}\mathrm{e}\mathrm{a}\mathrm{r}\;\mathrm{I}\mathrm{n}\mathrm{f}\mathrm{r}\mathrm{a}\mathrm{r}\mathrm{e}\mathrm{d}} $ [104] Simple Ratio (SR) $ \dfrac{\mathrm{N}\mathrm{e}\mathrm{a}\mathrm{r}\;\mathrm{I}\mathrm{n}\mathrm{f}\mathrm{r}\mathrm{a}\mathrm{r}\mathrm{e}\mathrm{d}}{\mathrm{R}\mathrm{e}\mathrm{d}} $ [105] Temperature Stress Day (TSD) Tstress – Tnon-stress [168] Transformed Vegetation Index (TVI) $ \dfrac{\mathrm{N}\mathrm{e}\mathrm{a}\mathrm{r}\;\mathrm{I}\mathrm{n}\mathrm{f}\mathrm{r}\mathrm{a}\mathrm{r}\mathrm{e}\mathrm{d}-\mathrm{R}\mathrm{e}\mathrm{d}}{\mathrm{N}\mathrm{e}\mathrm{a}\mathrm{r}\;\mathrm{I}\mathrm{n}\mathrm{f}\mathrm{r}\mathrm{a}\mathrm{r}\mathrm{e}\mathrm{d}+\mathrm{R}\mathrm{e}\mathrm{d}} $ [107] Visible atmospherically resistant index (VARI) $ \dfrac{\mathrm{G}\mathrm{r}\mathrm{e}\mathrm{e}\mathrm{n}-\mathrm{R}\mathrm{e}\mathrm{d}}{\mathrm{G}\mathrm{r}\mathrm{e}\mathrm{e}\mathrm{n}+\mathrm{R}\mathrm{e}\mathrm{d}-\mathrm{B}\mathrm{l}\mathrm{u}\mathrm{e}} $ [84] Visible light imaging has been widely used in turfgrass science research to date[64]. Since the early 2000s, researchers have routinely used RGB digital imagers attached to ground-based, enclosed lighting systems (Fig. 2) to collect phenotypic data for turf plot trials. Percentage ground cover measurements have been used to evaluate important turfgrass characteristics such as establishment rate[65−68] and turf performance during periods of drought[69−73] and traffic[74,75] stress, for example. Turfgrass color measurements, indicated by the dark green color index (Table 1), have been used to monitor turfgrass diseases[76−78] and seasonal turf performance[79,80].
In recent years, studies have been conducted to assess the potential applications for RGB imagers mounted to aerial platforms. The first study to use a UAS-mounted RGB camera in turfgrass science research found only a 1.5% difference between digital image data and ground survey data when studying turfgrass response 40 d after herbicide application using an unmanned helicopter[81]. More recently, Zhang et al.[82] compared ground- and aerial-based measurements on small plot bermudagrass (Cynodon spp.) and zoysiagrass (Zoysia spp.) research field trials and found that both UAS-based green leaf index and visible atmospherically resistant index, introduced by Louhaichi et al.[83] and Gitelson et al.[84], respectively, adequately predicted ground-based percent green cover ratings. Hong et al.[85] evaluated the ability of UAS-based RGB imagery to detect early drought stress in creeping bentgrass (Agrostis stolonifera L.) and reported that the greenblue color index (Table 1) enabled drought stress detection 5 d before decreases in visual turf quality were observed. These studies offer foundational evidence that RGB digital imagery is an affordable, entry-level plant phenotyping tool, and it is anticipated that additional studies of UAS-based visible light imaging will be reported in the future to further characterize the usefulness and limitations of this technology for turfgrass breeding applications.
Based on prior research in turfgrasses and other crops, some limitations of UAS-based RGB imagery have been identified. Examples of current concerns include the difficulties in differentiating various plant stresses, processing datasets when sun and shade irregularities exist within the plant canopies at time of data collection, and challenges in distinguishing soil from vegetation in noncontinuous plant canopies. These and other issues are being further studied to search for solutions and enhance the usability of this technology for phenotyping applications. On a positive note, commercial UASs, fully integrated with RGB cameras and software for mapping missions, are available for plant breeders, requiring minimal technical training to operate compared to earlier developed platforms.
Spectral imaging
-
Spectral imaging sensors, also known as imaging spectrophotometers, collect data from the interaction of plants with light intensities that span much of the electromagnetic spectrum[28]. There are several key wavelengths (Fig. 3) along the spectrum that have been extensively studied in prior research. Light reflection from plant leaves is limited within the visible light range, as much of the light is absorbed by leaf pigments, particularly the chlorophyll; there is a notably high reflectance at approximately 550 nm in the green region and low reflectance at approximately 450 nm and 680 nm in the blue and red regions, respectively[86]. As wavelengths extend into the near-infrared range (690 nm to 730 nm), there is a marked increase in light emittance due primarily to light scattering within leaf cells[87]. This region has proven useful for assessing various plant characteristics, and because of the drastic increase in reflection at this region, it is commonly called the 'red edge'[88]. Just beyond this region, there is a water absorbing band at 970 nm that has been used as an indirect assessment of plant leaf water content[89−91]. There are also additional regions of interest as wavelengths progress into the short-wave infrared region (1,000 nm to 2,500 nm). For example, strong water absorbing bands exist at 1,200 nm, 1,450 nm, 1,930 nm, and 2,500 nm, which could potentially be used for remote assessment of leaf water content[92−95].
Spectral imaging can be further classified into multispectral imaging and hyperspectral imaging (Fig. 5). Multispectral imaging collects discrete light reflectance data from approximately 3 to 10 bands, where the bands are typically broader than those in hyperspectral sensing[96]. These bands are typically well characterized and often assigned descriptive titles. Hyperspectral imaging, on the other hand, collects continuous light reflectance data from tens to thousands of bands. In this case, the bands are much narrower than those in multispectral sensing, and they do not typically have descriptive titles.
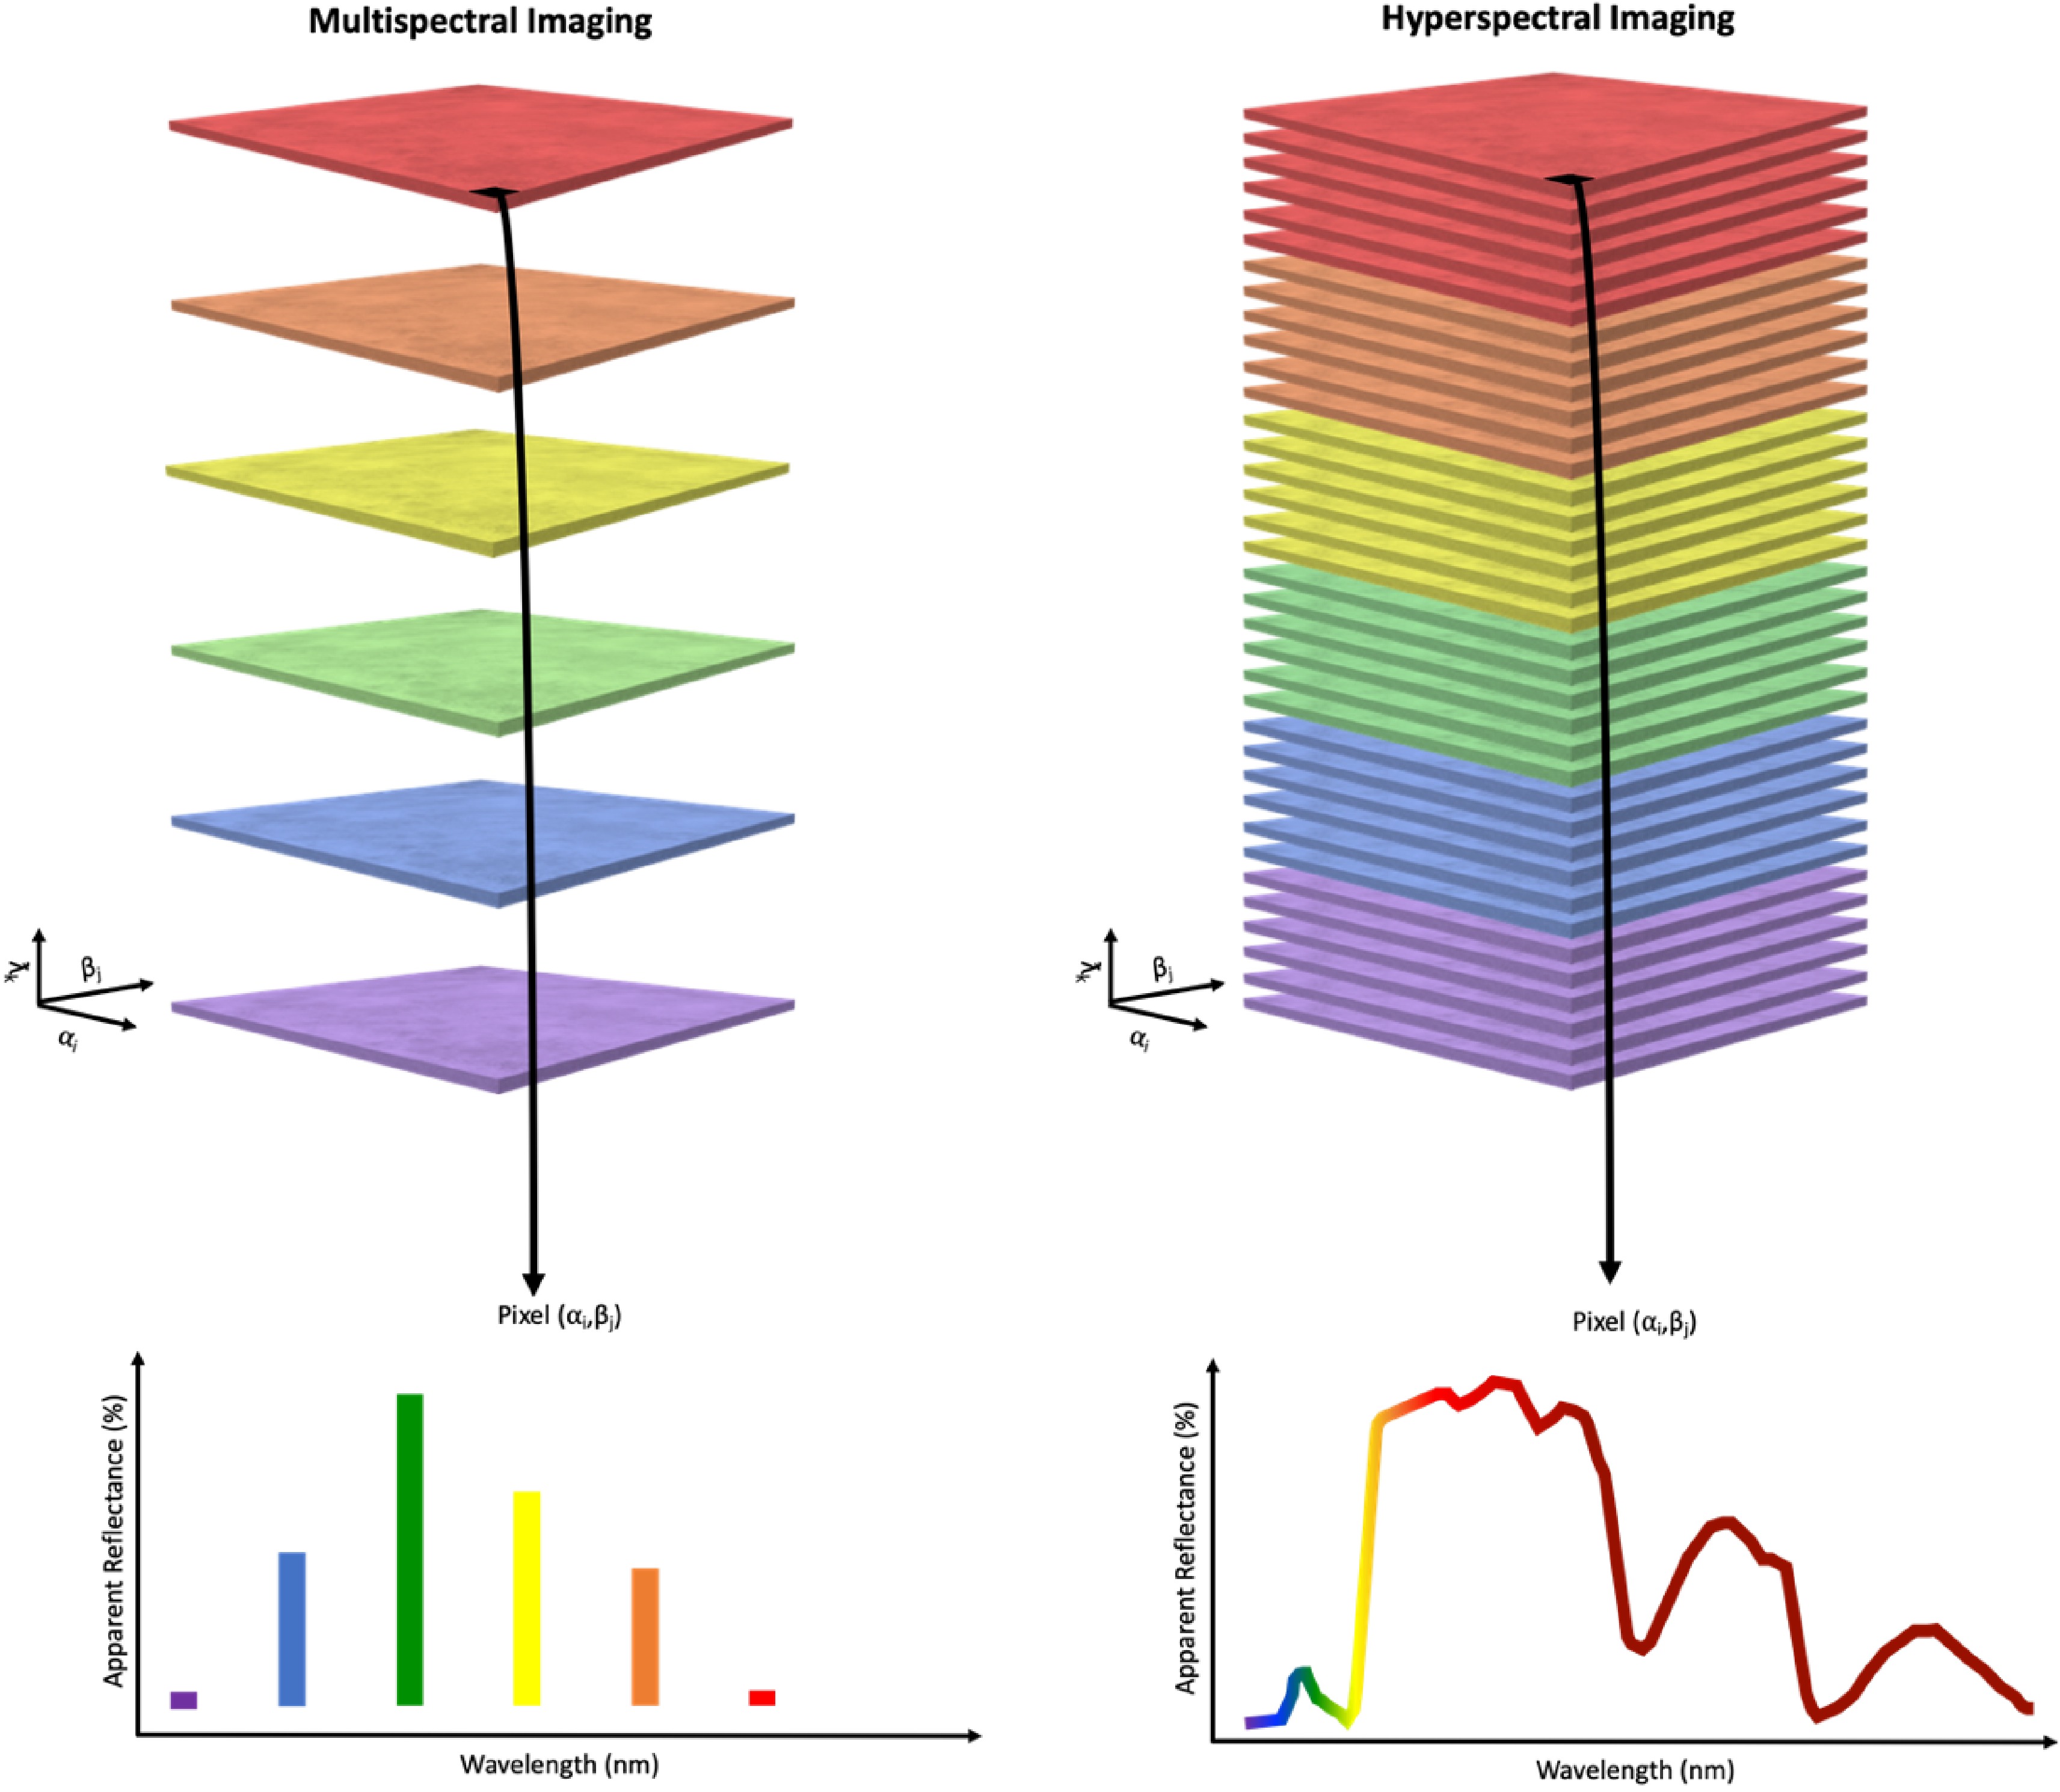
Figure 5.
Comparison of multispectral imaging and hyperspectral imaging. Discrete light reflectance data is generated from multispectral sensors whereas continuous light reflectance data is generated from hyperspectral sensors[170].
Arguably the most noteworthy work to come from plant spectral imaging research to date has been the derivation of various vegetation indices (Table 1), which are calculated based on simple mathematical functions such as differences or ratios between spectral reflectance at two or more spectral bands[97]. Vegetation indices are found to be useful in assessing chlorophyll and biomass production[98], plant stress and health[99−101], and nutritional status[102] in plants.
Trenholm et al.[103] used a hand-held Cropscan multispectral radiometer to measure turfgrass reflectance at seven wavelengths, which were subsequently used to calculate four vegetation indices as indicators of turfgrass visual quality, shoot density, and shoot tissue injury from traffic wear. This was one of the earlier studies to correlate turfgrass reflectance data with traditional visual qualitative estimates. Fitz–Rodríguez and Choi[97] found that normalized difference vegetation index, ratio vegetation index, and difference vegetation index (Table 1) correlated well with turfgrass visual quality under different irrigation treatments. Developing new and improved vegetation indices has been the focus for research projects for many years, and those types of studies are still actively being conducted at present[104−113]. However, the normalized difference vegetation index, which was first introduced by Rouse et al.[106], has been extensively studied and remains one of the most widely used vegetation indices of plant health across various plant species, including turfgrasses[100,101,114,115].
Spectral imaging is a promising technology for high-throughput plant phenotyping applications. As mentioned above, this technology is adaptable to ground- or aerial-based platforms and offers the ability to investigate plant interactions with light intensities beyond the visible light range. Many plant responses are more active outside the visible light range; therefore, spectral imaging in the near-infrared and short-wave infrared regions offer insights to many plant behaviors that are not detectable with visible light imaging platforms. Widespread implementation of spectral imaging technologies in plant science research and breeding programs has been slowed by a few difficulties that are being addressed in current research projects. Two of the most notable limitations to spectral imaging are the large quantities of data that are generated and the startup costs associated with purchasing these instruments. However, research and advancements in fields such as computer science and data science are offering solutions to these issues.
Infrared thermal imaging
-
Infrared thermal imaging, also known as long-wave infrared imaging, thermal long-wave infrared imaging, or forward-looking infrared imaging, collects reflectance data in the far-infrared and long-wave infrared range of wavelengths, which span from 7,500 nm to 13,000 nm (Fig. 4). Over the last few decades, there has been mounting interest in using infrared thermometers to characterize drought- and heat-induced plant water stress based on the concept that water-stressed canopies have higher temperatures than well-watered canopies[116]. However, other than plant physiological status, canopy temperature measurements can also be affected by other factors such as surface soil exposure, solar radiation, and air temperature at the time of observation. Indices have been developed to normalize canopy temperature measurements to account for these types of environmental factors (Table 1).
Among the indices listed in Table 1, crop water stress index is one of the most commonly used indices in studies on turfgrass irrigation scheduling. Jalali-Farahani et al.[117] reported that midday estimates of crop water stress index in bermudagrass were related to soil percent available extractable water. Bijanzadeh et al.[118] monitored crop water stress index of bermudagrass subjected to deficit irrigation on a monthly basis in southern Iran and concluded that turfgrass quality can be maintained with seasonal crop water stress index being kept at a value of approximately 0.15. However, one of the challenges is to accurately measure the upper and lower limit of temperature difference between canopy and air; such types of baseline values vary across different soil and environmental conditions[119] and could be dynamic during the day[120]. A model was developed to predict those baselines in tall fescue with meteorological factors such as air temperature, solar radiation, vapor pressure deficit, and wind speed[121].
Another limitation regarding the application of canopy temperature is the dynamic nature of the measurement, which is highly variable if the time of data collection stretches too long. More valuable information can be derived regarding the water status of the plants if the data collection can be done within a few minutes. Infrared thermal cameras mounted on UASs would provide an option for thermal imagery to be collected across turfgrass breeding trials within minutes. Moreover, exposed soil among vegetation could potentially be removed if combined with RGB and multispectral imagery. Several hurdles need to be overcome to use UAS-based thermal imagery including temperature calibration, canopy temperature extraction, and establishment of canopy temperature-based crop water stress indicator[122]. Early exploration was reported using UAS-based thermal imagery to detect early drought stress in creeping bentgrass[85]. The researchers detected a rise of canopy temperature under 15% and 30% evapotranspiration replacements before visible decline of turf compared to 100% ET plots. More studies are needed to address these limitations associated with using UAS-based thermal imagers to detect drought stress in turfgrass.
Fluorescence imaging
-
Fluorescence is the emitted light generated during the absorption of short wavelength radiation, and in plants, the chlorophyll complex is the most common fluorescing machinery. As chloroplasts are irradiated with actinic or blue light, a portion of the light absorbed by chlorophyll will be reemitted as fluorescence[123]. The proportion of absorbed light that gets reemitted varies due to the plant's light metabolic capacity[124]. This fluorescence is a valuable indication of the plant's ability to assimilate actinic light[125]. Moreover, adding brief pulses of saturating blue light to the actinic light is useful to assess plant status for physiological parameters such as non-photochemical quenching and photo-assimilation[23].
Fluorescence imaging, also known as chlorophyll fluorescence imaging, is the procedure of capturing images of fluorescence emitted by plants upon illumination with visible or ultraviolet light[126]. This technique commonly uses charge-coupled device cameras that are sensitive to fluorescence signals generated by light-emitting diodes, pulsed flashlights, or pulsed lasers[127]. Fluorescence imaging provides an efficient means for in vivo assessment of the electron transport rate, the extent of non-photochemical quenching, and the effective and potential quantum efficiency of photosystem II[128−130]. Many uses of chlorophyll fluorescence imaging have been investigated including early detection of pathogen attack[131−135], herbicide injury[136,137], and other abiotic and biotic stress factors[134,138−140].
Although fluorescence imaging is a promising technique for assessing plant health status, there are several limitations that have inhibited its implementation for high-throughput plant phenotyping in field settings. Fluorescence imaging requires that plants be dark-adapted prior to light excitation, meaning data collection for each plant sample will take multiple minutes[126]. In addition, currently available fluorescence imaging systems are only capable of measuring fluorescence from single leaves; for high-throughput applications, the technology must be developed to assess multiple plants at once. Another complication is that substantial power sources are needed to operate various light and sensor components of fluorescence imaging systems[141]. For this technology to be applicable for high-throughput plant phenotyping, concerns around robustness, reproducibility, and fluorescence image processing must be addressed.
Other imaging technologies
-
Plant traits related to height and canopy architecture are highly prioritized in breeding goals and can be obtained through three-dimensional reconstruction of plant canopies[28]. LiDAR and ultrasonic sensors are both classified as ranging sensors, which means they measure the distance to the nearest object by emitting an electromagnetic signal and calculating the time difference between emitting and receiving the signal to indicate distance to the target[142]. For LiDAR, a laser beam is emitted to the target and the reflected light is analyzed[143]. One of the advantages of using LiDAR is being able to supply structural information of plants with high accuracy compared to other sensors due to view-obscuration from nadir view. In theory, LiDAR-based plant phenotyping can provide information from the leaf level to the canopy level, potentially helping diagnosis of plant status and crop management[143]. Growing literature reported the use of LiDAR-based plant phenotyping in row crops such as maize[144], sorghum [Sorghum bicolor (L.) Moench.][145], soybean [Glycine max (L.) Merr.][146], and cotton[147], focusing on traits including plant height, row spacing, and biomass.
Given the high cost and availability of the integrated platform, LiDAR is less explored for plant phenotyping than other technologies. Limited studies investigated the use of LiDAR-based phenotyping in turfgrass. Nguyen et al.[148] reported using an unmanned ground vehicle (DairyBioBot) and LiDAR pipeline for the high-throughput phenotyping of biomass in forage perennial ryegrass (Lolium perenne L.) with R2 = 0.73 at the plot level when correlating with fresh mass basis observation. Nonetheless, the application of LiDAR in individual-plant-level phenotyping is promising in the future as this technology continues to be developed and becomes more affordable and integrated in user-friendly platforms.
Ultrasonic sensors are generally more affordable compared to LiDAR. Similar to LiDAR, ultrasonic sensors can be used to estimate geometrical parameters of plants (for instance, plant height and canopy volume) if appropriate acquisition and data processing is applied. Studies were carried out to use ultrasonic sensors to estimate plant height in cotton[43], alfalfa (Medicago sativa L.) and bermudagrass[149], and wheat[150]. Yuan et al.[151] compared LiDAR, ultrasonic sensor, and RGB camera mounted on UAS in estimating plant height in wheat and concluded that LiDAR and UAS-mounted RGB camera provided the best results. Therefore, the strength of ultrasonic is not prominent but it provides an alternative for LiDAR in estimating plant height on the ground level when the target plants are too small for UAS applications.
-
Plant breeding programs have greatly benefited from recent advancements in DNA genotyping technologies. However, plant phenotype assessment has become the limiting factor in screening large numbers of plants in current plant breeding programs. Advancements in remote and proximal sensing technologies have led to the development and implementation of high-throughput plant phenotyping practices, which is beginning to increase the efficiency of plant phenotyping. Visible light imaging has been the most widely used remote sensing approach. This is a relatively inexpensive phenotyping solution for assessing plant traits such as ground cover and canopy architecture. Future research efforts of visible light imaging for plant phenotyping applications should emphasize the need for improved analysis approaches to account for shading issues and light variation as well as alleviating difficulties associated with distinguishing soil from plant tissues.
Spectral imaging technologies have expanded in recent years and are becoming increasingly more prevalent in plant science research efforts. This technology is expected to continue to expand for additional plant phenotyping applications. Turfgrass breeders have already begun experimenting with this technology and have found promising results thus far. As the technology advances, it is expected that the initial costs associated with purchasing equipment will reduce; this will enable more plant breeding programs to utilize this technology. Research efforts should continue in developing improved data handling and processing options to better accommodate the large datasets generated using this imaging technology.
Thermal imaging and fluorescence imaging are two technologies that are also being adapted to field applications. Although these technologies are not currently suited for in-field breeding applications, researchers are experimenting with these technologies to determine their usefulness in monitoring plant health and growth characteristics. As these technologies continue to be developed, it is anticipated that they will be more readily used in turfgrass breeding applications. Additionally, range sensors such as LiDAR will be further developed for use in assessing morphological characteristics such as leaf texture, leaf width, and plant height for turfgrass breeding programs.
In addition to the phenotyping tools mentioned in this review, various other technologies are being explored to efficiently assess plant root phenotypes both in controlled environment and field conditions. Programs such as EZ Rhizo[152], IJ Rhizo[153], Root System Analyzer[154], Root Trace[155], Smart Root[156], and WhinRhizo[157] have been widely used for image-based analysis of root architecture. However, these approaches do not offer in situ root analyses, as they require roots to be cleaned of soil. Options for in situ root assessment include the use of mini-rhizotrons equipped with cameras or scanners to periodically gather root architecture data[158]. This approach is not well-suited for high-throughput applications and can only accommodate limited numbers of genotypes[159]. Other promising approaches currently being investigated include non-destructive methods such as magnetic resonance imaging and X-ray computed tomography[160,161]. The development of high-throughput phenotyping tools for characterizing root performance under stresses such as drought, insect feeding, and disease will be valuable resources for plant breeding programs in the future.
Modern turfgrass breeding programs will continue to research, develop, and implement remote sensing technologies for high-throughput plant phenotyping applications. These technologies will enable turfgrass breeders to assess larger numbers of genotypes to efficiently identify elite germplasm. All together, these efforts will improve cultivar development efficiency and aid plant breeders in developing improved turfgrass cultivars to meet current and future demands of the turfgrass industry.
The authors would like to acknowledge the Rutgers Center for Turfgrass Science and the USDA – NIFA Specialty Crop Research Initiative (grant number: 2019-51181-30472) for partial funding of this effort.
-
The authors declare that they have no conflict of interest.
- Copyright: © 2022 by the author(s). Published by Maximum Academic Press, Fayetteville, GA. This article is an open access article distributed under Creative Commons Attribution License (CC BY 4.0), visit https://creativecommons.org/licenses/by/4.0/.
-
About this article
Cite this article
Vines PL, Zhang J. 2022. High-throughput plant phenotyping for improved turfgrass breeding applications. Grass Research 2:1 doi: 10.48130/GR-2022-0001 

High-throughput plant phenotyping for improved turfgrass breeding applications
- Received: 03 September 2021
- Accepted: 31 December 2021
- Published online: 18 January 2022
Abstract: Turfgrasses are used extensively throughout the world, and there is a steadfast demand to develop turfgrass varieties with improved abiotic and biotic stress tolerances that will perform well with limited management inputs. Modern breeding programs incorporate advanced breeding strategies such as DNA sequencing and high-throughput phenotyping with traditional breeding strategies to identify and select germplasm and genes of interest. Molecular biology methods and DNA sequencing technology have rapidly increased in recent years, and, as a result, plant phenotyping is currently a bottleneck in the process of advancing breeding programs. Recent advances in remote sensing technology have offered improved, non-destructive plant phenotyping approaches such as visible light imaging, spectral imaging, infrared thermal imaging, range sensing, and fluorescence imaging. Integrated mobile and time efficient platforms are being developed, coupling remote sensing with robotics and unmanned aerial systems technology for high-throughput plant phenotyping applications across large field spaces. Modern turfgrass breeding programs will continue to research, develop, and implement remote sensing technologies to assess larger numbers of genotypes and identify elite germplasm. All together, these efforts will improve cultivar development efficiency and aid plant breeders in developing improved turfgrass cultivars to meet current and future demands of the turfgrass industry. This review provides an overview of ground- and aerial-based plant phenotyping platforms, with particular emphasis placed on applications to turfgrass breeding practices. Similarly, imaging technologies that have been used in various plant breeding programs are discussed, with indications as to how those technologies could be applicable to turfgrass breeding programs.