-
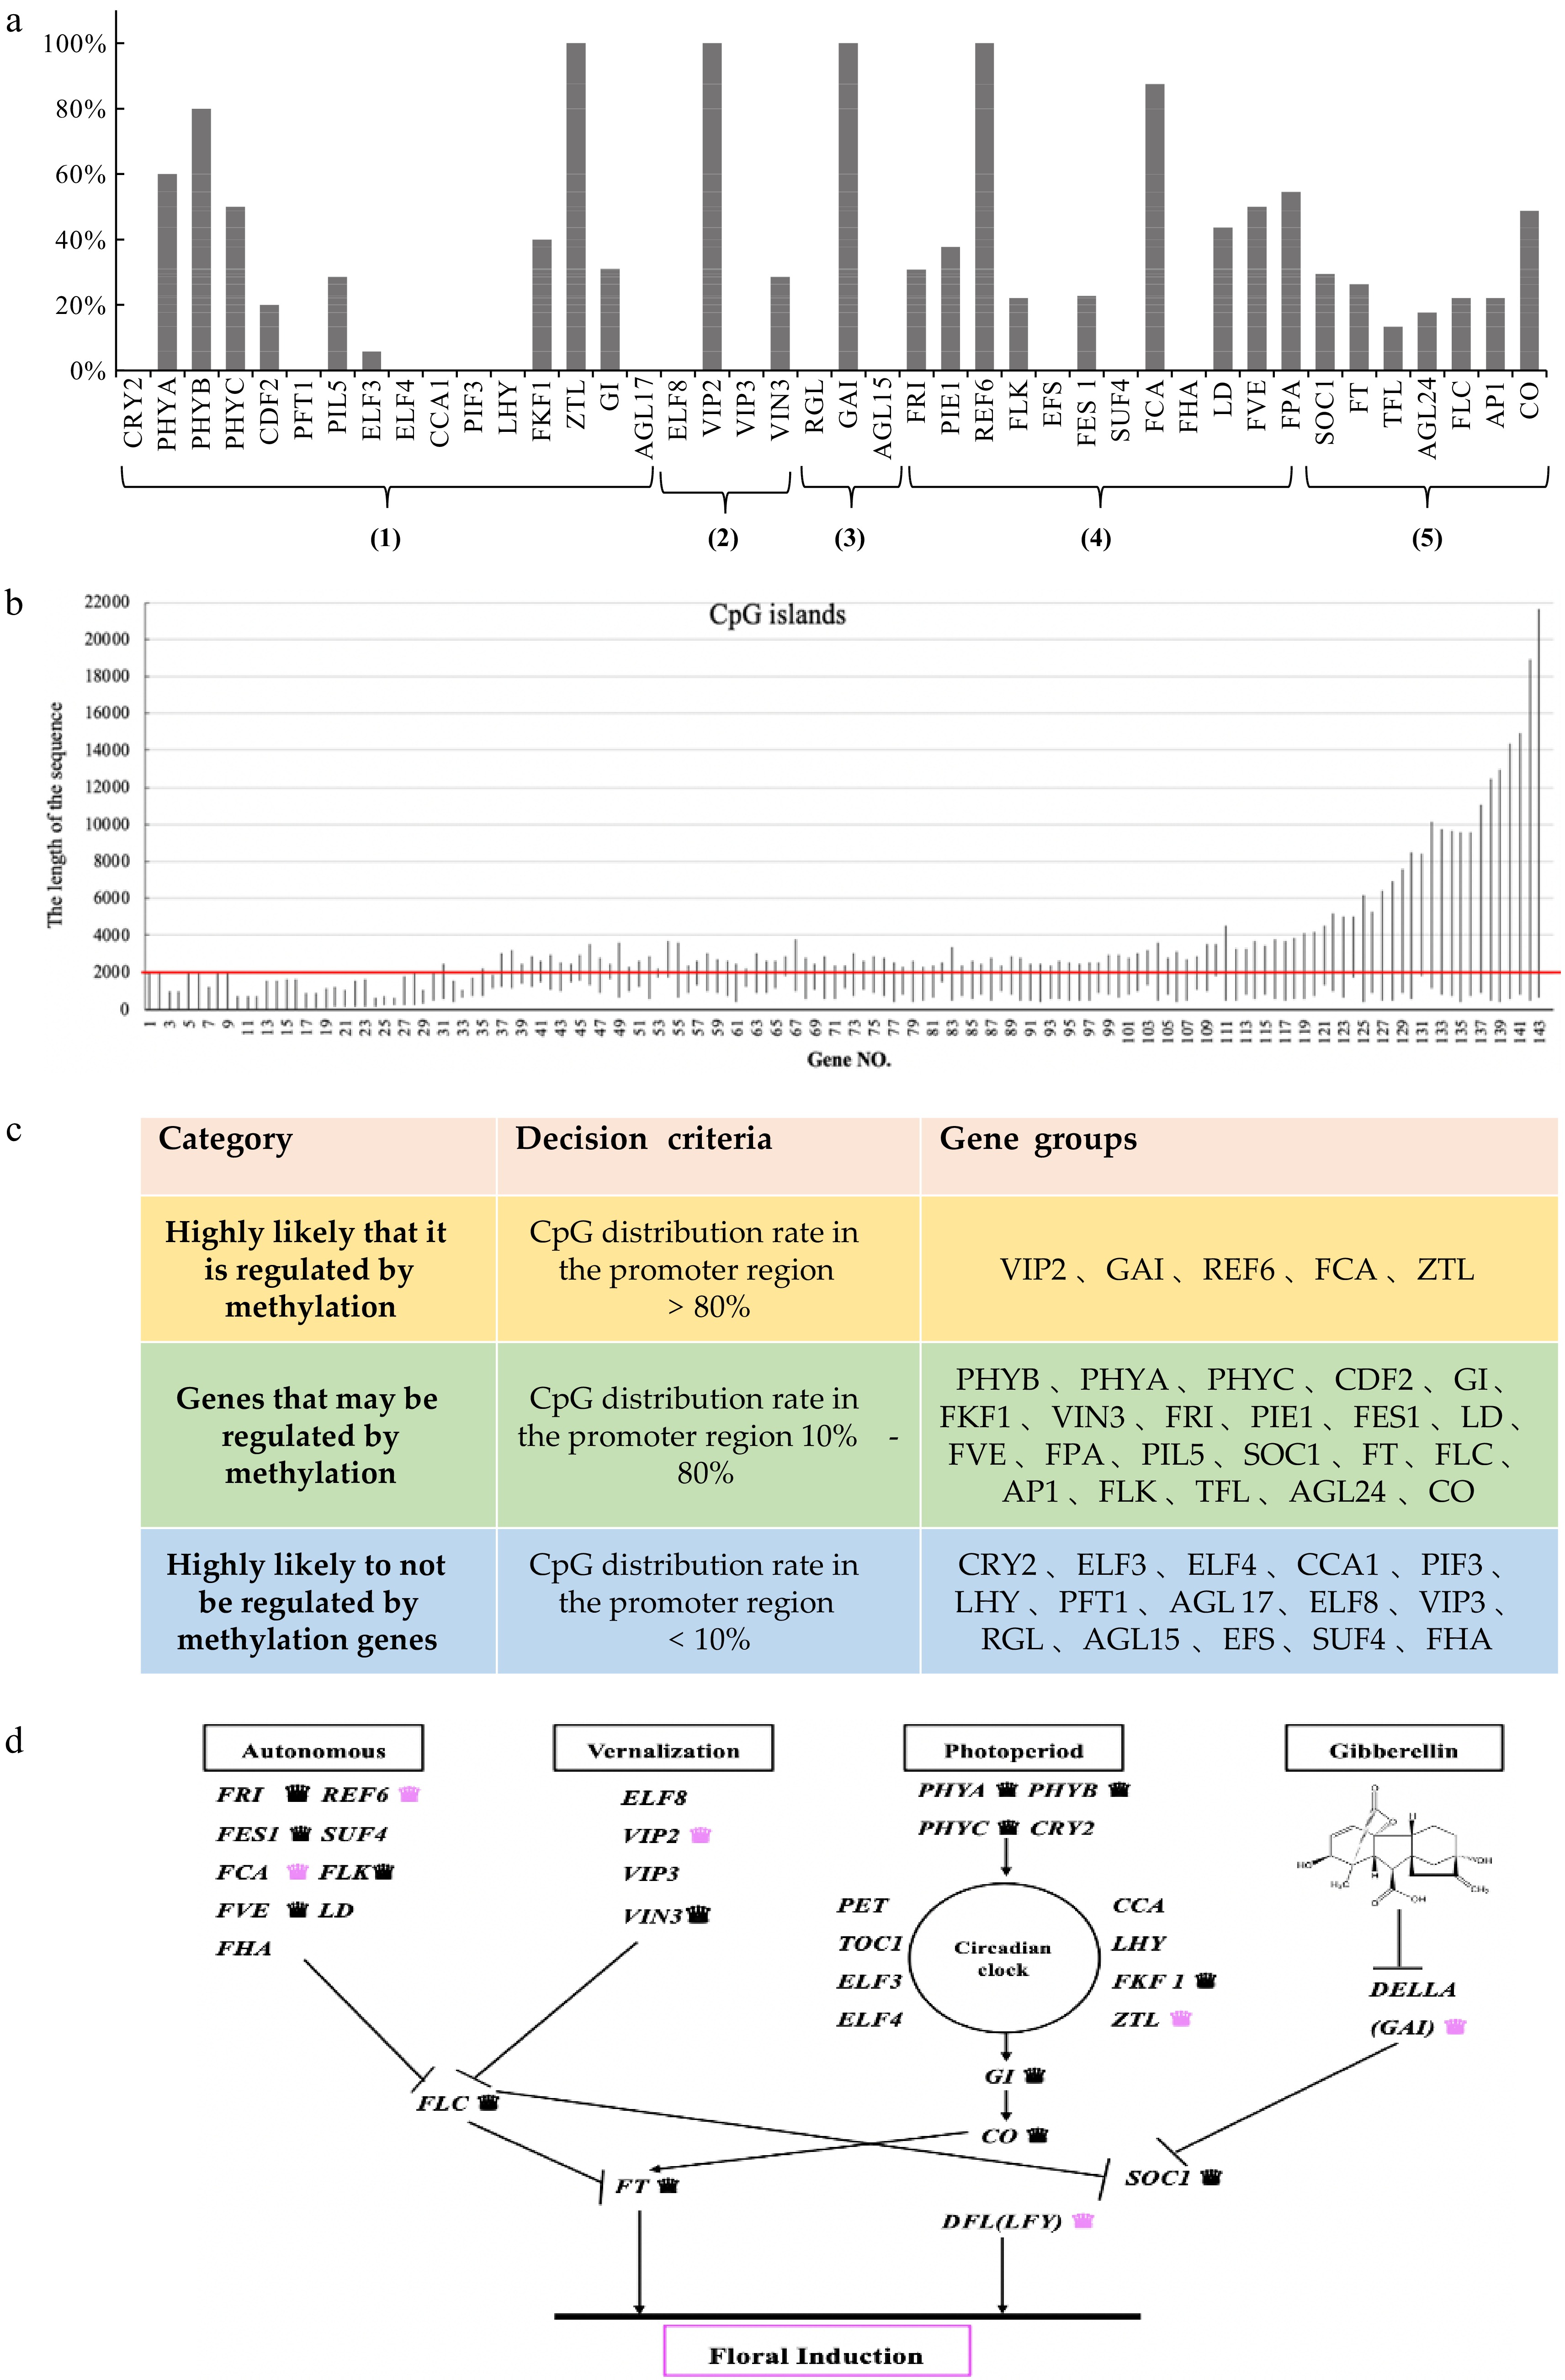
Figure 1.
Sequence analysis was used to analyse the flowering-related genes of C. lavandulifolium. (a) The percentage of CpG islands in the 42 homologous genes associated with flowering: (1) Photoperiod pathway; (2) Vernalization pathway; (3) GA pathway; (4) Autonomous pathway; (5) Floral pathway integrator. (b) CpG loci information of 143 genes in homologous genes. (c) Genetic classification based on the percentage of homologous CpG islands. (0−2,000 bp represents the promoter region). (d) Network of floral induction pathways in C. lavandulifolium (modified from Wang et al.[47]). Labelling of genes regulated by DNA methylation: black crowns refer to those that may be regulated by methylation genes, pink crowns refers to those highly likely regulated by methylation genes.
-
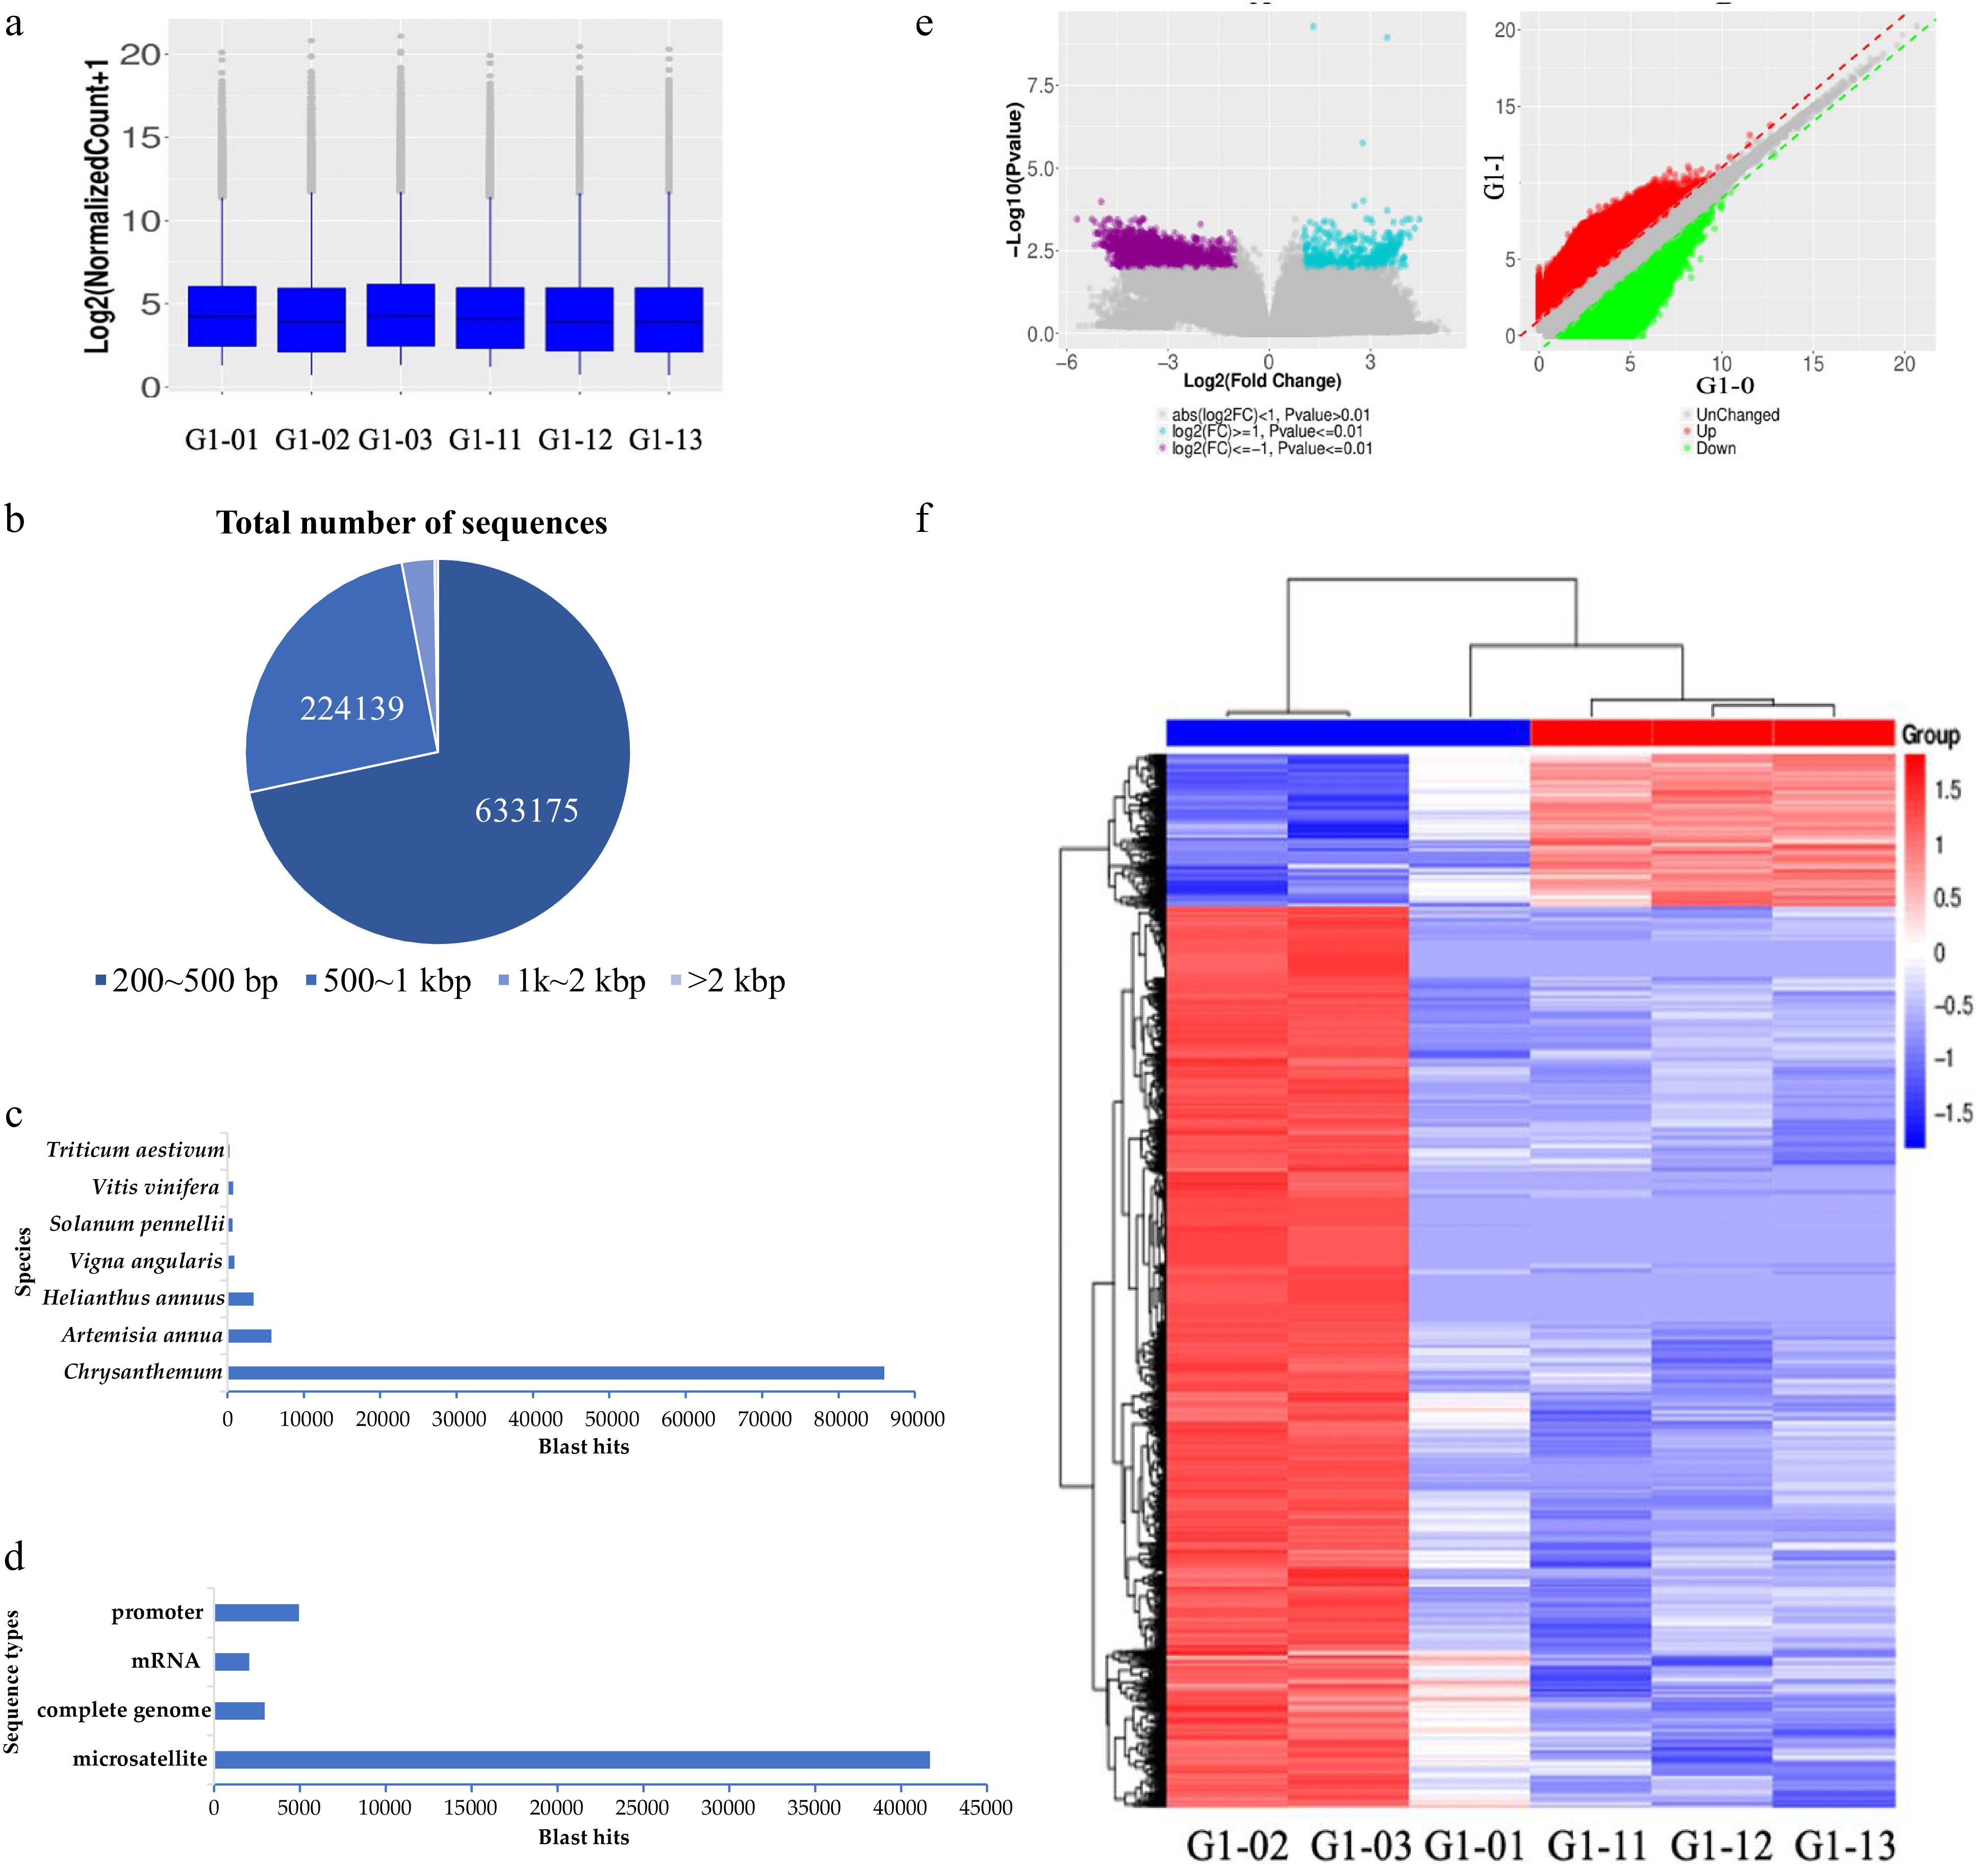
Figure 2.
MBD sequencing technology was used to screen the results of DNA methylated regulatory genes. (a) Boxplot of methylation levels for six samples. (b) The length distribution of nucleotides in MBD-seq sequencing results. (c) Nr annotation results in species statistics. (d) Nr annotation result sequence type statistics. (e, f) The volcano figure and heat map of differentially enriched genes between the seedling stage and bud stage.
-
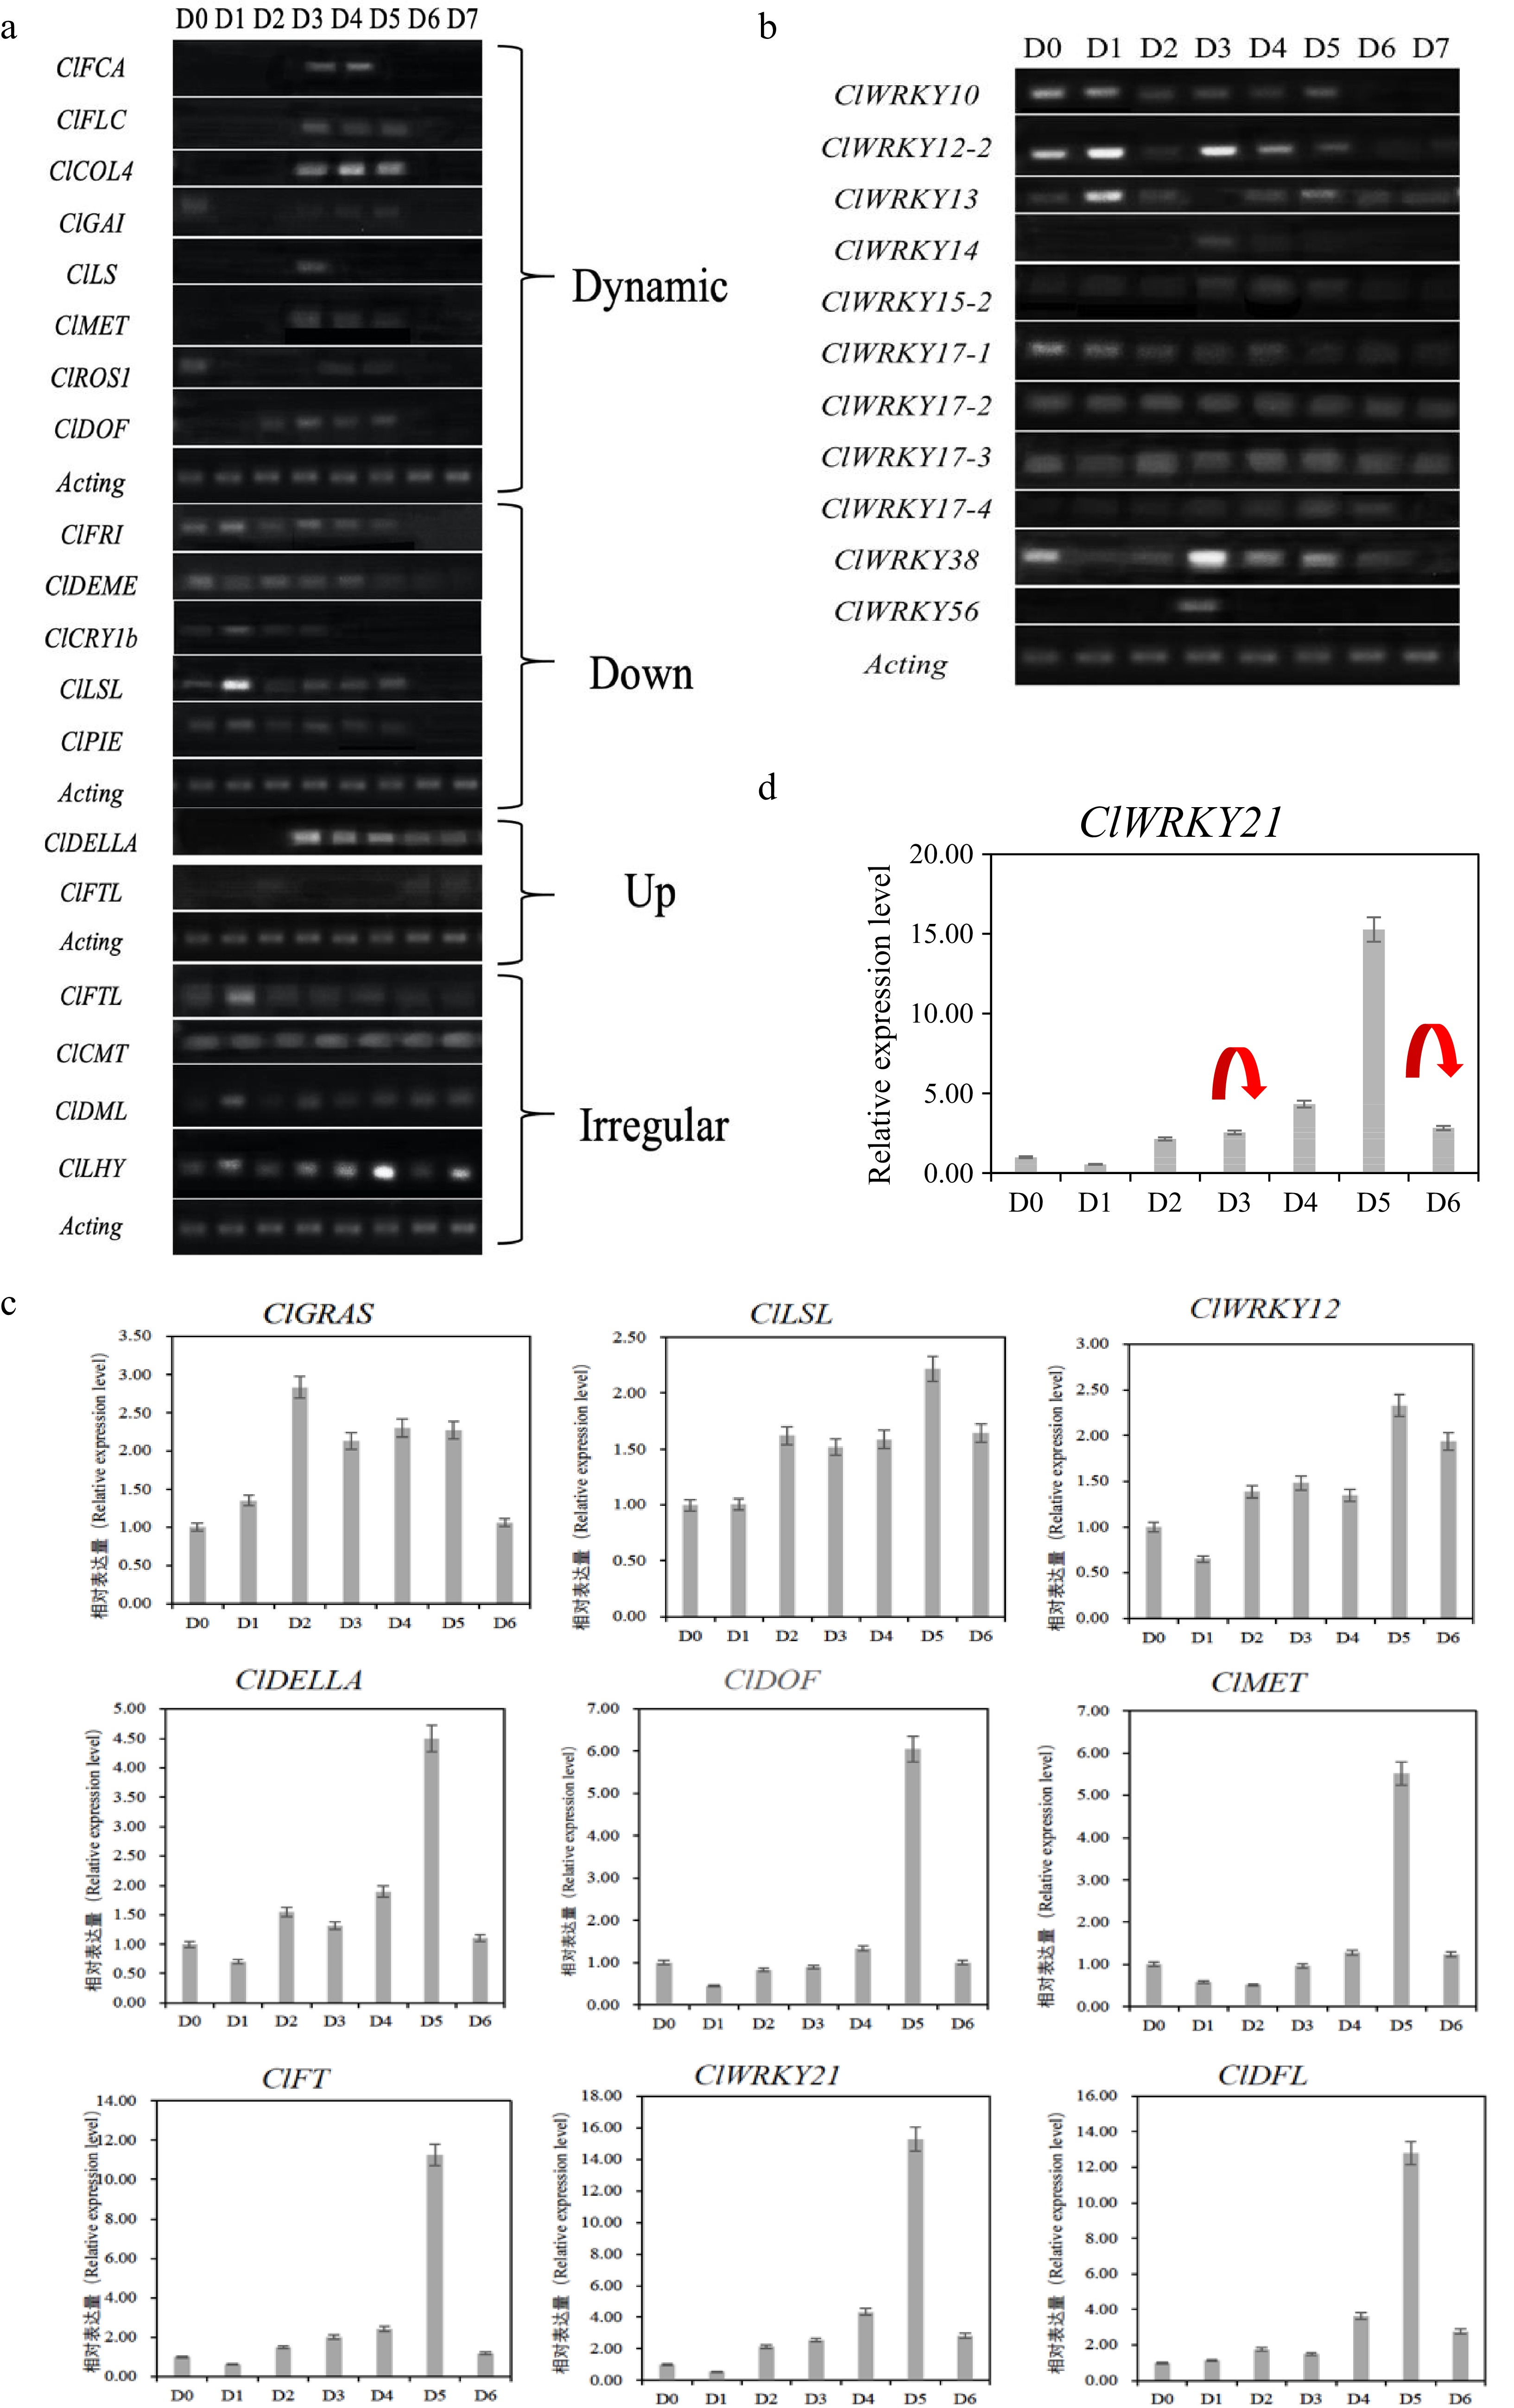
Figure 3.
The expression result of candidate genes in the floral induction process of Chrysanthemum lavandulifolium. (a) Dynamic changes of differentially expressed genes. (b) Differential expression screening of the WRKY gene family by RT-PCR. (c) Relative gene expression during floral induction of C. lavandulifolium. (d) Gene expression and DNA methylation status markers of ClWRKY21, the red arrows represent the disappearance of DNA methylation at this stage.
-
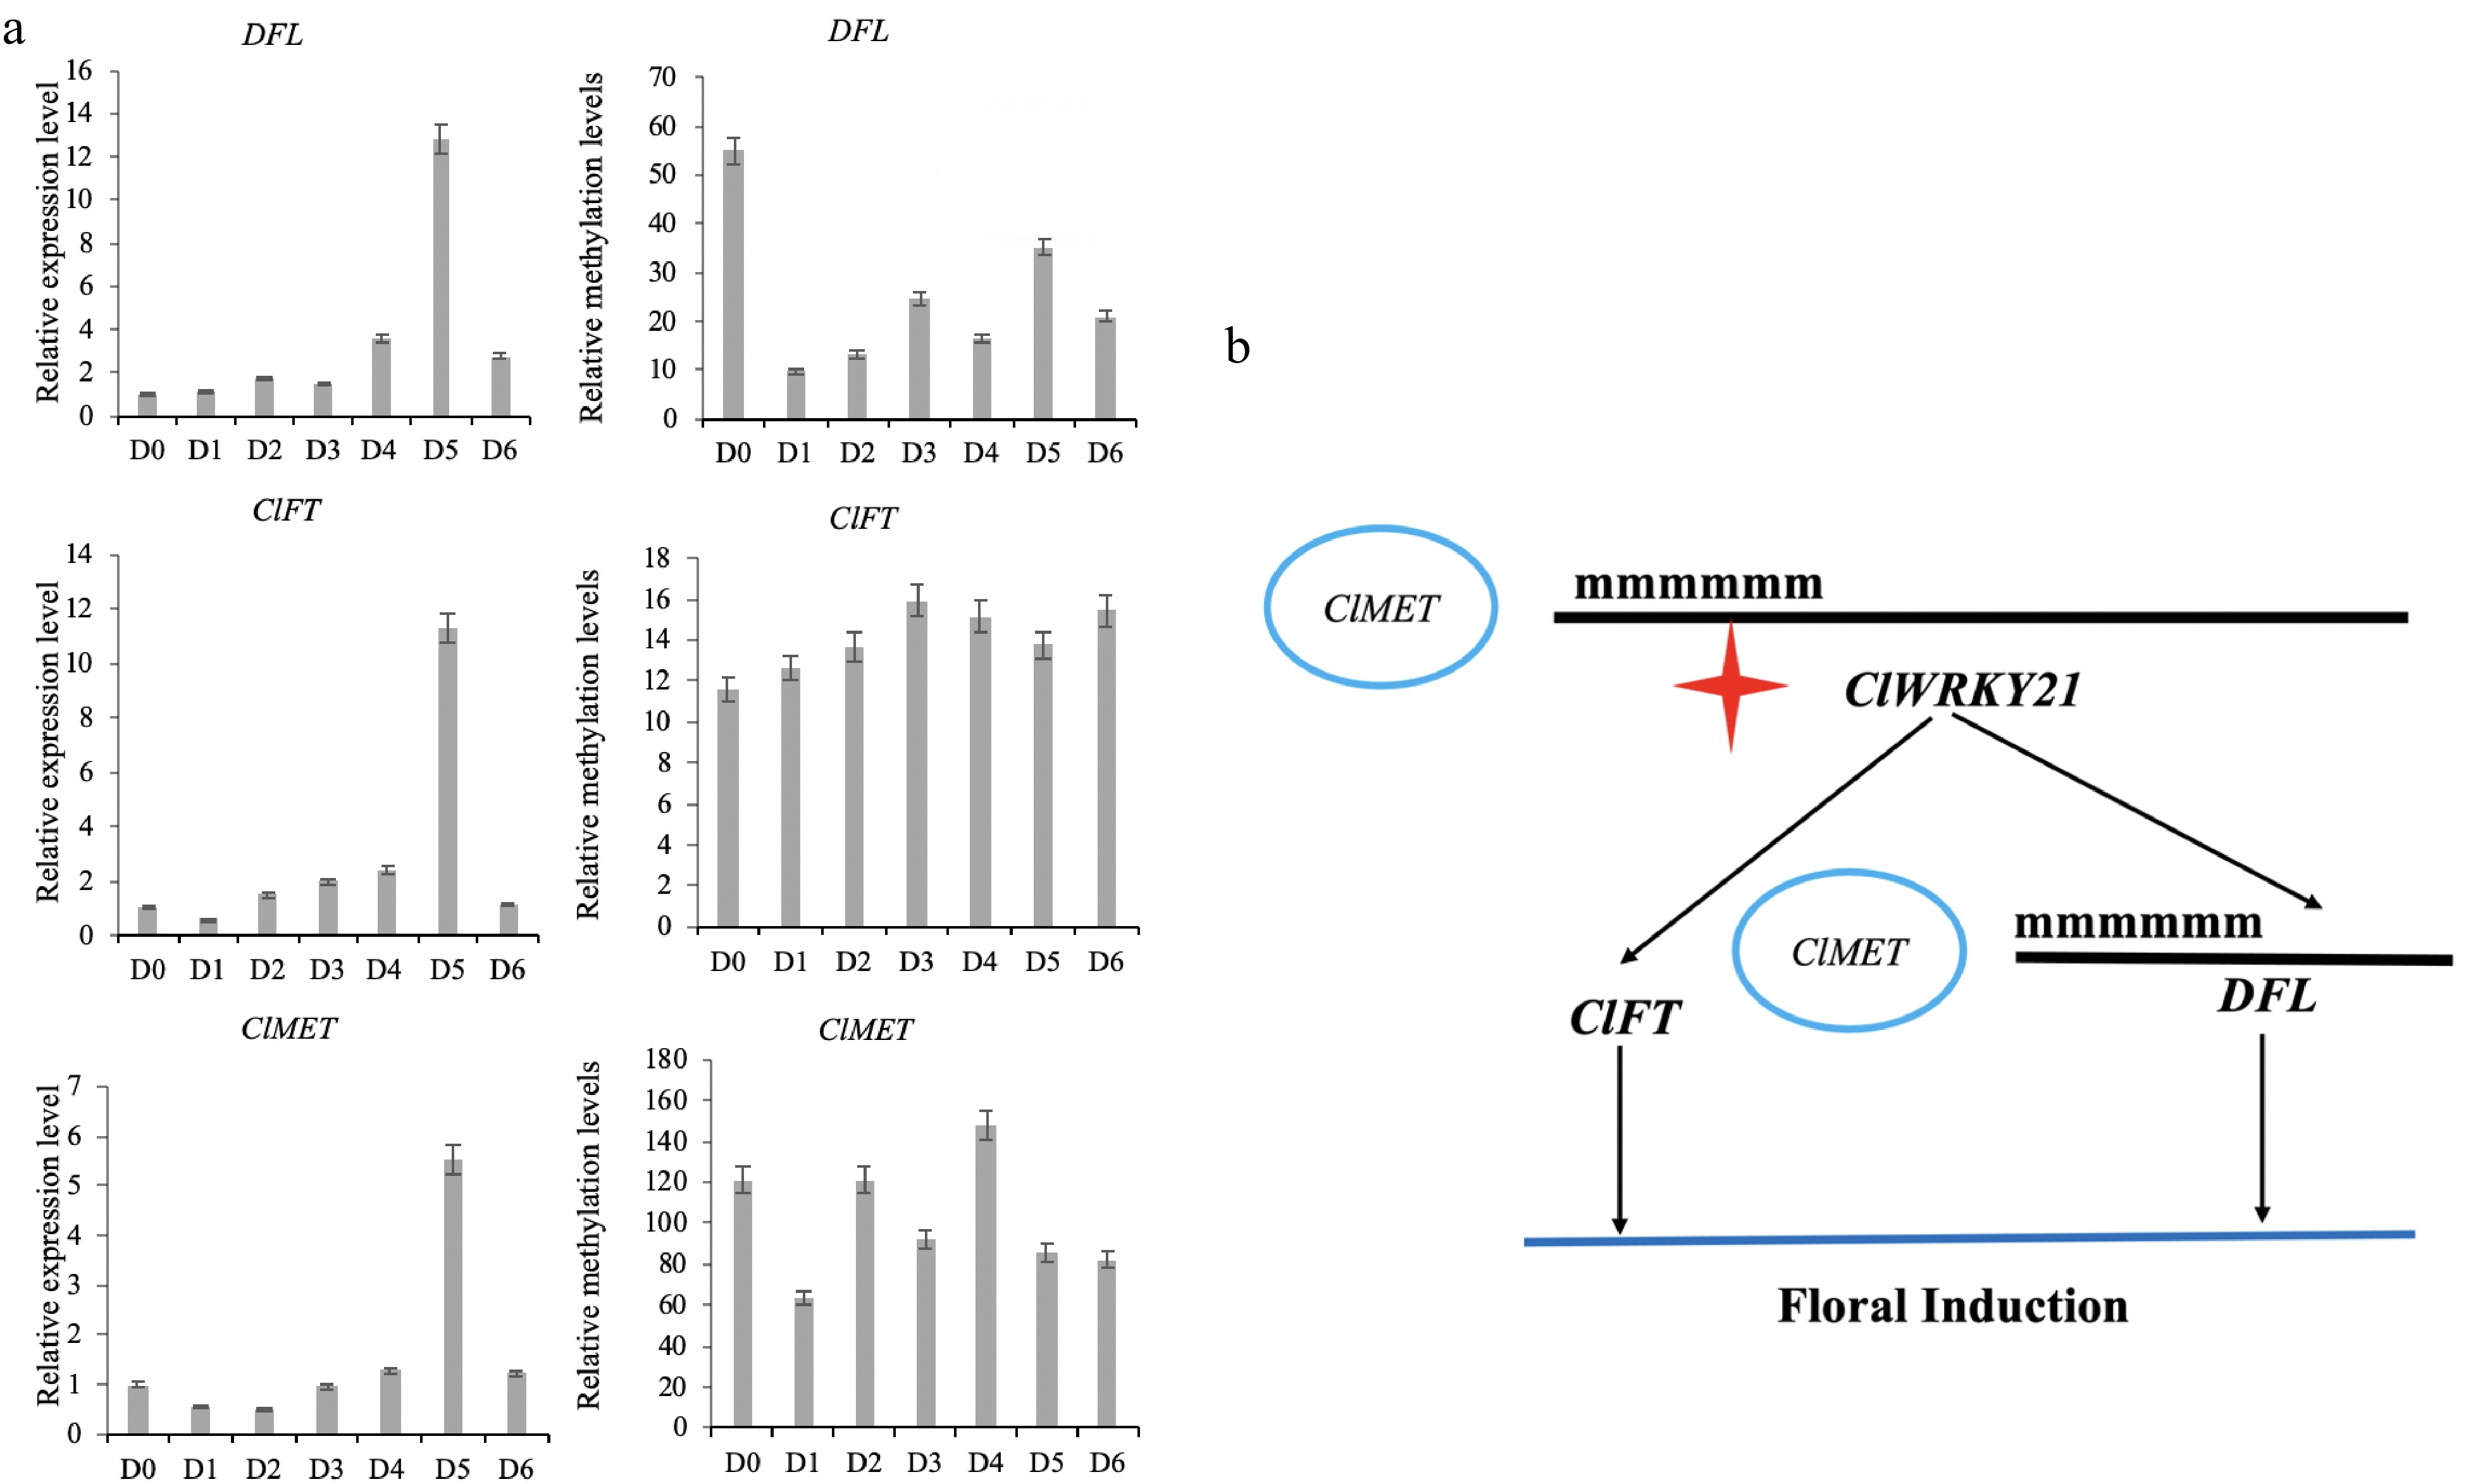
Figure 4.
The result of DNA methylation of key genes and construction of a floral induction network of C. lavandulifolium. (a) The expression level and methylation level of key flowering genes. (b) Role of the ClWRKY21 gene in floral induction of C. lavandulifolium.
-
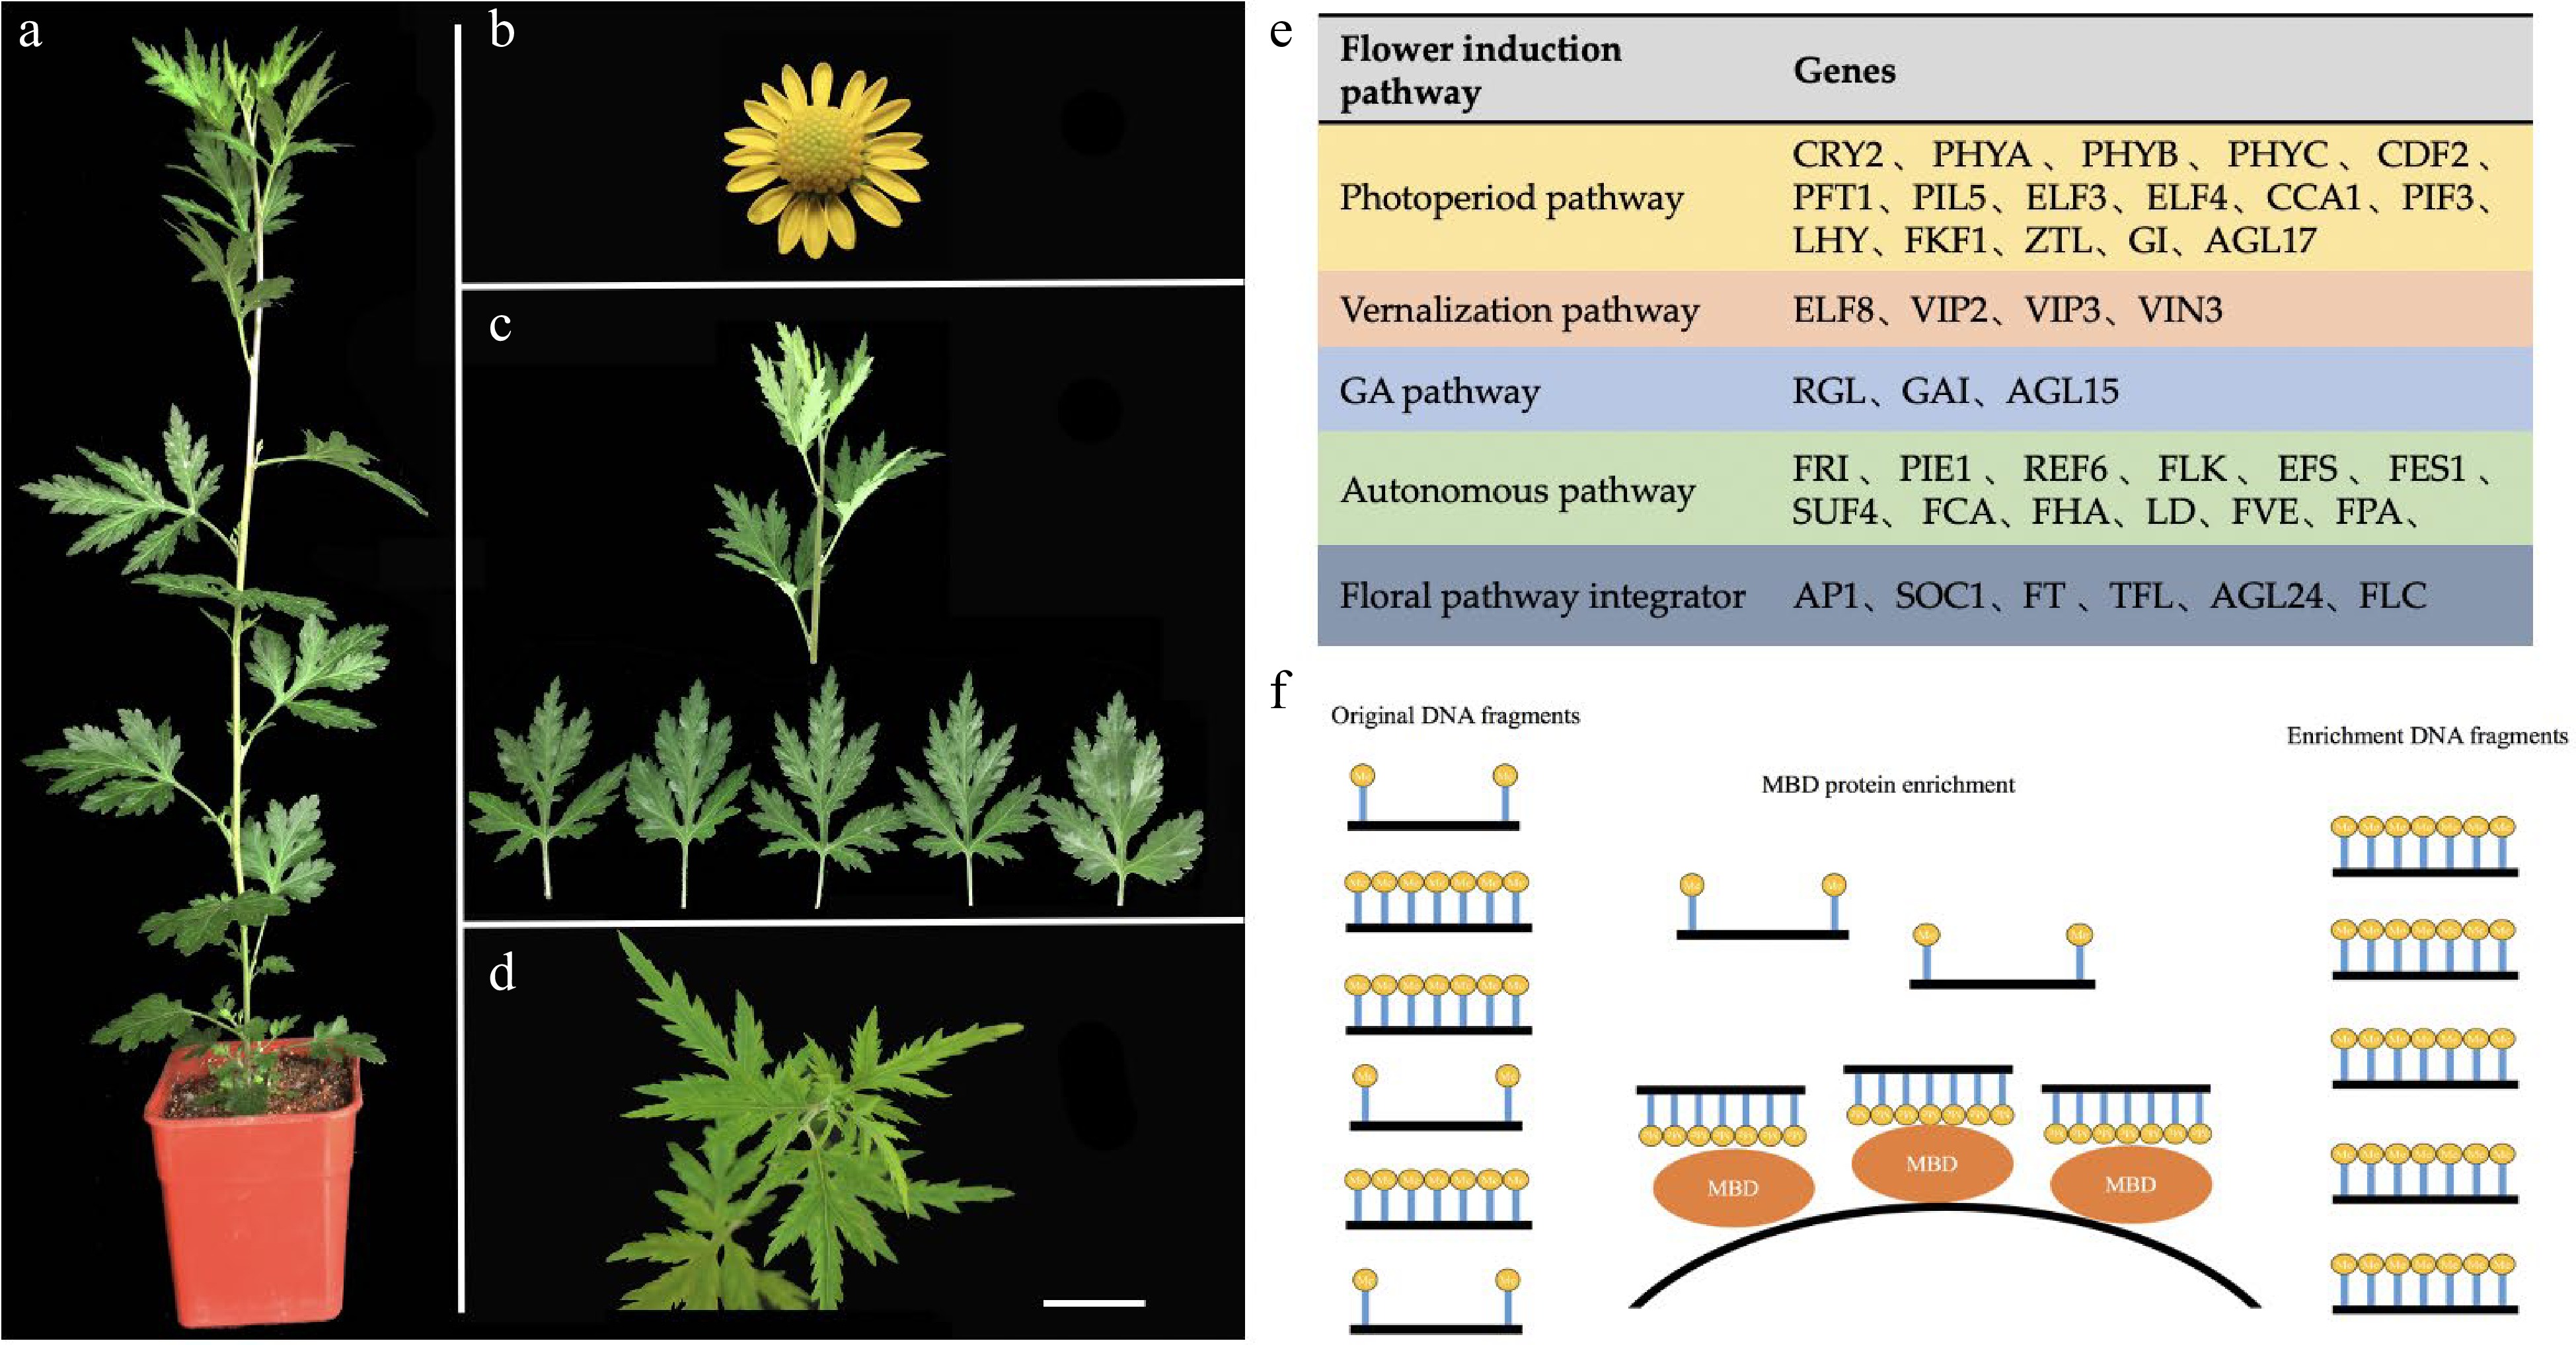
Figure 5.
Plant materials and genetic resources of Chrysanthemum lavandulifolium. (a) Mature plant with 14 leaves. (b) Capitulum. (c) Vegetative growth stage material (G1-0). (d) Bud stage material (G1-1). (e) Candidate gene resources for floral induction. (f) The model of MBD protein enrichment DNA fragment. MBD (methyl-CpG binding domain protein) can capture CpG-methylated dsDNA on beads and capture of dsDNA facilitates ligation of double-stranded adaptors for high-throughput sequencing. Bars = 1 cm.
-
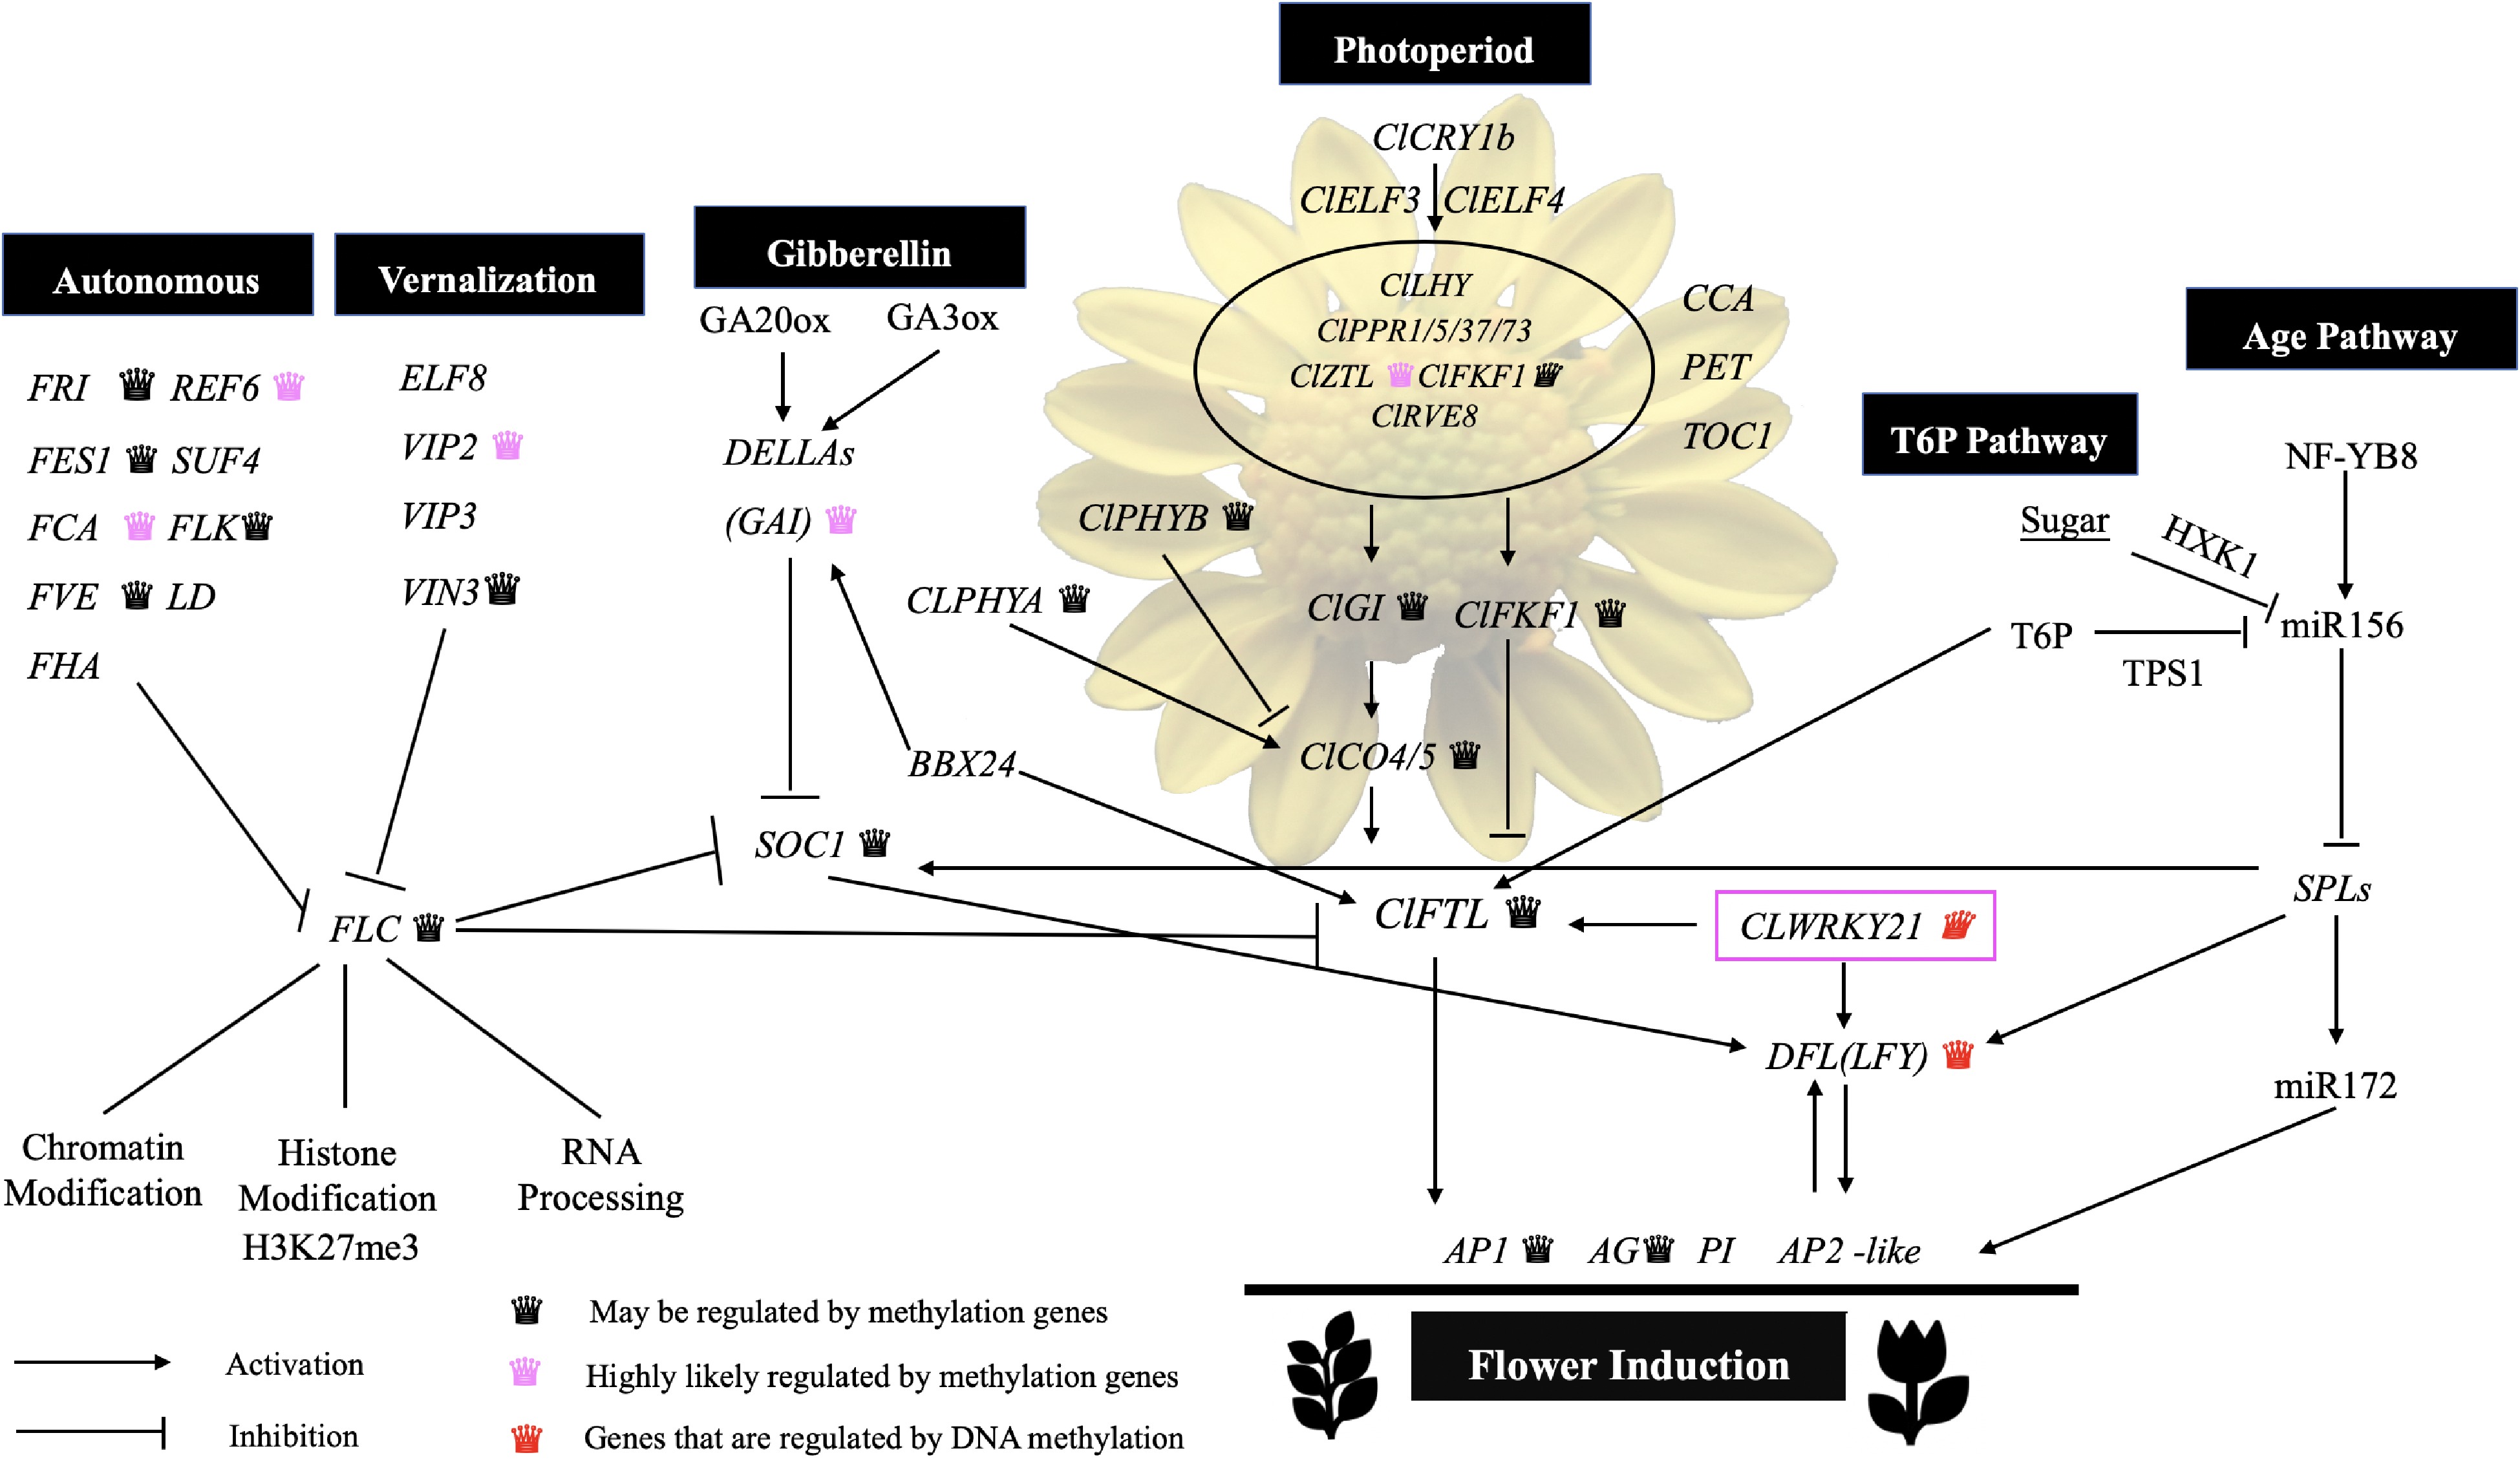
Figure 6.
Nodes in the gene regulatory network flower induction pathway may be regulated by DNA methylation.
-
Contig No. Species Nr annotation 7 Artemisia annua aldehyde reductase (DBR2) gene 2 Artemisia annua ALDH1 gene 2 Artemisia annua allene oxide cyclase (AOC) gene 12 Artemisia annua artemisinic aldehyde delta11(13) reductase (DBR2) gene 140 Artemisia annua C4-sterol methyl oxidase gene 1 Artemisia annua amorpha-4,11-diene 12-hydroxylase 2 Artemisia annua cytochrome P450 reductase (CPR) gene 24 Artemisia annua epi-cedrol synthase gene 5 Artemisia annua linalool synthase (LS) gene 1 Artemisia annua WRKY-like transcription factor gene Table 1.
The result of enrichment of promoter difference sequence.
-
Contig No. Species Nr annotation 1 Artemisia annua cytochrome P450 mono-oxygenase (cyp03) 1 Artemisia annua DELLA protein (DELLA) 1 Chrysanthemum × morifolium ChlH mRNA for magnesium chelatase subunit H 1 Chrysanthemum × morifolium DOF transcription factor 17 1 Chrysanthemum × morifolium GRAS protein (GRAS17) 1 Chrysanthemum x morifolium GRAS protein (GRAS3) mRNA, 1 Chrysanthemum × morifolium HD-ZIP protein (HB15) 1 Chrysanthemum × morifolium nitrate transporter 2.3 3 Chrysanthemum × morifolium trihelix protein (TH11) 6 Gymnocladus dioica succinate dehydrogenase subunit 4 (sdh4) 1 Helianthus annuus knotted-1-like protein 2 1 Medicago truncatula SPRY domain protein 1 Morus notabilis Calcium-transporting ATPase 2 1 Nicotiana tabacum S-adenosyl-L-homocysteine hydrolase (SAHH3) 1 Arachis duranensis tubulin alpha-4 chain 1 Beta vulgaris alanine--tRNA ligase 1 Beta vulgaris UDP-glucuronate 4-epimerase 6 1 Beta vulgaris zinc finger MYM-type protein 1-like 1 Brassica rapa 1-aminocyclopropane-1-carboxylate synthase 5 1 Brassica rapa condensin complex subunit 2 1 Camelina sativa L-ascorbate oxidase homolog 1 Capsicum annuum ABC transporter F family member 1 1 Capsicum annuum chaperone protein dnaJ 11 1 Capsicum annuum probable pectate lyase 8 1 Citrus sinensis F-box/kelch-repeat protein 1 Daucus carota E3 ubiquitin-protein ligase UPL1 1 Daucus carota ESCRT-related protein CHMP1B 1 Daucus carota inositol-tetrakisphosphate 1-kinase 1-like 1 Drosophila ficusphila glycine-rich cell wall structural protein 1.0 1 Erythranthe guttatus DNA topoisomerase 2 1 Fragaria vesca transcription factor MYB46 1 Gossypium hirsutum heat shock protein-like 1 Jatropha curcas ABC transporter C family member 4 1 Malus x domestica pectinesterase 3-like 1 Nicotiana sylvestris probable methyltransferase PMT11 1 Phoenix dactylifera MYB44 1 Ricinus communis ATP synthase subunit a 1 Sesamum indicum glycylpeptide N-tetradecanoyltransferase 1-like 1 Solanum tuberosum transcription elongation factor SPT5 Table 2.
Results for the enrichment of mRNA difference sequence.
-
Genes Type of methylation analysis CpG islands Promoter mRNA Enrichment of differences WRKY transcription factors family 40.00% Yes Yes Yes GRAS protein family 61.29% − Yes Yes DOF transcription factors family 38.13% − Yes Yes DELLA protein family 100.00% Yes Yes LEAFY 100.00% Yes − − FT 26.32% Yes − GI 31.03% Yes − PHYA 60.00% Yes − Table 3.
Summary and analysis of key candidate genes in C. lavandulifolium.
-
Type Gene name Flowering induction stage Conclusion D0 D1 D2 D3 D4 D5 D6 Quantitative change ClFT-M + + + + + + + Both ClFT- U + + + + + + + DFL-M + + + + + + + Both DFL- U + + + + + + + ClMET-M + + + + + + + Both ClMET- U + + + + + + + Toqualitative change ClWRKY12-M × × × × × × × Unmethylation ClWRKY12- U + + + + + + + ClWRKY17-M + + + + + × + Dynamic change ClWRKY17- U + + + + + + + ClWRKY21-M + + × + + + × Dynamic change ClWRKY21- U + + + + + + + Table 4.
MSP results and DNA methylation status analysis.
Figures
(6)
Tables
(4)