-
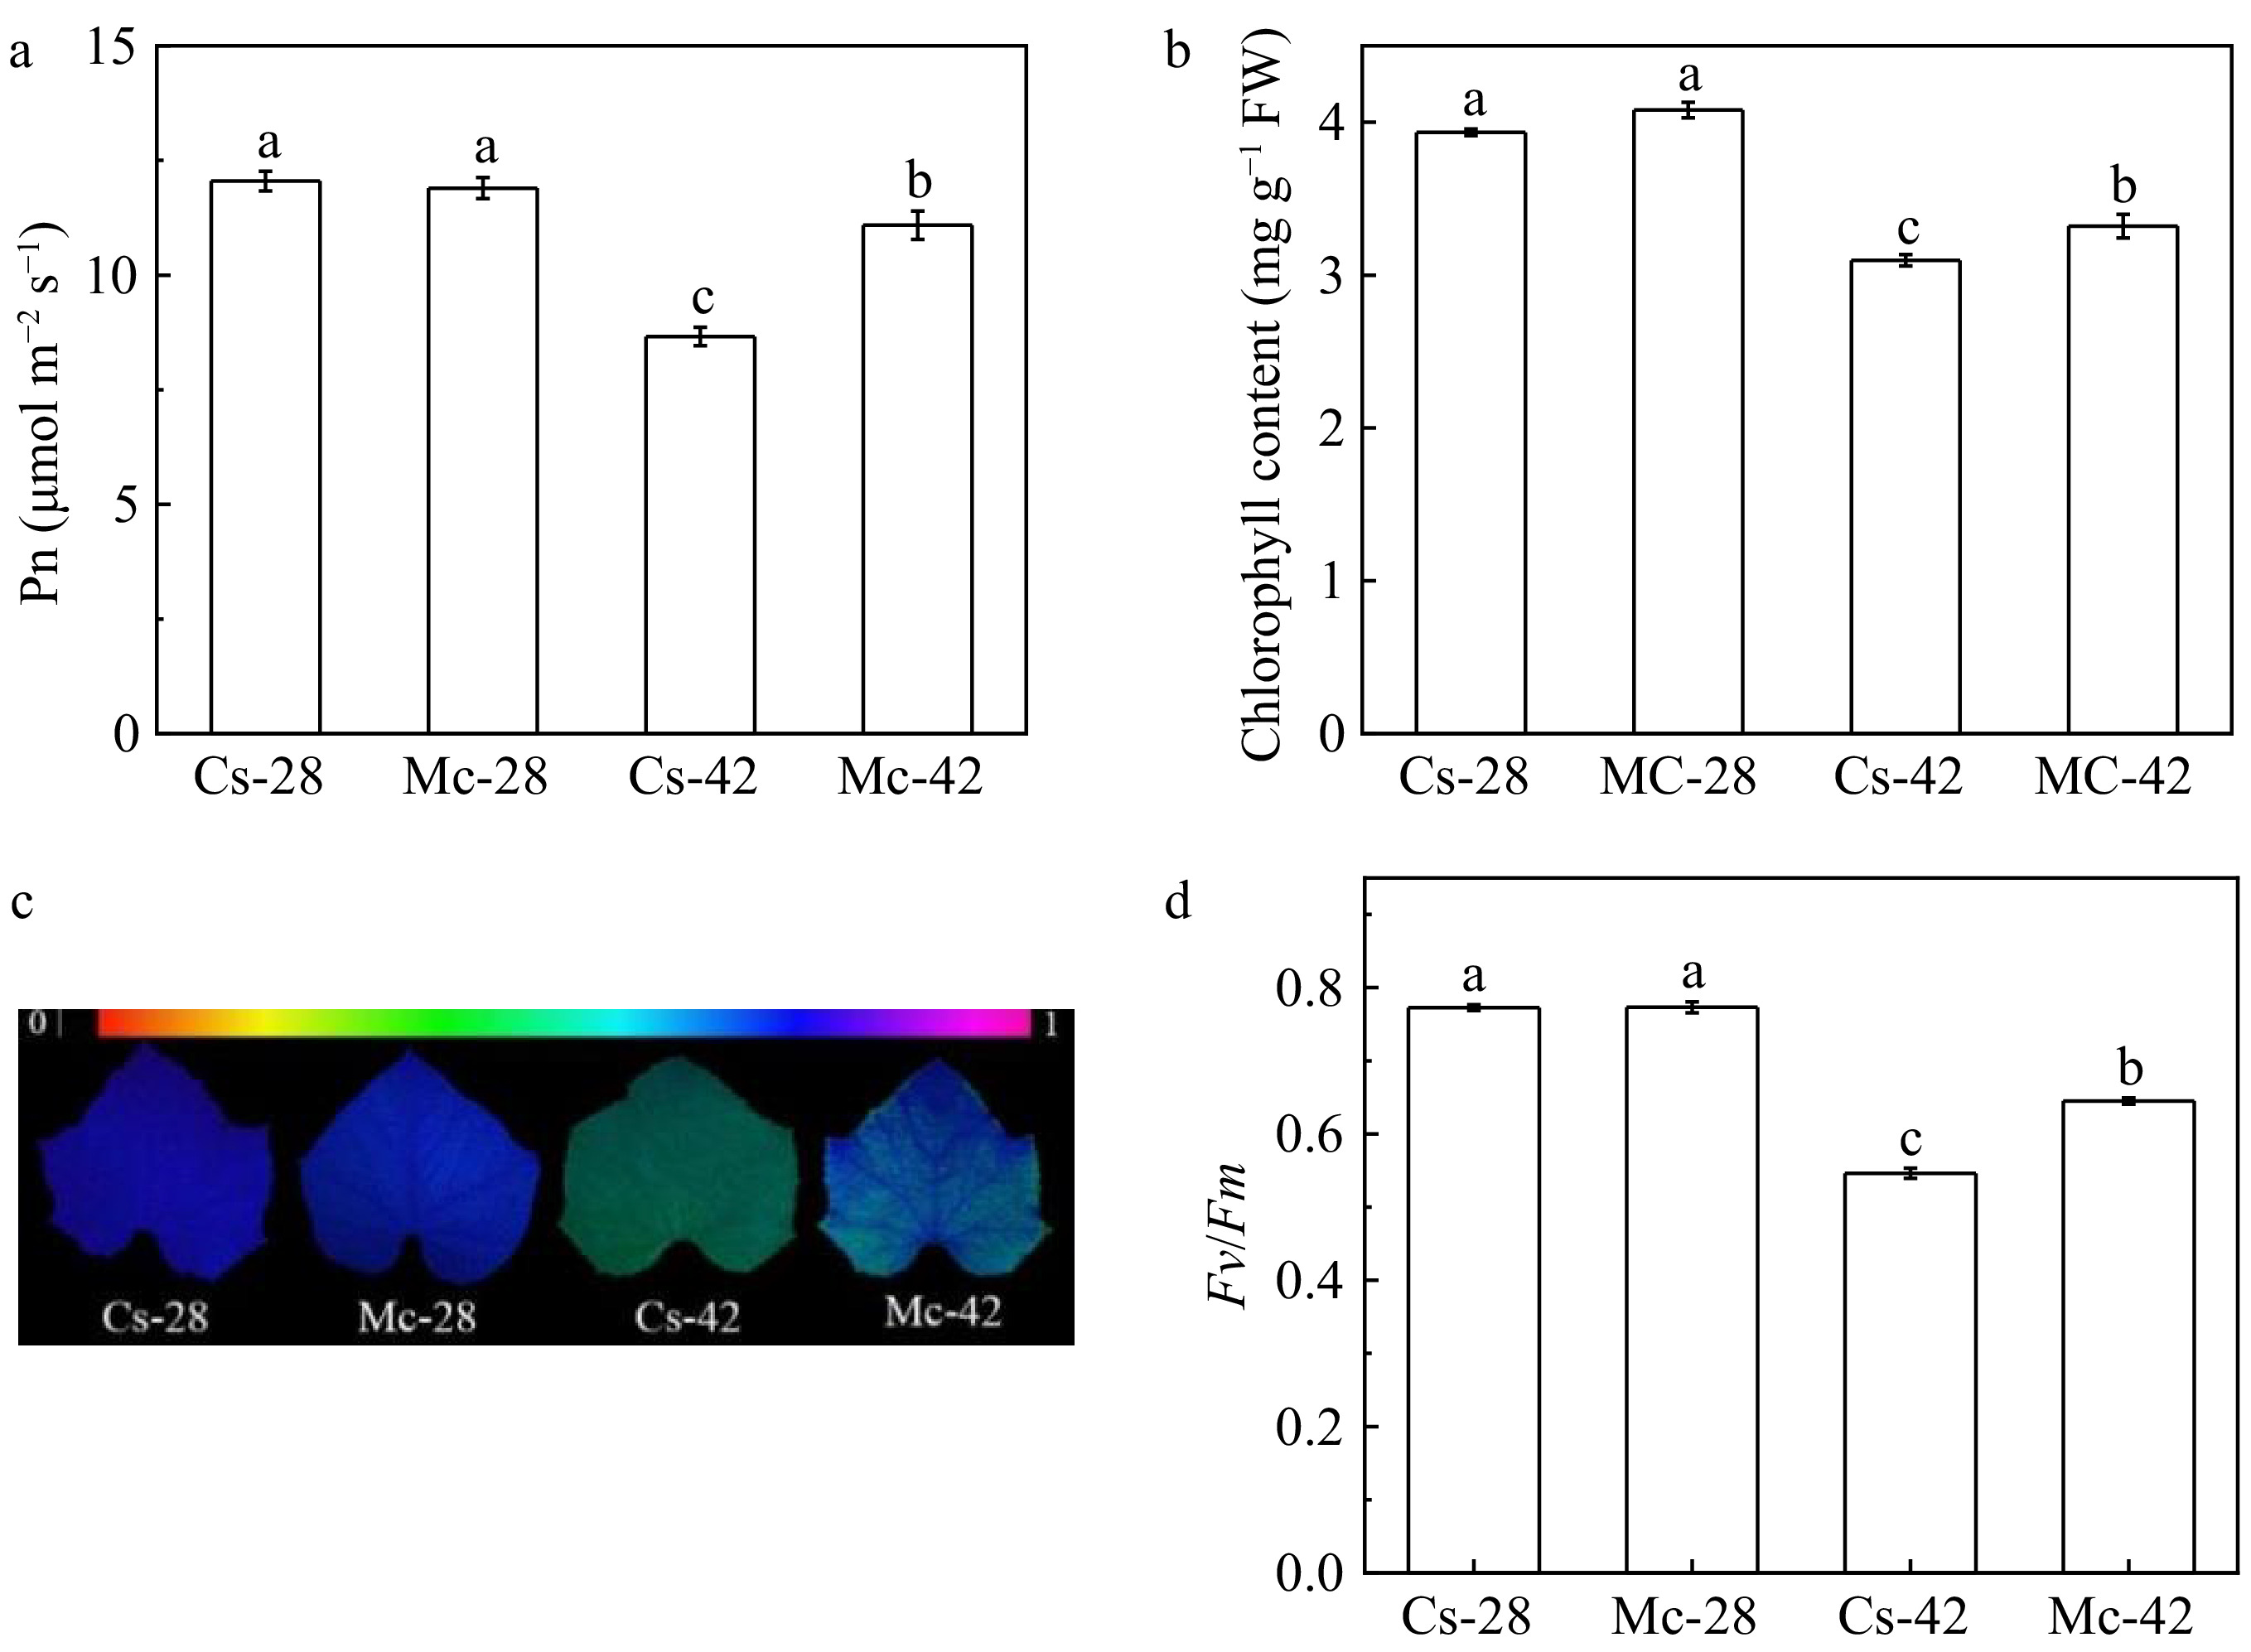
Figure 1.
Effects of heat stress on grafted cucumber plants on (a) net photosynthetic rate, (b) chlorophyll content, (c) images of the maximum photochemical efficiency of PSII, (d) the quantity of the maximum photochemical efficiency of PSII (Fv/Fm). The data of Pn was measured at 48 h after heat treatment, and the data of chlorophyll content and Fv/Fm were measured at 48 h and 24 h after heat treatment, respectively. All data are presented as means of three biological replicates (± SE). Means with different letters indicate significant differences at p < 0.05 according to Duncan's multiple range test. Three independent experiments were performed with similar results.
-
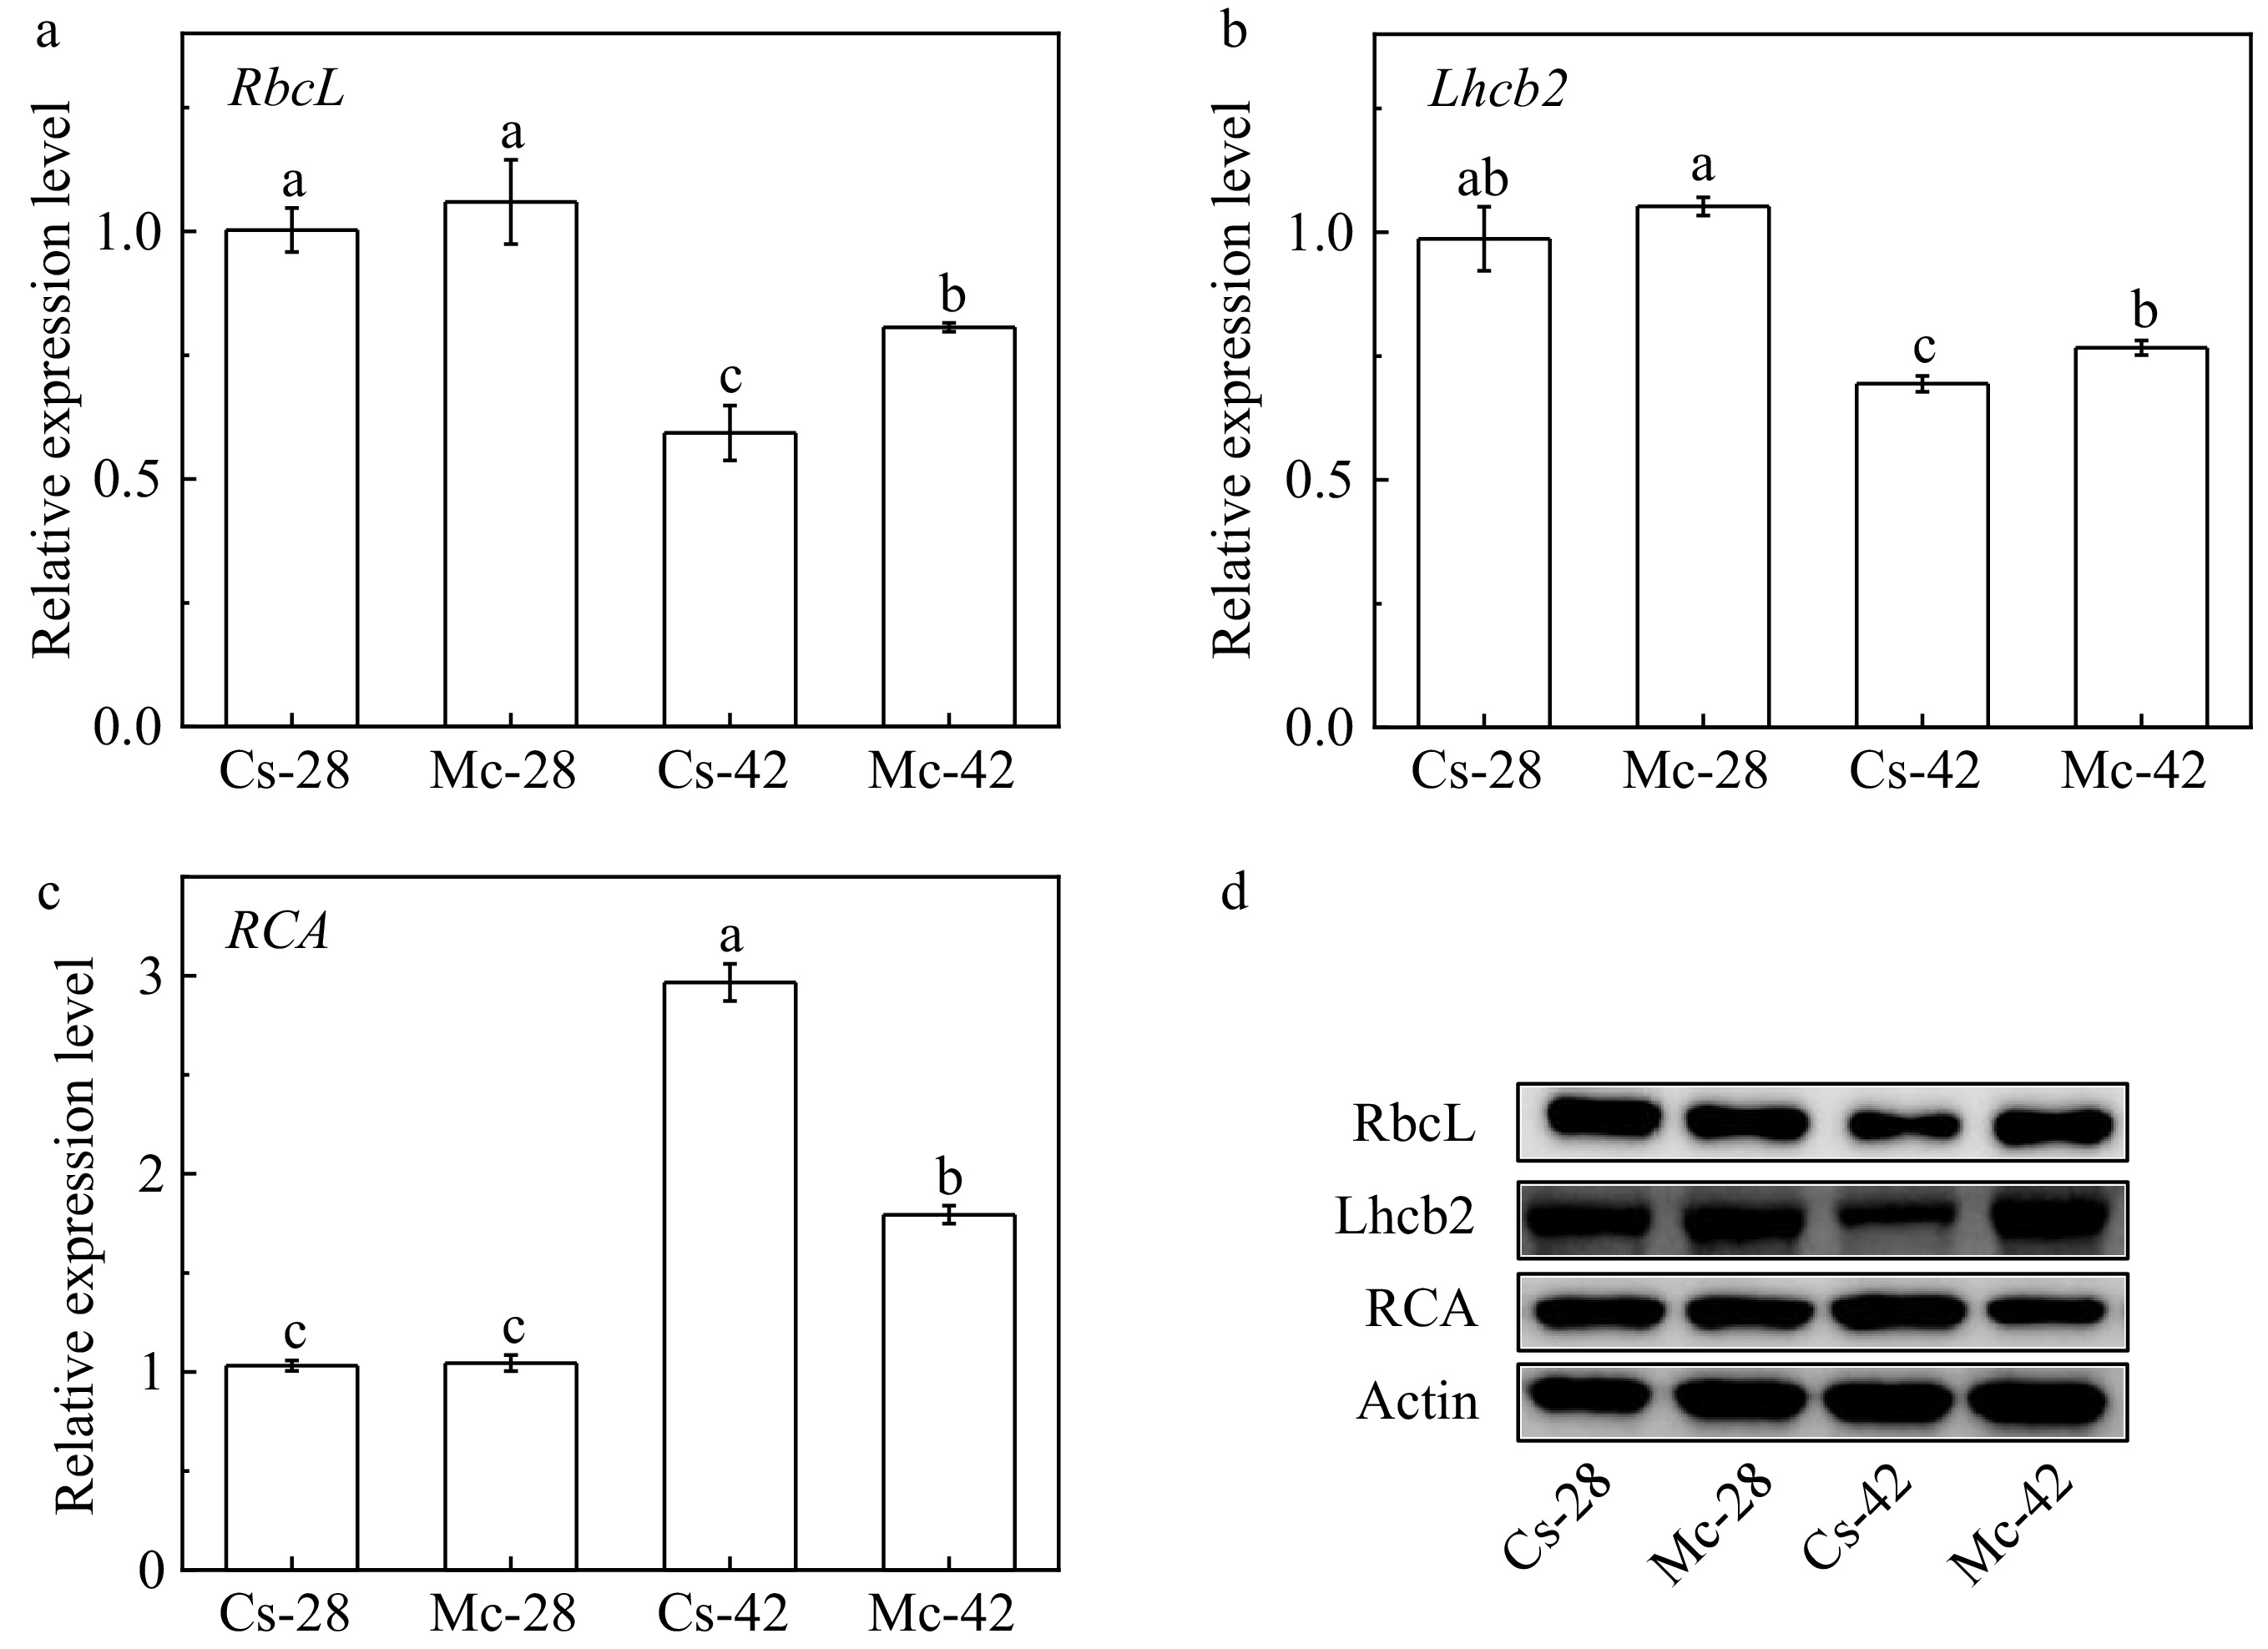
Figure 2.
Effects of bitter gourd rootstock on the expression of RbcL, Lhcb2 and RCA genes and their protein abundance in leaves of cucumber under heat stress. (a) The expression level of RbcL genes. (b) The expression level of Lhcb2 genes. (c) The expression level of RCA genes. (d) The expression level of RbcL, Lhcb2 and RCA proteins. Each bar represents a mean ± SE of three independent experiments. Means followed by different letters indicate significant differences between treatments (p < 0.05) according to Duncan's multiple range tests.
-
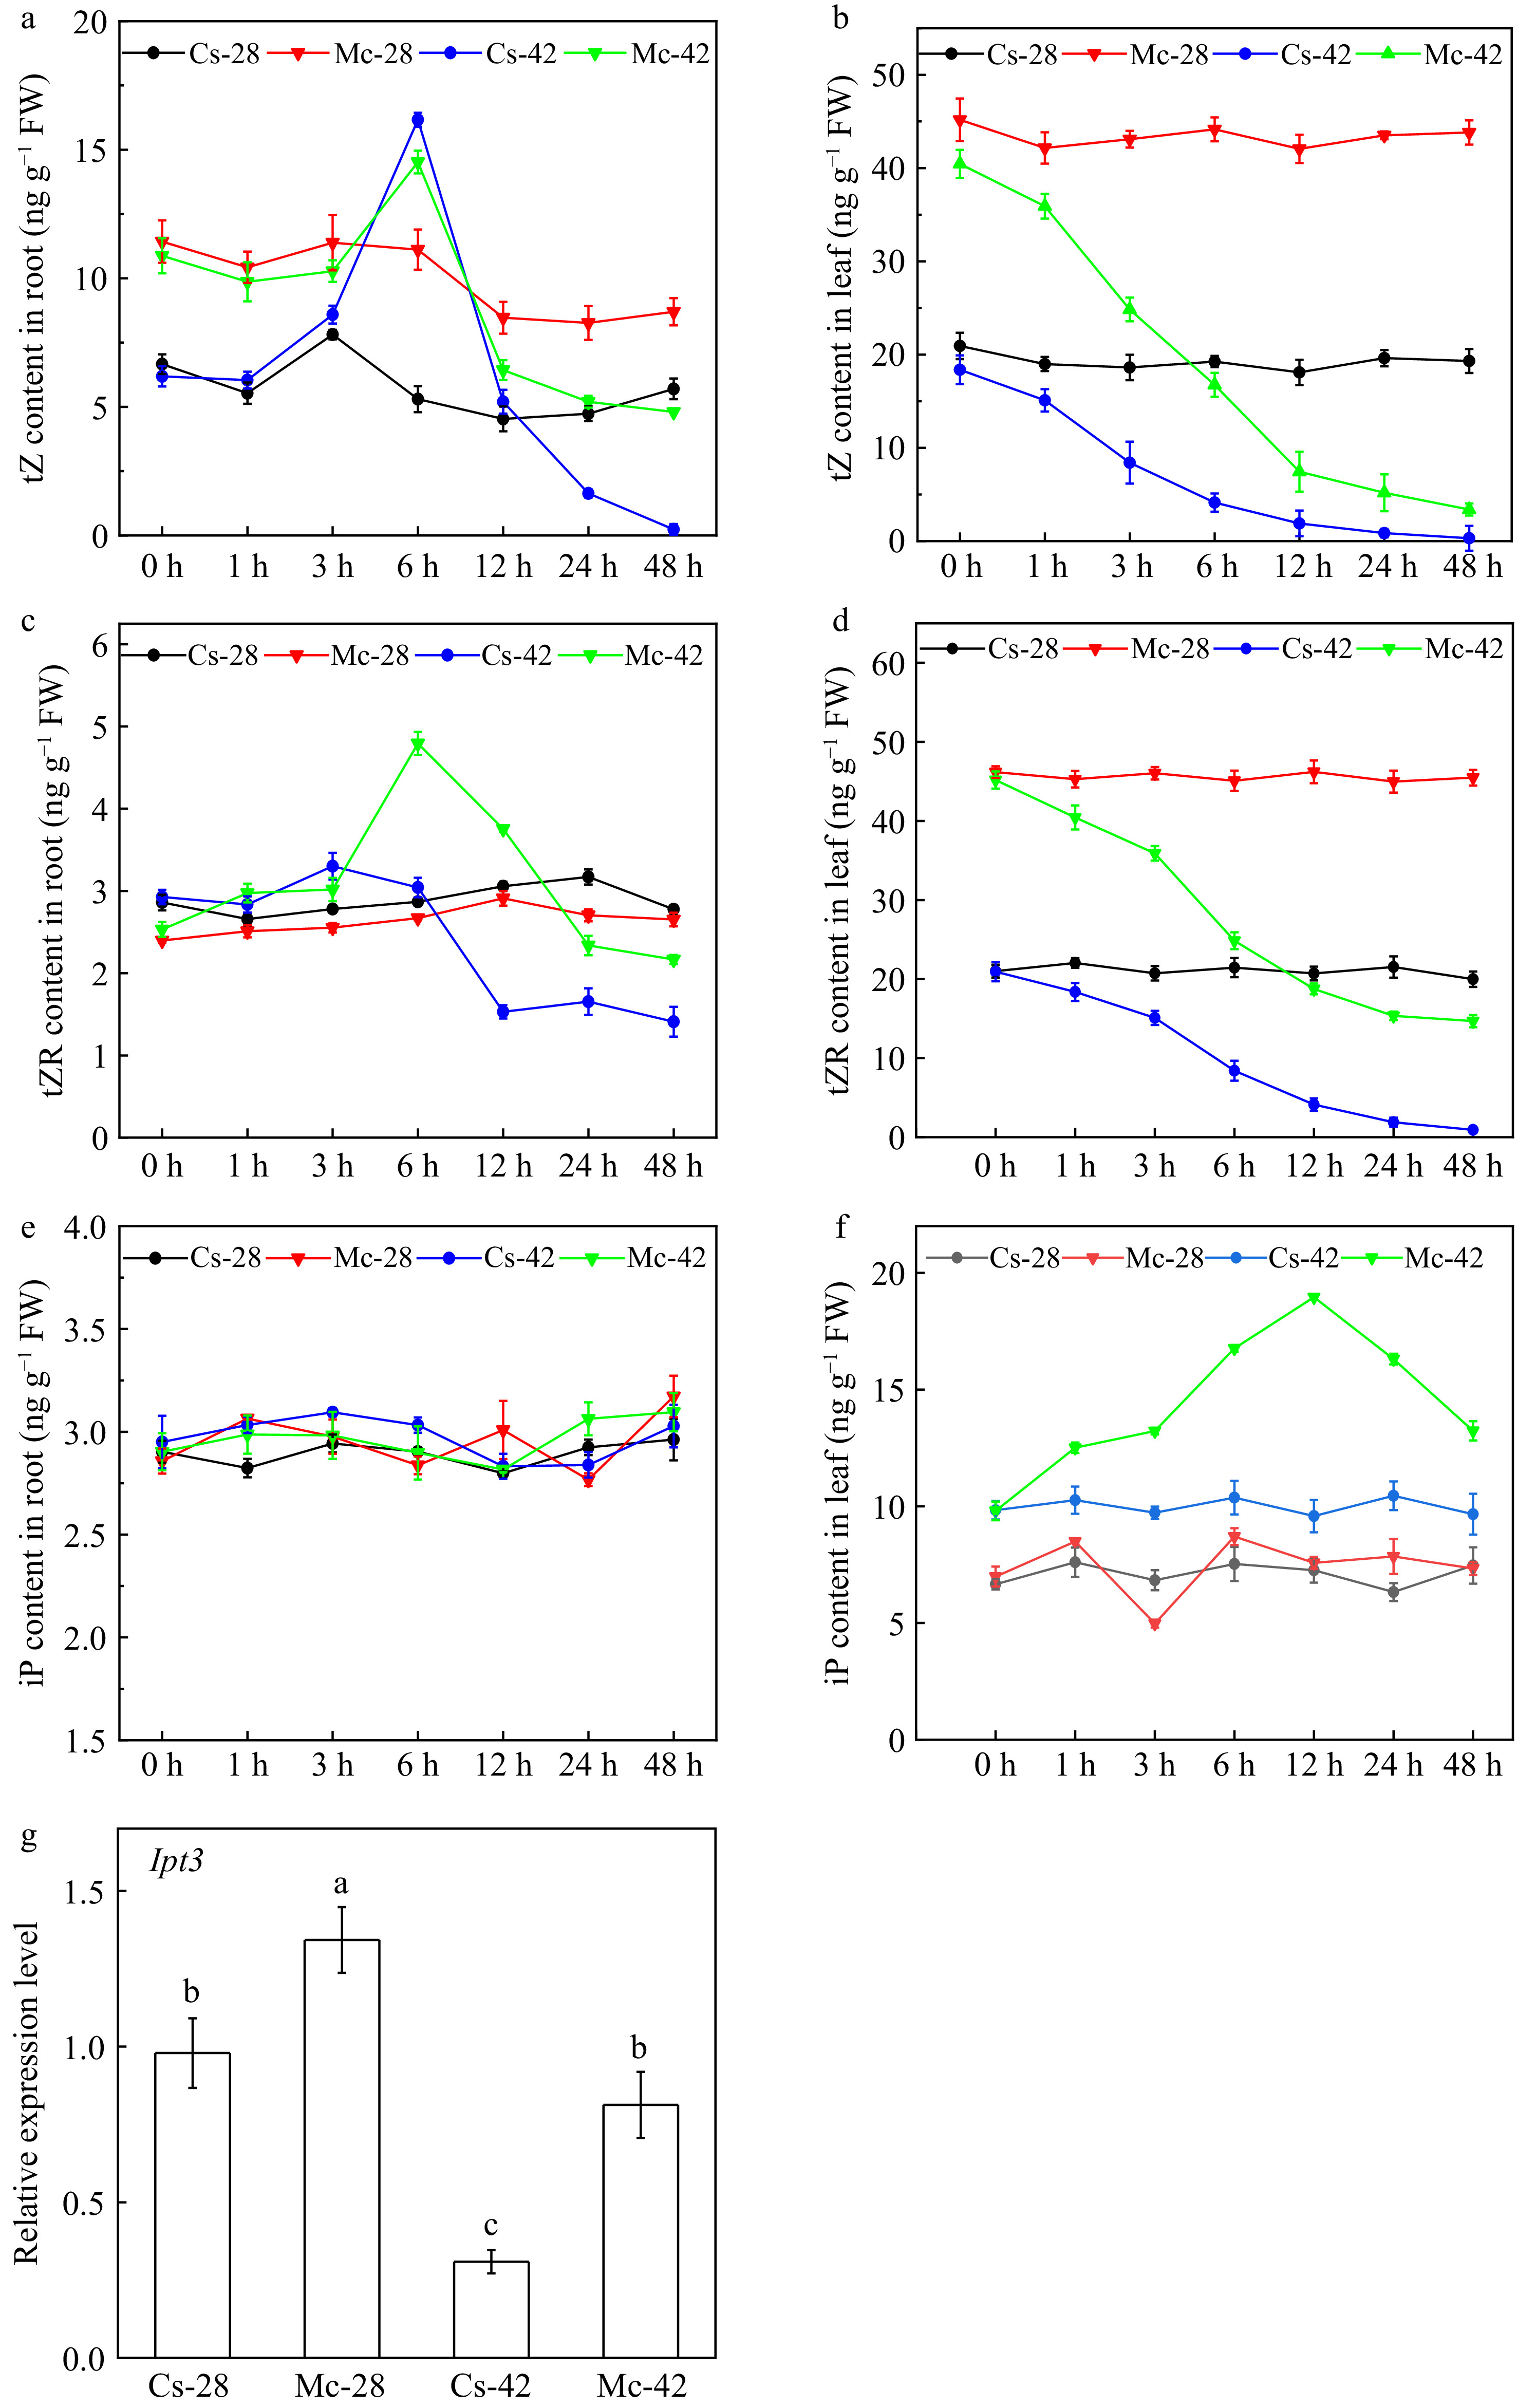
Figure 3.
Effects of bitter gourd rootstock on CTK content in cucumber leaves and roots, CTK biosynthesis in cucumber leaves. (a) The content of tZ in roots of grafted plants after exposure to heat stress for 0, 1, 3, 6, 12, 24, 48 h. (b) The content of tZ in leaves of grafted plants after exposure to heat stress for 0, 1, 3, 6, 12, 24, 48 h. (c) The content of tZR in roots of grafted plants after exposure to heat stress for 0, 1, 3, 6, 12, 24, 48 h. (d) The content of tZR in leaves of grafted plants after exposure to heat stress for 0, 1, 3, 6, 12, 24, 48 h. (e) The content of iP in roots of grafted plants after exposure to heat stress for 0, 1, 3, 6, 12, 24, 48 h. (f) The content of iP in leaves of grafted plants after exposure to heat stress for 0, 1, 3, 6, 12, 24, 48 h. (g) The expression level of IPT3 gene in leaves of grafted plants. Each bar represents the mean ± SE of three independent experiments. Means followed by different letters indicate significant differences between treatments (p < 0.05) according to Duncan's multiple range tests.
-
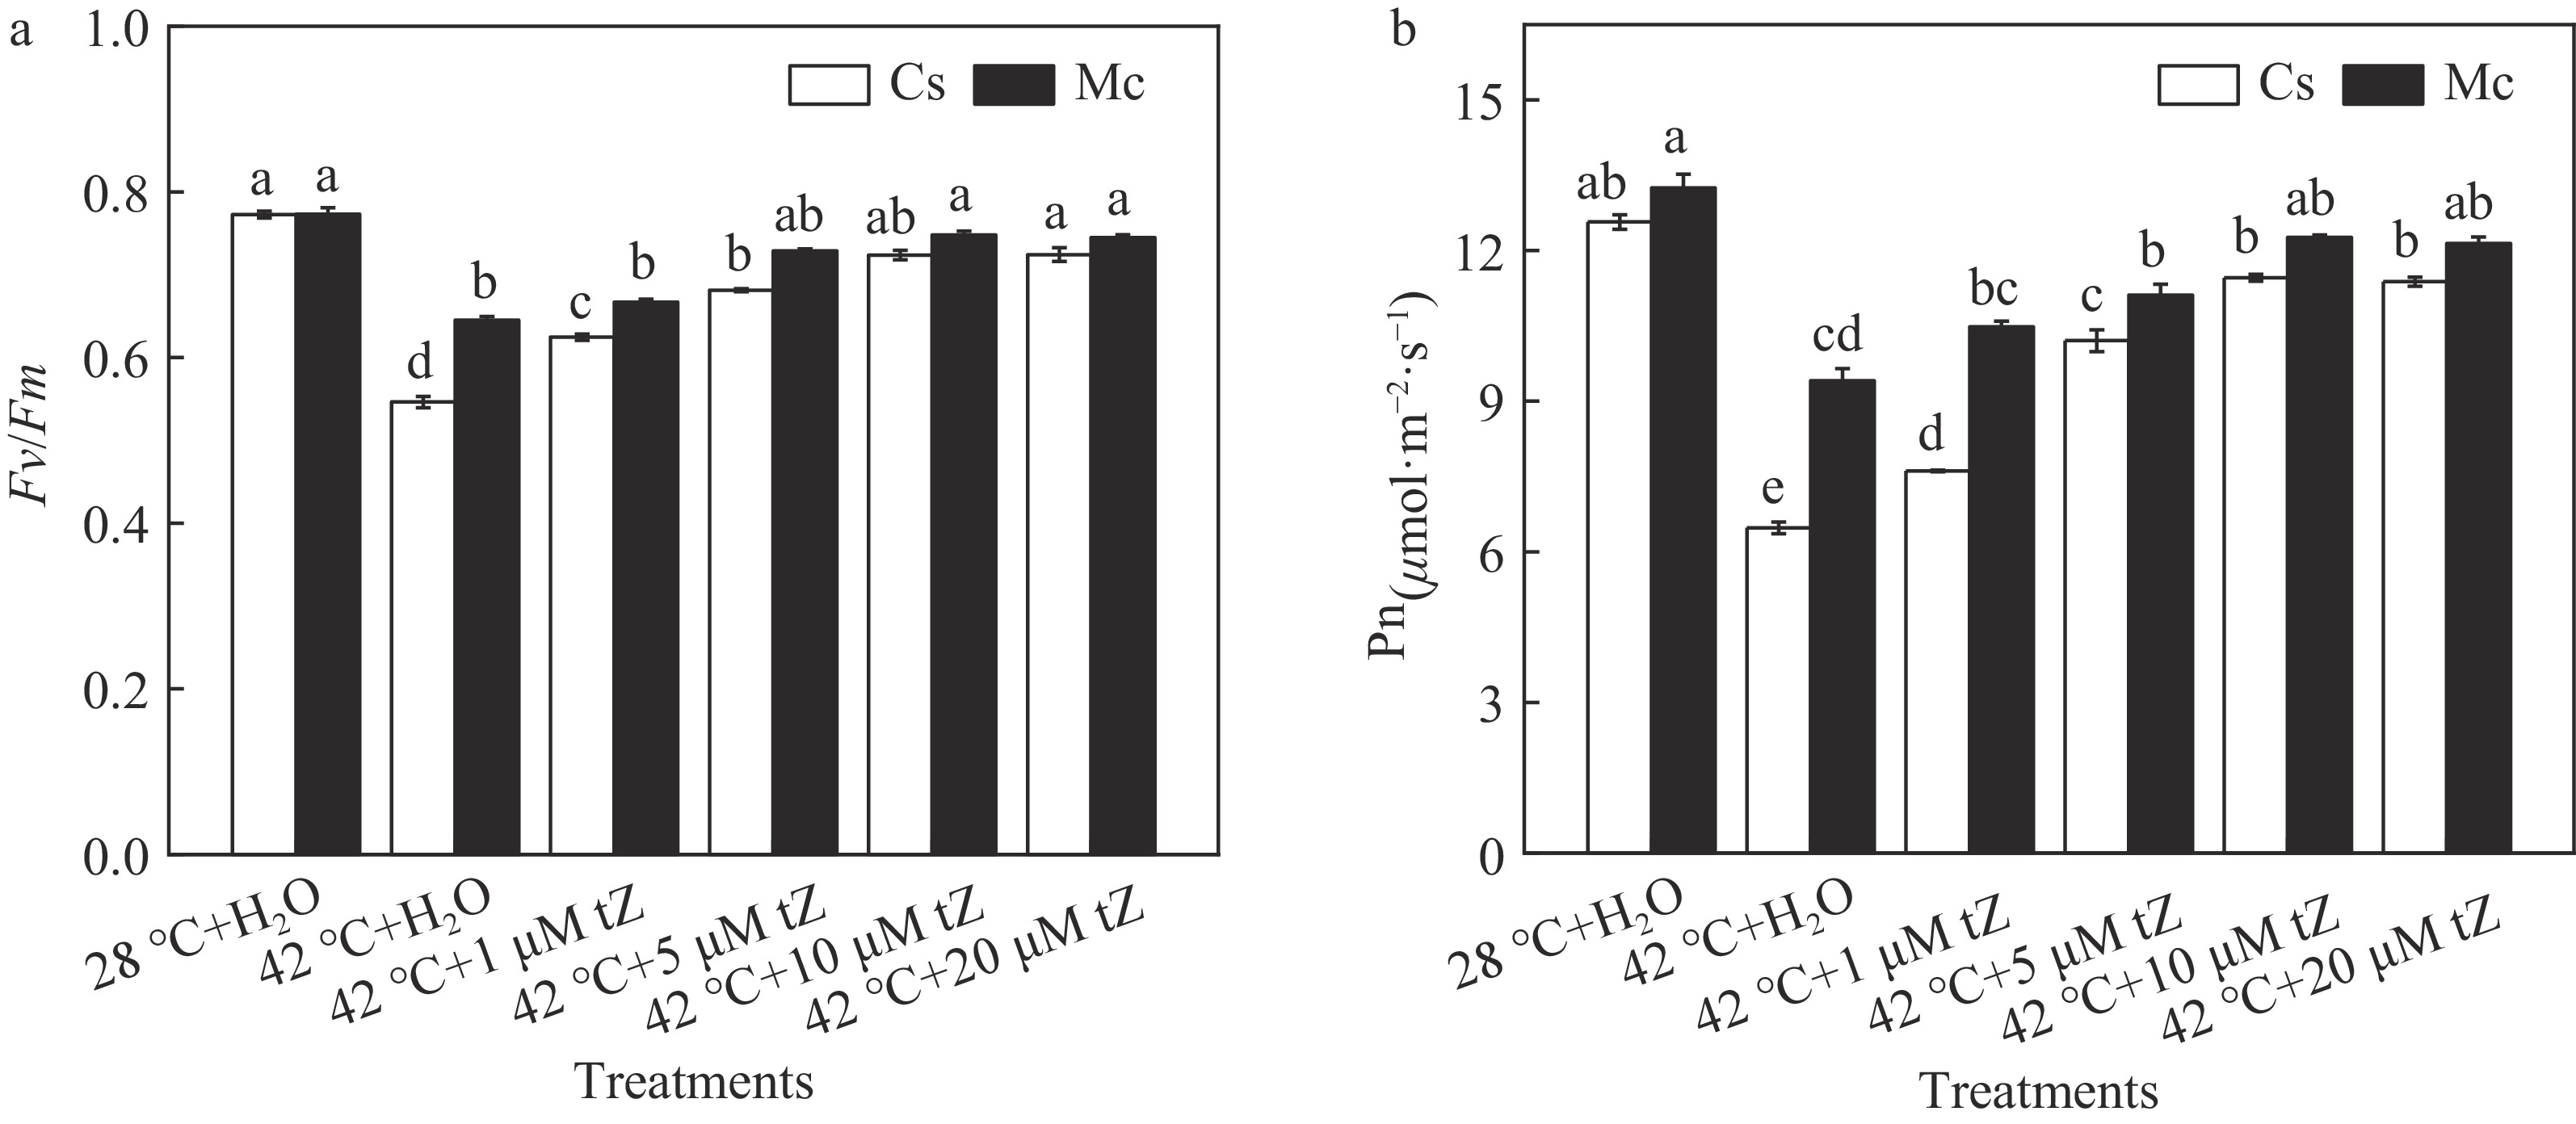
Figure 4.
Effects of exogenous trans-zeatin (tZ) on Fv/Fm and Pn of grafted plants under heat stress. (a) Changes in the maximum photochemical efficiency of PSII (Fv/Fm). Plants were pretreated with 0, 1, 5, 10, 20 μM tZ for 12 h and then plants were exposed to heat stress at 42 °C for 48 h. (b) Changes in the net CO2 assimilation (Pn). Plants were pretreated with 0, 1, 5, 10, 20 μM tZ for 12 h and then plants were exposed to heat stress at 42 °C for 48 h. Each bar represents the mean ± SE of three independent experiments. Means followed by different letters indicate significant differences between treatments (p < 0.05) according to Duncan's multiple range tests.
-
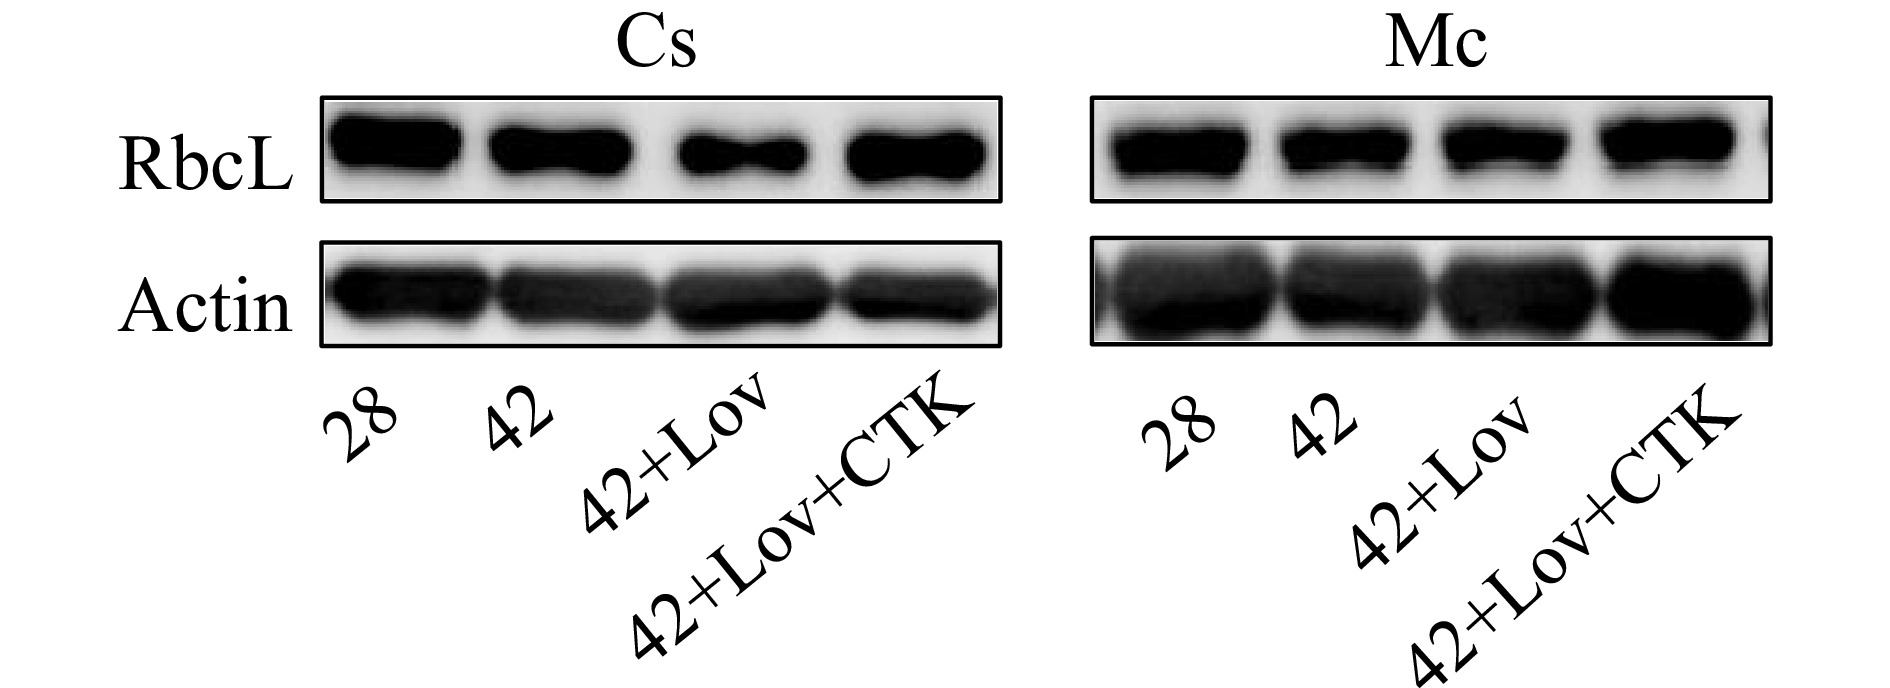
Figure 5.
Effects of CTK signal on RbcL accumulation. Plants grafted onto cucumber and bitter gourd were treated with 42 °C for 48 h; after 10 μM Lov pretreatment for 12 h, then plants were exposed to 42 °C for 12 h; 10 μM Lov pretreatment for 12 h, then plants were exposed to heat stress for 12 h, and then replenishment group were sprayed with 10 μM tZ. The control groups were treated with 28 °C.
-
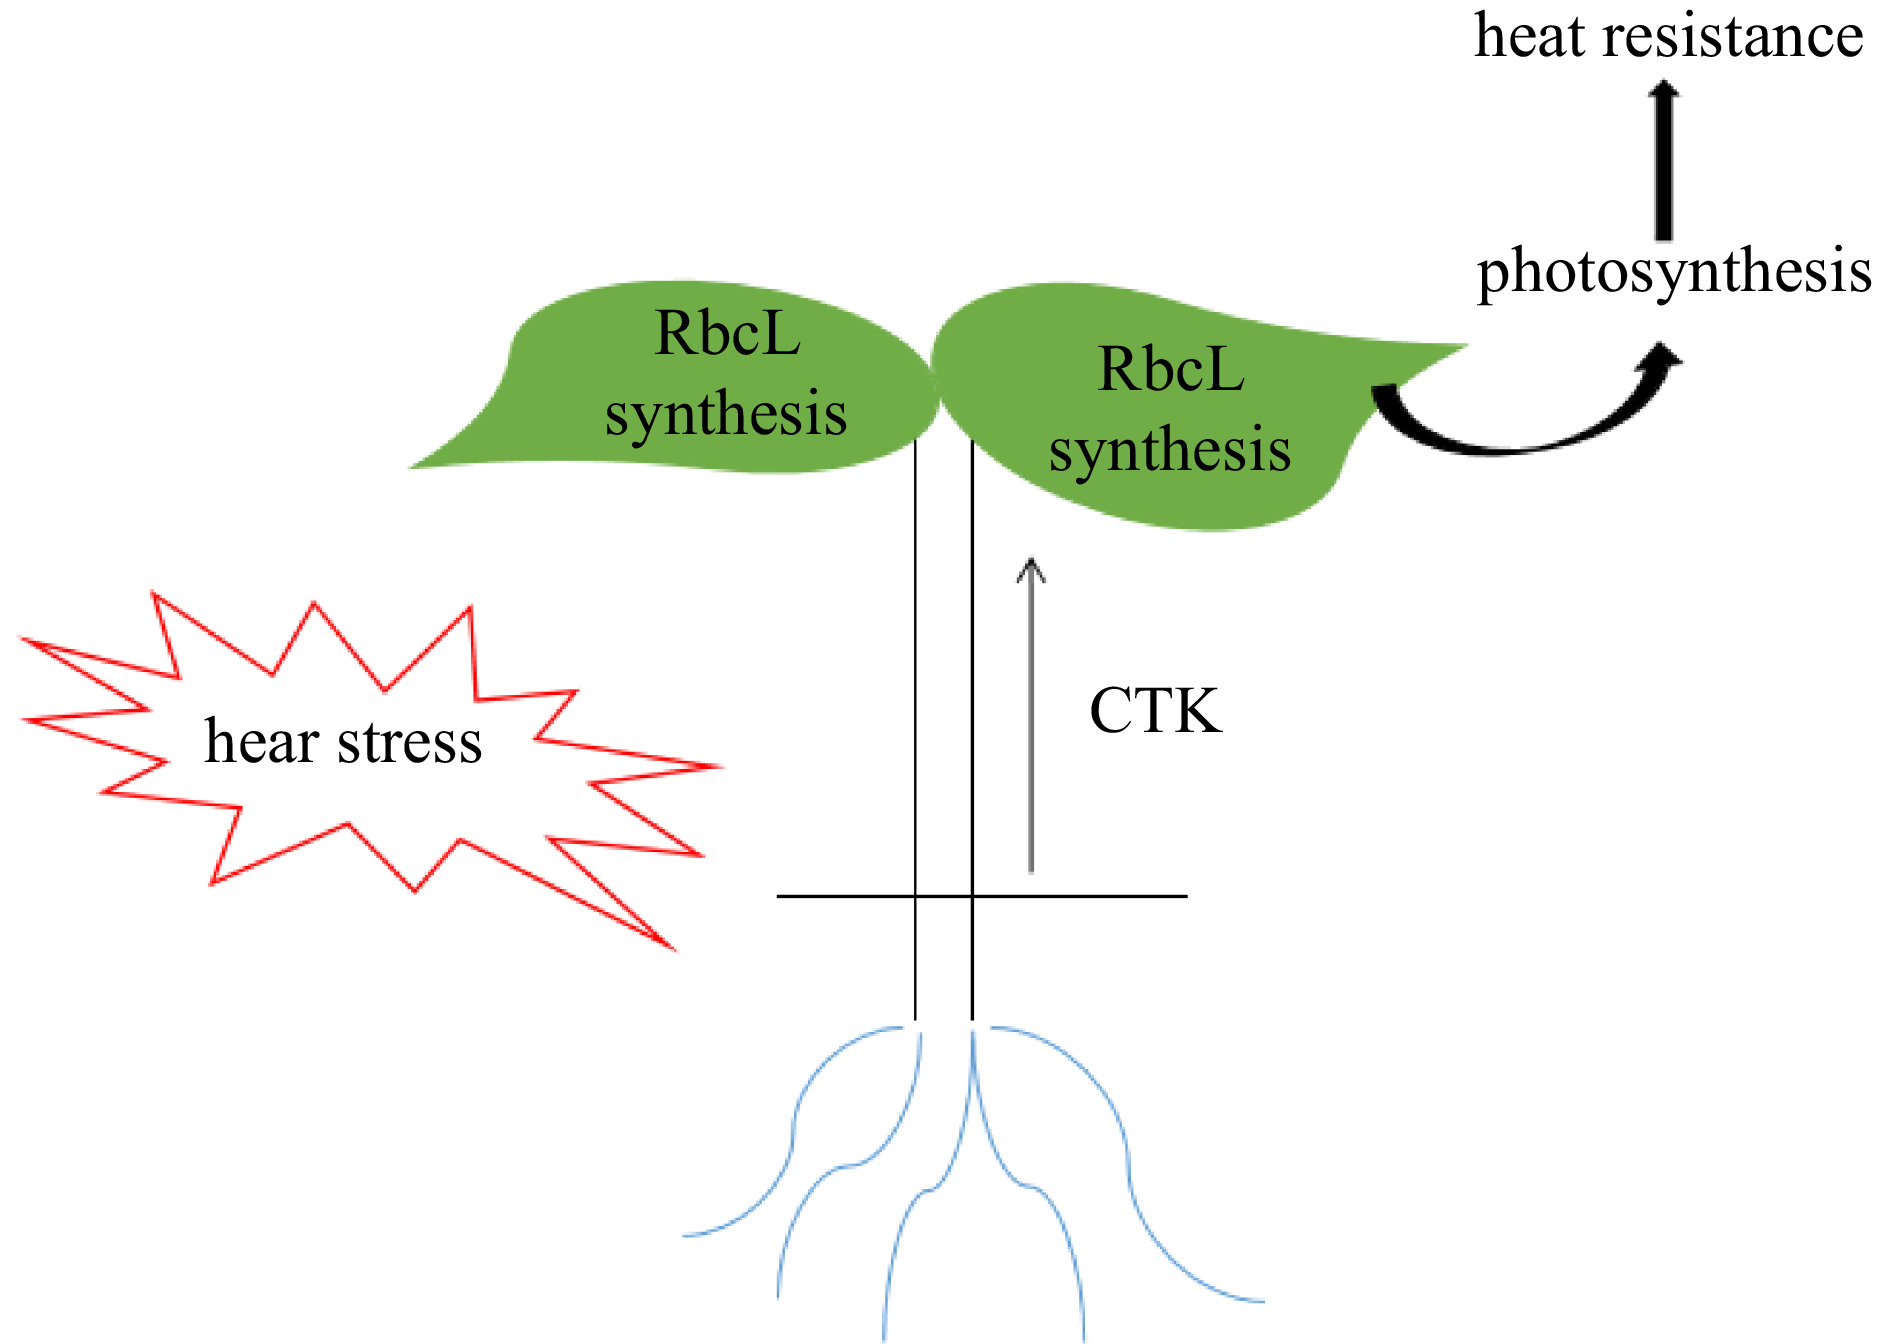
Figure 6.
Proposed model for CTK mediating a RbcL protein accumulation and heat tolerance in cucumber plants grafted onto bitter gourd rootstocks.
-
Treatments Fresh weight (g·plant−1) Dry weight (g·plant−1) Cs-28 9.28 ± 0.11a 1.04 ± 0.07a Mc-28 8.99 ± 0.10a 0.98 ± 0.05a Cs-42 6.38 ± 0.20c 0.68 ± 0.02c Mc-42 7.35 ± 0.17b 0.80 ± 0.04b Cs-28: self-grafted plants subjected to 28/18 °C (day/night). Mc-28: bitter gourd-grafted plants subjected to 28/18 °C (day/night). Cs-42: self-grafted plants subjected to 42/32 °C (day/night). Mc-42: bitter gourd-grafted plants subjected to 42/32 °C (day/night). Data are means ± SE. The letters 'a', 'b', 'c', and 'd' indicate significant differences between treatments (p < 0.05). Table 1.
Effects of high temperature on the growth of grafted cucumber seedlings.
Figures
(6)
Tables
(1)