-
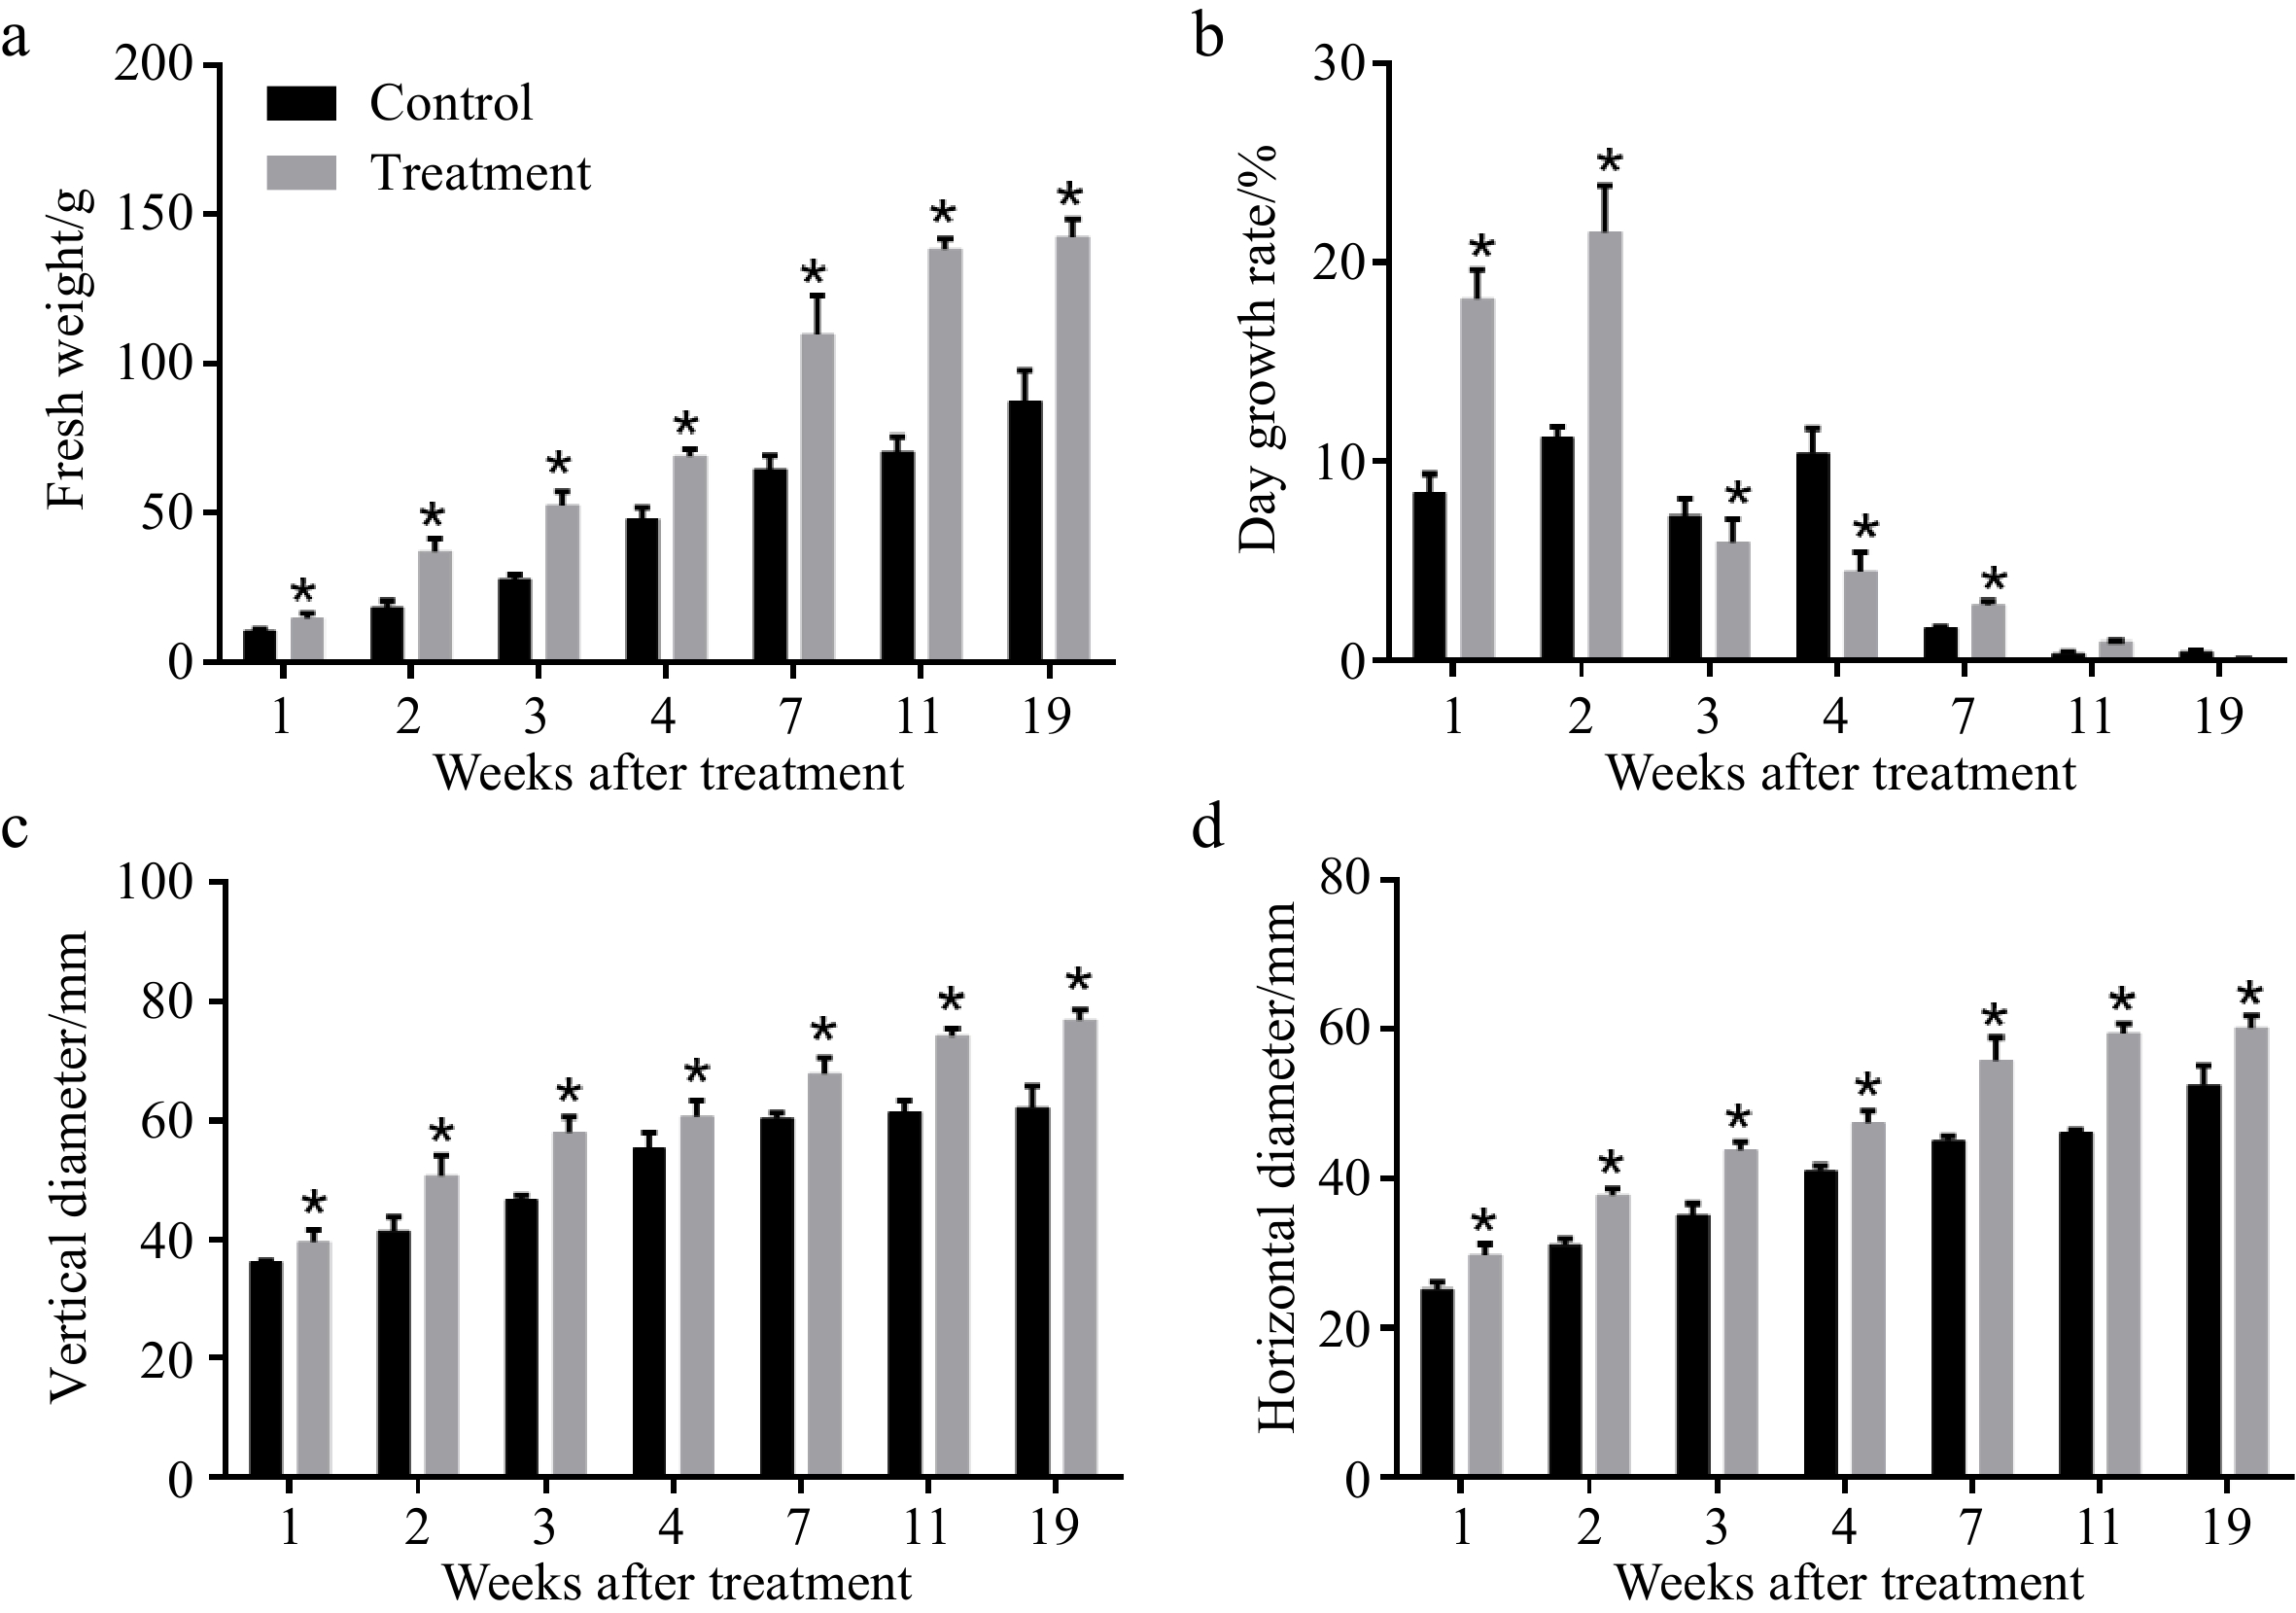
Figure 1. Effects of CPPU on (a) fresh weight, (b) day growth rate, (c) vertical diameter, and (d) horizontal diameter of 'Hayward' kiwifruit. * Indicates significant difference between the treatment and the control based on t-test (p < 0.05).
-
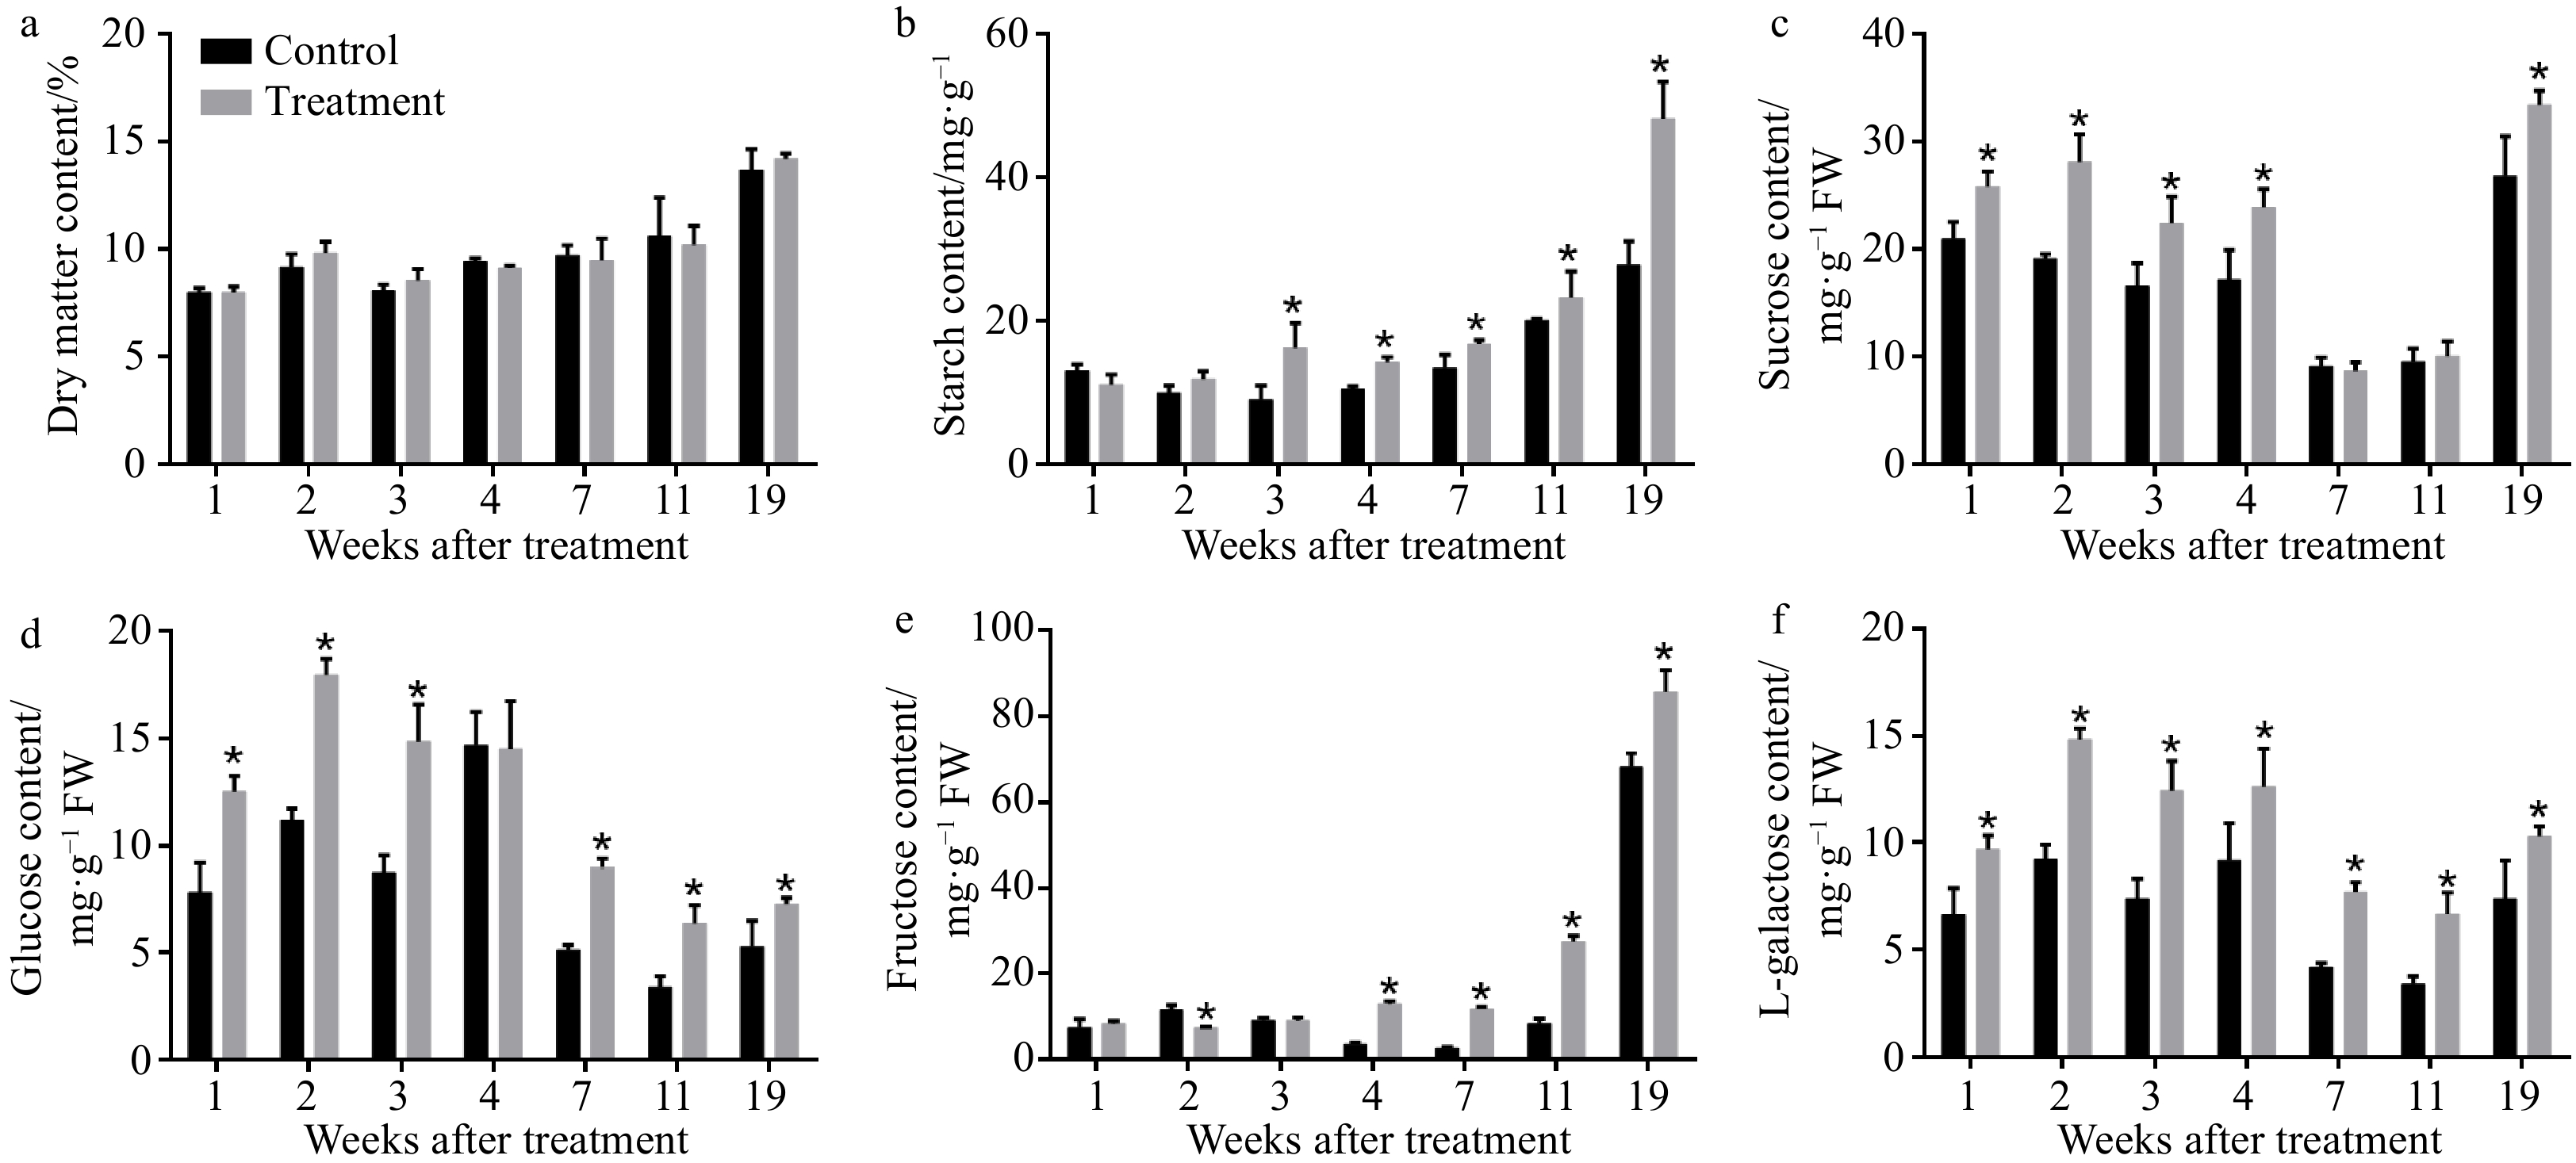
Figure 2. Effects of CPPU on (a) dry matter, (b) starch, (c) sucrose, (d) glucose, (e) fructose, and (f) L-galactose concentrations of 'Hayward' kiwifruit. * Indicates significant difference between the treatment and the control based on t-test (p < 0.05).
-
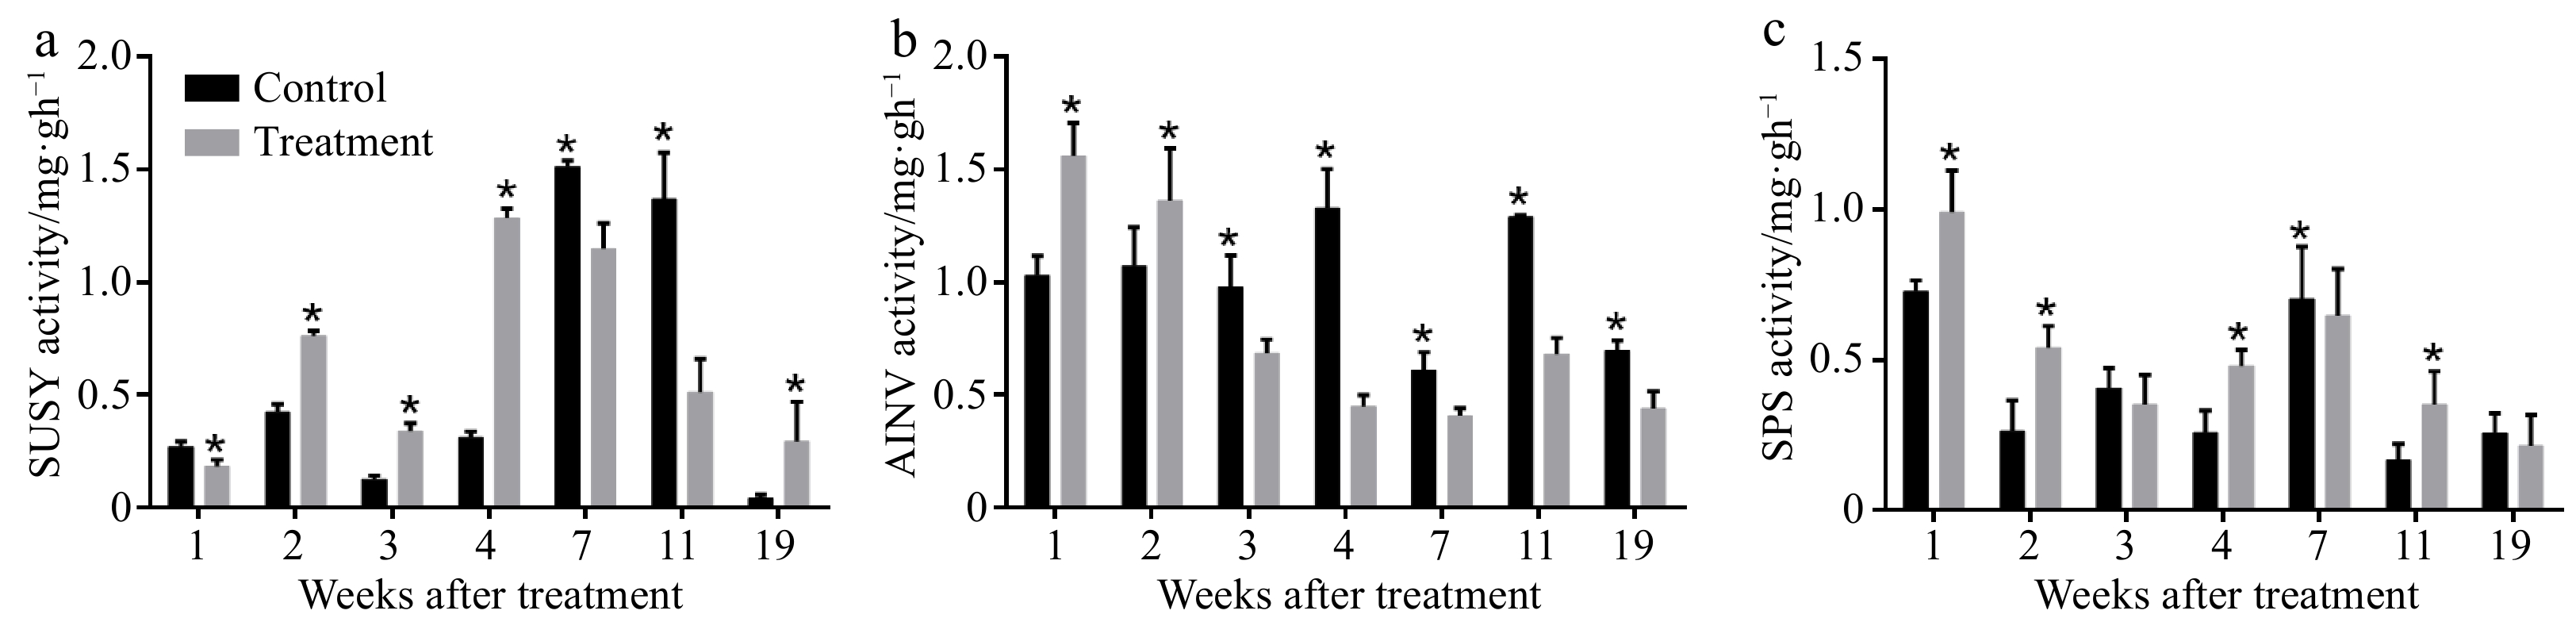
Figure 3. Effects of CPPU on (a) sucrose synthase (SUSY), (b) acid invertase (AINV), and (c) sucrose phosphate synthase (SPS) activity in 'Hayward' kiwifruit. * Indicates significant difference between the treatment and the control based on t-test (p < 0.05).
-
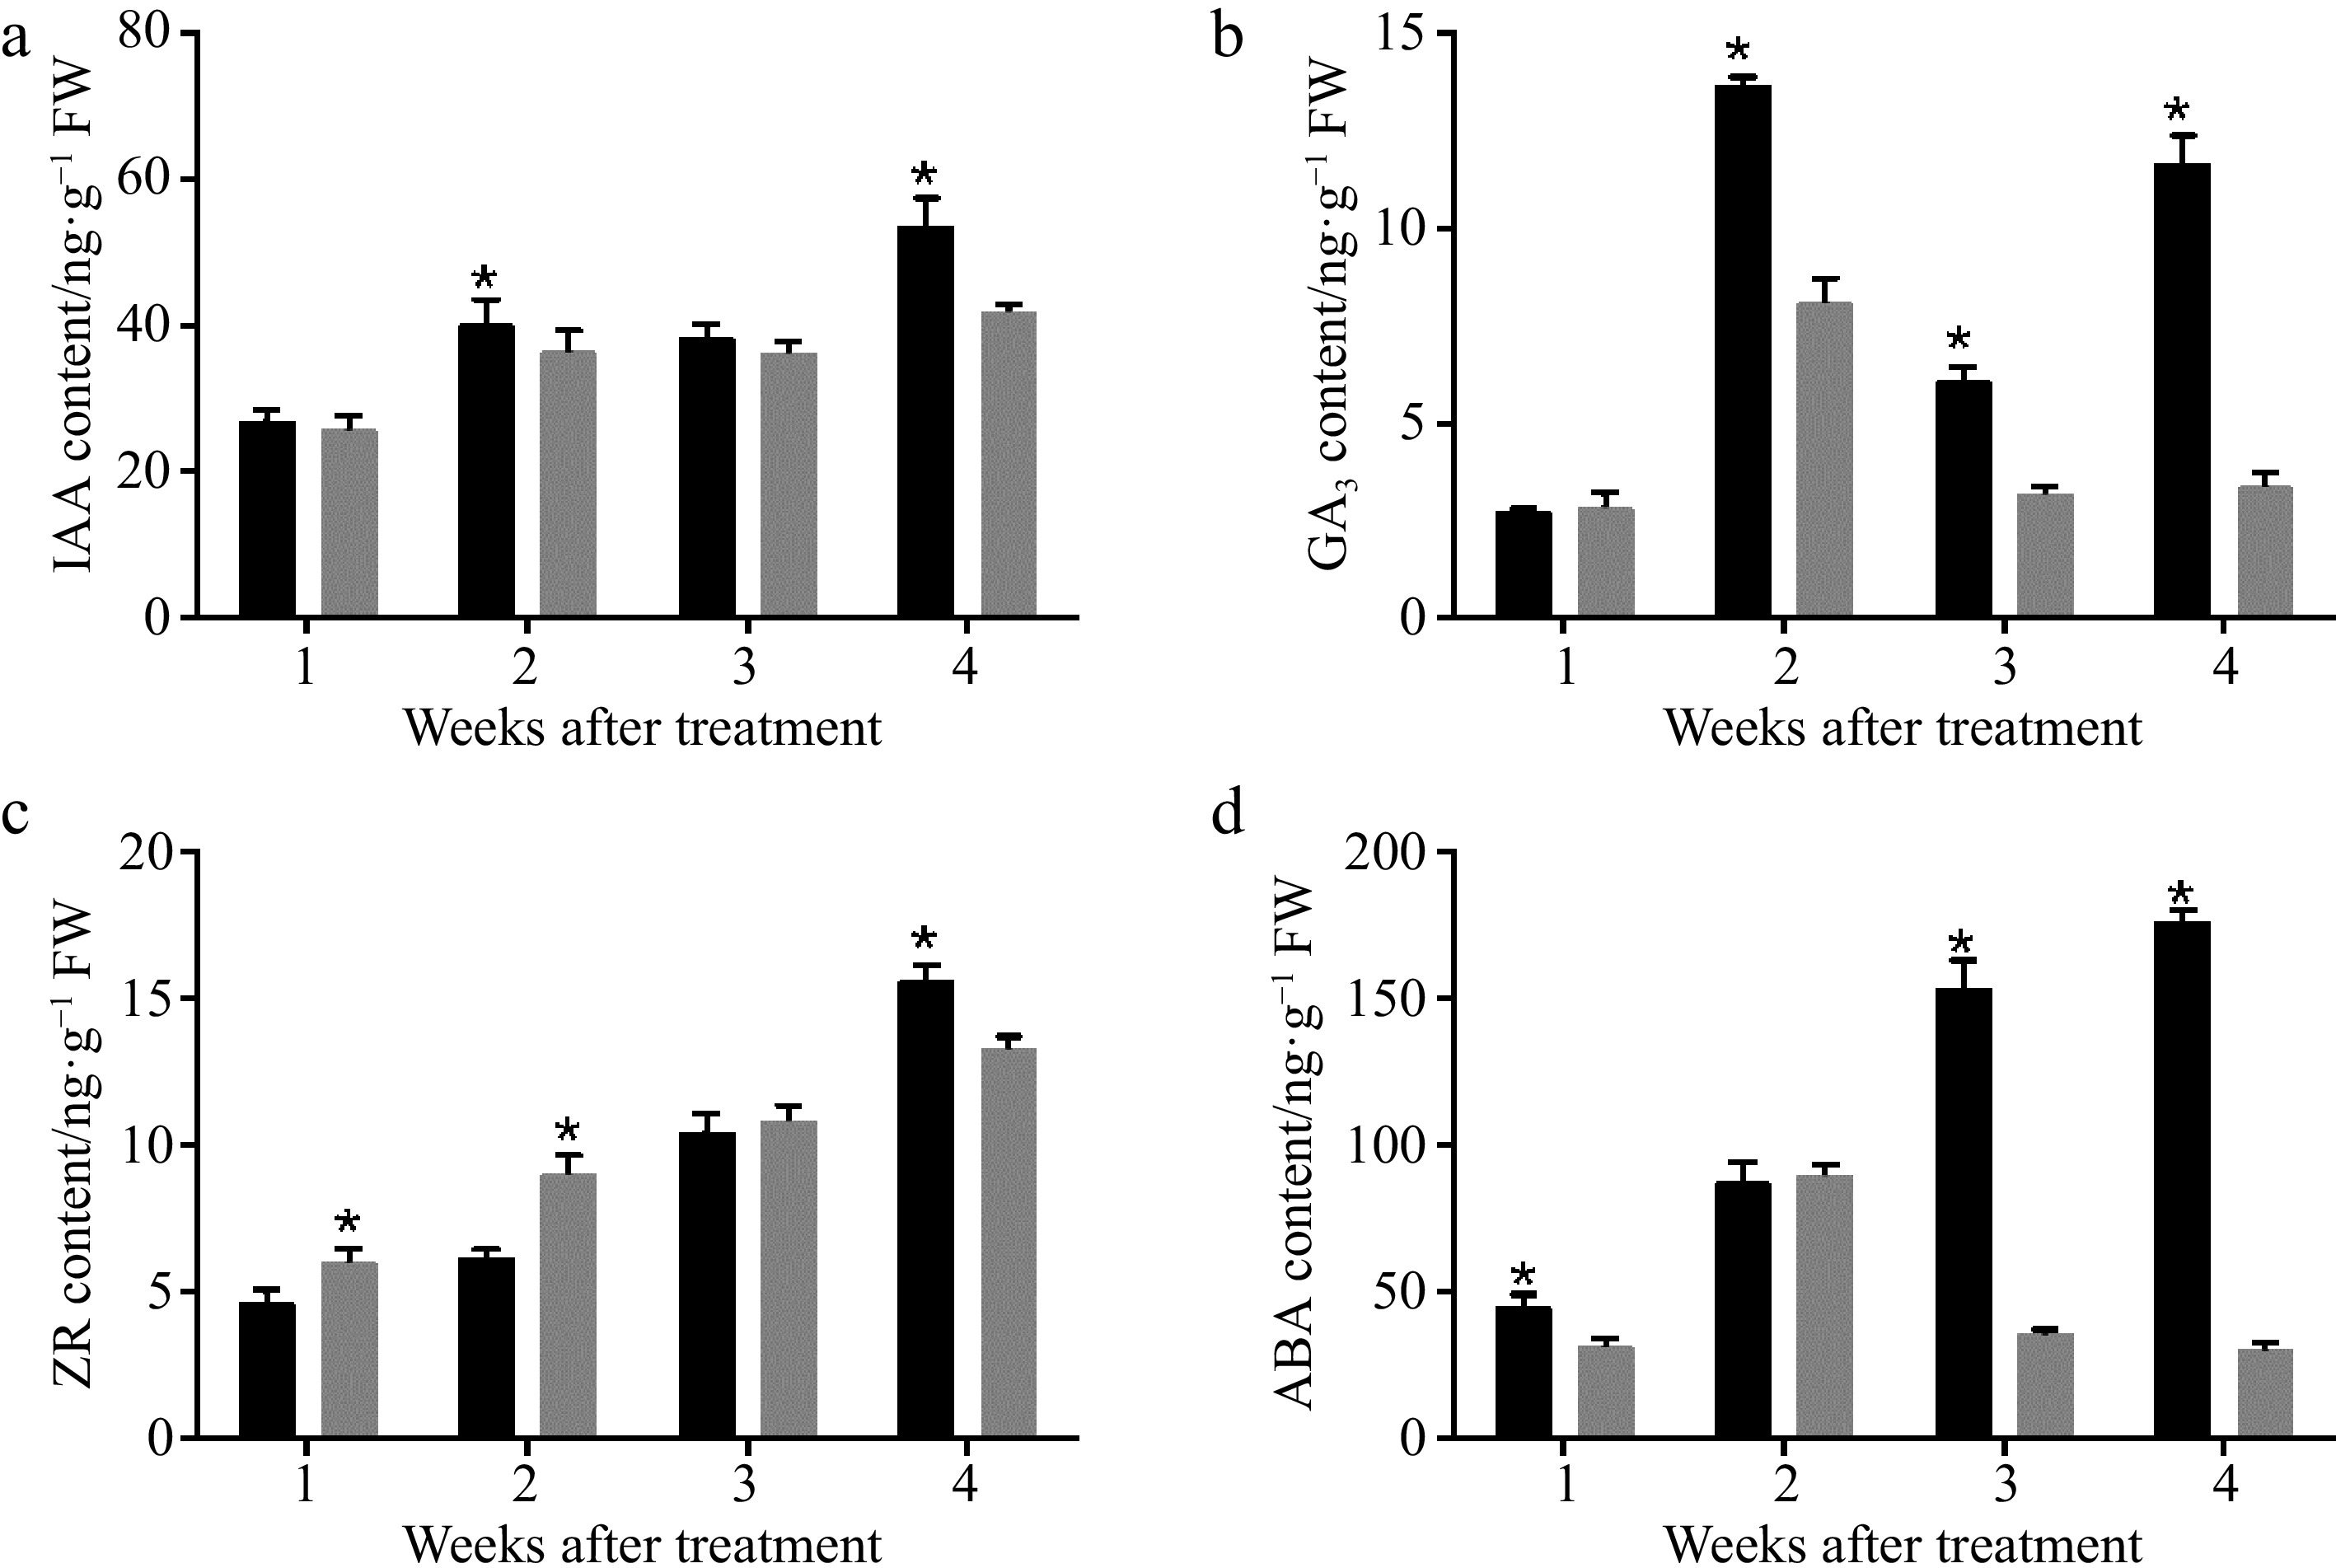
Figure 4. Effects of CPPU on the levels of (a) auxin (IAA), (b) gibberellin (GA3), (c) cytokinin (zeatin, ZR), and (d) abscisic acid (ABA) in 'Hayward' kiwifruit. * Indicates significant difference between the treatment and the control based on t-test (p < 0.05).
-

Figure 5. Identification of Differentially Expressed Genes (DEGs) in kiwifruits in response to CPPU treatment. (a) Overall distribution of sample gene expression. (b) A volcano plot of DEGs. (c) Vinn diagrams of DEGs between B1/A1 (28 DAB CPPU-treatment/28 DAB control), B2/A2 (35 DAB CPPU-treatment/35 DAB control) and B3/A3 (42 DAB CPPU-treatment/42 DAB control).
-
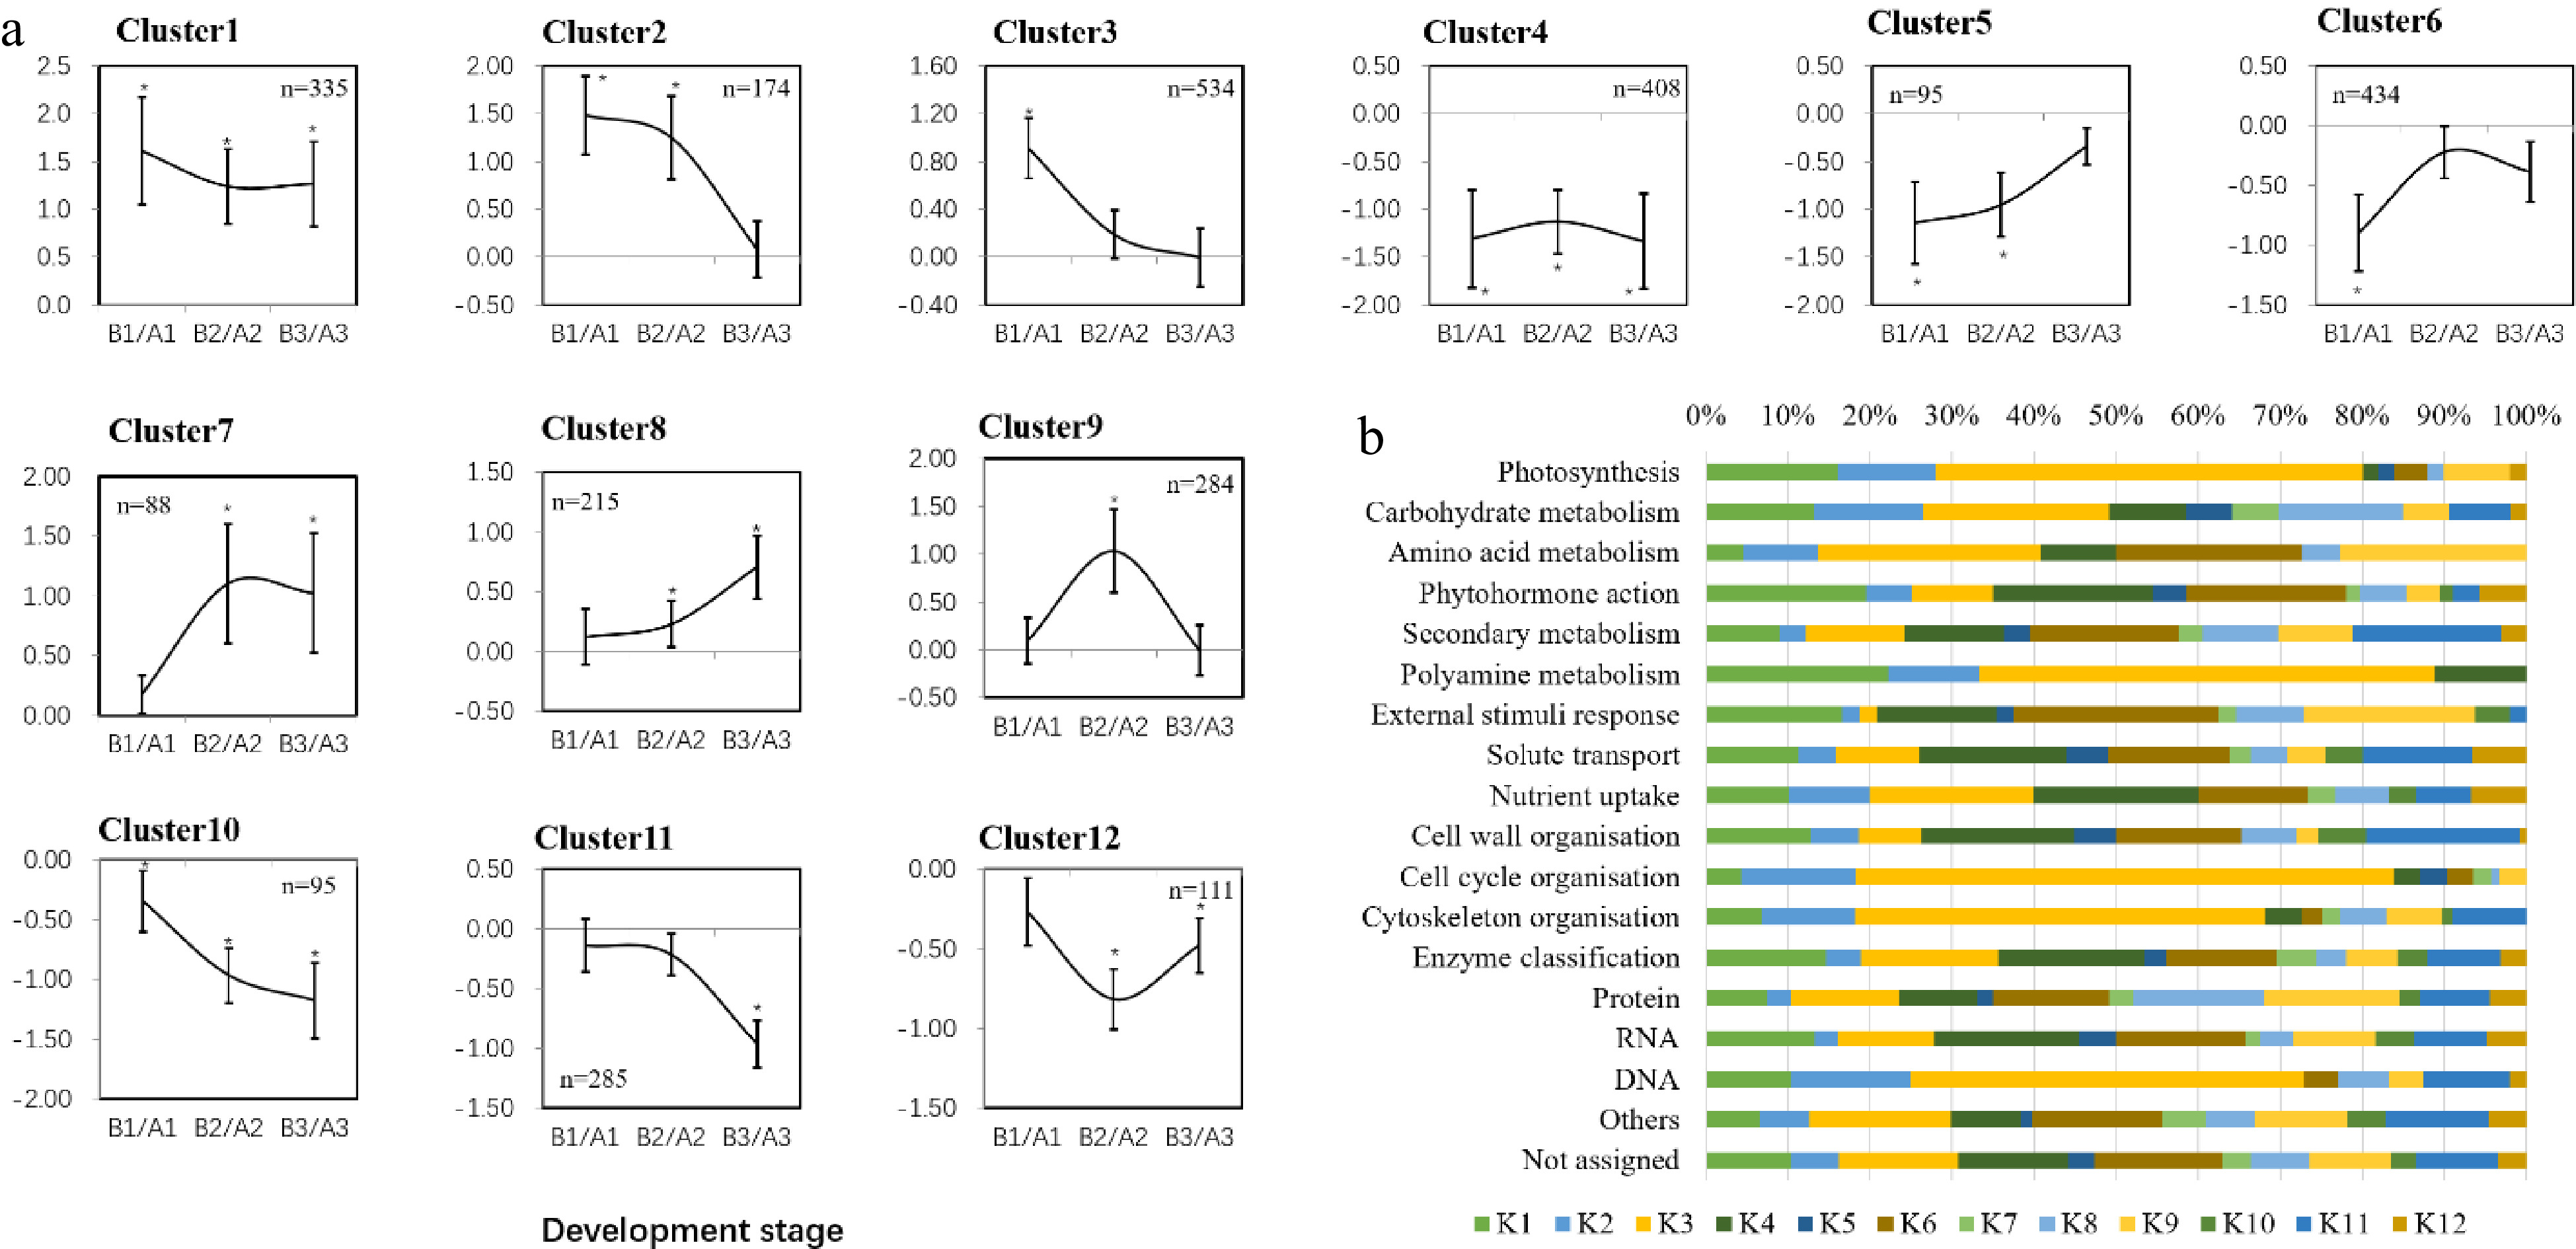
Figure 6. Different gene expression patterns and enriched functional categories. (a) Main expression profiles trends. Twelve main patterns were identified from the differentially expressed genes. The y-axis shows the log2 fold changes of CPPU treatment/control at the same sampled point. Error bars indicate standard deviation. (b) Functional category enrichment (modified MapMan bins) of upregulated and downregulated genes among the different expression patterns.
-

Figure 7. Major carbohydrate metabolism pathways and carbohydrate accumulation that showed changes in kiwifruit treated with CPPU. The dynamics of gene expression during the three periods (from 28 to 42 DAB) are represented by a group of three boxes, with colors representing up-regulation (red) or down-regulation (blue) with CPPU treatment. Fru, fructose; Glc, glucose; CWINV, cell wall invertase; SUSY, sucrose synthase; CIN, cytoplasmic invertase; VIN, vacuolar invertase; UDPG, UDP-D-glucose; UGP, UDPG-pyrophosphorylase; G1P, fructose-1-phosphate; PGM, phosphoglucomutase; FK, fructokinase; HK, hexokinase; F6P, fructose 6-phosphate; G6P, glucose 6-phosphate; PGI, phosphoglucose isomerase; PFK, phosphofructokinase; F1,6P, Fructose-1,6-diphosphate; AGPase, ADP-glucose pyrophosphorylase; GBSS, granule-bound starch synthase; SBE, starch branching enzyme; BMY, β-amylase; AMY, α-amylase; PHS, α-glucan phosphorylase; Mal, maltose; SUT, sucrose transporter; SWEET, sugar transporter; HT, hexose transporter; vGT, vacuolar glucose transporter; TST, tonoplast sugar transporter; EDR6, sugar transporter; PGPT, glucose 6-phosphate transmembrane transporter.
-
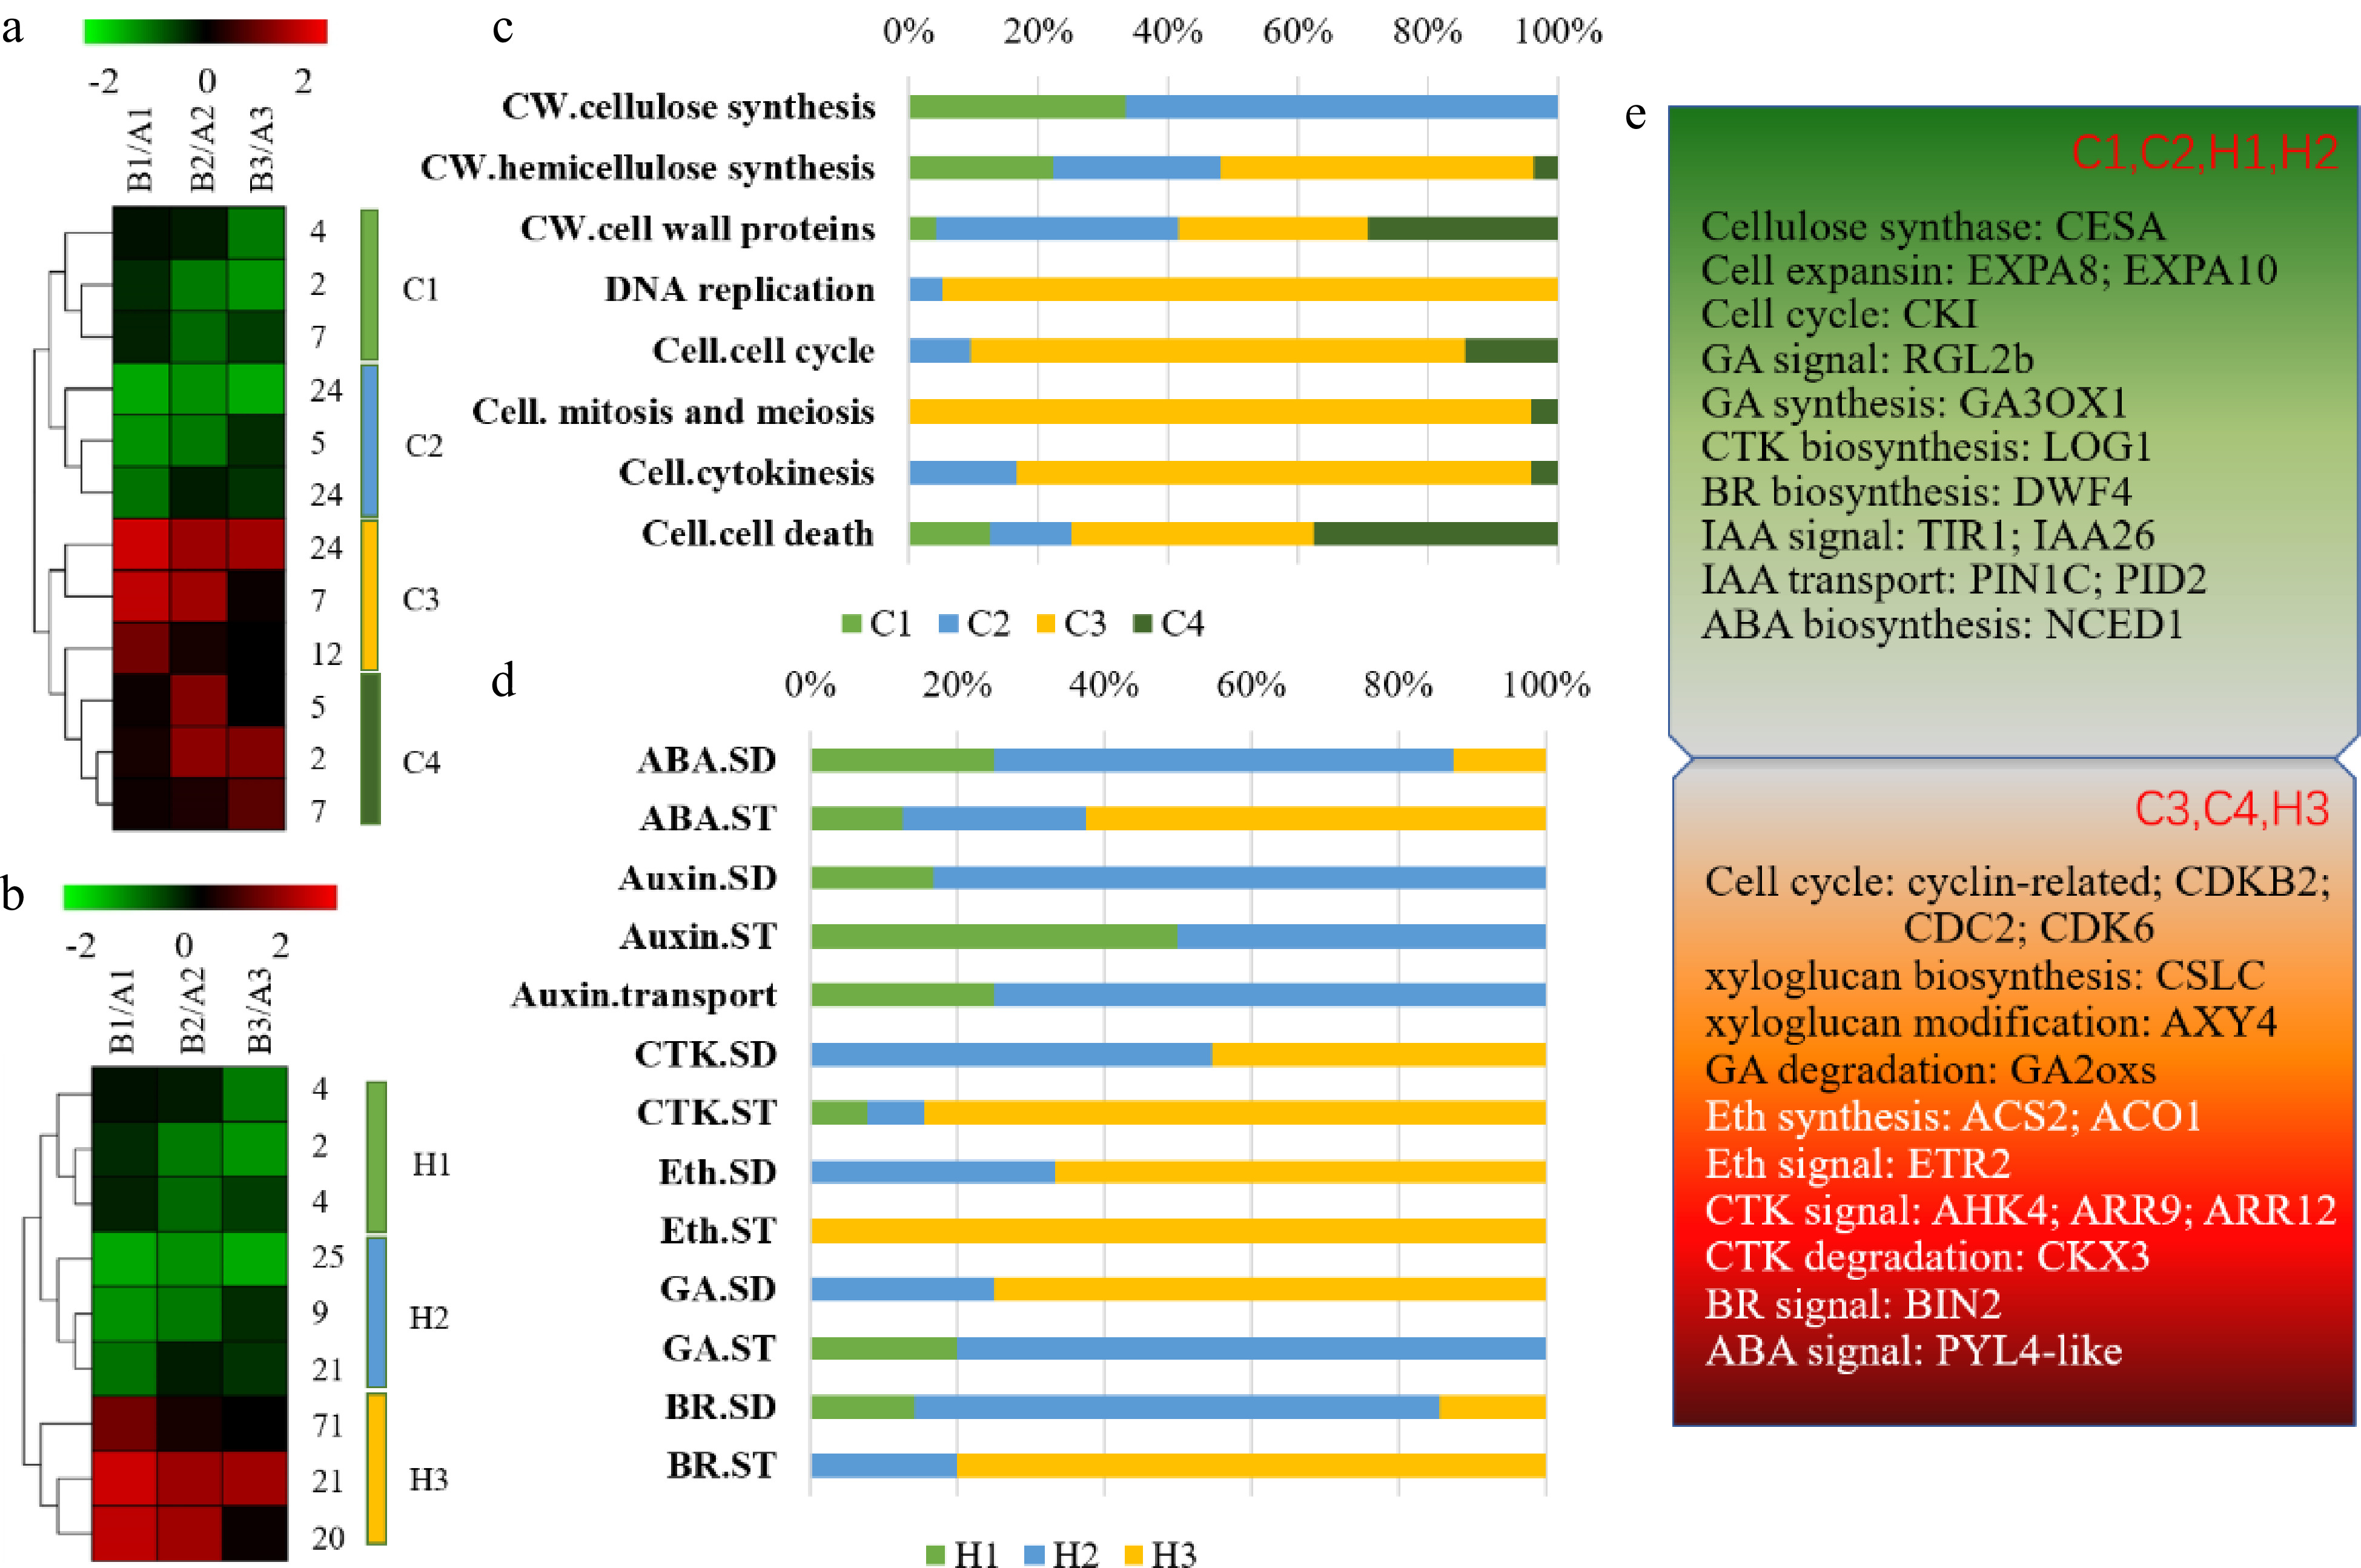
Figure 8. Expression profiles of genes associated with fruit development and growth, including genes involved in cell growth and cell wall synthesis, as well as hormone signaling. (a) Heat map of genes involved in cell and cell wall pathways. Genes that varied significantly along the three developmental stages (28, 35, 42 DAB) clustered into four patterns (C1−C4) based on 12 K-means clusters. (b) Heat map of the genes involved in hormone pathways. Expression patterns along the three developmental stages (28, 35, 42 DAB) clustered into three patterns (H1−H3) based on 9 K-means clusters. (c), (d) Distribution of genes among groups C1−C4 and H1−H3, respectively. (e) Trends in expression abundance of representative genes from 28 to 45 DAB. CW, Cell wall; SD: synthesis-degradation; ST, signal transduction.
Figures
(8)
Tables
(0)