-
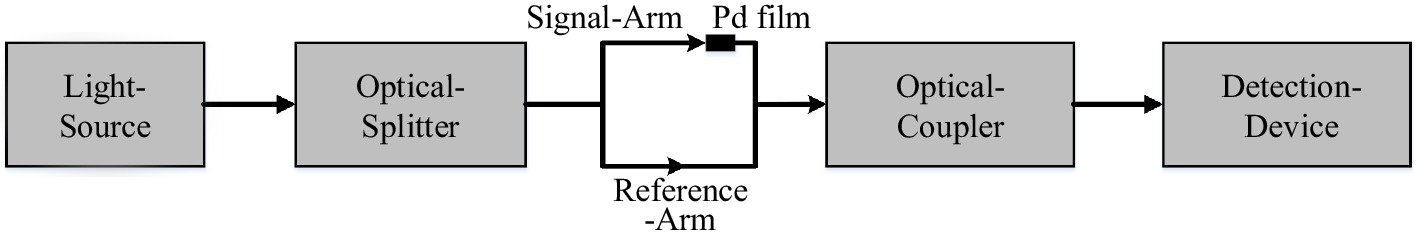
Figure 1.
Functional diagram of MZI interferometer hydrogen sensors.
-
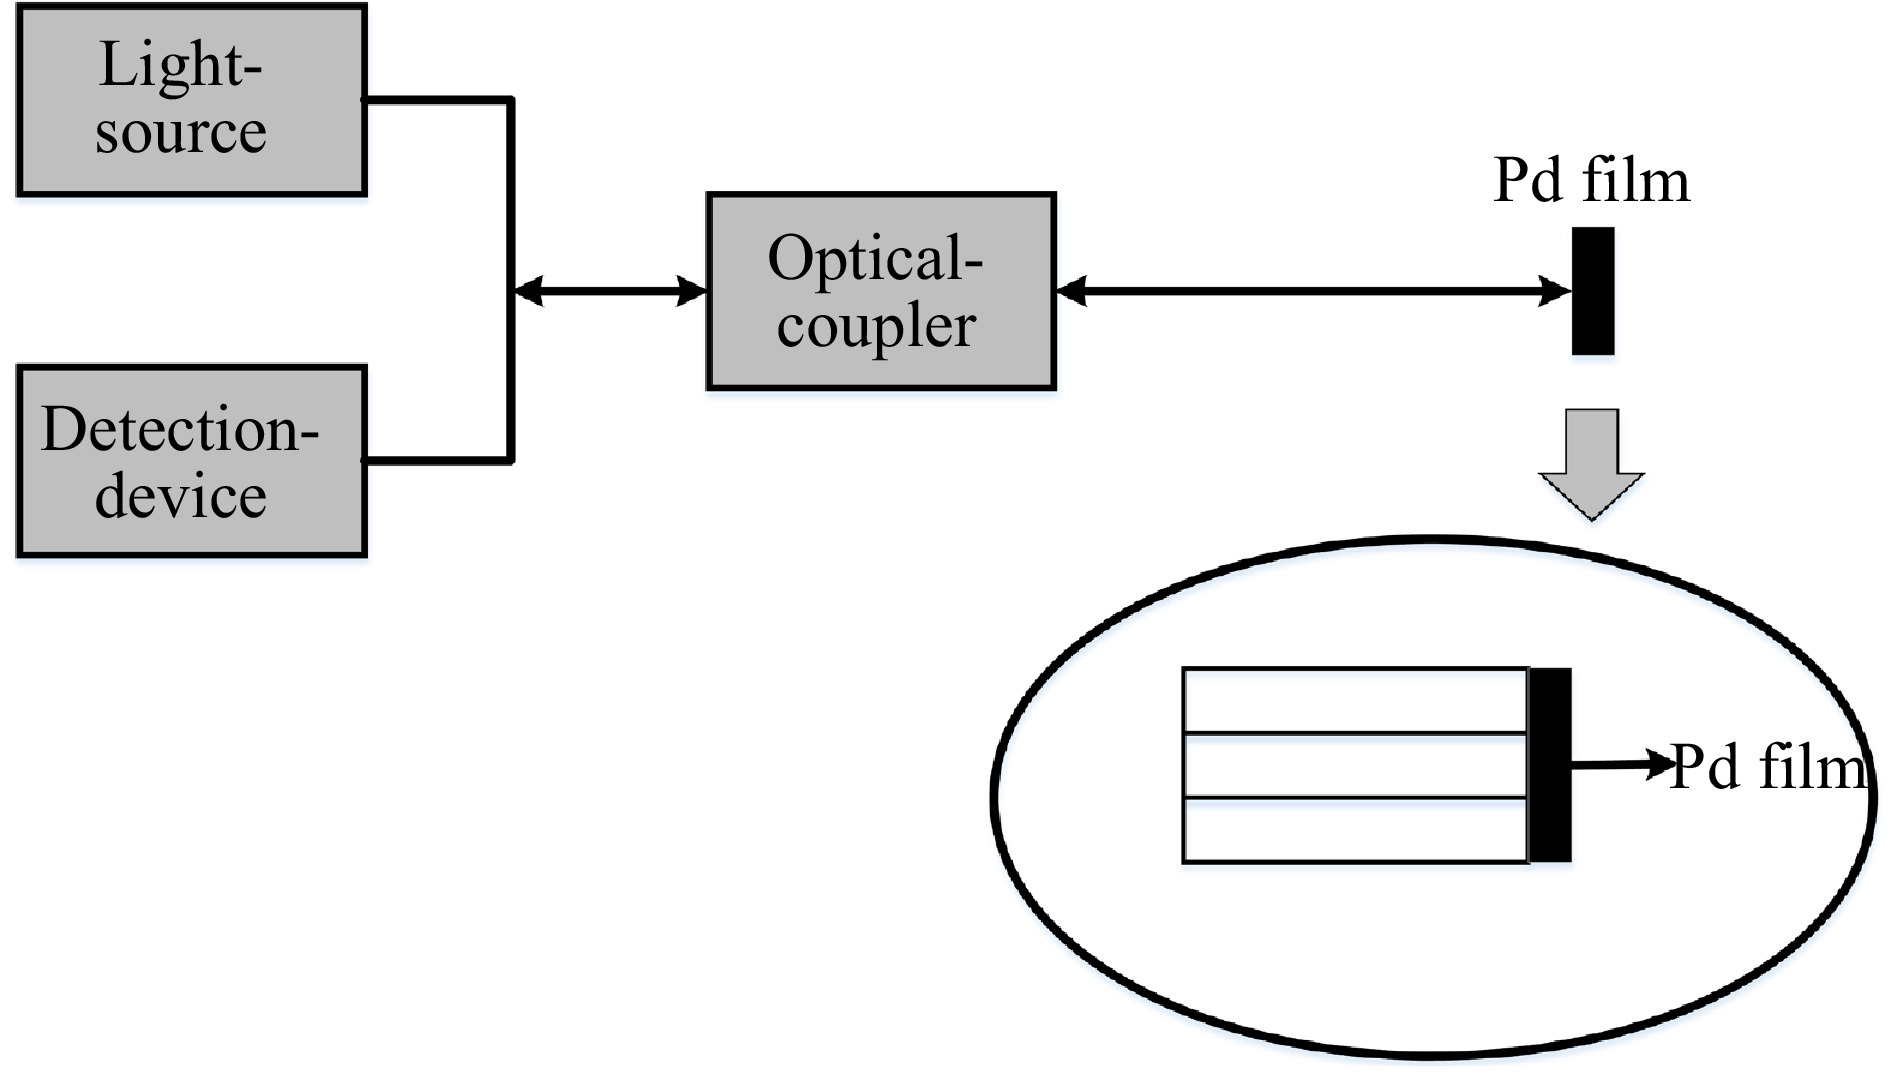
Figure 2.
Functional diagram of a micro-mirror hydrogen sensor.
-
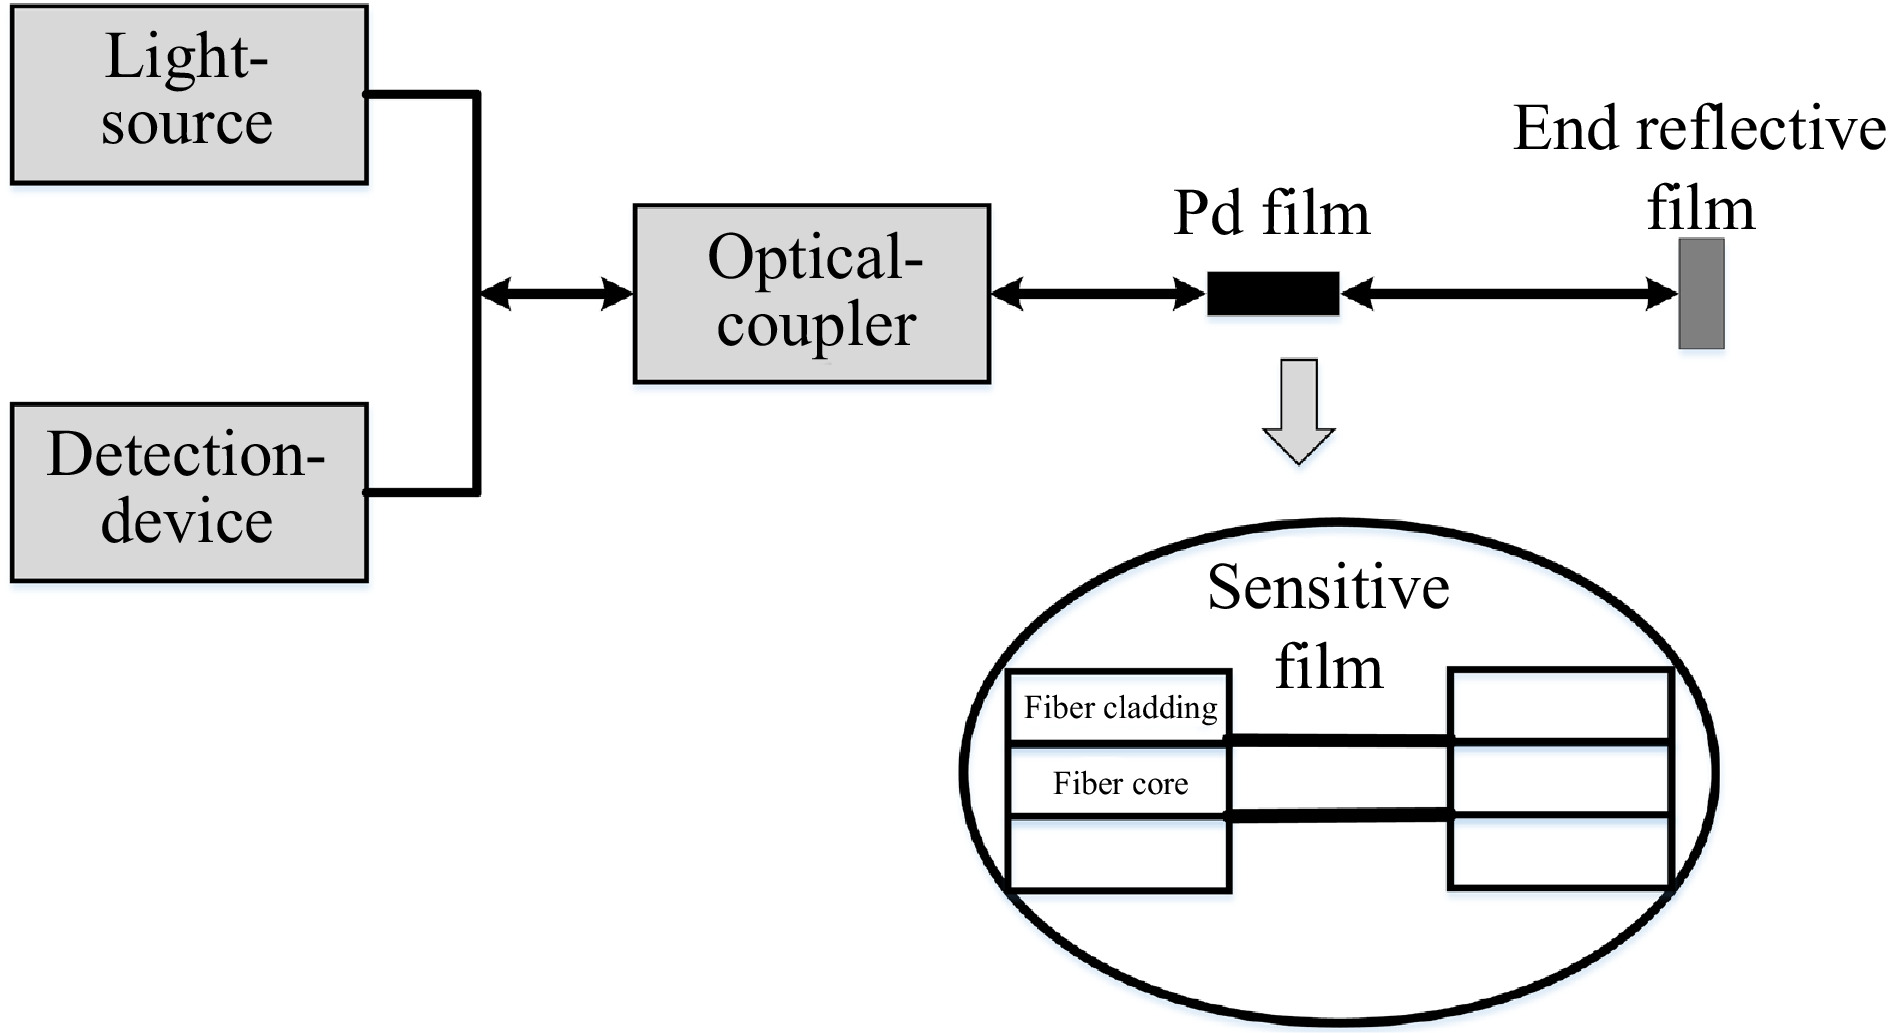
Figure 3.
Functional diagram of an evanescent field hydrogen sensor.
-
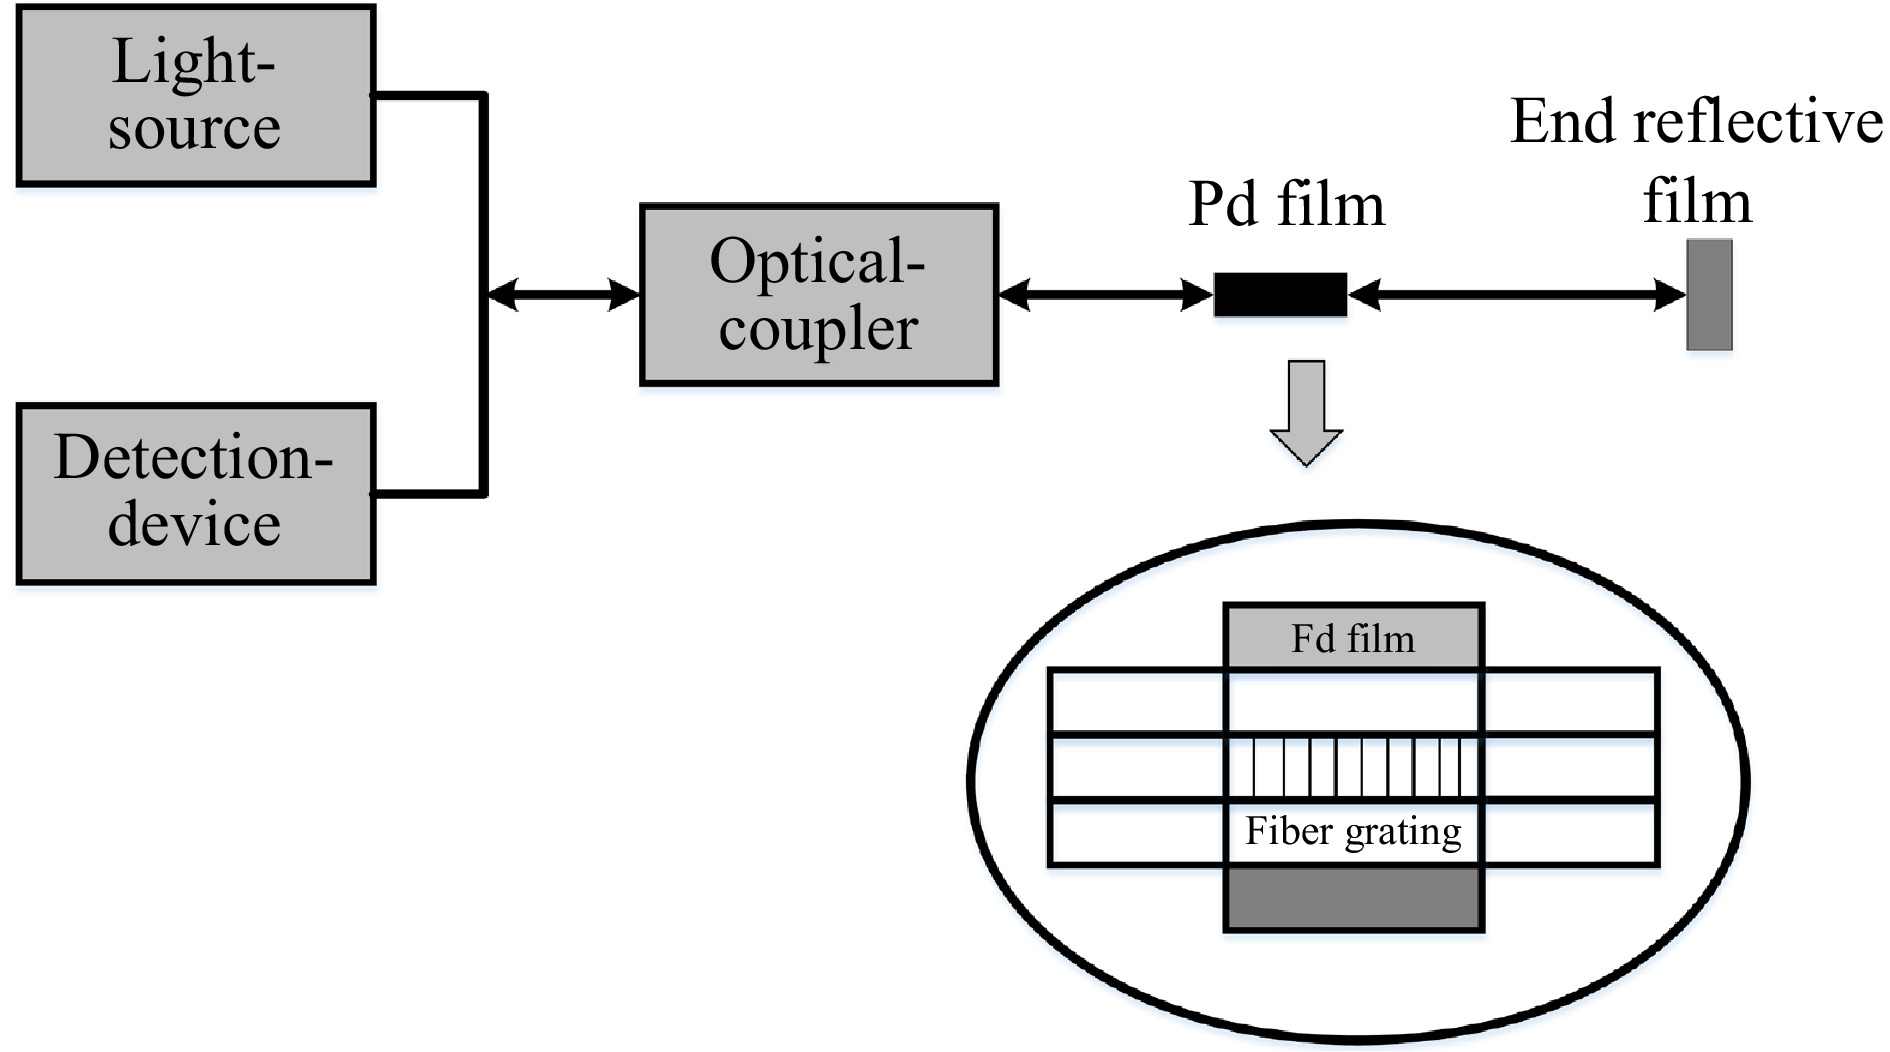
Figure 4.
Functional diagram of fiber grating hydrogen sensors.
-
Gas state Natural gas Hydrogen Propane Diffusion state 1.0 3.8 0.63 Laminar condition 1.0 1.26 1.38 Turbulent condition 1.0 2.83 0.6 Table 1.
Leakage rates of hydrogen and propane relative to natural gas.
-
Order Organization Standard number Standard names 1 Standardization Administration of the People's Republic of China (SAC) GB/T 23751.1-2009 Micro fuel cell power systems—Part 1: Safety 2 GB/T 24549-2009 Fuel cell electric vehicles-Safety requirements 3 GB/T 27748.1-2017 Stationary fuel cell power systems—Part 1:safety 4 GB/T 29729-2013 Essential requirements for the safety of hydrogen systems 5 GB/T 30084-2013 Portable fuel cell power system-Safety 6 GB/T 31036-2014 Proton exchange membrane fuel cell backup power system-Safety 7 GB/T 31037.1-2014 Fuel cell power system used for industrial lift truck applications—Part 1: Safety 8 GB/T 31139-2014 Safety technical regulations for mobile hydrogen refueling facility 9 GB/T 34539-2017 Safety requirements on hydrogen-oxygen generator 10 GB/T 34544-2017 Safety test methods for onboard low pressure hydrogen storage devices for small fuel cell vehicles 11 GB/T 34583-2017 Safety technical requirements for hydrogen storage devices used in hydrogen fuelling station 12 GB/T 34584-2017 Safety technical regulations for hydrogen refueling station 13 GB/T 36288-2018 Fuel cell electric vehicles-Safety requirement of fuel cell stack 14 International Organization for Standardization (ISO) ISO/TR 15916:2015 Basic considerations for the safety of hydrogen systems 15 ISO 16110-1:2007 Hydrogen generators using fuel processing technologies Part1: Safety 16 ISO/TS 19883:2017 Safety of pressure swing adsorption systems for hydrogen separation and purification 17 ISO 21266-1:2018 Road vehicles — Compressed gaseous hydrogen (CGH2) and hydrogen/natural gas blends fuel systems—Part 1: Safety requirements 18 ISO 23273:2013 Fuel cell road vehicles — Safety specifications — Protection against hydrogen hazards for vehicles fuelled with compressed hydrogen 19 American National Standards Institute (ANSI) ANSI/AIAAG-095A-2017 Hydrogen and Hydrogen Systems Table 2.
Overview of hydrogen safety standards at home and abroad.
-
Standard Scope of
applicationsGas cylinder test items Normative requirements
of the industrial chainOther quality assurance terms GB/T 35544-2017 Aluminum liner carbon fiber fully wound gas cylinder Winding layer mechanical property test, winding layer appearance inspection, hydraulic pressure test, air tightness test, hydraulic burst test, normal temperature pressure cycle test, fire test, extreme temperature pressure cycle test, accelerated stress rupture test, crack tolerance test, environmental test, drop test, hydrogen gas cycle test, gunshot test, durability test, performance test The packaging, transportation and storage of cylinders after the completion of the manufacture are specified, without involving the storage and transportation of relevant raw materials Only manufacturing units are required to provide mass inspection quality certificates ANSI HGV2-2014
and ISO/CD 19881:2015Four types of gas cylinders Environmental cycling test, extreme temperature cycling test, hydraulic burst test, defect tolerance test, drop test, fire test, accelerated stress fracture test, high strain rate impact test, penetration test, torque test, hydrogen cycle test, leakage test before fracture No related terms The manufacturing units needs to establish and operate a quality management system in accordance with the provisions of ISO9001. Table 3.
Main differences between domestic and foreign standard clauses.
-
Author Published Sensor head Performance Reference Butler & Ginley 1988 10 nm Ti + 10 um Pd Detecting concentration (DC) > 0.6%, response time (RT): 3 min [44] Zeakes et al. 1994 50 um Fabry-Perot cavity RT: 5 s, Sensitivity: 35 ppm/%, poor repeatability [45] Maciak & Opilski 2007 TiO2 film + NiOx film DC < 4%, RT < 1 min, Recovery time (RCT) < 1 min, excellent stability [46] Wang et al. 2012 Pd-coated open air-cavity Sensitivity: 155 pm/%, Weak anti-interference ability [47] Kim et al. 2012 Ni (adhesion layer) +
Pd(sensing layer)DC: 4%, RT: 50 s, Sensitivity: 0.7 nm to 4% H2 [48] Gu et al. 2015 Pd-Au alloy nanowire DC: 0−20%, RT: 200 s, Sensitivity: 0.175 nm/%, RCT: 400 s [43] Xu et al. 2017 Hollow core fiber + Single mode fiber (SMF) + Fiber Bragg grating DC: 0.2%, RT < 30 s, Sensitivity: 0.85 nm/%, greet repeatability [49] Liu et al. 2019 Nanopatterned Pd film DC: 1%−3%, RT: ~25 s, Sensitivity: ~1.3 nm/% [50] Table 4.
Performance comparison of interferometer hydrogen sensors.
-
Author Published Sensor head Performance Reference Butler 1991 10 nm Pd film Detecting concentration (DC): 0.2%−2%, sensitivity: ~0.035/% [51] Jung et al. 1998 Pd alloy film DC: ~4%, RT: ~20 s, great repeatability [52] Bévenot et al. 2000 13 nm Pd metal layer DC: 1%−17%, RT < 5 s, poor stability [53] Westerwaal et al. 2013 Pd81Au19 + Ti DC: 0.5%−4%, RT < 15 s, good hydrogen selectivity and repeatability [54] Table 5.
Performance comparison of micro-mirror hydrogen sensors.
-
Author Published Sensor head Performance Reference Tabib-Azar et al. 1999 Pd film with 10 nm thickness and 1.5 cm length Detecting concentration (DC): 0.2%−6%, response time (RT): 20−30 s, great repeatability [56] Sekimoto et al. 2000 Pd/WO3 composite film DC: ~0.2%, RT: 20 s, great repeatability [57] Villatoro et al. 2003 SMF + Pd film DC: ~0−10.5%, RT < 100 s, Recovery time (RCT): 75 s [58] Villatoro et al. 2005 Multimode tapered fiber + Pd film When the thickness of Pd film is 4 nm, the response time of the sensor with a concentration of 3.5% is 10 s [59] Monzon-Hernandez et al, 2010 Au-Pd nanoparticle film The response time of the sensor to 4% hydrogen is 5s, poor sensitivity [60] Li et al. 2018 Pd +Poly(methyl methacrylate) DC: 0.2%−1%, RT: 5 s, sensitivity: 5.58 nm/% [61] Table 6.
Performance comparison of evanescent field hydrogen sensors.
-
Author Published Sensor head Performance Reference Chadwick & Gal 1993 Pd/Ni alloy film DC: 0.1%−10%, response time (RT): ~30 s [62] Perrotton et al. 2011 35 nm Ag/100 nm SiO2/3.75 nm Pd DC: ~4%, RT < 15 s [63] Wang et al. 2013 35 nm Ag/100 nm SiO2/180 nm WO3/3 nm Pt DC: < 2%, sensitivity: 17.4 nm at 2% [64] Hosoki et al. 2014 25 nm Au/60 nm Ti2O5/10 nm Pd DC: 4%, RT: 8 s, sensitivity: 7 nm/% [65] Beni et al. 2019 WO3/Pd + Y/Pd nano-disk DC: 0−100%, RT: 10 s, sensitivity: 60 nm at 4%,
RCT: 5 min[66] Table 7.
Performance comparison of SPR hydrogen sensors.
-
Author Published Sensor head Performance Reference Sutapun et al. 1999 Fiber Grating + 560 nm Pd Detecting concentration (DC): 0.8%−1.3%, response time (RT): 10 min [68] Aleixandrea et al. 2005 Fiber grating + 5 nm Pd film DC: ~0.8%−1.3%, sensitivity: 8.4 pm/% [69] Trouillet et al. 2005 5 nm Pd film DC: < 4%, sensitivity: 14 pm at 4% [70] Schroeder et al. 2009 Pd film + fiber grating DC: 0−2%, sensitivity: 33 pm/% [71] Yan et al. 2016 100 nmAu/50 nm WO3/ 30 nm Pd DC: 0.086 cc, RT: 4 s, sensitivity: 70 nm/cc [72] Table 8.
Performance comparison of fiber grating hydrogen sensors.
Figures
(4)
Tables
(8)