-
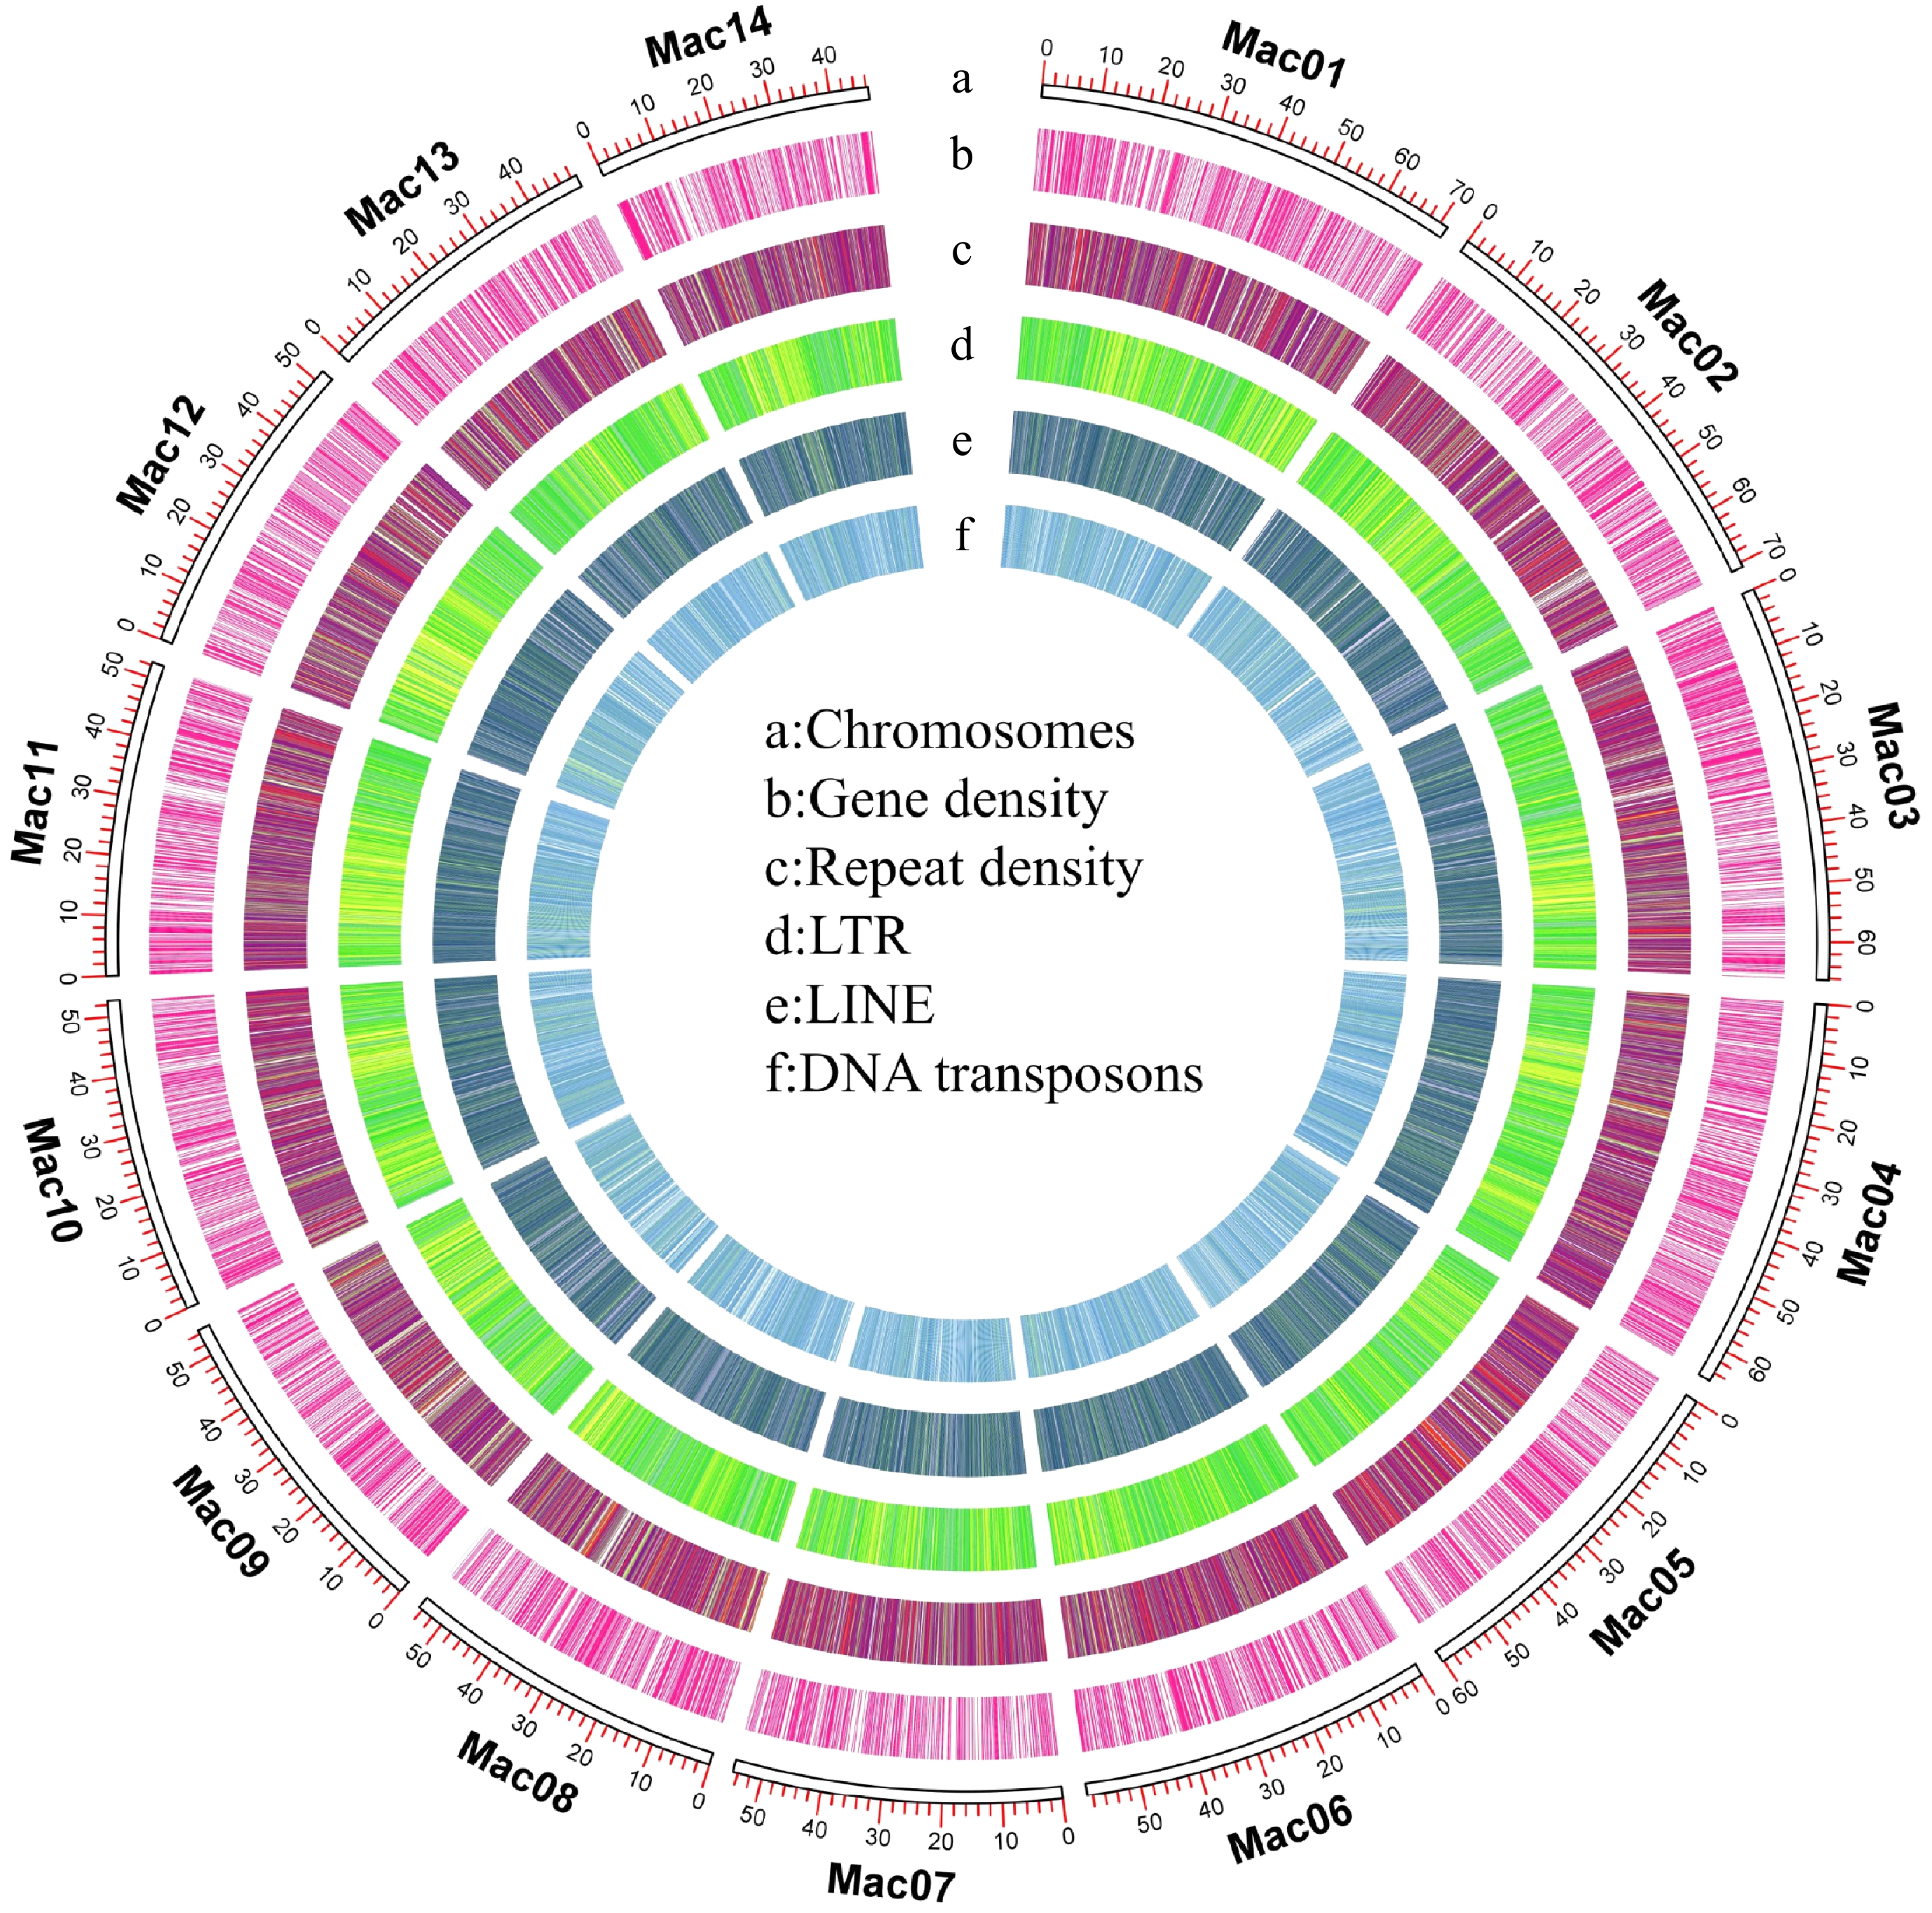
Figure 1.
Overview of the macadamia genome. (a) Chromosomes, (b) gene density, (c) repeat density, (d) long terminal repeats (LTRs), (e) long interspersed nuclear elements (LINEs), (f) DNA transposons.
-
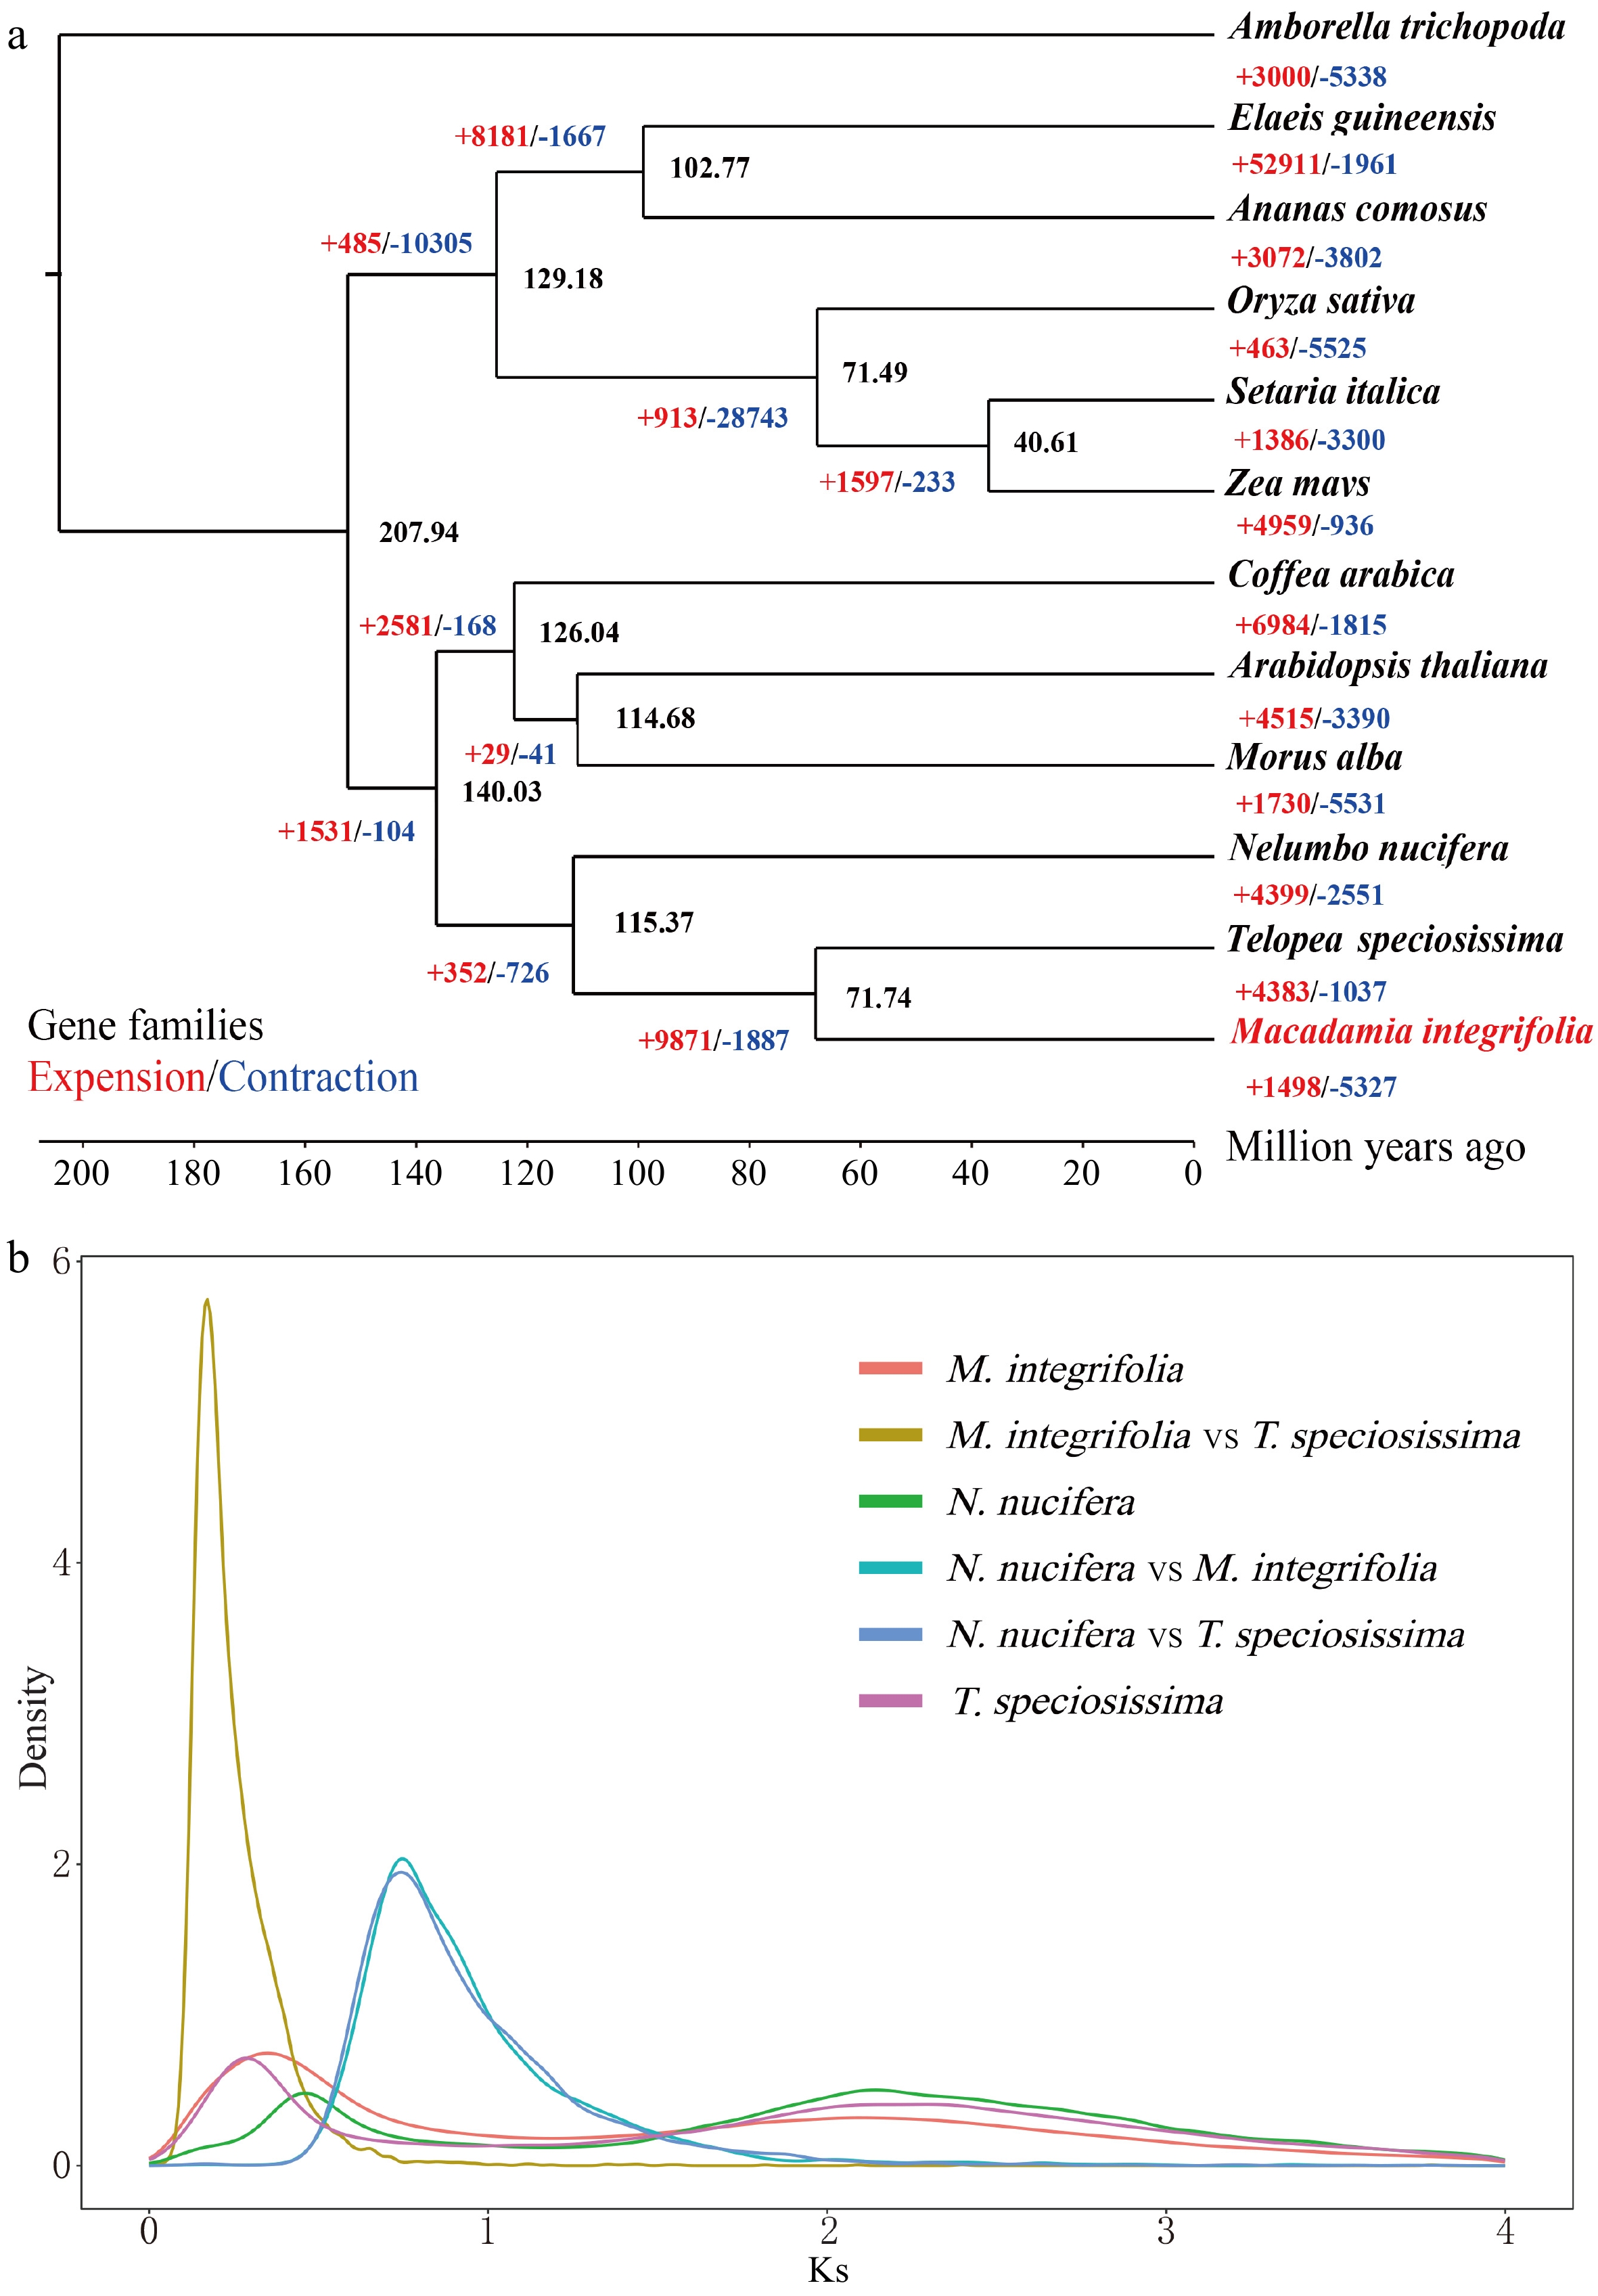
Figure 2.
Genome evolution analysis. (a) Phylogenetic tree of 12 species constructed using single-copy orthologs. (b) Frequency distribution of synonymous substitution rates (Ks) between homologous gene pairs in the syntenic blocks of M. integrifolia, M. integrifolia vs T. speciosissima, N. nucifera, N. nucifera vs M. integrifolia, N. nucifera vs T. speciosissima, and T. speciosissima.
-
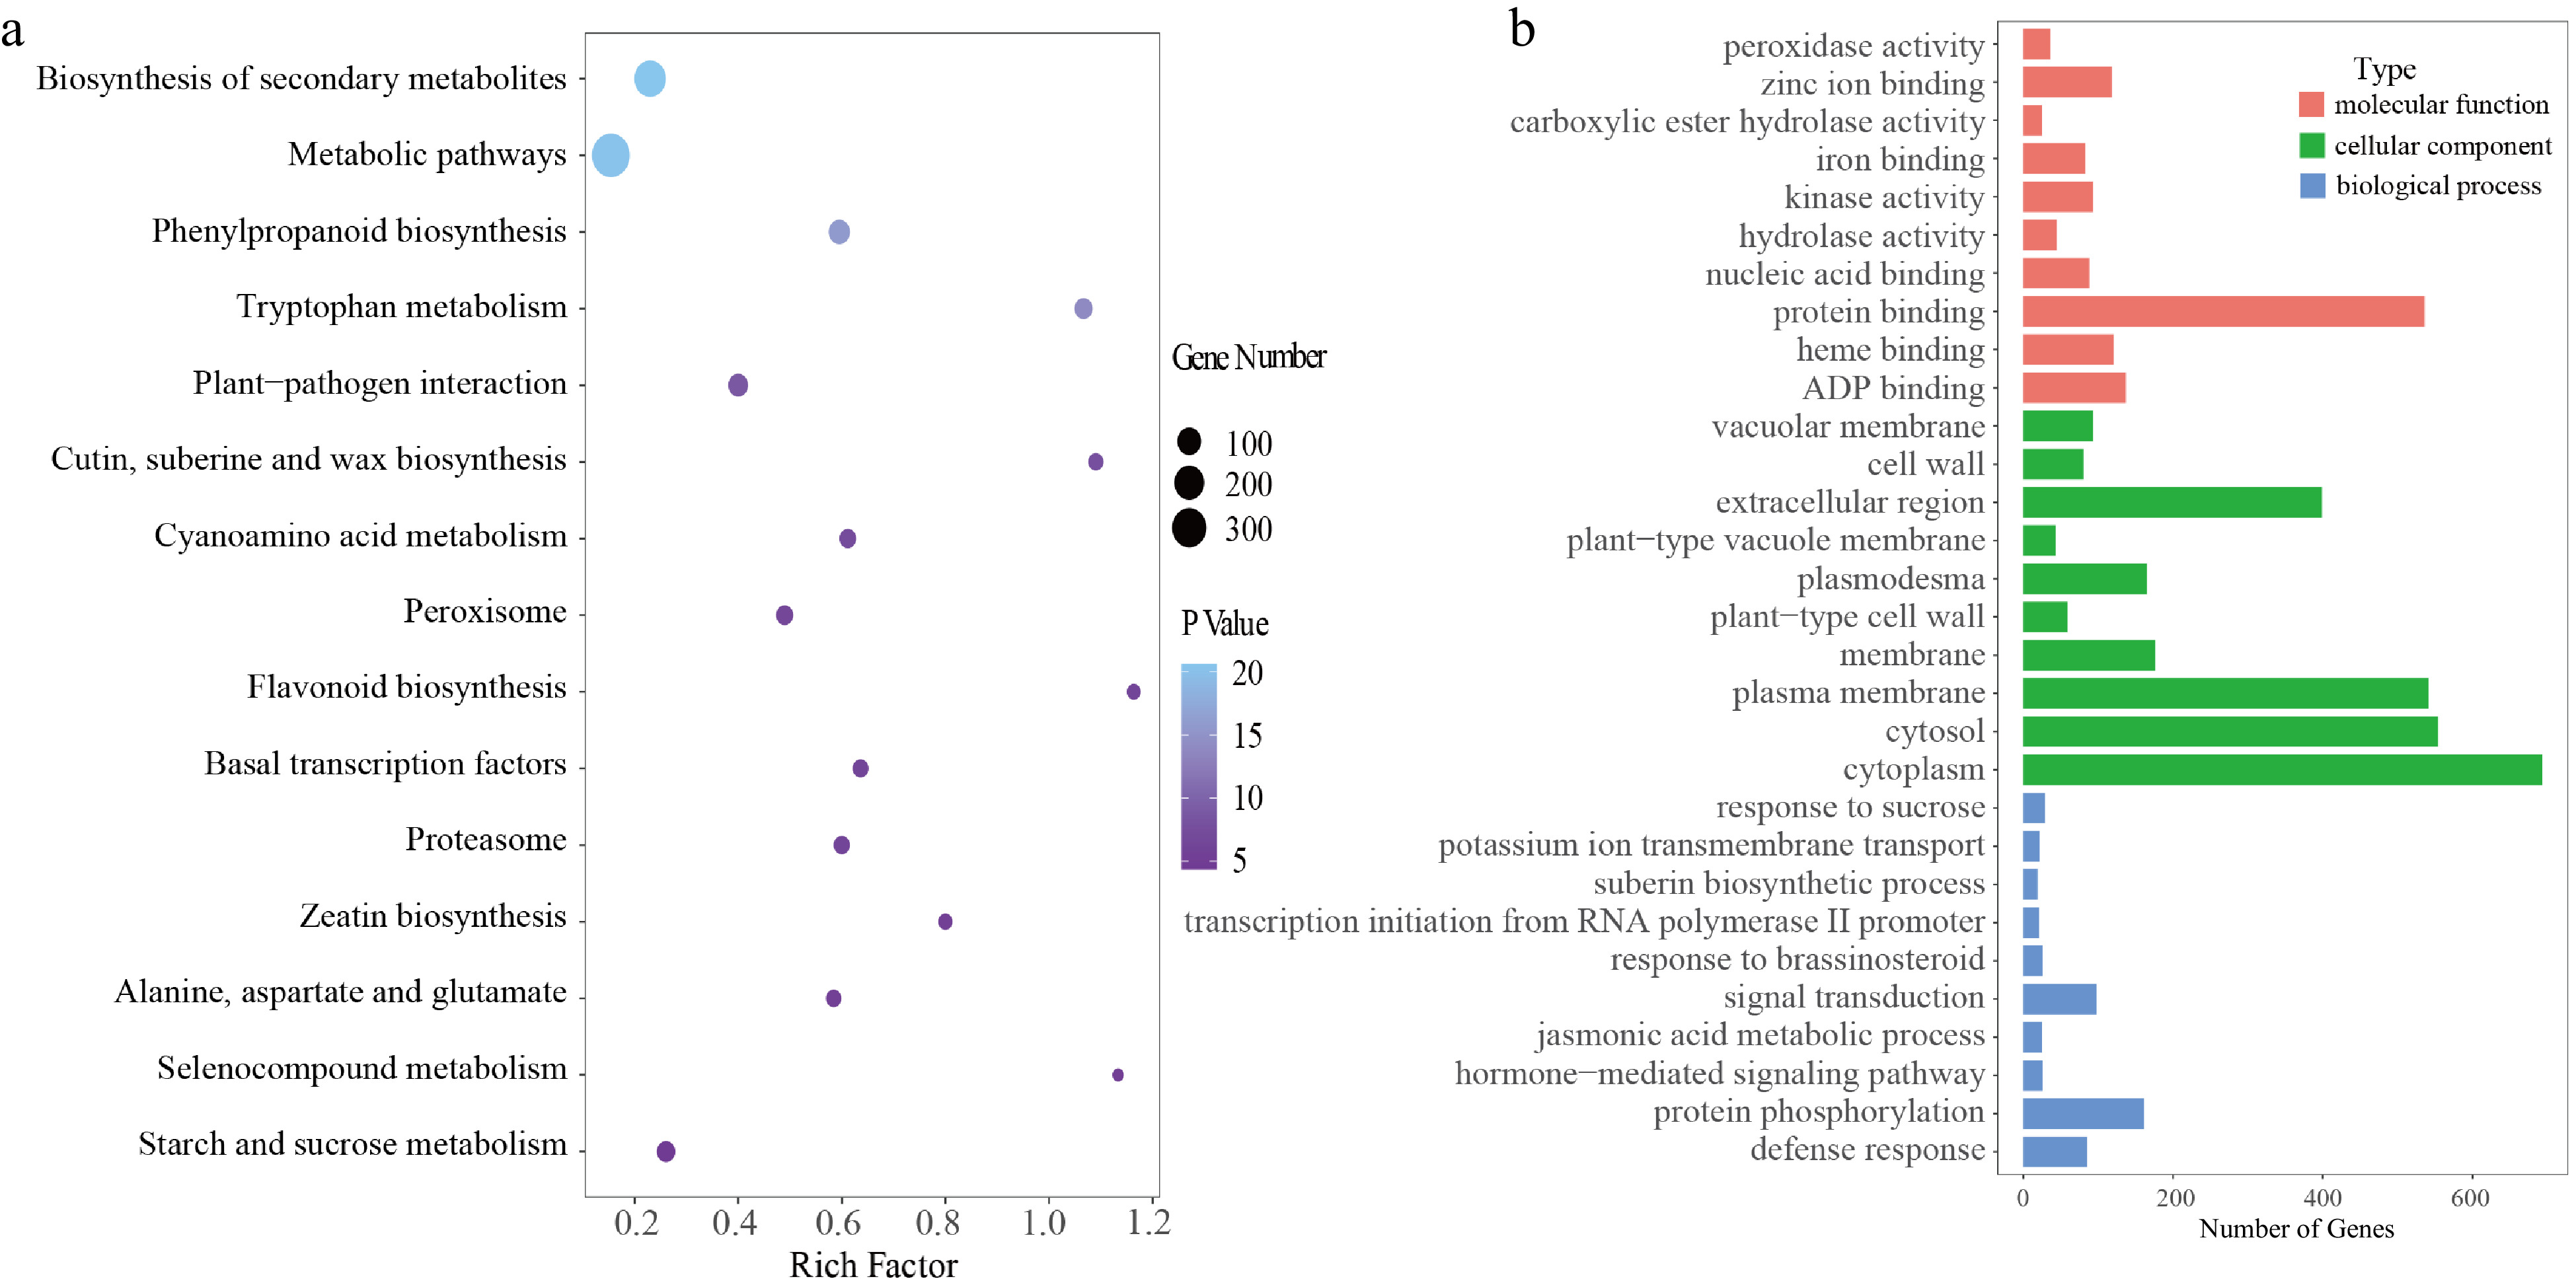
Figure 3.
Gene family analysis. (a) KEGG analysis of unigenes in the GR1 genome, (b) GO analysis of unigenes in the GR1 genome.
-
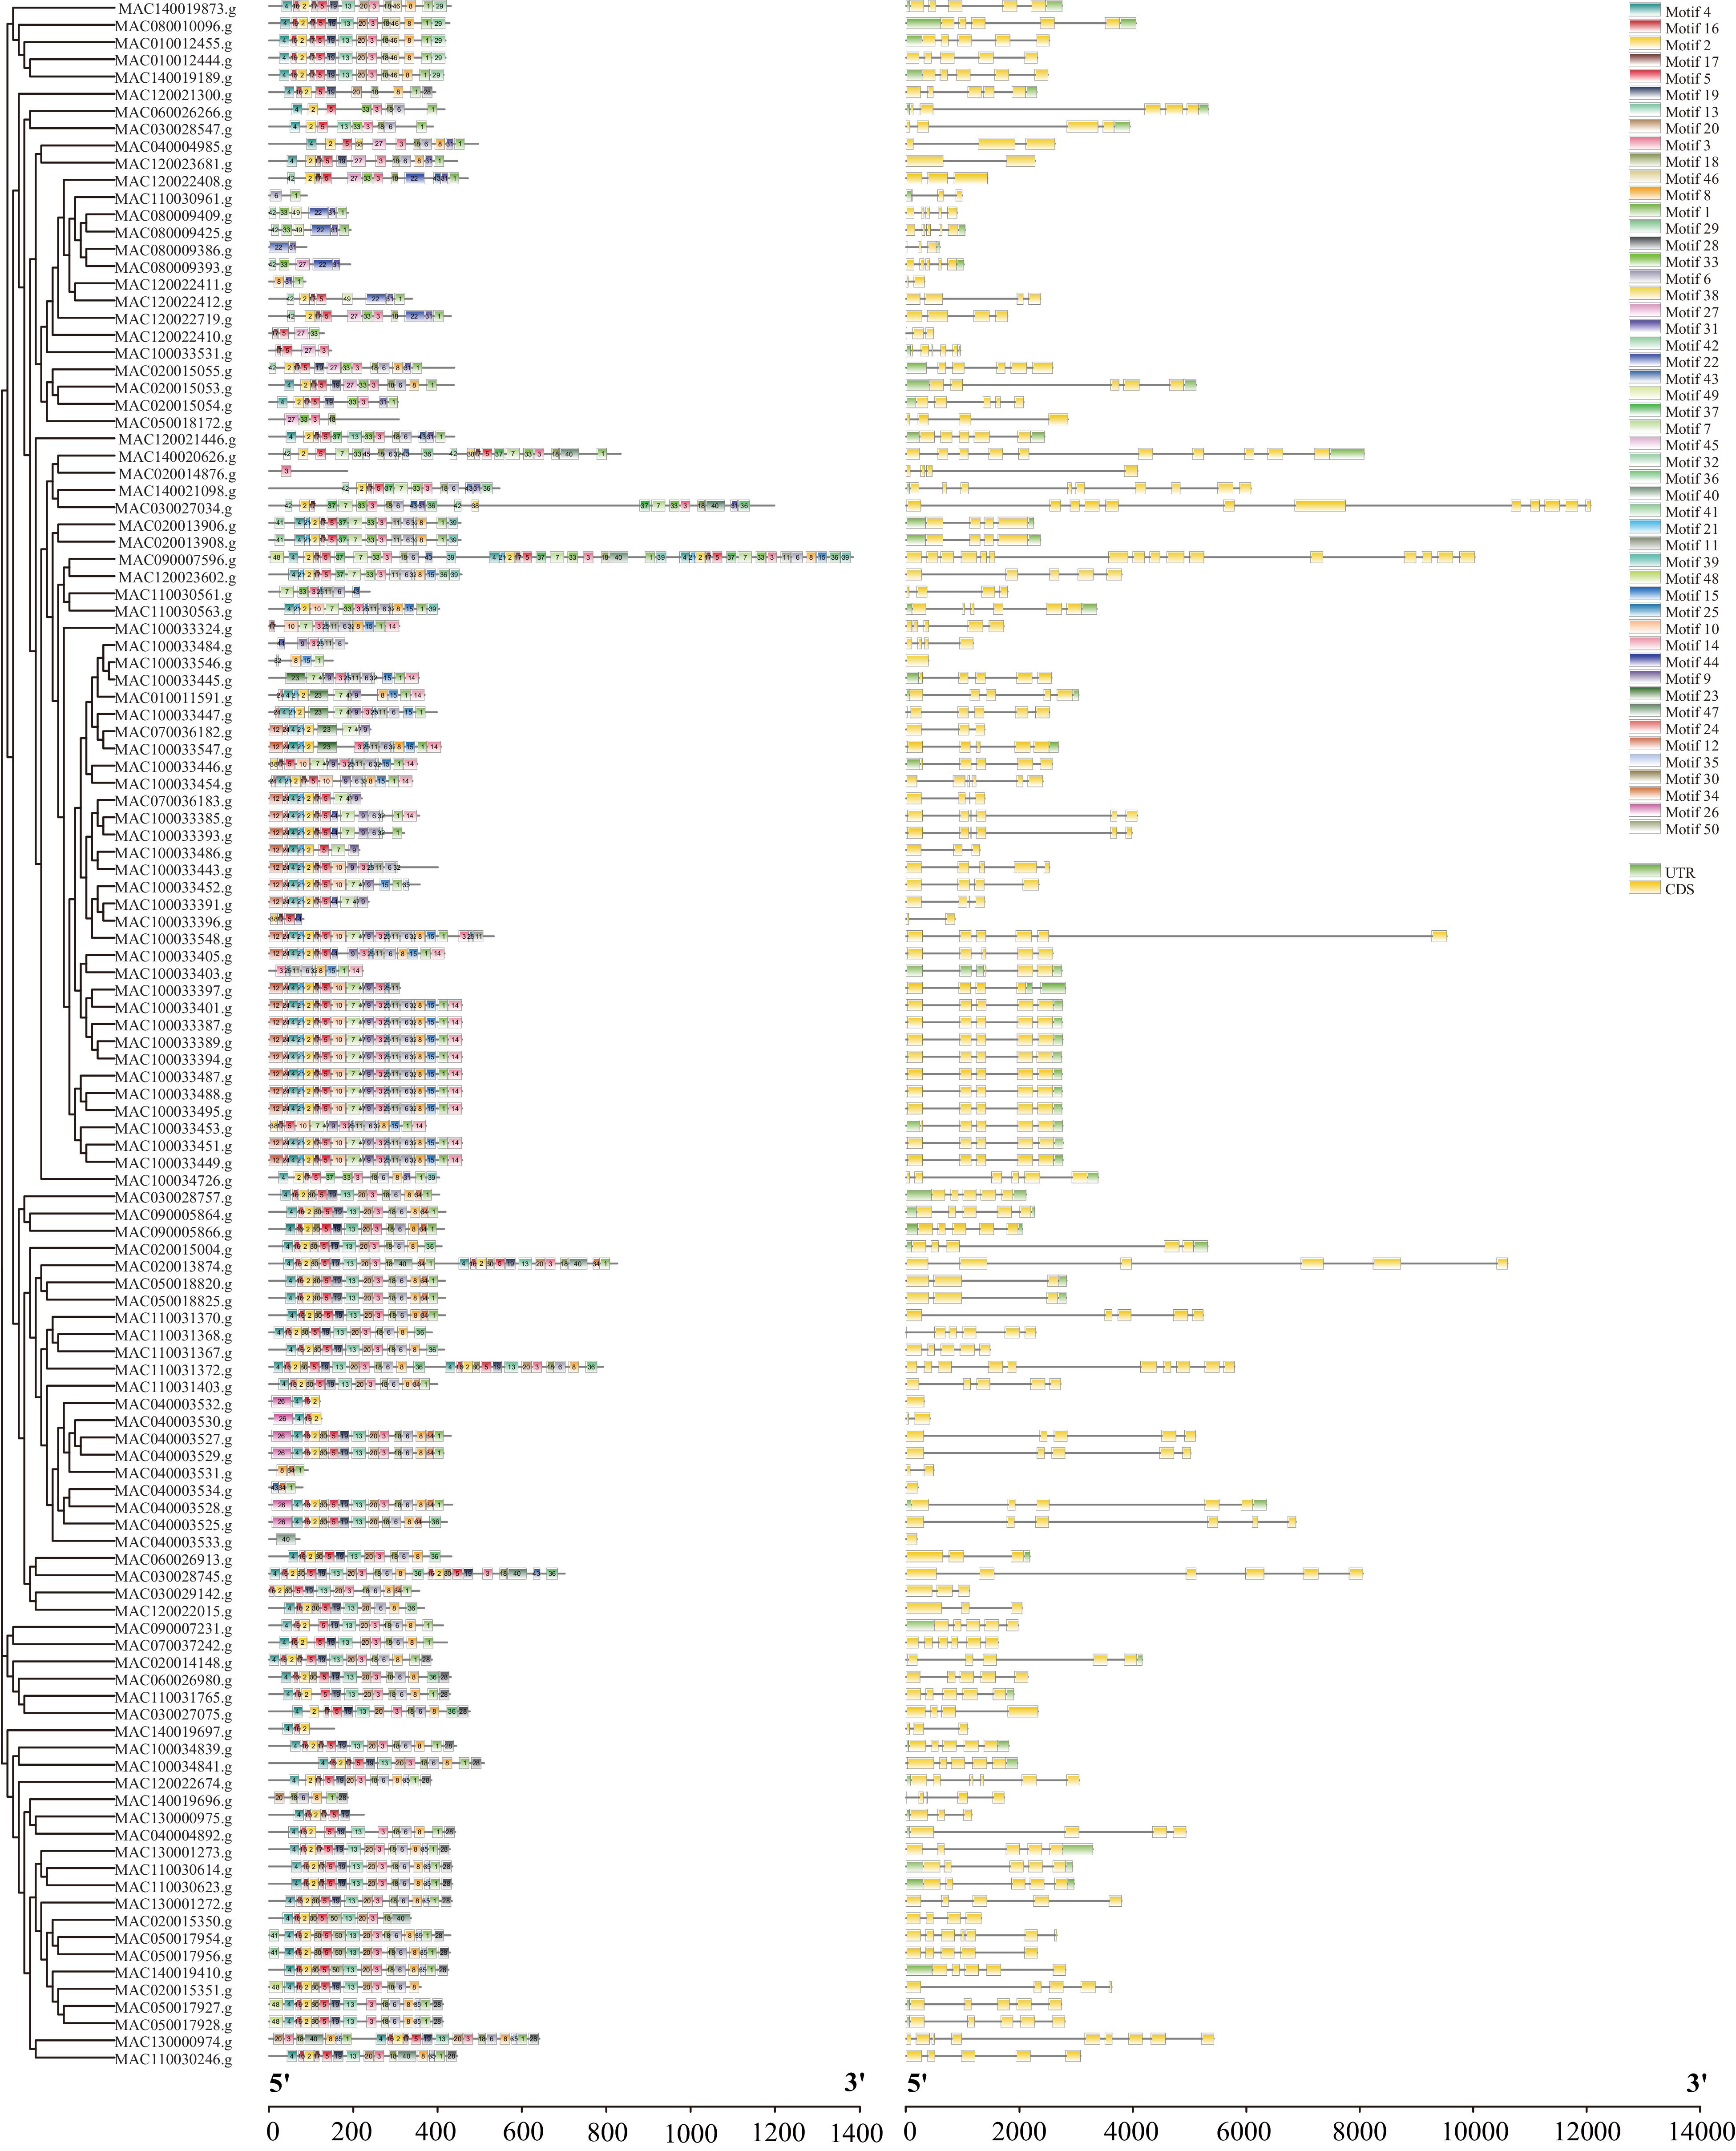
Figure 4.
Analysis of conserved motifs and gene structure of the GELP family.
-
Statistic Contig length
(bp)Contig no. Scaffold length
(bp)Scaffold no. N50 1,971,883 124 55,868,876 7 N80 494,409 388 50,524,966 11 N90 166,444 729 47,725,559 13 Longest 30,625,757 − 77,511,179 − Total 924,331,529 1,757 792,388,653 14 Table 1.
GR1 genome assembly statistics.
Figures
(4)
Tables
(1)