-
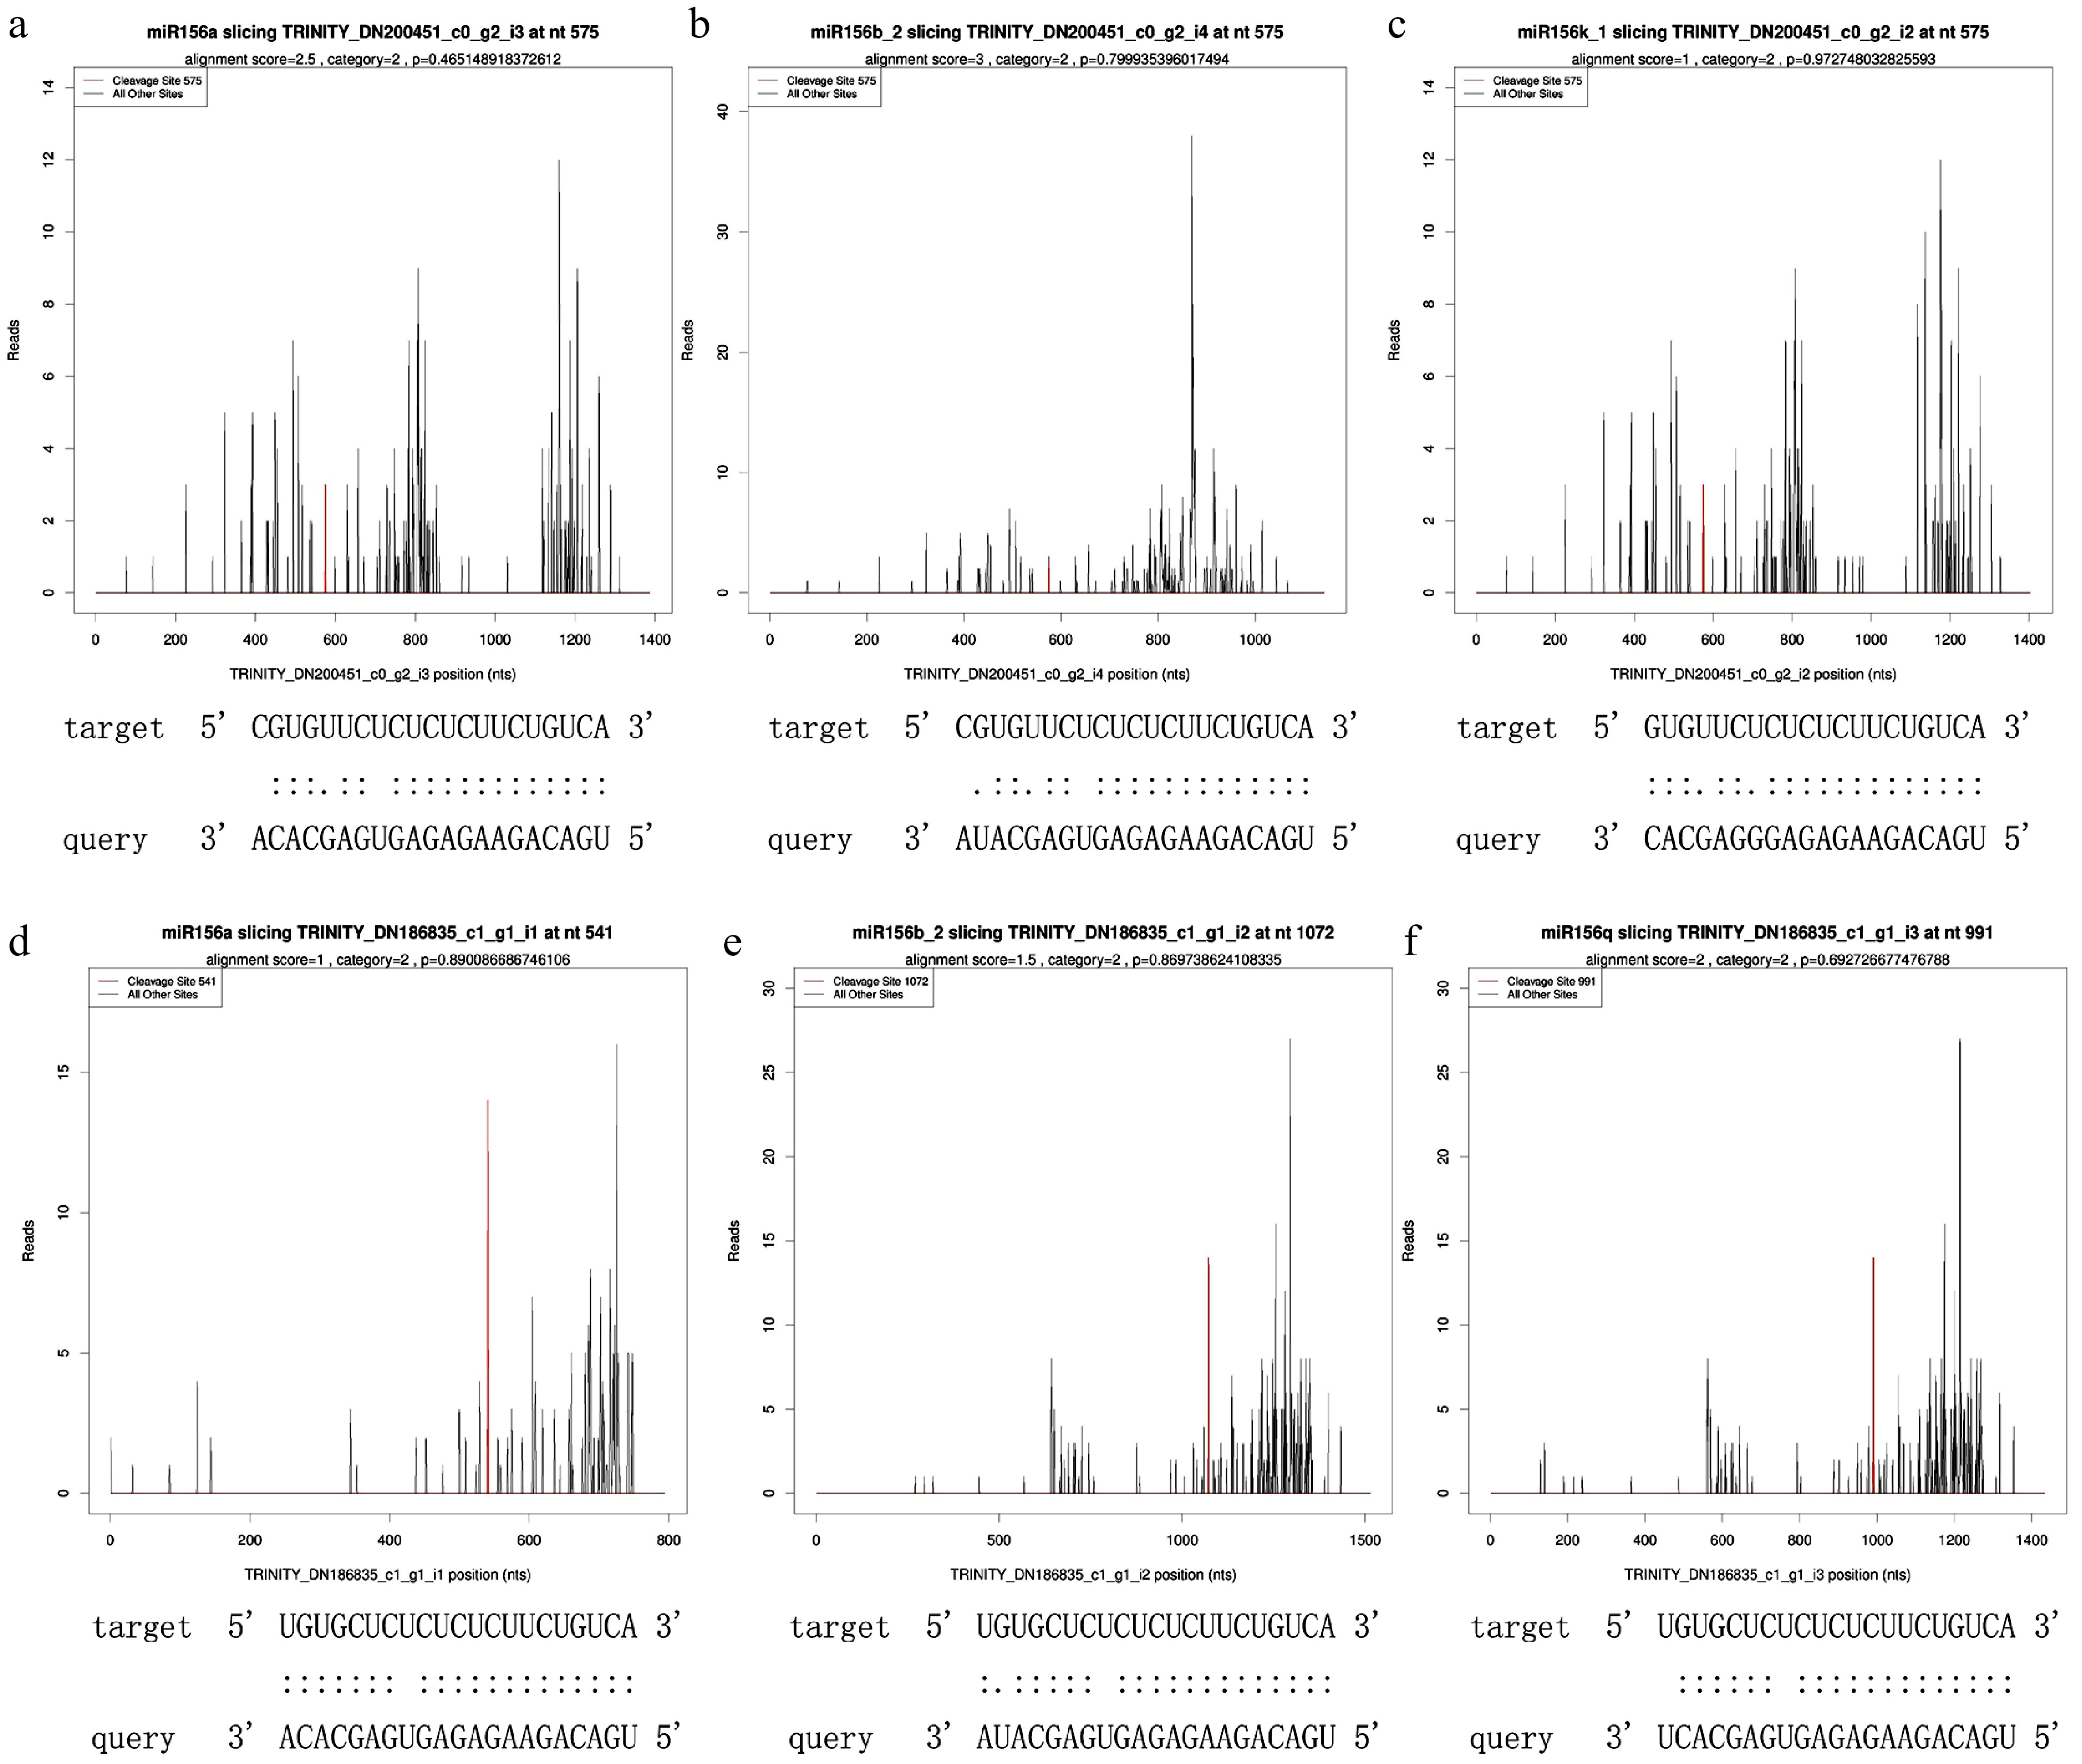
Figure 1.
T-plot of miR156 and its target SPLs. (a) miR156a targeted SPL3, alignment score was 2.5, cleaveage site was 575, category site was 2 and p-value was 0.465149. (b) miR156b_2 targeted SPL3, alignment score was 3, cleaveage site was 575, category was 2, and p-value was 0.799935. (c) miR156k_1 targeted SPL3, alignment score was 1, cleaveage site was 575, category was 2, and p-value was 0.972748. (d) miR156a targeted SPL16, alignment score was 1, cleaveage site was 541, category was 2, and p-value was 0.890087. (e) miR156b_2 targeted SPL16 with alignment score of 1.5, cleaveage site of 1072, category of 2 and p-value of 0.869739. (f) miR156q targeted SPL16, alignment score was 2, cleaveage site was 991, category was 2, and p-value was 0.692727.
-
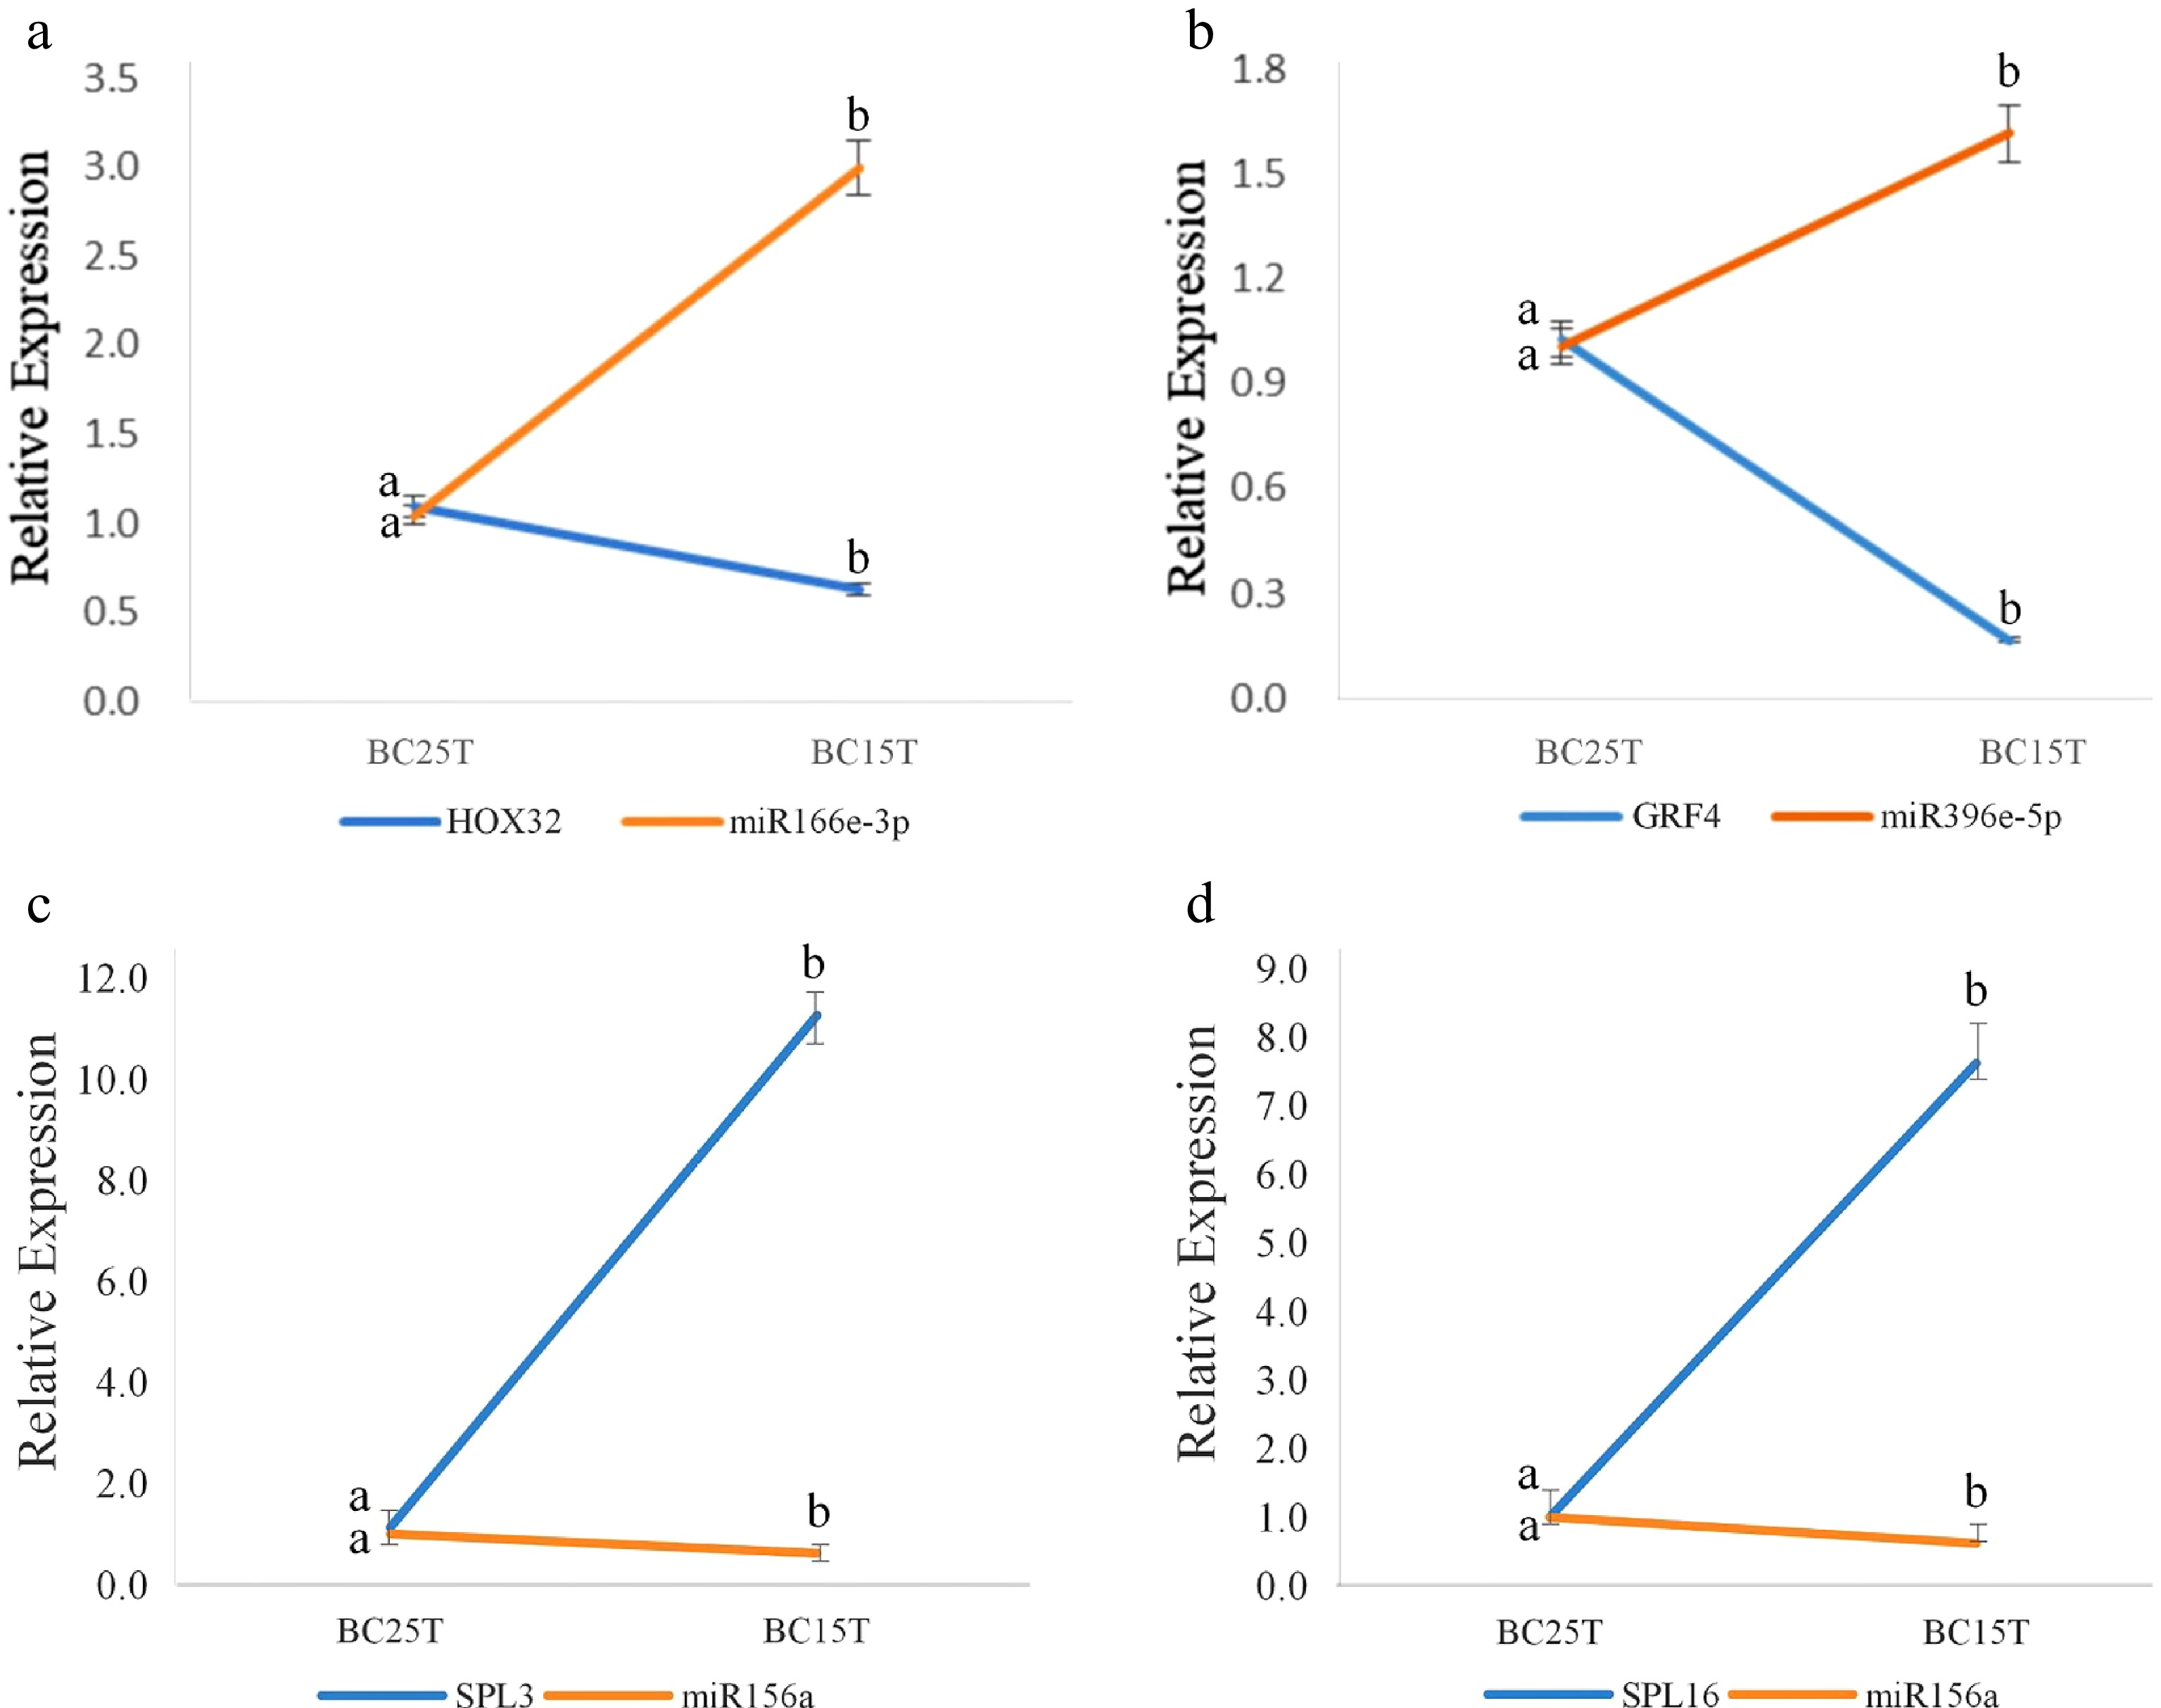
Figure 2.
qRT-PCR results of known miRNAs and their target genes. The figure shows the interactions between: (a) miR166e-3p and HOX32, (b) miR396e-5p and GRF4, (c) miR156a and SPL3, (d) miR156a and SPL16. After variable temperature treatment, miR166e-3p and miR396e-5p were up-regulated, while miR156a was down-regulated. Their target genes were opposite to their regulatory relationships. The average of three biological replicates was taken and significance analysis of expression in different samples was conducted. Different letters in the same graph indicate significant differences (p < 0.05).
-
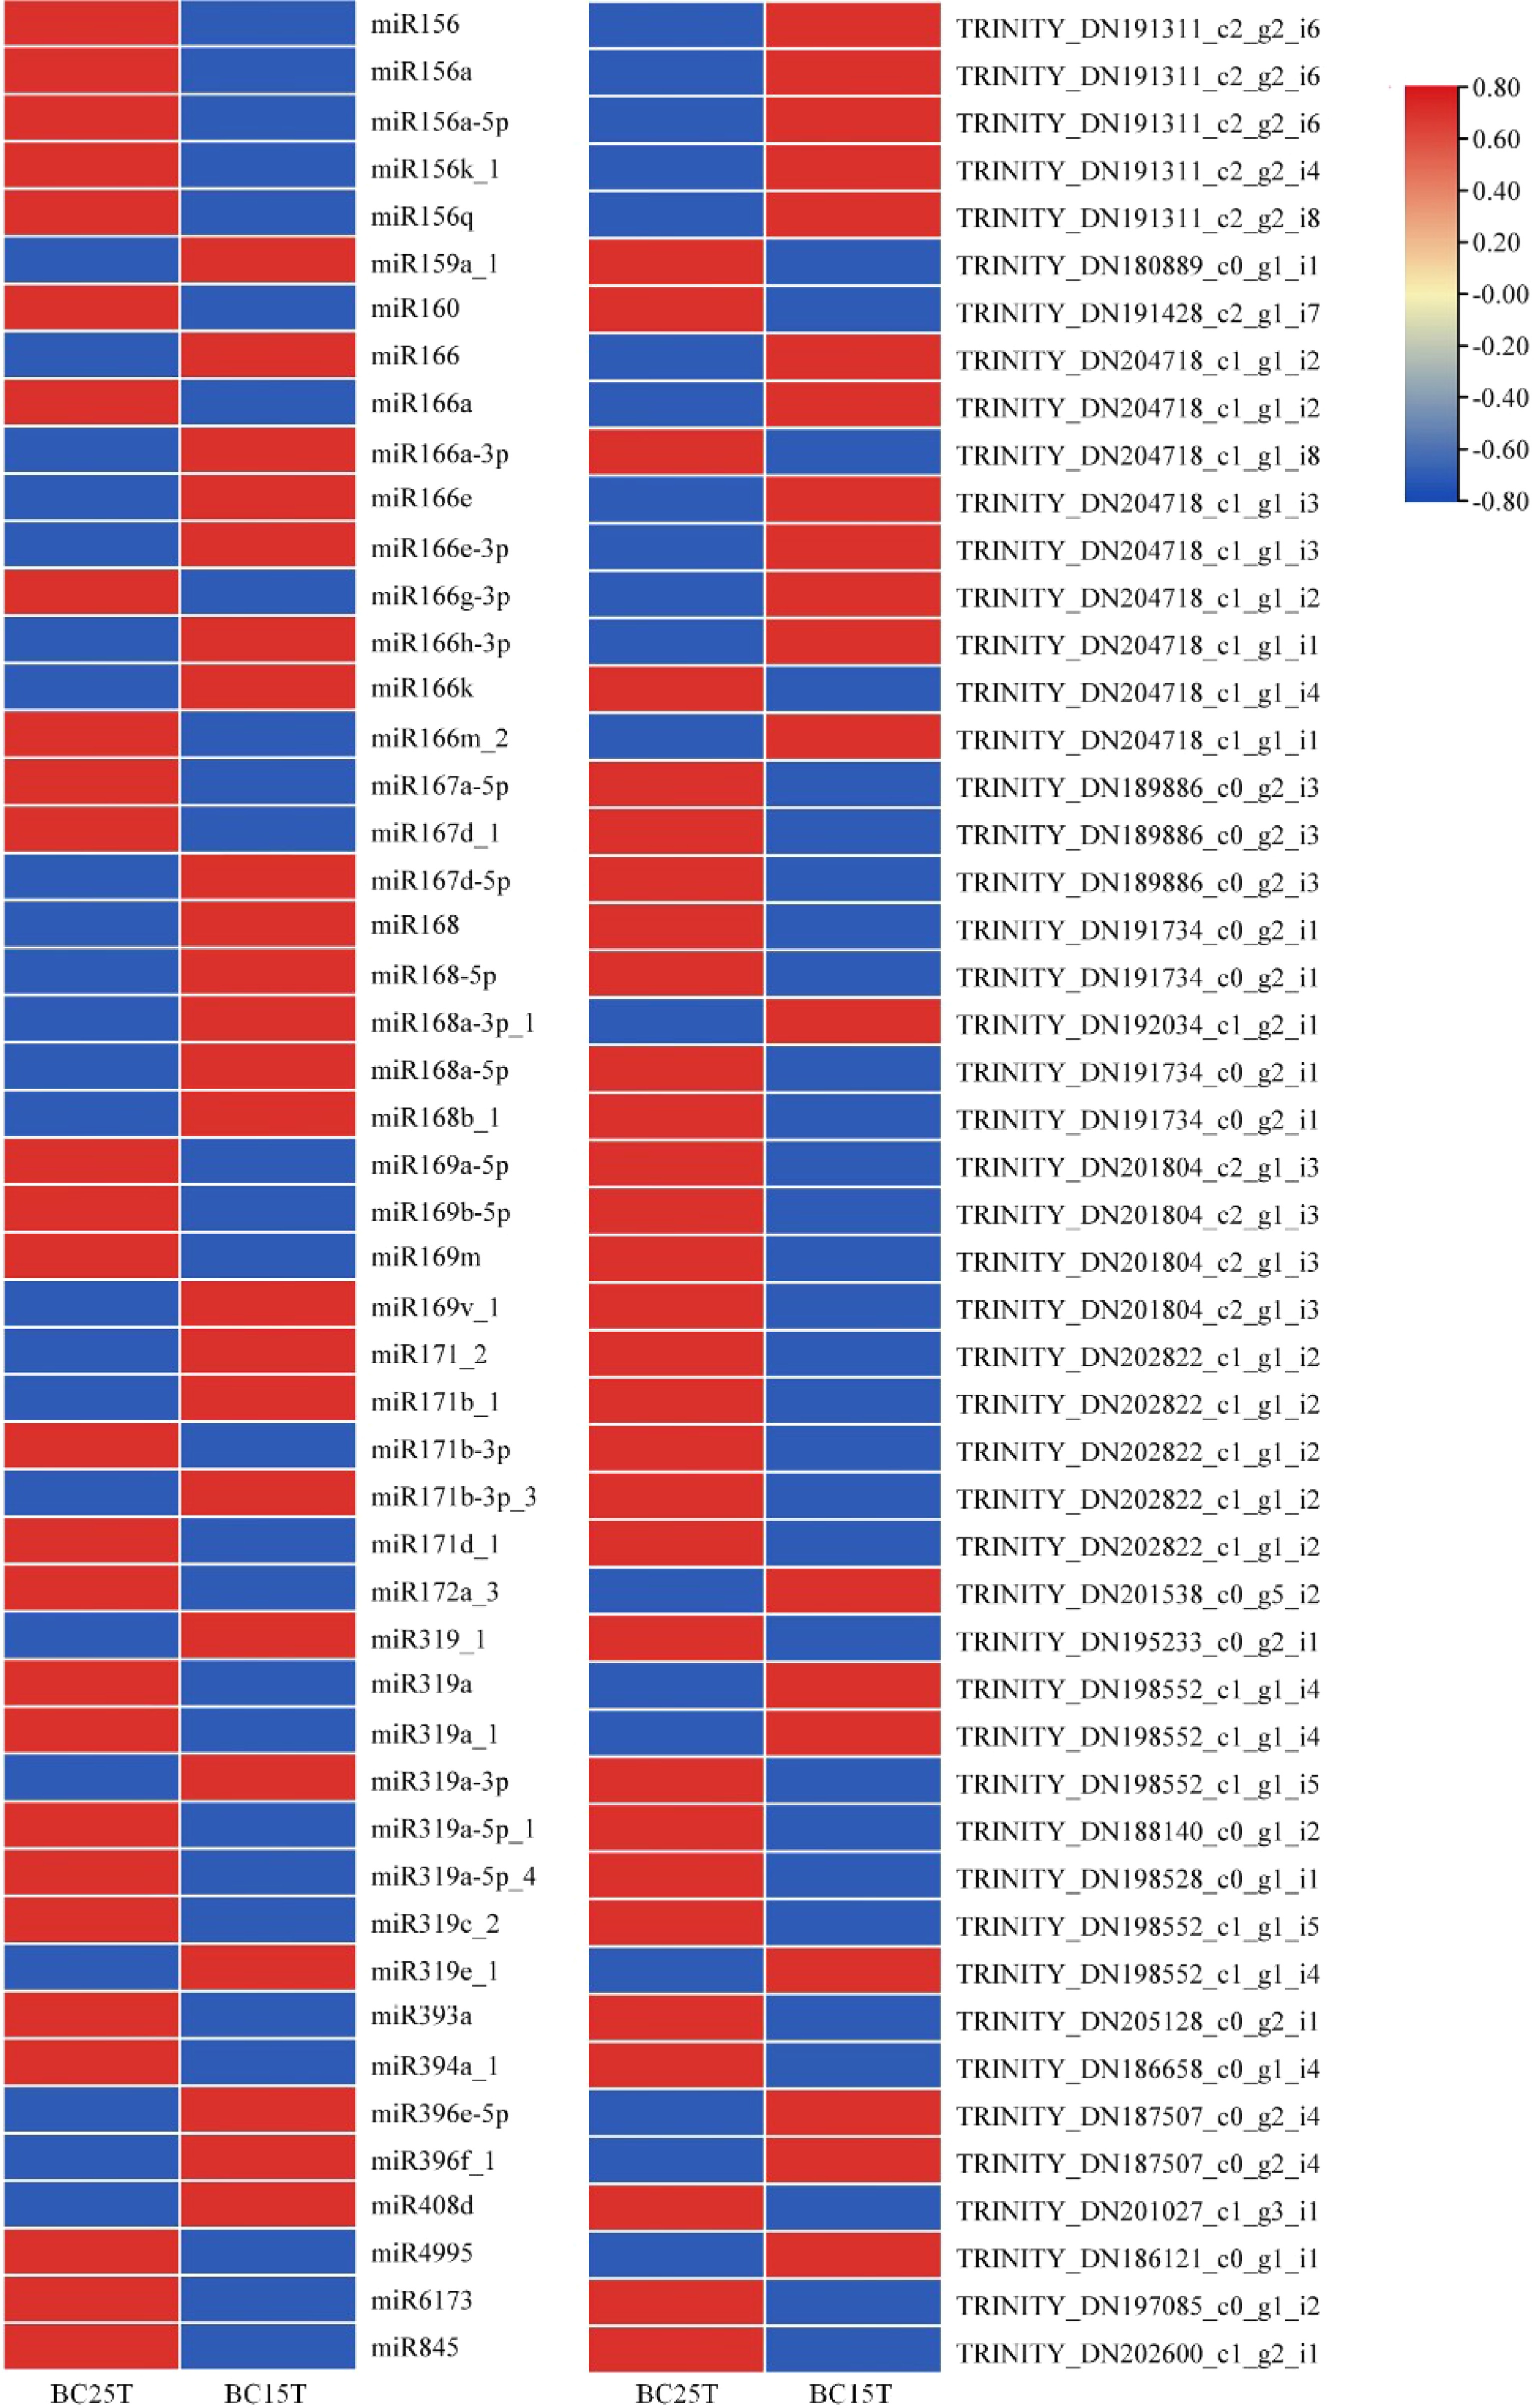
Figure 3.
Differential expression of miRNAs with target genes in Lilium bulbs after variable temperature treatment. Heat maps were created based on the expression data in the full comparison set. In the heat map, red and blue represented higher and lower expressions, respectively, and the opposite up- and down-regulation relationship between miRNA and target genes can be easily visualized.
-
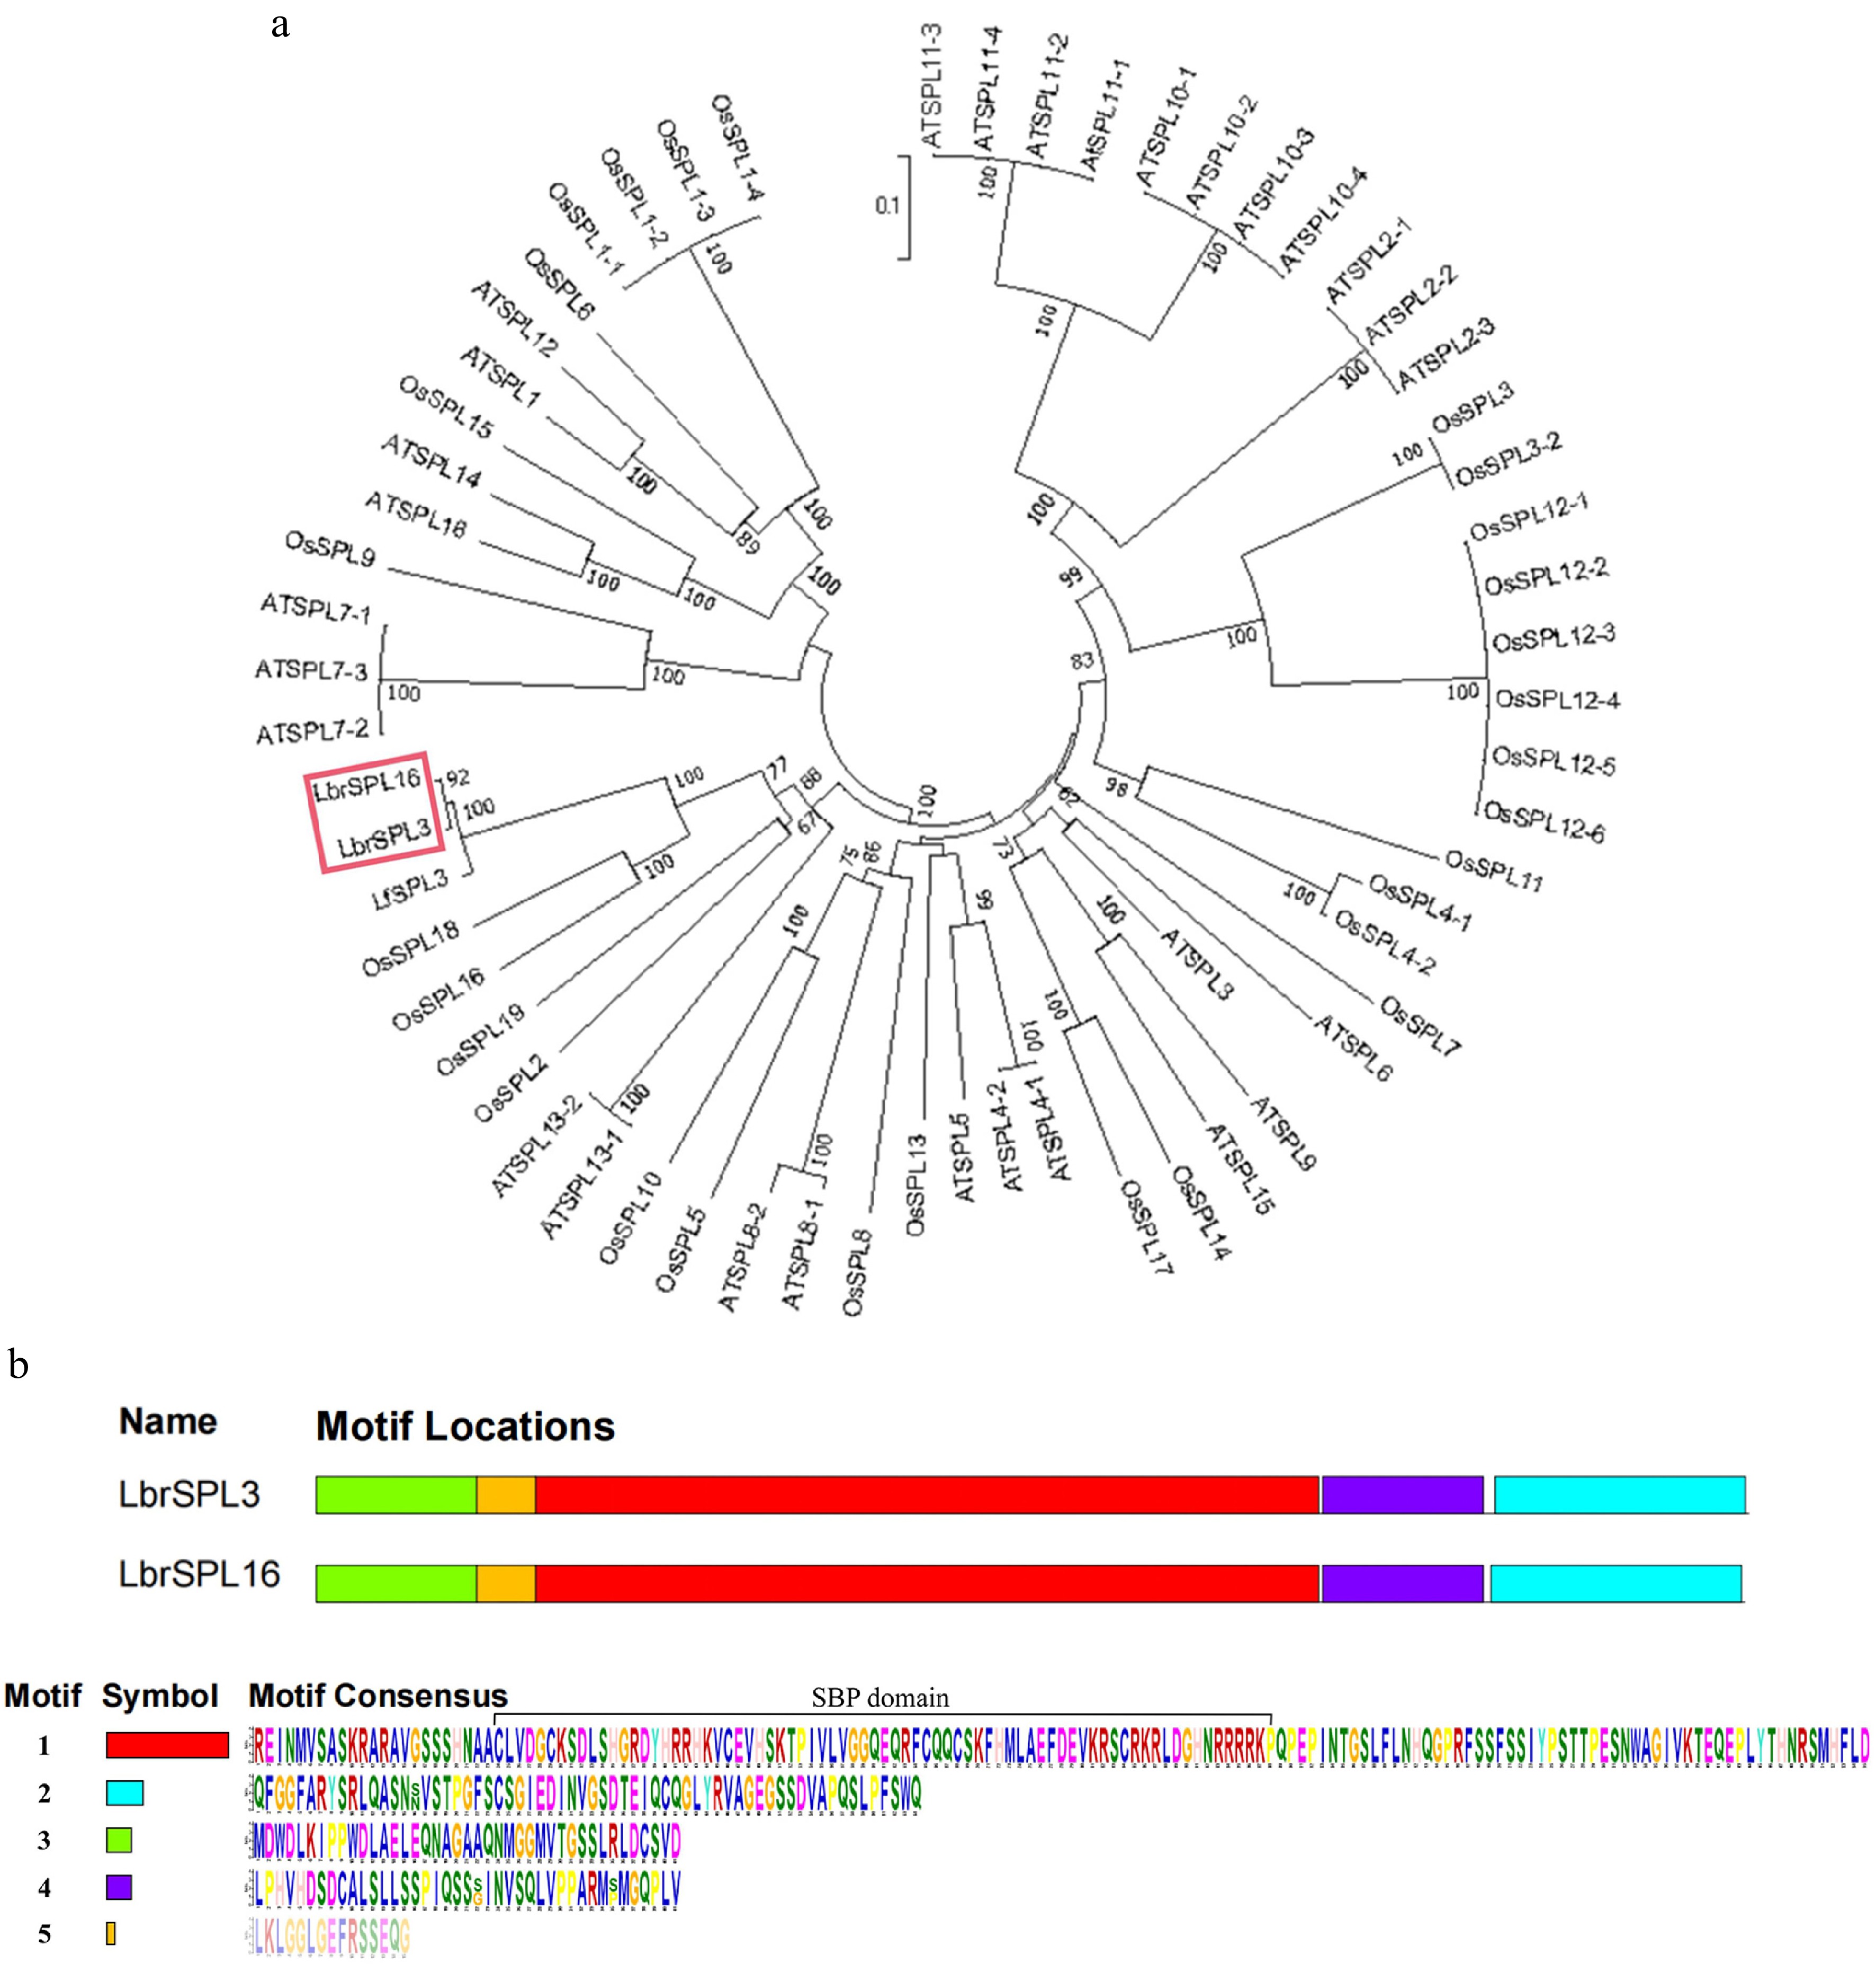
Figure 4.
Phylogenetic analysis. (a) The LbrSPL3 and LbrSPL16 genes are highlighted in red. MEGA7.0 was used to construct the trees using the NJ method. Numbers on branches indicate bootstrap estimates for 1,000 replicates. (b) Conserved motifs of LbrSPL3 and LbrSPL16 proteins. Each motif was indicated with a colored box numbered on the right. Motif sequences were arranged from 1 to 5 in proportion to the size of the genome. The protein sequences corresponding to each motif are listed in the lower part of the graph.
-
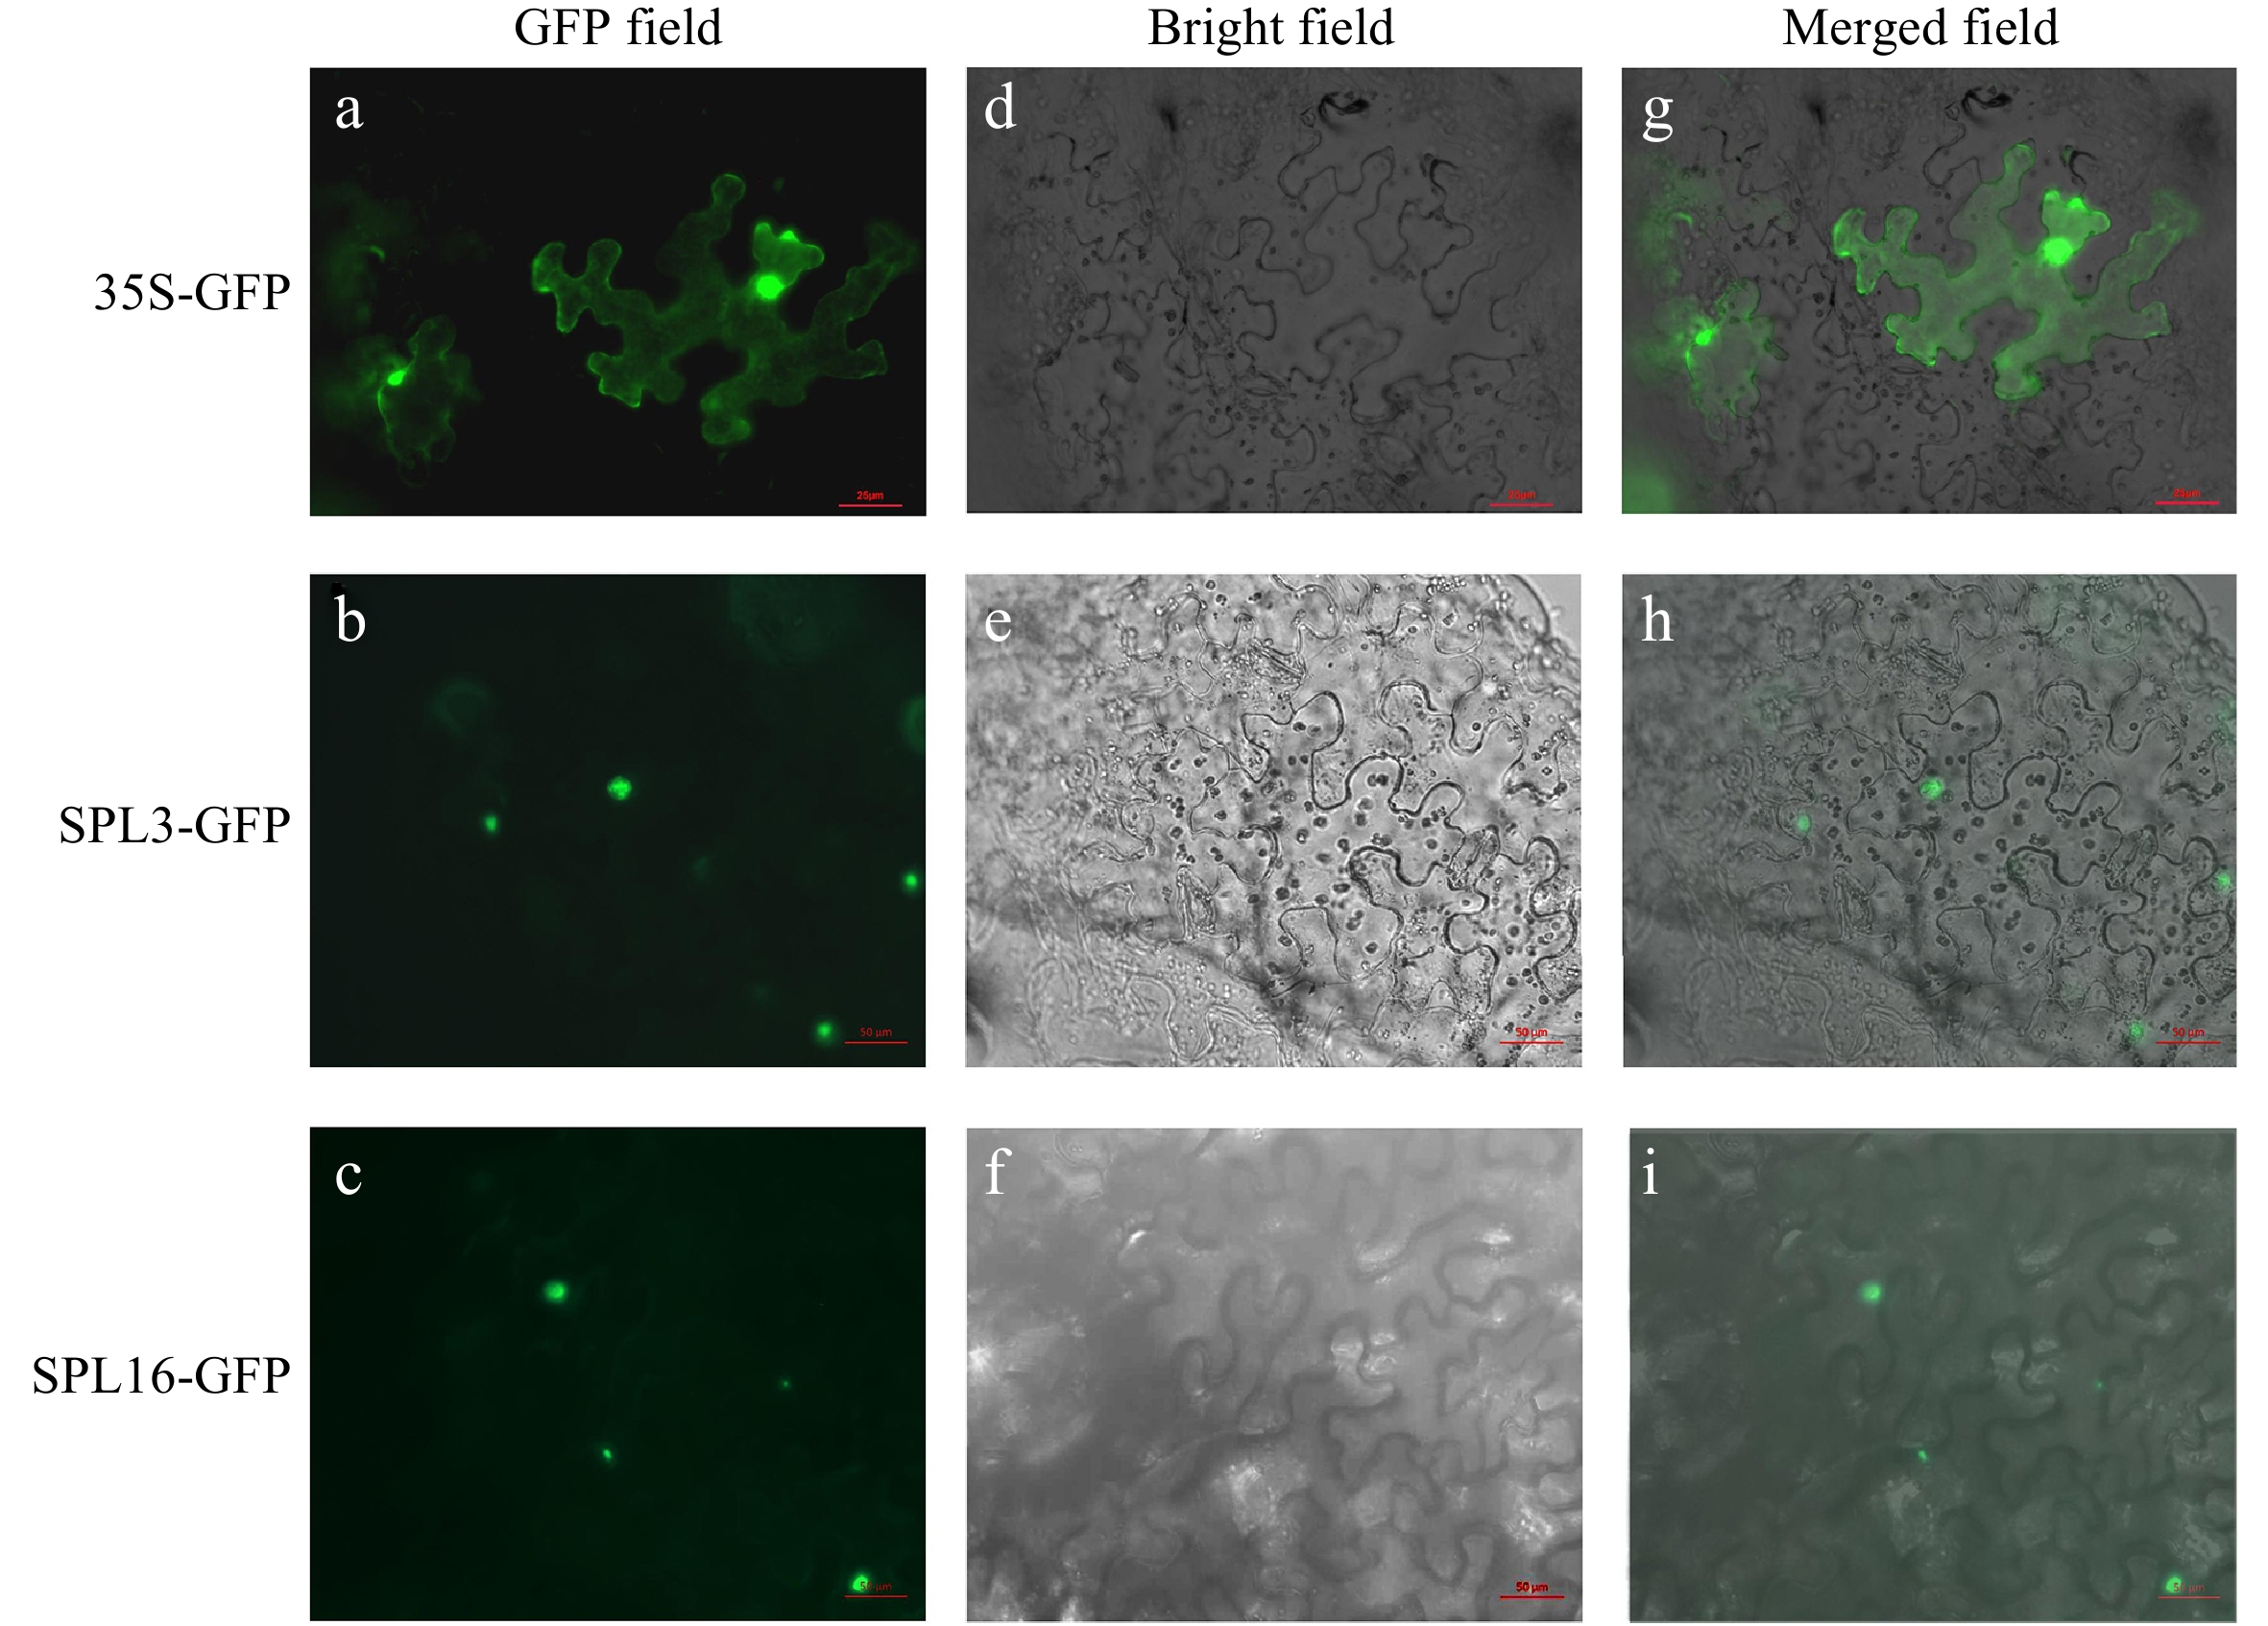
Figure 5.
Subcellular localization of LbrSPL3 and LbrSPL16. (a−c) GFP Fluorescence channel; (d−f) bright field; (g−i) merged image of GFP. The empty 35S-GFP vector was used as a negative control.
-
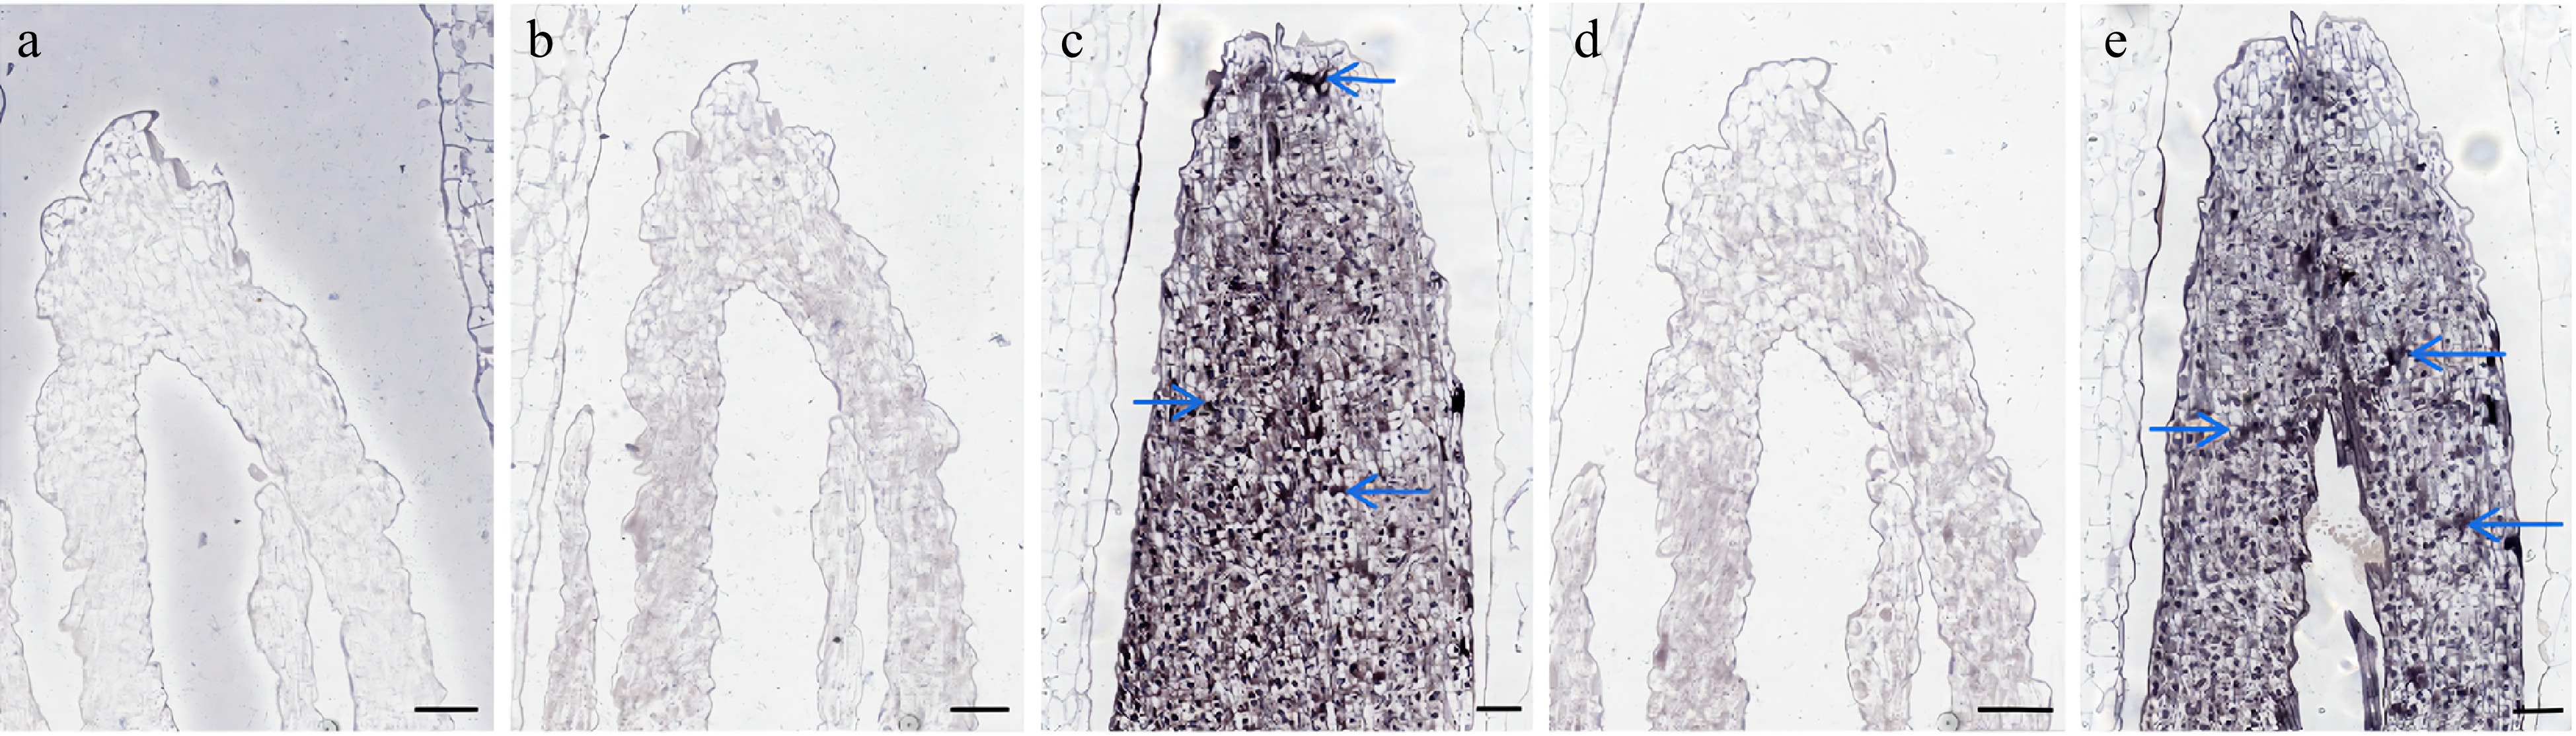
Figure 6.
In situ hybridization results of LbrSPL3 and LbrSPL16. (a) Negative control; (b) LbrSPL3 at 25 °C hybridization pictured; (c) LbrSPL3 at 15 °C hybridization pictured; (d) LbrSPL16 at 25 °C hybridization pictured; (e) LbrSPL16 at 15 °C hybridization pictured. The purple markers and blue arrows in the images represent the hybridization signal. Bar = 200 μm.
-
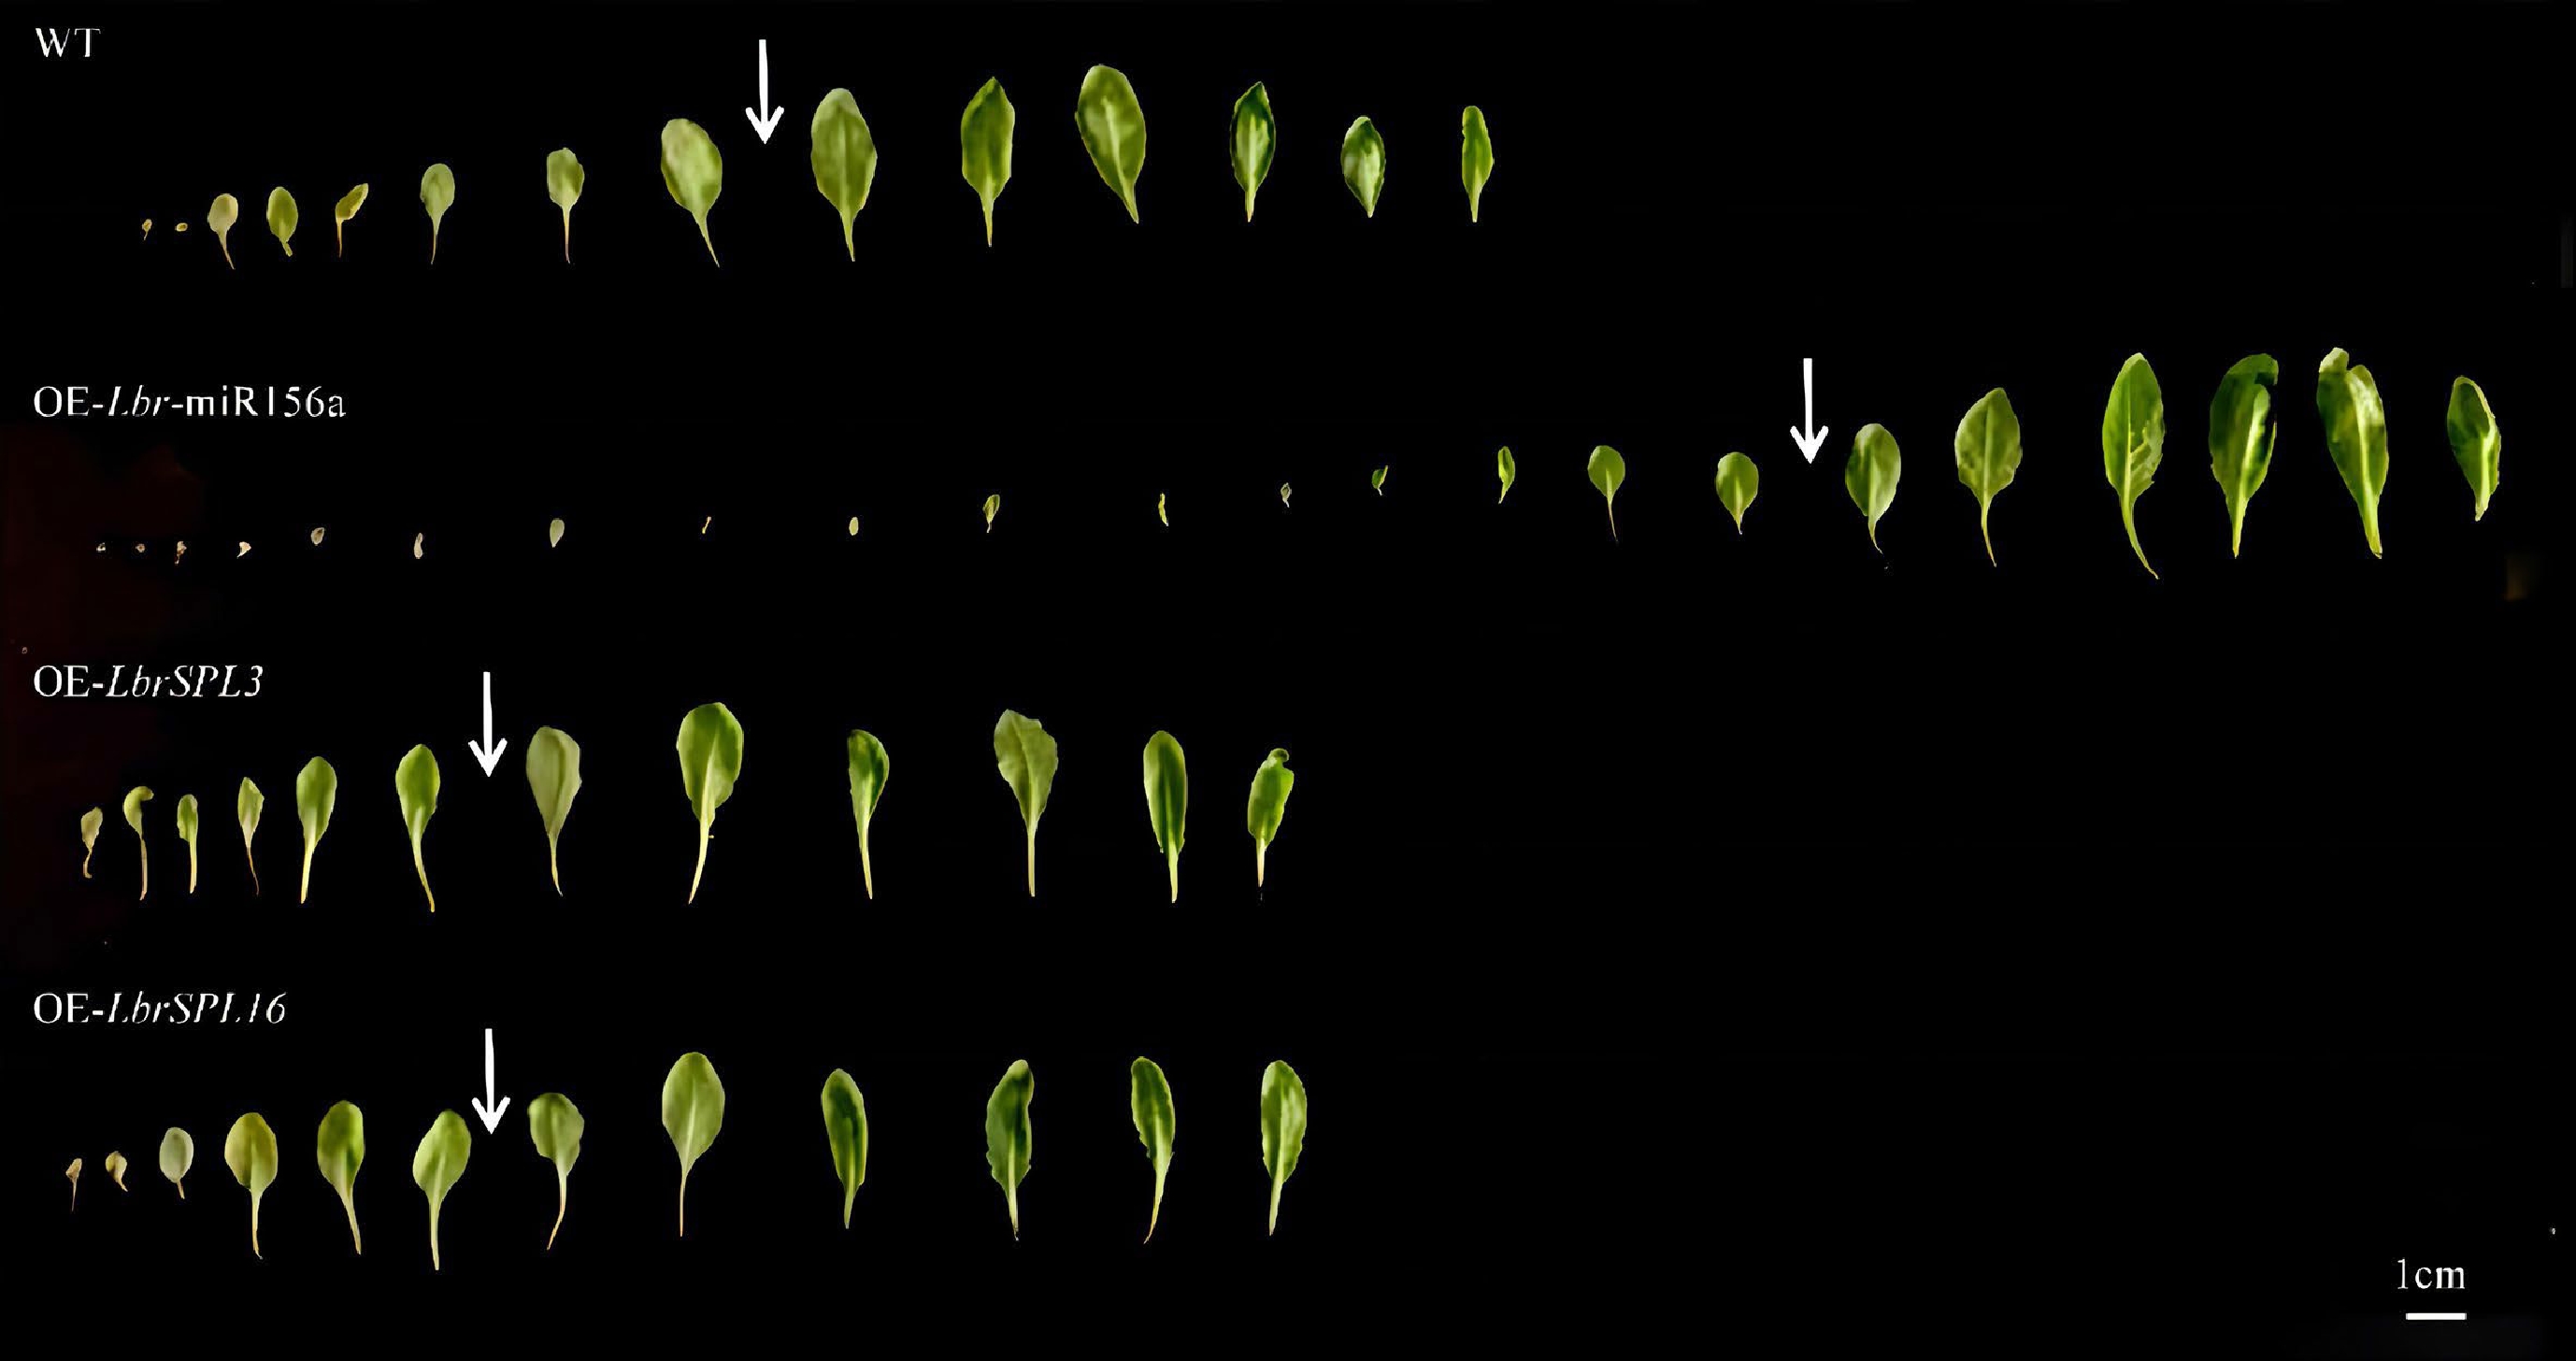
Figure 7.
Leaf morphology of rosette leaves in Lbr-miR156a, LbrSPL3 and LbrSPL16. The leaves of the plants are arranged in the order of growth. The leaves without abaxial trichomes are on the left side of the arrow, and the abaxial trichomes are shown on the right side of the arrow.
-
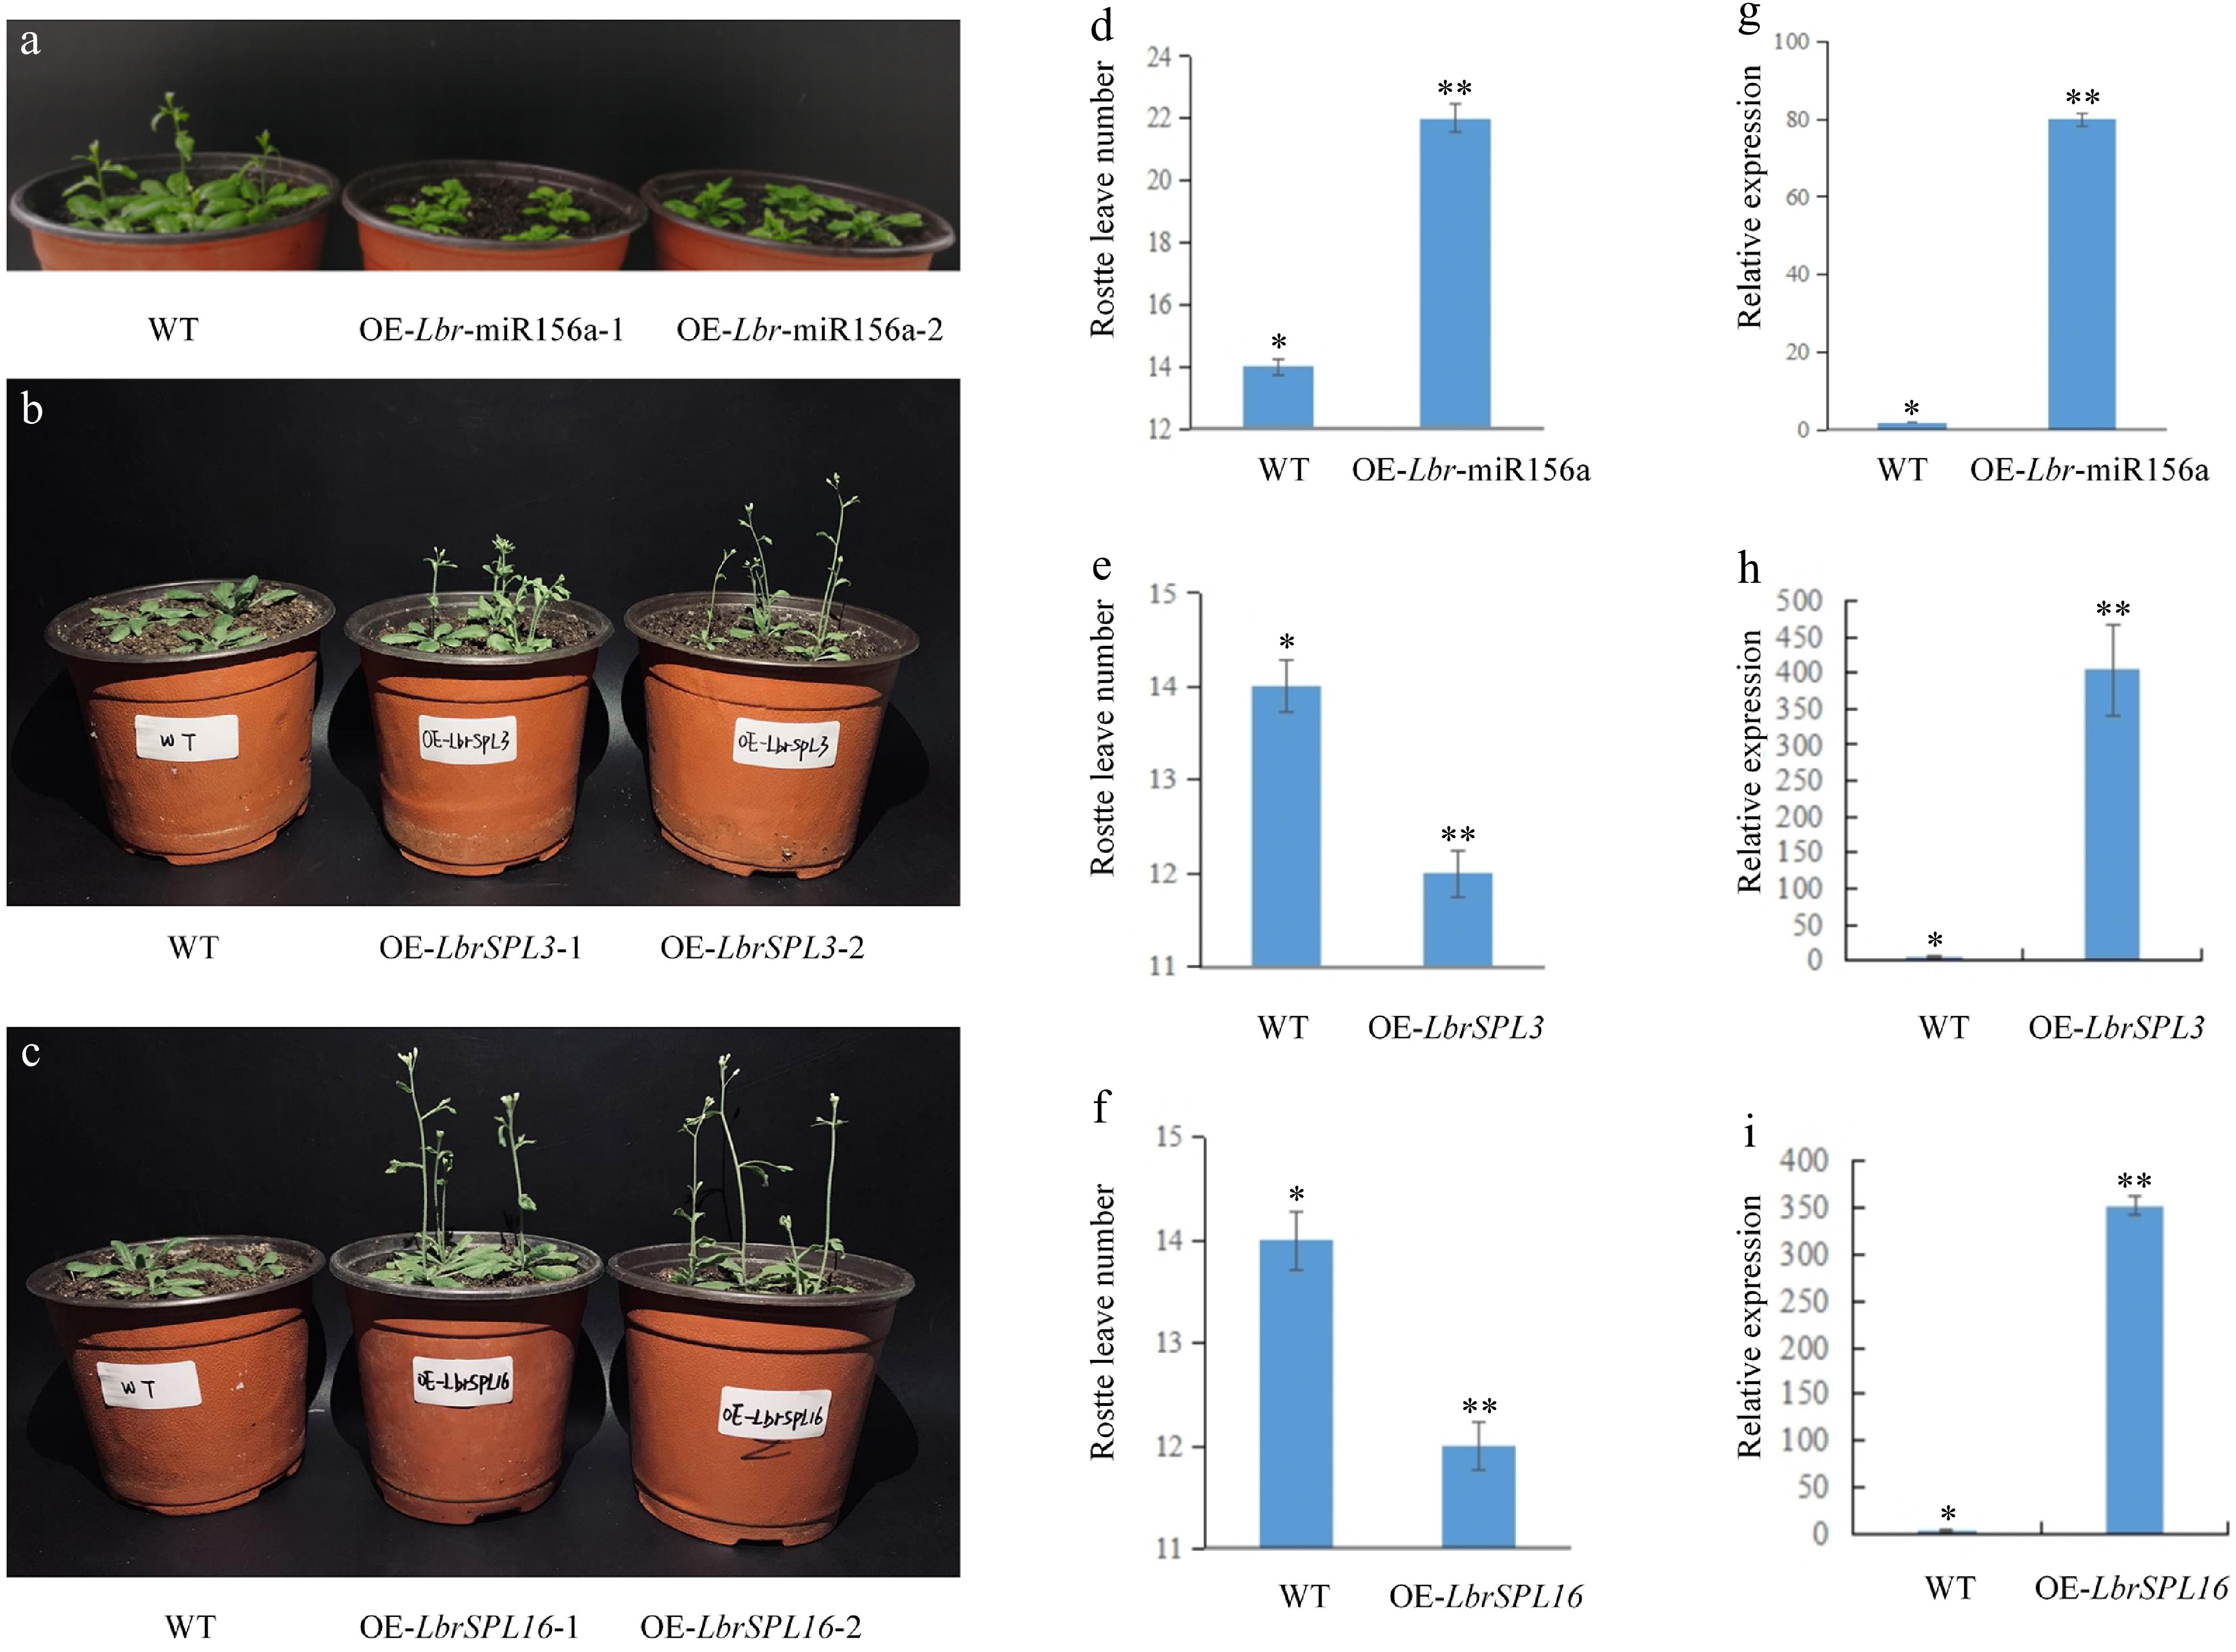
Figure 8.
Overexpression of Lbr-miR156a, LbrSPL3 and LbrSPL16 in A. thaliana. (a) Wild-type (WT), T2 generation transgenic OE-Lbr-miR156a-1, OE-Lbr-miR156a-2 delayed flowering phenotypes. (b) WT, T2 generation transgenic OE-LbrSPL3-1, OE-LbrSPL3-2 early flowering phenotypes. (c) WT, T2 generation transgenic OE-LbrSPL16-1, OE-LbrSPL16-2 early flowering phenotypes. (d) Number of rosette leaves in WT and Lbr-miR156a T2 transgenic plants. (e) Number of rosette leaves in WT and LbrSPL3 T2 transgenic plants. (f) Number of rosette leaves in WT and LbrSPL16 T2 transgenic plants. (g) qRT-PCR was used to analyze the expression levels of Lbr-miR156a in the WT and Lbr-miR156a T2 transgenic plants. (h) qRT-PCR was used to analyze the expression levels of LbrSPL3 in the WT and LbrSPL3 T2 transgenic plants. (i) qRT-PCR was used to analyze the expression levels of LbrSPL16 in the WT and LbrSPL16 T2 transgenic plants. The internal reference used for miR156a was U4, and the internal reference used for LbrSPL3 and LbrSPL16 was 18S rRNA. Twenty biological replicates were performed and averaged, using one-factor ANOVA method for statistical analysis in (d−f) Biological triplicates were averaged and significance analysis of expression in different samples was conducted in (g−i). Asterisks indicate significant differences (p < 0.05).
Figures
(8)
Tables
(0)