


-
Lilium is a bulbous flower with high ornamental value. It has been divided into nine main categories, namely Asiatic (A), Oriental (O), Trumpet (T), Lilium longiflorum (L), Lilium × formolongi (F), and hybrid Lilium LA, OT, OA, and LA[1]. OT Lilium is the hybrid of Oriental Lilium and Trumpet Lilium and possesses a large and fragrant flower, a tall and erect plant, and good heat tolerance. It has good market development prospects[2]. However, one shortcoming of Lilium production is that the juvenile stage is long, and therefore cultivation under natural conditions is lengthy and costly. Under natural conditions, Lilium only produces one leaf in the first year, and the accumulation rate of assimilates and the expansion rate of the bulbs are slow. The adult stage is only reached after 1−2 years. In the adult stage, Lilium grows a main stem and then grows multiple leaves. At this stage, photosynthesis is strengthened, and organic accumulation and bulbous expansion are accelerated. It takes more than 3 years for Lilium to be cultivated into commercial bulbs, which greatly increases the production costs[3].
During plant growth and development, the morphological and anatomical characteristics change in a coordinated manner at certain times, and this process can be divided into independent or multiple growth stages. The transition between these stages is called phase change[4]. Plant phase transition theory suggests that plant growth stages can be divided into three periods: a juvenile vegetative phase, an adult vegetative phase, and a reproductive phase[5]. When the meristems at the top of the plant can be divided into inflorescences and flower organs, it means that the plant has transitioned from the adult stage to the reproductive stage[6].
Wang et al. found that in Arabidopsis thaliana, the young plant leaves are round, with smooth leaf edges and surface fur on the proximal axis of the leaves[7]. When A. thaliana transitioned from the juvenile stage to adult stage, the leaves became spatulate with serrated leaf margins, and the leaves became furry on both proximal and distal axial surfaces. These features indicate that the plant has reached maturity. The transition from the adult stage to reproductive stage in Lilium is closely related to flower development and has been studied extensively. However, there are comparatively fewer studies on the transition from infancy to adulthood, which constitutes a significant period in the plant growth process.
The molecular mechanisms of the transition from the juvenile phase to maturity in plants share major regulatory factors with the transition from maturity to reproduction. Small RNA specifically regulates mRNA post-transcriptionally, mainly by degrading target genes, inhibiting the translation of target genes, or modifying the chromosome[8], playing an important role in plant growth and development. Among them, microRNAs (miRNAs) are small endogenous non-coding RNAs (of about 21–24 nt) that specifically bind to the corresponding target genes, leading to changes in expression levels. They indirectly regulate plant growth, development, cell maintenance and differentiation, signal transduction, and the response to biotic and abiotic stresses[9]. miR156 is a small RNA molecule that is a key marker of age during the vegetative phase transition from childhood to adulthood[10]. It was first found in A. thaliana, with a length of 20 bp[11], and is conserved, occurring in monocotyledons, dicotyledons, and ferns and mosses[12]. In A. thaliana, the precursor of miR156 is encoded by eight genes, namely miR156a–miR156h. As a key miRNA in the regulation of plant age, the expression level of miR156 decreases with plant growth. The overexpression of miR156 led to longer plant infancy and significant changes in plant phenotypes, such as increased branching, faster leaf growth, and delayed flowering time[13]. Similar phenotypes have been reported in Oryza sativa[14], Panicum virgatum[15], Solanum lycopersicum[16], Torenia fournieri[17], and Chrysanthemum morifolium[18].
The target gene of miR156 is the SQUAMOSA promoter-binding protein-like (SPL) transcription factor[19]. SPL is an important transcription factor related to plant growth and development and the stress response and belongs to the SBP family of transcription factors. Members of the SPL gene family have highly conserved SBP-DNA domains, which contain about 80 amino acid residues, two zinc-finger structures, and a nuclear localization signal[20]. SPL is involved in regulating the expression of downstream genes mainly by binding the cis-acting element GTAC motif in the downstream gene promoter region. SPL genes are involved in plant growth, development, and signal transduction, playing an important role in plant flower development[21]. Studies have shown that SBP gene family members exhibit different expression levels in different tissues and stages, but they are highly expressed in the flower organs. In many plants, the miR156-SPL regulatory network plays an irreplaceable role in the transition from the juvenile to adult stage. For example, the overexpression of miR156 resulted in increased rosette number and delayed flowering time in A. thaliana[22]. The miR156 and SPL family in A. thaliana link environmental signals to the flowering process, such as the inhibition of flowering under low temperatures via induced miRNA156 expression[23]. There are five flowering regulation pathways in A. thaliana, of which miR156 regulates flowering in the aging pathway. When plants are young, miR156 has the highest transcriptional richness and inhibits the expression of SPL genes, thereby inhibiting A. thaliana flowering. When A. thaliana transitions from the juvenile to adult stage, the expression of miR156 is gradually reduced, and thus the expression of SPL is gradually increased, which in turn promotes flowering[24]. SPL3 plays an important role in the transition from the juvenile vegetative phase to the adult vegetative phase[22], and the overexpression of SPL3 in A. thaliana promotes phase transition and leads to early flowering[25]. The overexpression of GmmiR156 in Glycine max significantly reduced the transcription expression level of GmSPL3, resulting in delayed flowering time and a longer growth period[26]. Studies on O. sativa, Prunus persica and Lycium barbarum have shown that SPL16 plays an important role in promoting plant growth and the development of flower and fruit organs[27, 28].
While miR156, SPL3, and SPL16 have been found to have a significant role in phase transition in other plants, their regulation of this process in Lilium has not been explored. To address this, low-temperature treatment was used to accelerate the transition from the juvenile to adult stage in Lilium. Sequencing of small RNA and the degradome was performed after temperature treatment, and bioinformatics analysis was used to study the molecular mechanisms by which these key miRNAs and their corresponding genes regulate the phase transition in Lilium. Subcellular localization, transcriptional activation, and in situ hybridization of the key differentially expressed genes LbrSPL3 and LbrSPL16 were conducted. Cloning and transgenic functions of the key regulatory miRNA Lbr-miR156a and its target genes LbrSPL3 and LbrSPL16 were verified. This study provides a theoretical basis for further understanding the regulatory mechanisms of the phase transition during Lilium growth and offers a reference for the breeding of other bulbous flowers.
-
The variable temperature treated Lilium bulbs were planted in a greenhouse, and after two weeks of plant growth, the vegetative growth phase transition was completed. The phenotypes of Lilium between the control and treated groups were significantly different. Lilium in the treated group grew the main stem, while Lilium in the control group only grew one leaf (Supplemental Fig. S1).
In small RNA sequencing, the number of original reads produced by sequencing of each library was more than 20 million, the error rate was less than 0.01%, and the Q20 score was more than 99%. The number of clean data reads also remained above 20 million after low-quality reads were removed, accounting for more than 94% of the raw data. The data quality was high enough for subsequent analysis. The length of the clean reads of each library ranged from 16 to 31 nt, and the length distribution is shown in Supplemental Fig. S2.
The mapped tags on the reference sequence were compared with miRBase 22.1, and a total of 92 known miRNAs belonging to 26 families were selected (Supplemental Table S1). The miR159, miR166, miR167, miR168, miR171, miR319, and miR396 families were expressed at high levels in each sample. Statistical analysis of the number of miRNA family members revealed that miR156, miR166, and miR319 had the largest number of members, each with 11.
The differentially expressed known miRNAs were selected with a P-value ≤ 0.05 as the selection criterion. The expression of 29 differentially expressed known miRNAs was analyzed. Among them, 16 miRNAs were up-regulated and 13 miRNAs were down-regulated (Supplemental Fig. S3). The most significantly up-regulated miRNAs were miR171b, miR408, and miR167a. The most significantly down-regulated miRNAs were miR319a, miR169e, and miR169m. Among them, the miR156 family exhibited significant differential expression trends.
A miRNA-based precursor can form a hairpin secondary structure, and we used miRDEEP2 and miRA for novel miRNA prediction. A total of 86 novel miRNAs were selected, and the differentially expressed novel miRNAs were selected with a p-value ≤ 0.05 as the selection criterion. A total of 27 differentially expressed novel miRNAs were selected, of which nine were up-regulated and 18 were down-regulated (Supplemental Fig. S4). The most significantly up-regulated miRNAs were novel_miR2, novel_miR3, and novel_miR7. The most significantly down-regulated miRNAs were novel_miR19, novel_miR36, and novel_miR65.
qRT-PCR was performed on miRNAs related to plant phase change and growth and development from small RNA sequencing results. The names and relative expressions of miRNAs are shown in Supplemental Fig. S5. qRT-PCR validation of novel miRNAs and their targets was also perfomed (Supplemental Fig. S6). The primer sequences are listed in Supplemental Table S2. The qRT-PCR results were consistent with the miRNA sequencing results. Among the known miRNAs, miR167a-1 and miR167d-5 were up-regulated and miR169a-5, miR169m, miR171b-3p and miR171d-1 were down-regulated. Among the novel miRNAs, novel_mir1 and novel_mir53 were significantly up-regulated, while novel_mir7 and novel_mir56 were obviously down-regulated.
Target identification of miRNAs by degradome analysis
-
To determine the regulatory relationship between the miRNAs and their target genes, degradome libraries were constructed. The numbers of raw reads produced by BC15T and BC25T were 40,035,871 and 63,921,661, respectively, and the original sequencing data output was selected. The number of sequences with unique alignment positions on the reference sequence was counted, and the unique transcript mapped reads of BC15T and BC25T were 1,945,301 and 3,320,813, respectively. Comparison with the Lilium transcriptome data indicated that there were 56,560 and 84,673 transcripts in BC15T and BC25T, respectively (Supplemental Table S3).
One-hundred and seventy eight miRNA sequences of Lilium were matched with the target mRNA sequences of the Lilium transcriptome by sequencing the degradation group. A total of 2,310 mRNAs were targeted by 161 miRNAs (Supplemental Table S4). In addition, 1,360 and 1,284 targets could be annotated in the Gene Ontology (GO) database and Kyoto Encyclopedia of Genes and Genomes (KEGG) database, respectively.
A target plot (t-plot) was constructed to visually display the relationship between miR156 and the target gene SPLs (Fig. 1). miR156a was shown to target SPL3 and SPL16. Based on the psRNATarget prediction results and small RNA prediction results, three known miRNAs: miR166e-3p, miR156a and miR396e-5p and their target genes: HOX32, SPL3, SPL16 and GRF4 were selected. qRT-PCR results of these four groups were analyzed for interactions (Fig. 2). The expression trend of miRNAs was found to be opposite to that of their target genes, which was the same as the predicted results.
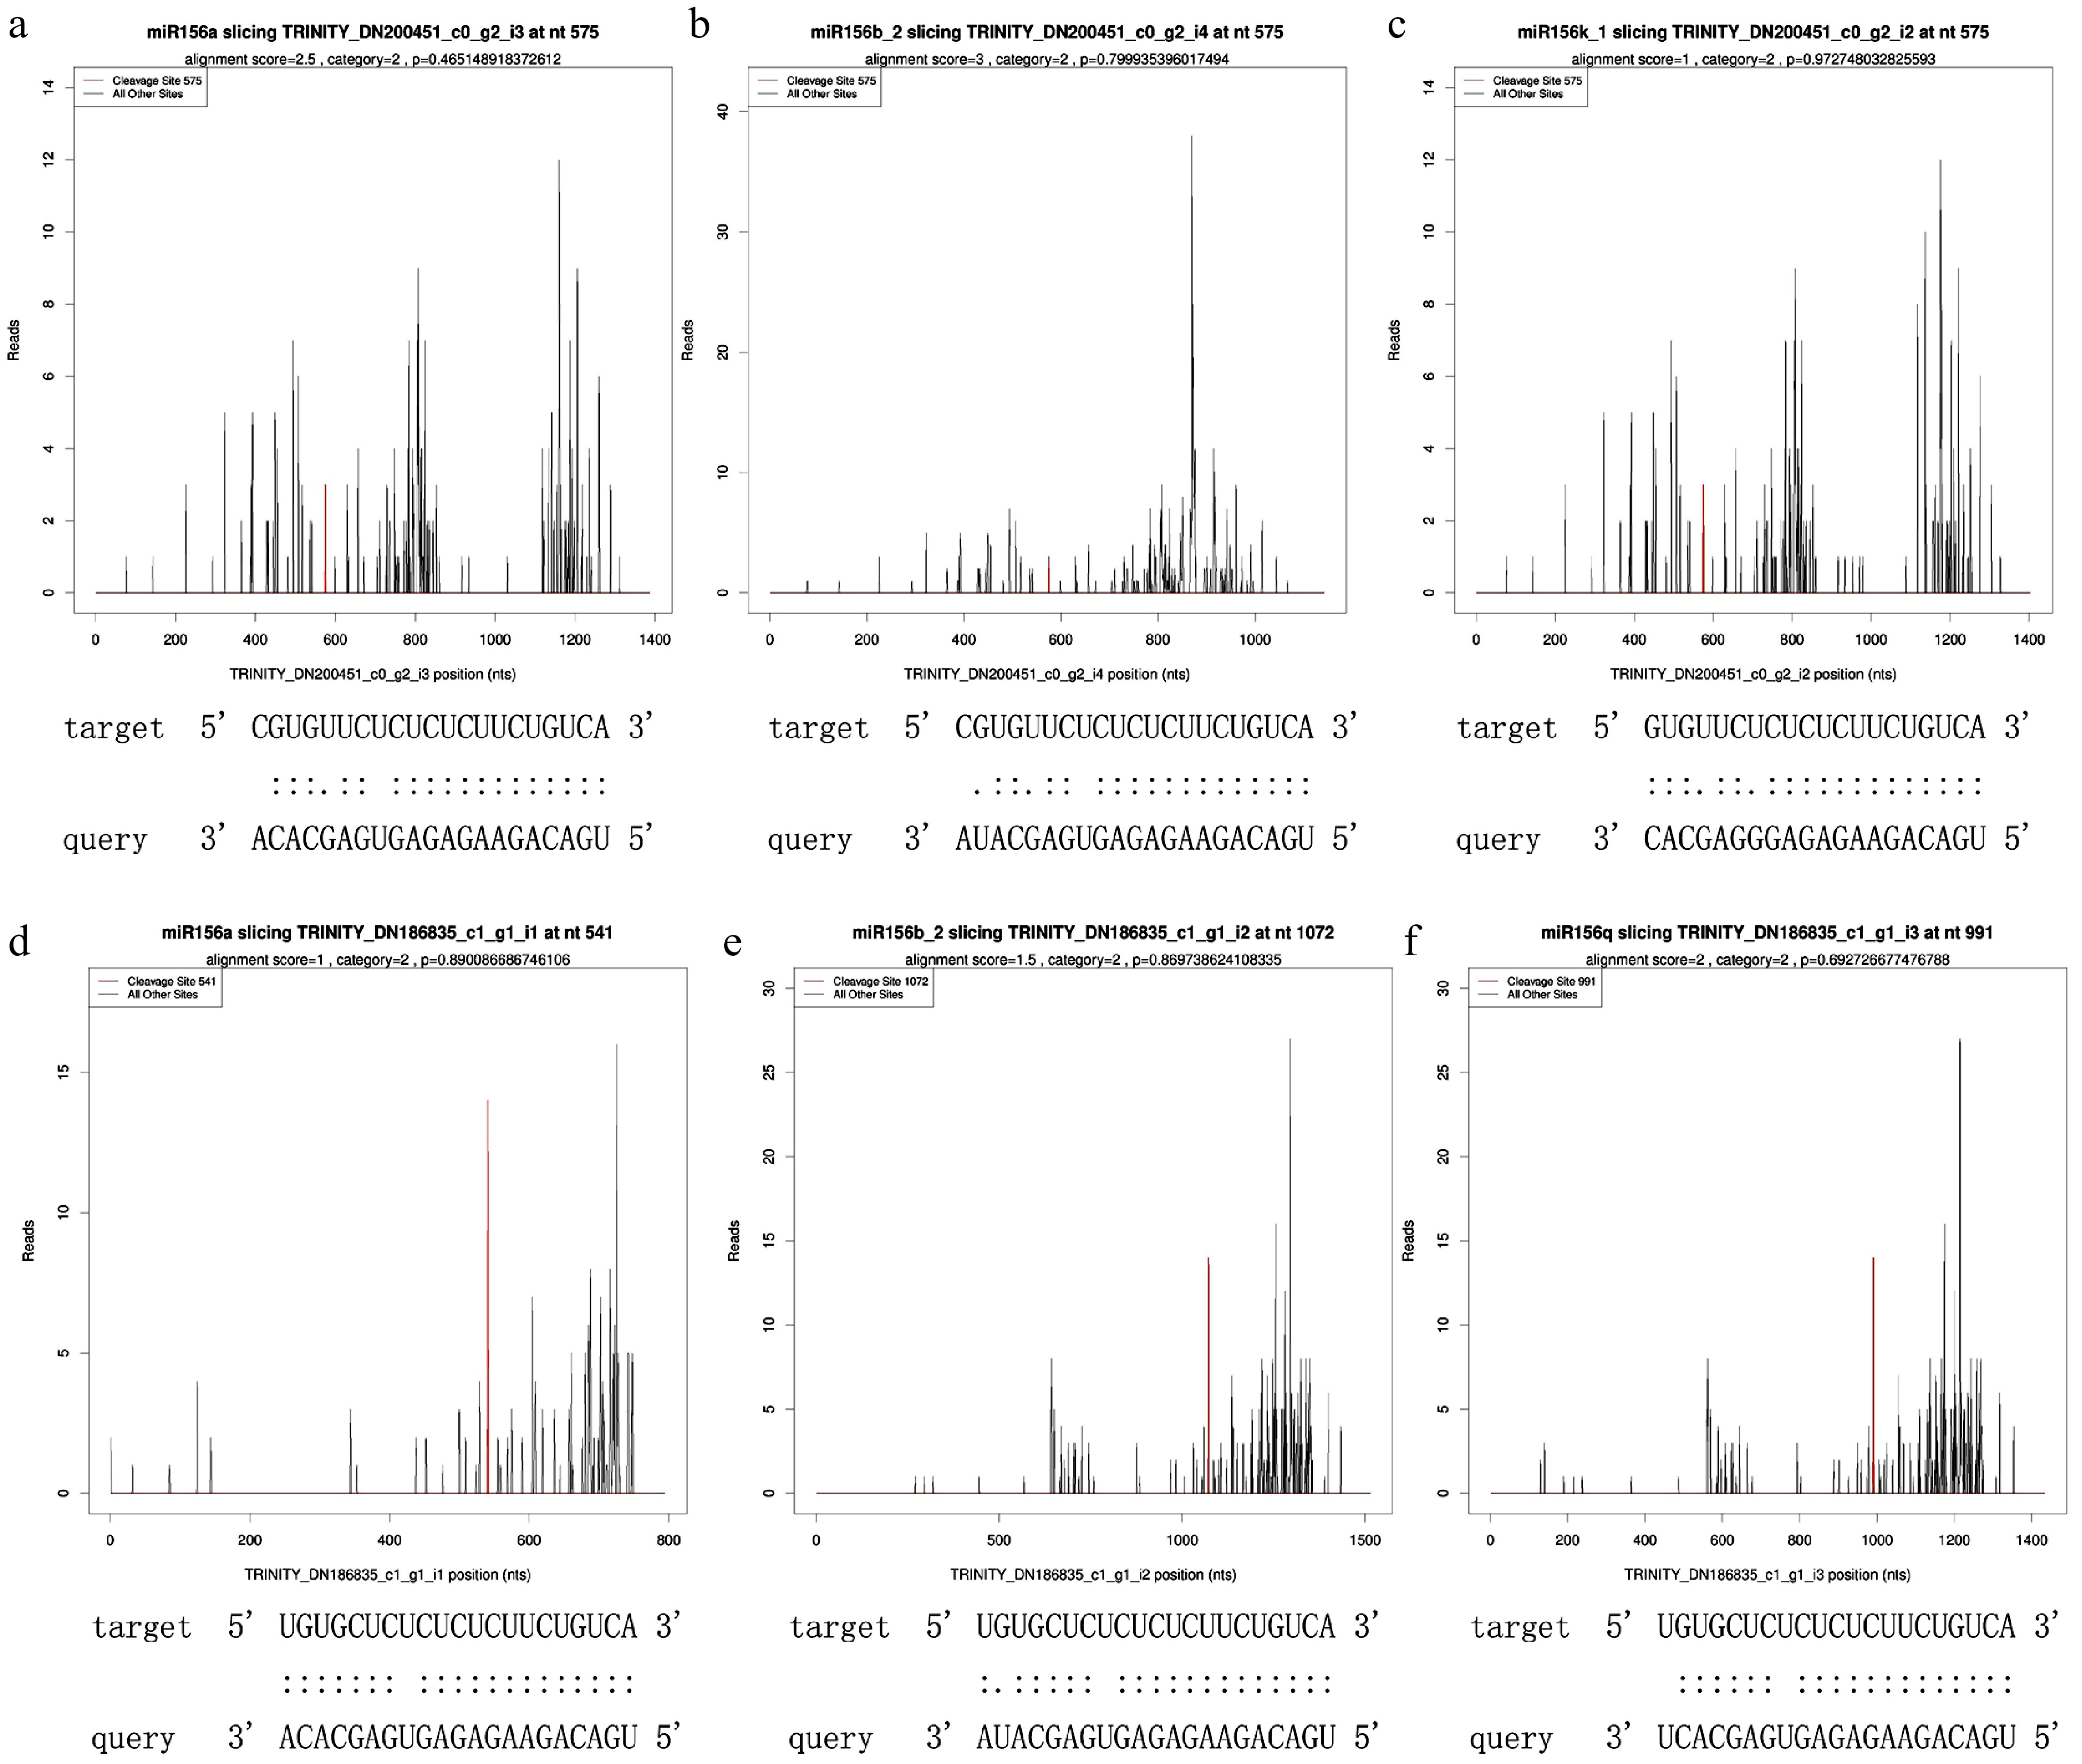
Figure 1.
T-plot of miR156 and its target SPLs. (a) miR156a targeted SPL3, alignment score was 2.5, cleaveage site was 575, category site was 2 and p-value was 0.465149. (b) miR156b_2 targeted SPL3, alignment score was 3, cleaveage site was 575, category was 2, and p-value was 0.799935. (c) miR156k_1 targeted SPL3, alignment score was 1, cleaveage site was 575, category was 2, and p-value was 0.972748. (d) miR156a targeted SPL16, alignment score was 1, cleaveage site was 541, category was 2, and p-value was 0.890087. (e) miR156b_2 targeted SPL16 with alignment score of 1.5, cleaveage site of 1072, category of 2 and p-value of 0.869739. (f) miR156q targeted SPL16, alignment score was 2, cleaveage site was 991, category was 2, and p-value was 0.692727.
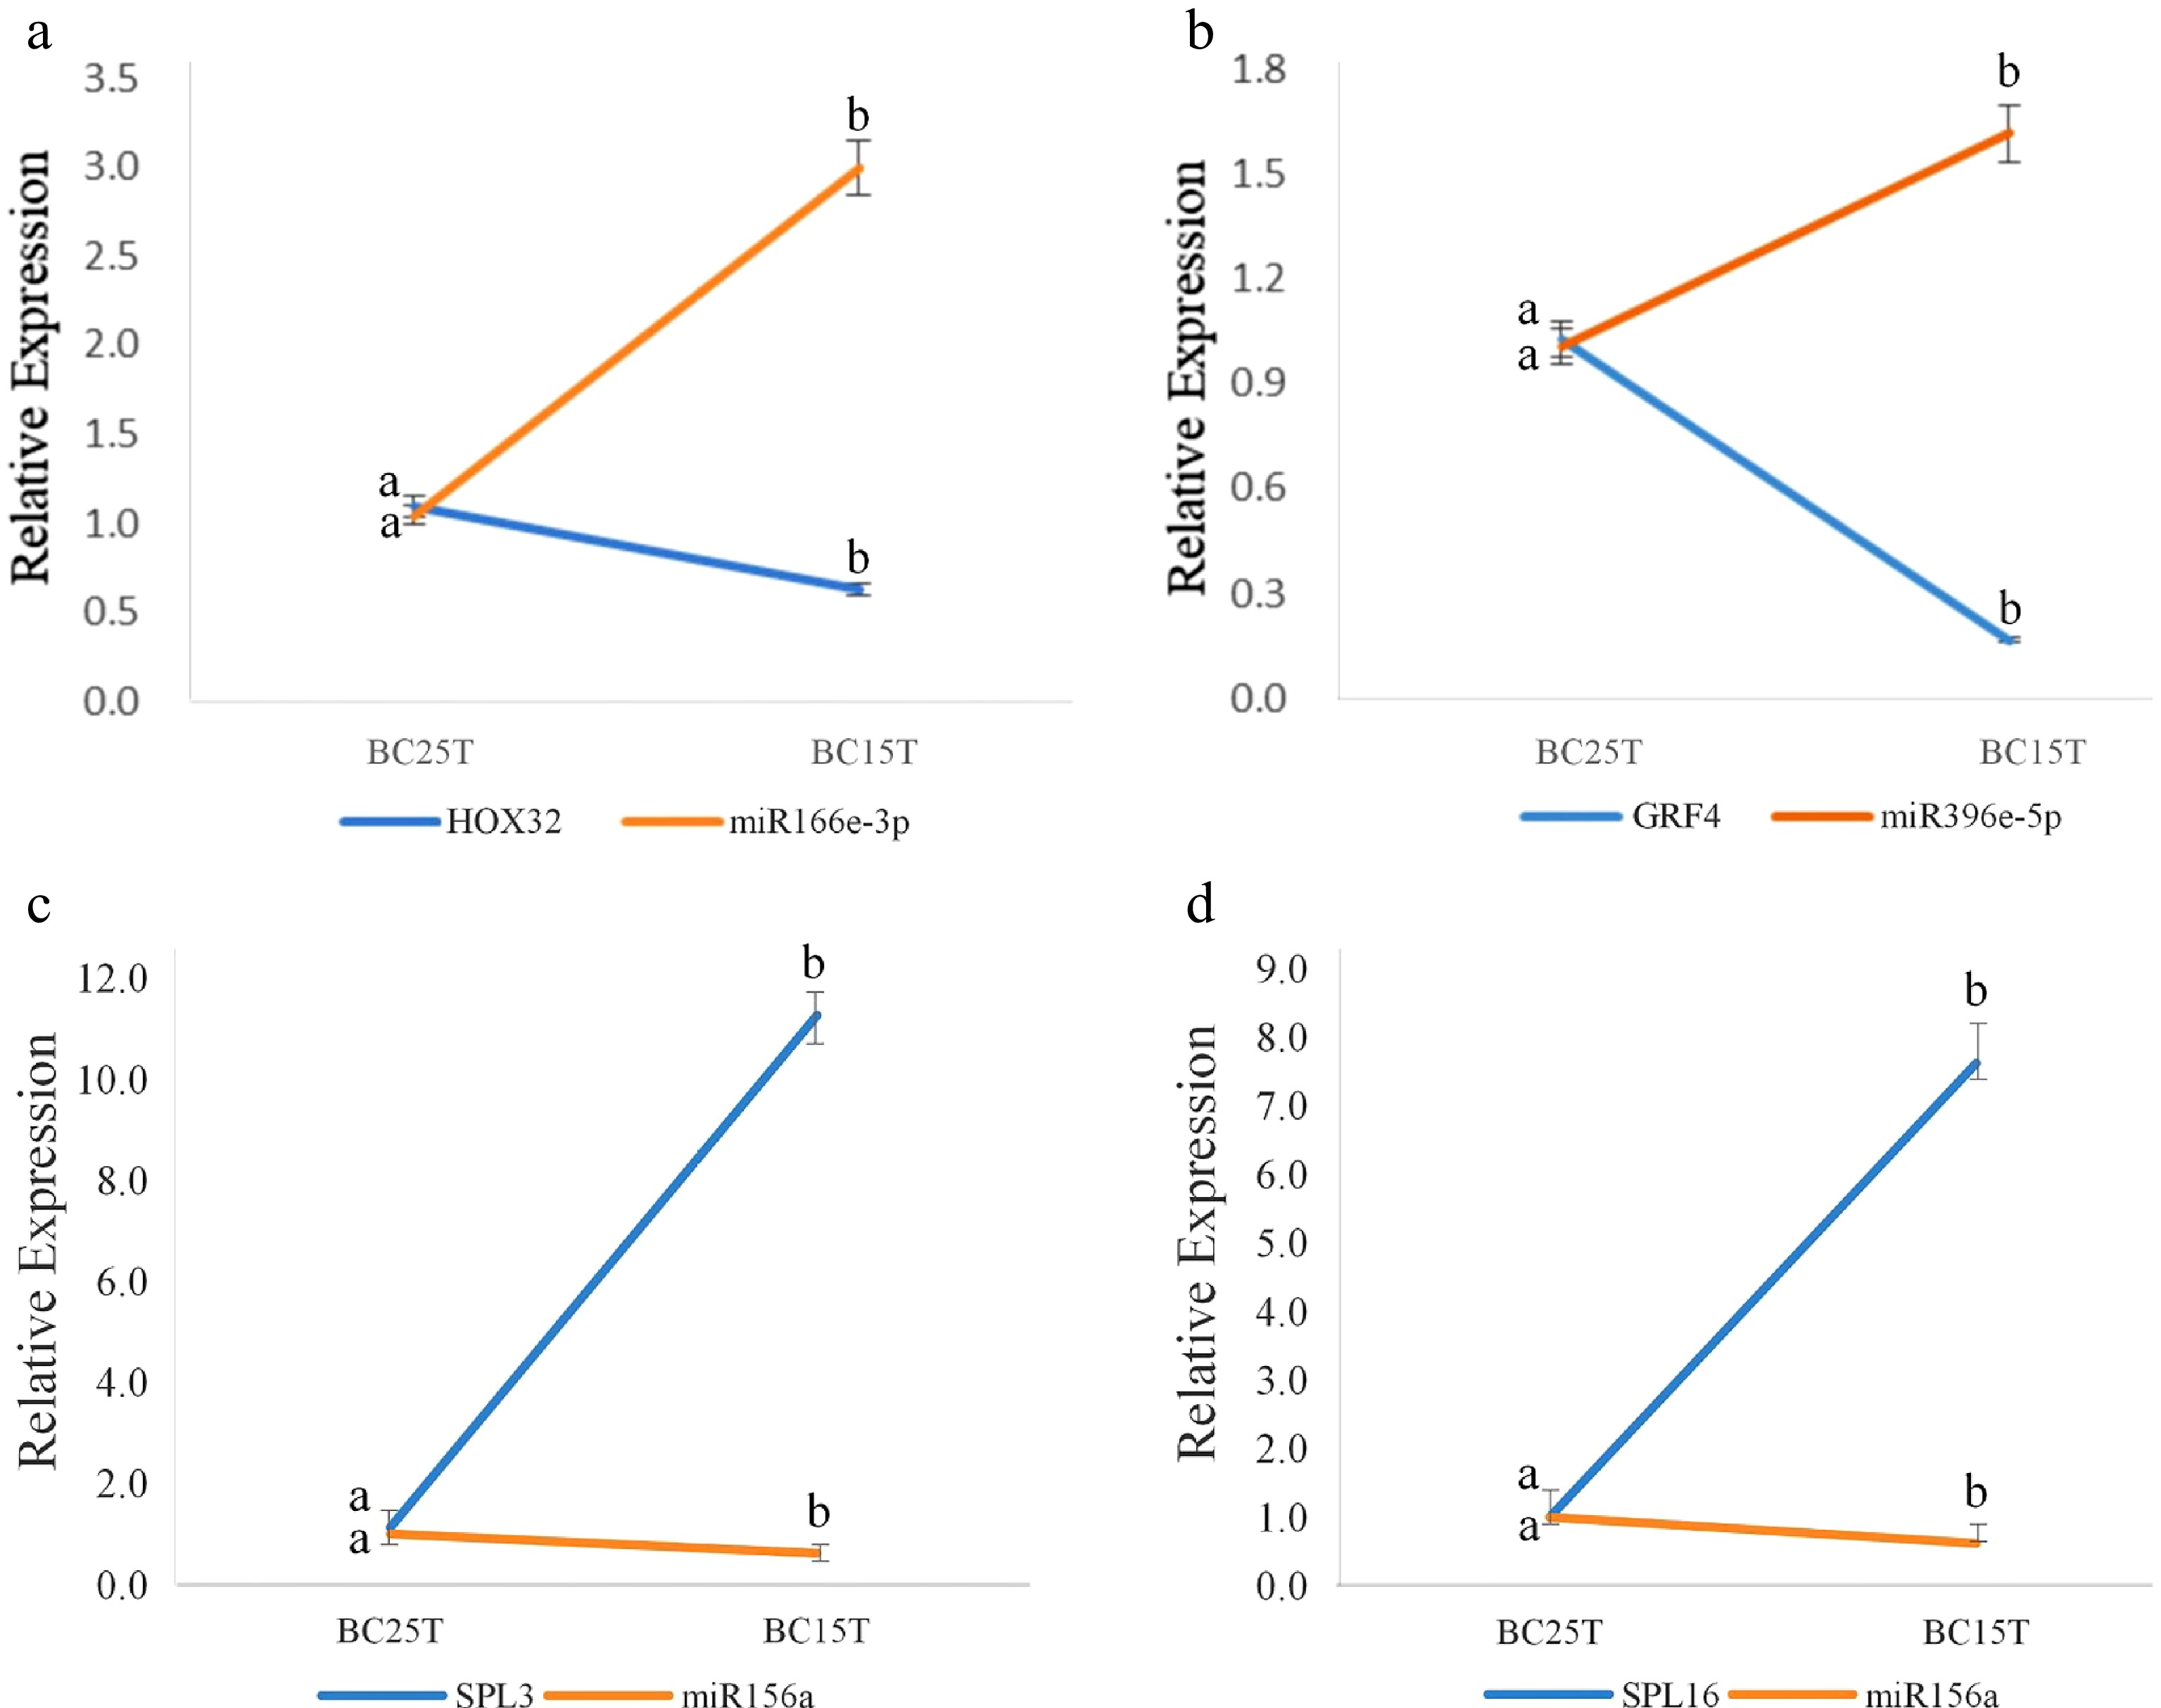
Figure 2.
qRT-PCR results of known miRNAs and their target genes. The figure shows the interactions between: (a) miR166e-3p and HOX32, (b) miR396e-5p and GRF4, (c) miR156a and SPL3, (d) miR156a and SPL16. After variable temperature treatment, miR166e-3p and miR396e-5p were up-regulated, while miR156a was down-regulated. Their target genes were opposite to their regulatory relationships. The average of three biological replicates was taken and significance analysis of expression in different samples was conducted. Different letters in the same graph indicate significant differences (p < 0.05).
Combined 'omics' analysis
-
Based on transcriptome, small RNA, and degradome sequencing, we performed a combined omics analysis. The regulation diagram of the miRNA-target gene network is shown in Supplemental Fig. S7. The regulatory networks of miR156, miR166, miR172, and miR396 were more numerous and corresponded to a larger number of target genes. Among them, the regulatory network of miR156 was the largest and most complex. miR156a, miR156a-5p, miR156k_1, and miR156q were located at the center of the regulatory network, linking to multiple target genes with important regulatory roles.
Differential expression of miRNAs and target genes was performed on the whole comparison group (Fig. 3), and it was found that the expression levels of miR156 were obviously down-regulated in Lilium bulbs following temperature treatment, while the expression levels of their corresponding target genes were up-regulated. miR156-SPLs therefore play complementary regulatory roles in phase transition during vegetative growth in Lilium.
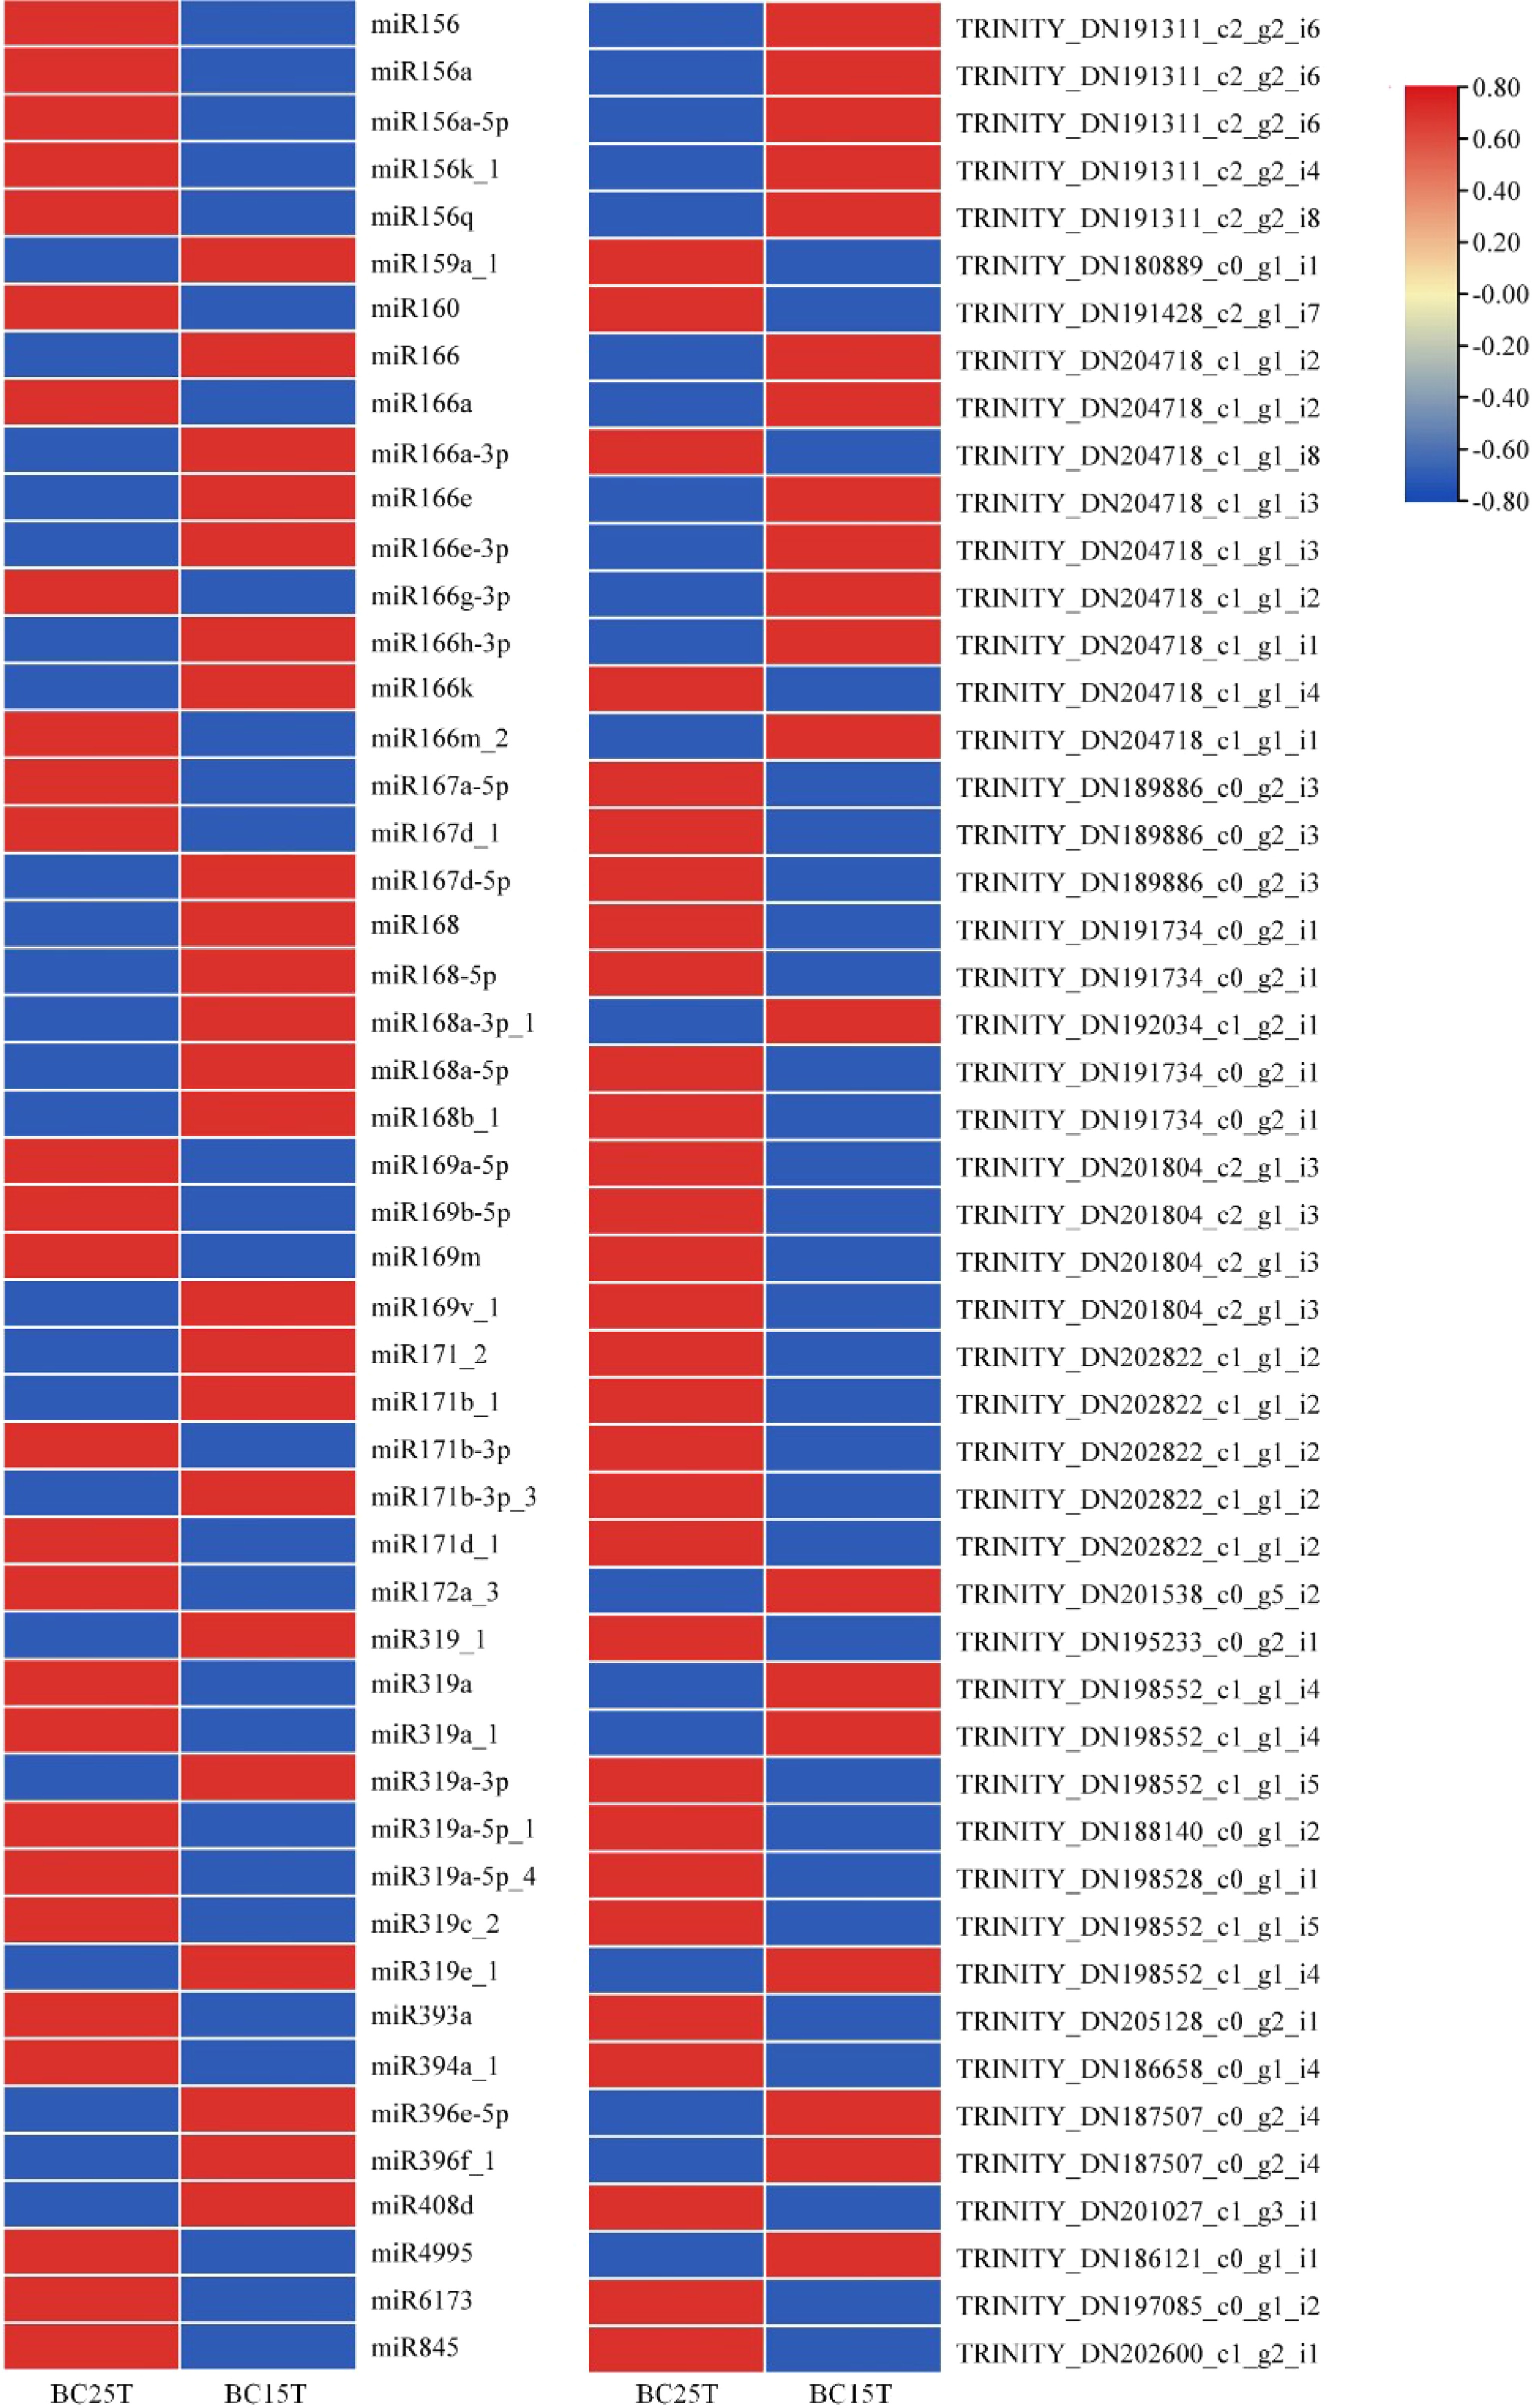
Figure 3.
Differential expression of miRNAs with target genes in Lilium bulbs after variable temperature treatment. Heat maps were created based on the expression data in the full comparison set. In the heat map, red and blue represented higher and lower expressions, respectively, and the opposite up- and down-regulation relationship between miRNA and target genes can be easily visualized.
After GO annotation of target genes, the successfully annotated genes were classified according to the next level of the three major GO categories (biological process, cellular component, and molecular function). The classification results showed that most of the target genes were enriched in the regulation of transcription and DNA binding, which are closely related to plant growth and development. In addition, the target genes were primarily located in the nucleus, which is consistent with the characteristics of genes encoding transcription factors (Supplemental Fig. S8).
After KEGG Orthology (KO) annotation of the genes, the genes could be classified according to the KEGG metabolic pathways they were involved in (Supplemental Fig. S9). A total of 230 target genes were enriched in 17 pathways. The most significantly enriched pathways were carbohydrate metabolism, translation, nucleotide metabolism and transport, and catabolism. A large proportion of genes were enriched in metabolism and genetic information processing.
Phylogenetic analysis of LbrSPL3 and LbrSPL16
-
The protein sequences of LbrSPL3 and LbrSPL16 were compared with the SPL families of the model plants A. thaliana and O. sativa and other species of Lilium for phylogenetic analysis. As shown in Fig. 4a, LbrSPL3 and LbrSPL16 clustered with LfSPL3, OsSPL2, OsSPL16, OsSPL18, OsSPL19, and AtSPL13 and were closely related. Protein sequence analysis of LbrSPL3 and LbrSPL16 was performed (Fig. 4b). Both genes contained five different motifs, and the motifs were similarly located. The SBP-box domain is a highly conserved protein structure unique to the SPL transcription factor family and was present in motif 1 of both sequences; it contains two zinc binding sites and a nuclear localization signal at the C-terminus of the SBP-DNA binding domain (DBD) region.
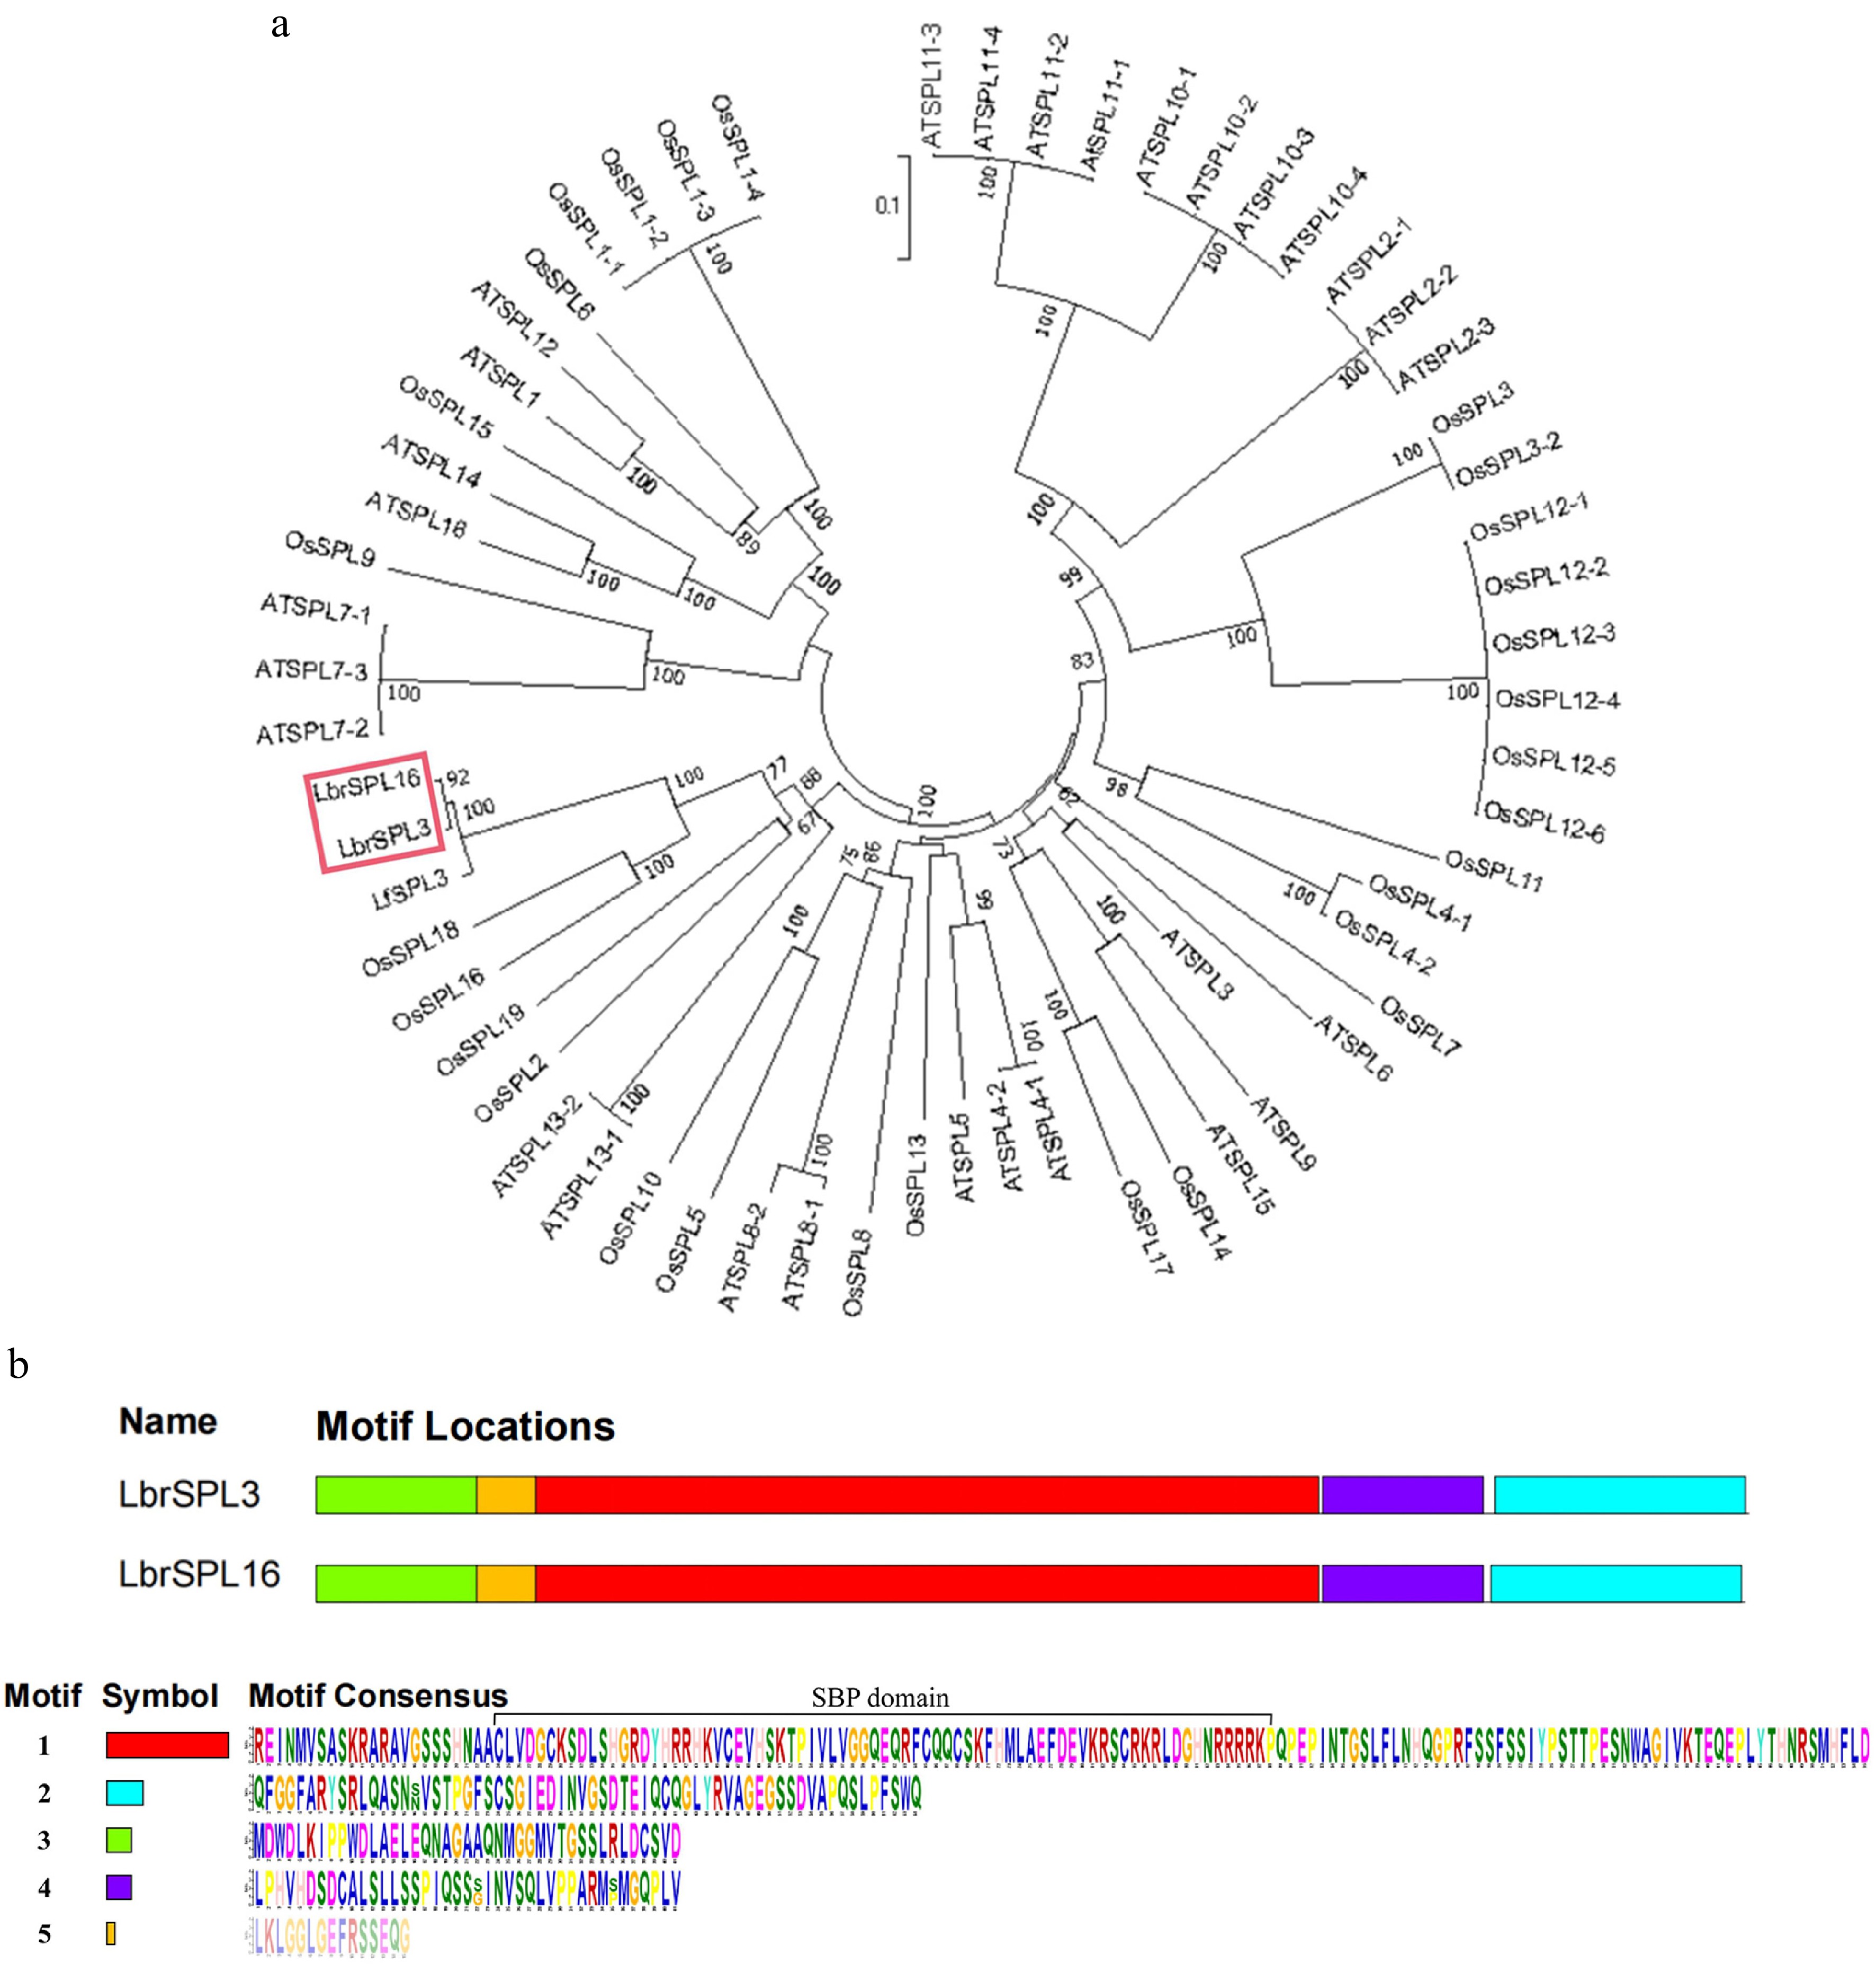
Figure 4.
Phylogenetic analysis. (a) The LbrSPL3 and LbrSPL16 genes are highlighted in red. MEGA7.0 was used to construct the trees using the NJ method. Numbers on branches indicate bootstrap estimates for 1,000 replicates. (b) Conserved motifs of LbrSPL3 and LbrSPL16 proteins. Each motif was indicated with a colored box numbered on the right. Motif sequences were arranged from 1 to 5 in proportion to the size of the genome. The protein sequences corresponding to each motif are listed in the lower part of the graph.
Identification of LbrSPL3 and LbrSPL16
-
Expression of fluorescent-tagged LbrSPL3 and LbrSPL16 in N. benthamiana seedlings showed that the GFP-tagged LbrSPL3 and LbrSPL16 proteins were located in the nucleus, whereas the green fluorescent protein (GFP) control was dispersed throughout the cell (Fig. 5). The transcriptional activation results showed that the BD, BD-LbrSPL3, and BD-LbrSPL16 recombinant vectors were successfully transformed into AH109 yeast competent strains and could grow normally on SD/Trp medium. Follow-up experiments showed that the negative control BD could not grow on SD/Trp-His-3AT 15 mM medium, while BD-LbrSPL3 and BD-LbrSPL16 could grow normally. This indicated that LbrSPL3 and LbrSPL16 had transcriptional activation activity (Supplemental Fig. S10).
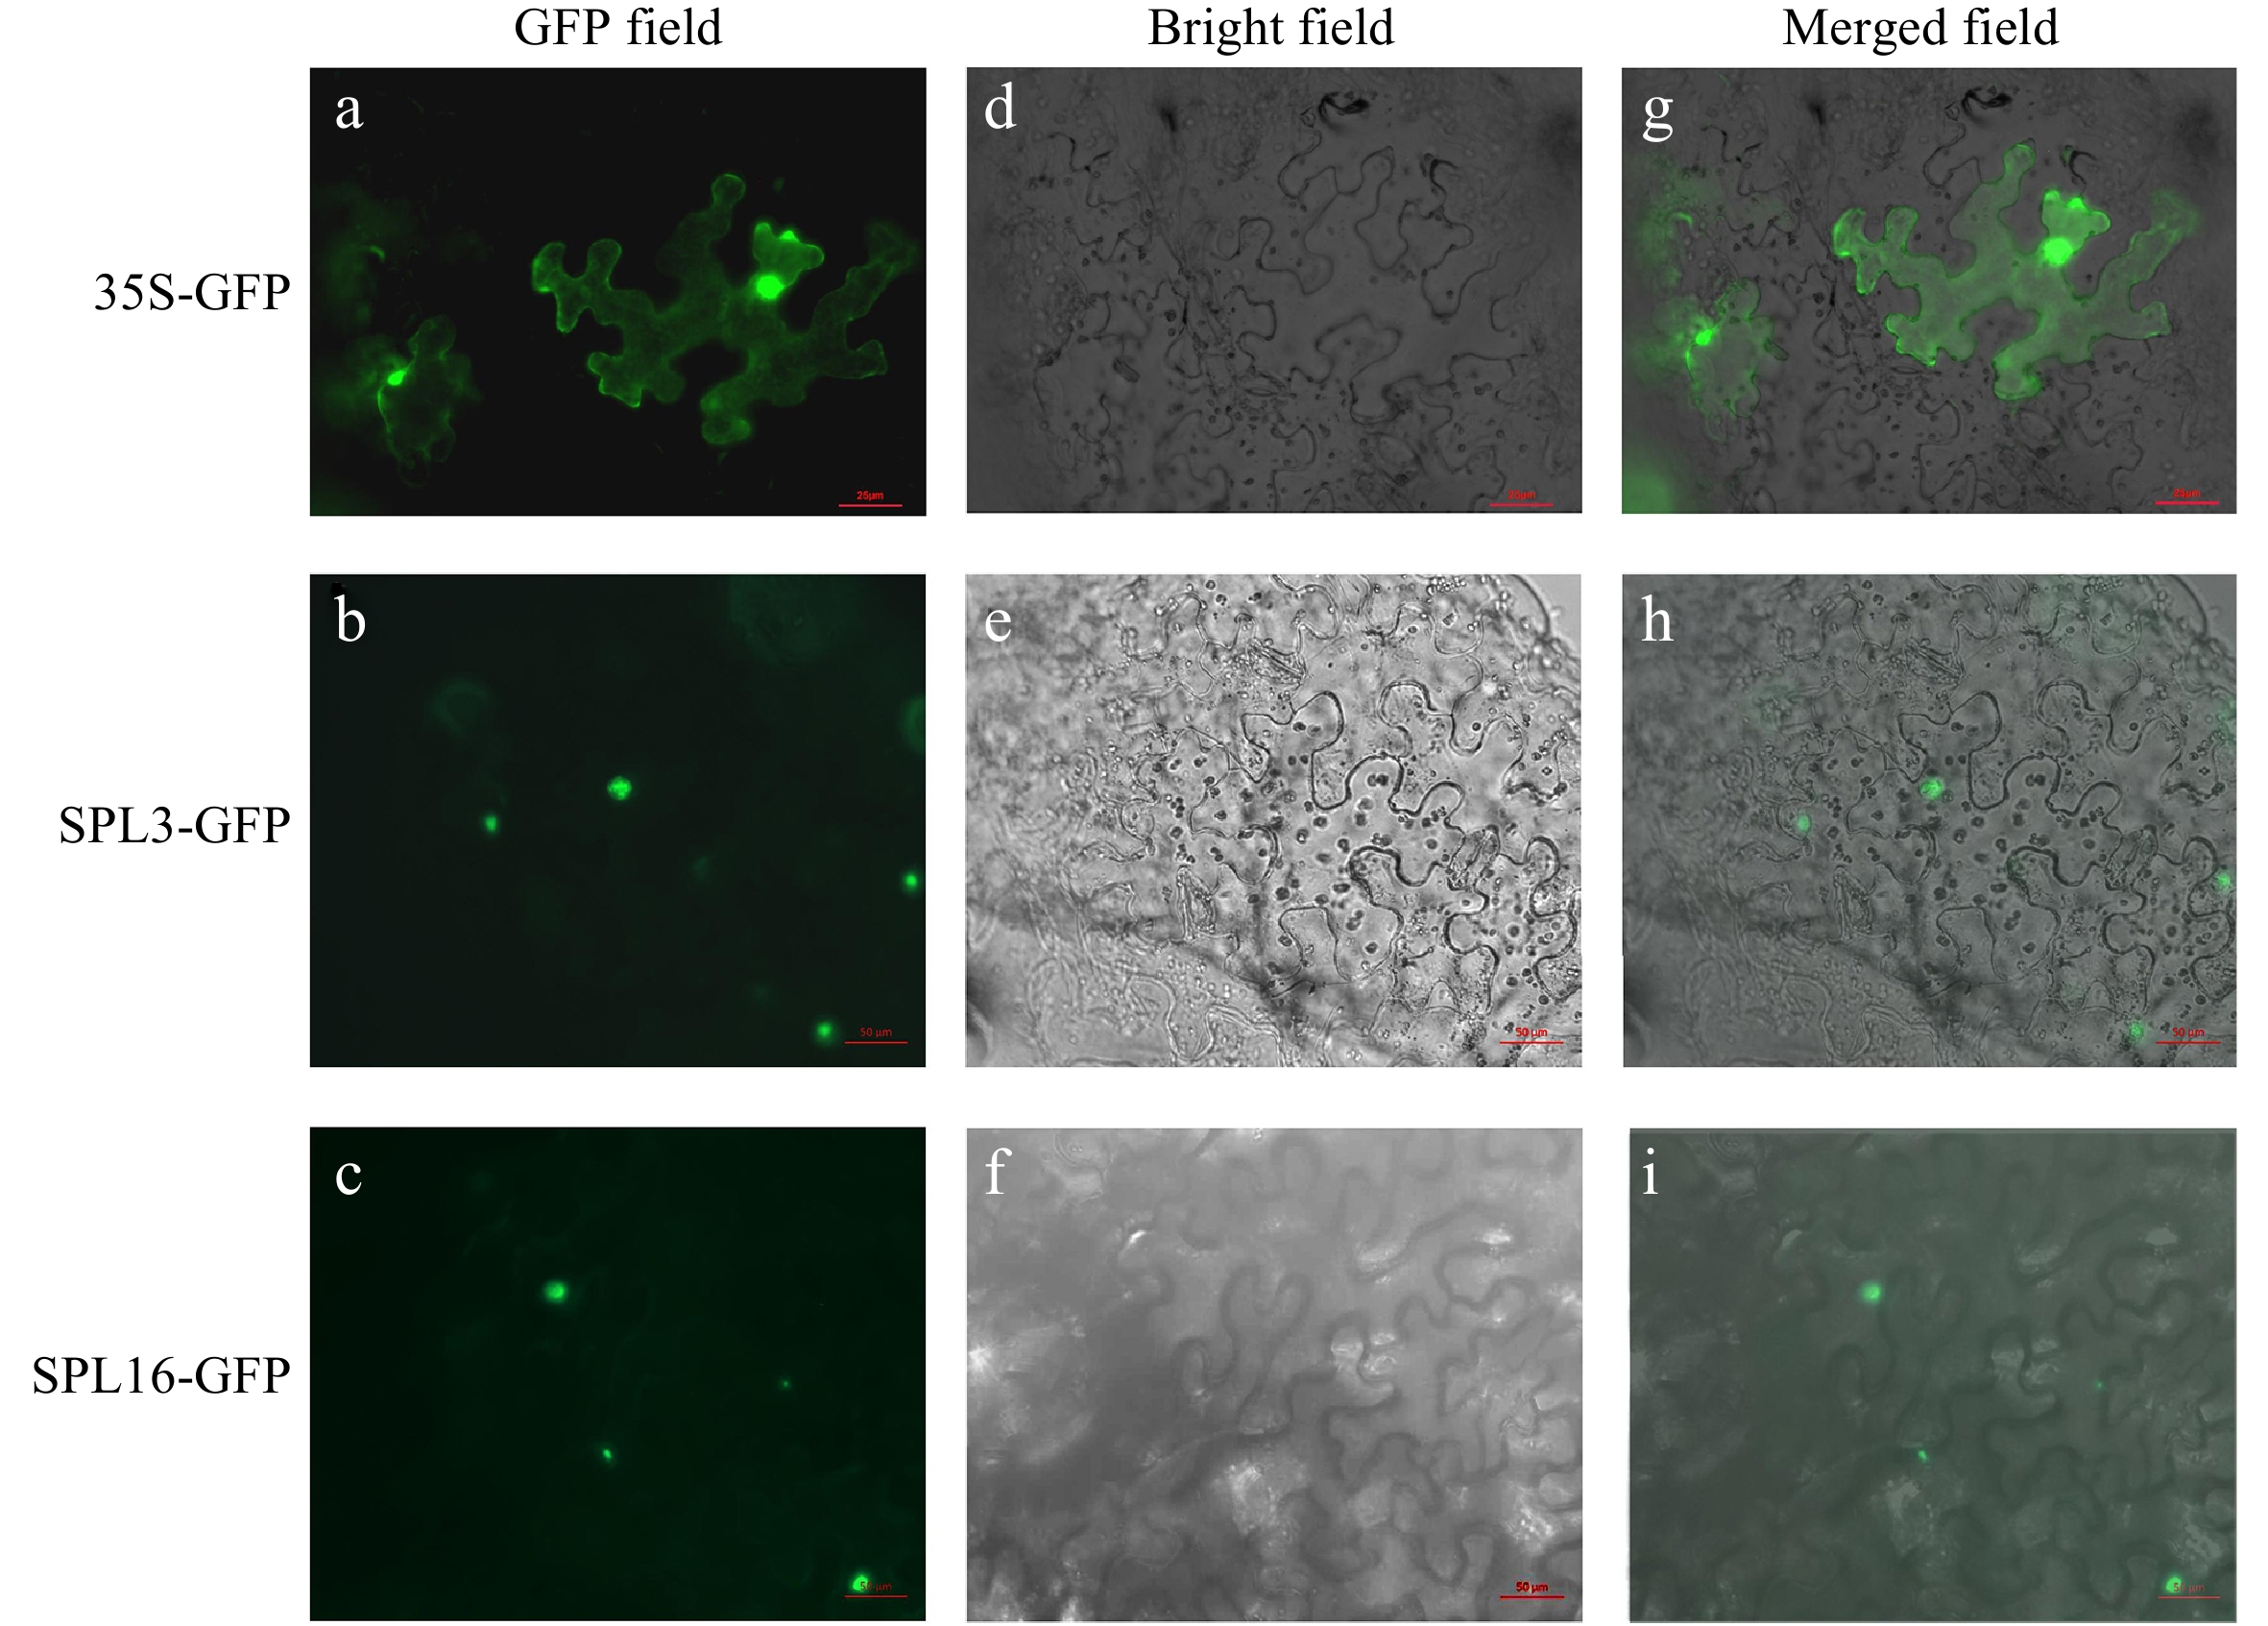
Figure 5.
Subcellular localization of LbrSPL3 and LbrSPL16. (a−c) GFP Fluorescence channel; (d−f) bright field; (g−i) merged image of GFP. The empty 35S-GFP vector was used as a negative control.
In situ hybridization
-
We performed in situ hybridization experiments using Lilium bud cores treated with different temperatures and designed different hybridization probes for the experiments based on the gene sequences. The results showed that LbrSPL3 and LbrSPL16 were not expressed in the negative control group. The hybridization signal was significantly weaker in the CK group, while LbrSPL3 and LbrSPL16 were clearly hybridized and uniformly expressed in the apical meristematic tissue of Lilium bud cores in the CT group (Fig. 6).
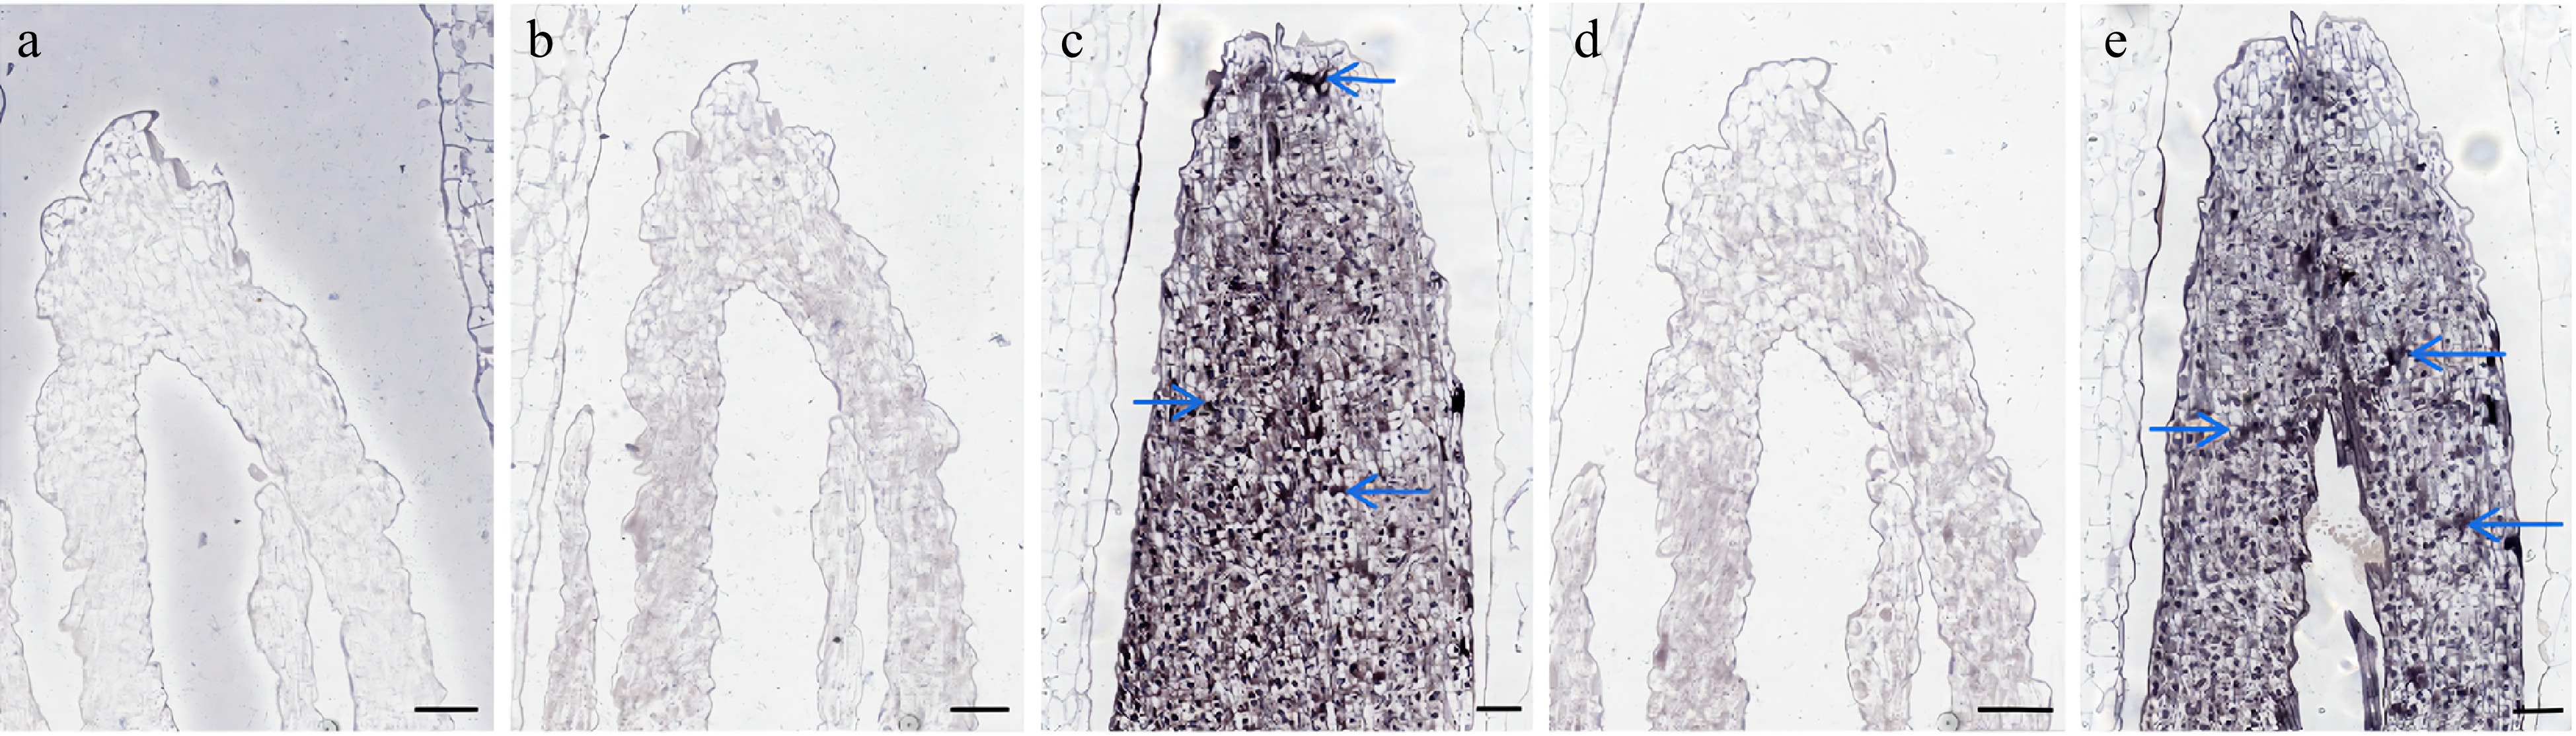
Figure 6.
In situ hybridization results of LbrSPL3 and LbrSPL16. (a) Negative control; (b) LbrSPL3 at 25 °C hybridization pictured; (c) LbrSPL3 at 15 °C hybridization pictured; (d) LbrSPL16 at 25 °C hybridization pictured; (e) LbrSPL16 at 15 °C hybridization pictured. The purple markers and blue arrows in the images represent the hybridization signal. Bar = 200 μm.
Overexpression of Lbr-miR156a, LbrSPL3, and LbrSPL16 in A. thaliana
-
To investigate whether Lbr-miR156a, LbrSPL3, and LbrSPL16 influenced growth and flowering time, we constructed overexpression vectors and infected A. thaliana to obtain transgenic plant lines OE-Lbr-miR156a, OE-LbrSPL3, and OE-LbrSPL16. T2 generation transgenic A. thaliana plants were selected.
The production of epidermal facets on the distal axis of A. thaliana is considered as a marker of the temporal phase change in nutritional growth. We compared the rosette leaf shape and epidermal hairs of the transgenic plants with those of the wild-type (WT) plants (Fig. 7) and found that plants overexpressing Lbr-miR156a underwent the phase transition at the 17th rosette leaf, which was significantly later than the WT A. thaliana (9th leaf). By contrast, plants overexpressing LbrSP3 and LbrSPL16 developed distal axial surface epidermal hairs at the 7th rosette leaf and underwent phase transition. The leaves before the onset of the phase transition were relatively round with smooth leaf margins, whereas the mature leaves were curled and oval in shape with serrated leaf margins.
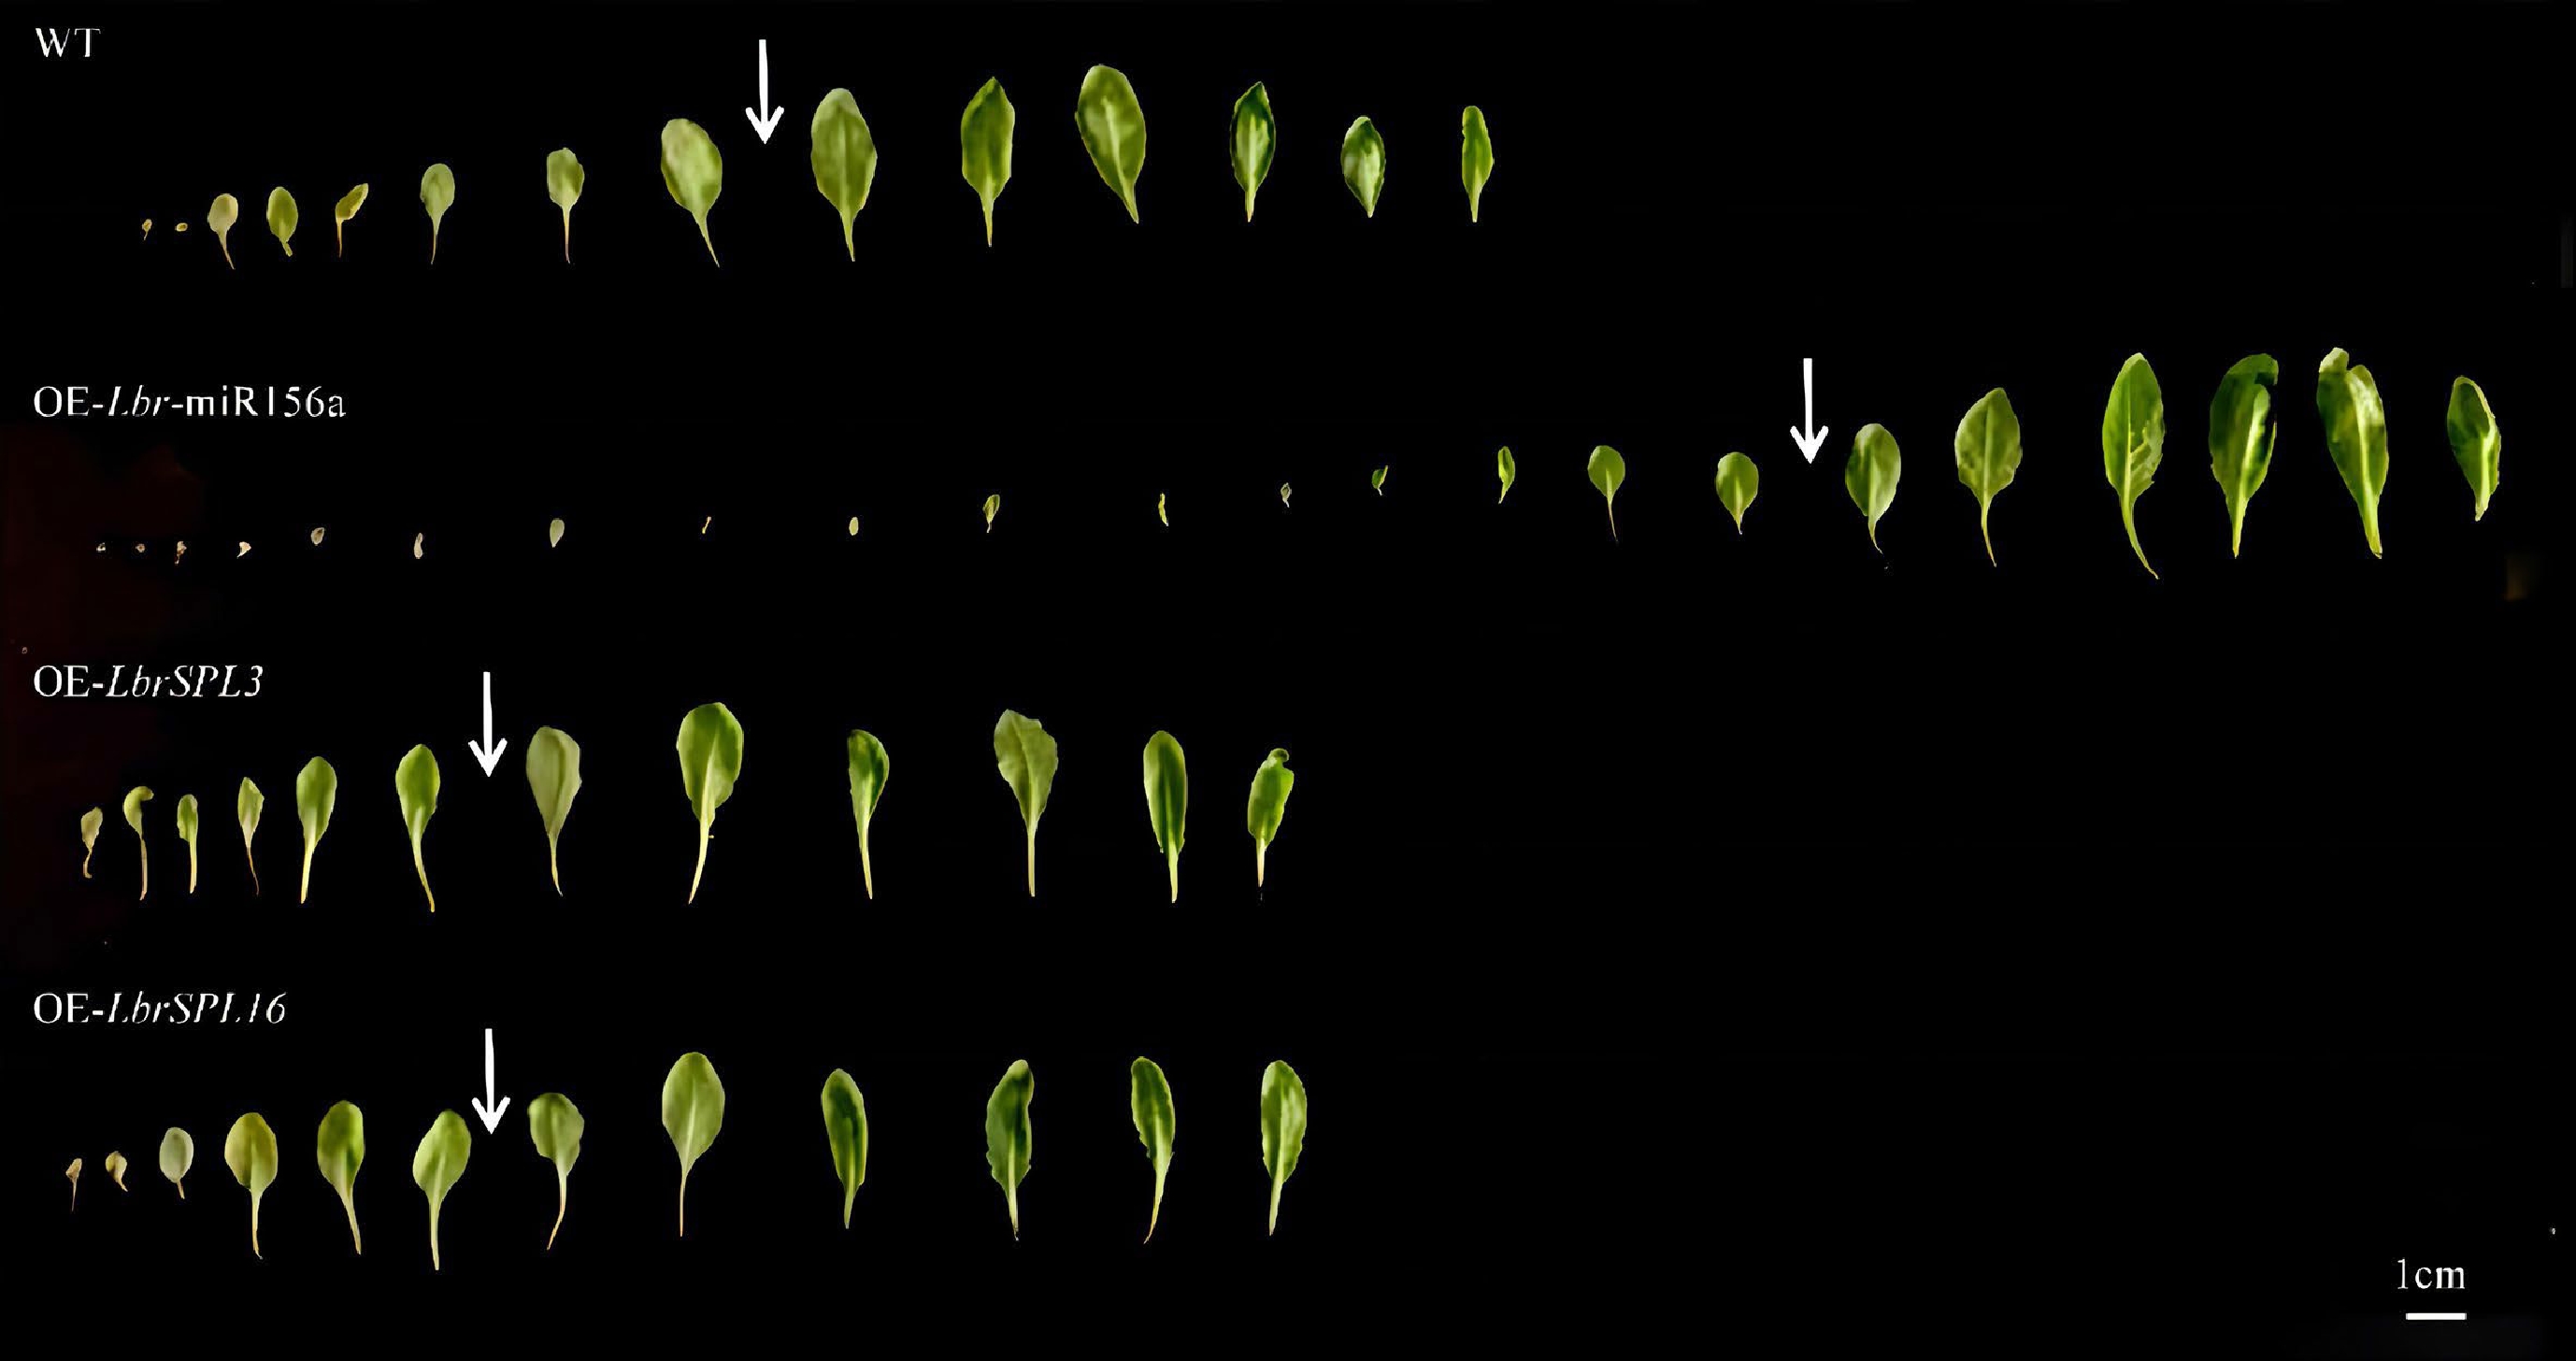
Figure 7.
Leaf morphology of rosette leaves in Lbr-miR156a, LbrSPL3 and LbrSPL16. The leaves of the plants are arranged in the order of growth. The leaves without abaxial trichomes are on the left side of the arrow, and the abaxial trichomes are shown on the right side of the arrow.
We compared the flowering time and the number of rosette leaves in the bolting and flowering stages between transgenic plants and WT plants. The overexpression of Lbr-miR156a delayed flowering in A. thaliana. At the bolting stage, transgenic plants had more rosette leaves than WT plants. On the contrary, the overexpression of LbrSPL3 and LbrSPL16 resulted in the plants flowering earlier, and they had fewer rosette leaves than WT plants at the bolting stage (Fig. 8a–f). The increased expression in the transgenic lines compared with the WT plants was confirmed by quantitative real-time PCR (qRT-PCR) analysis (Fig. 8g–i).
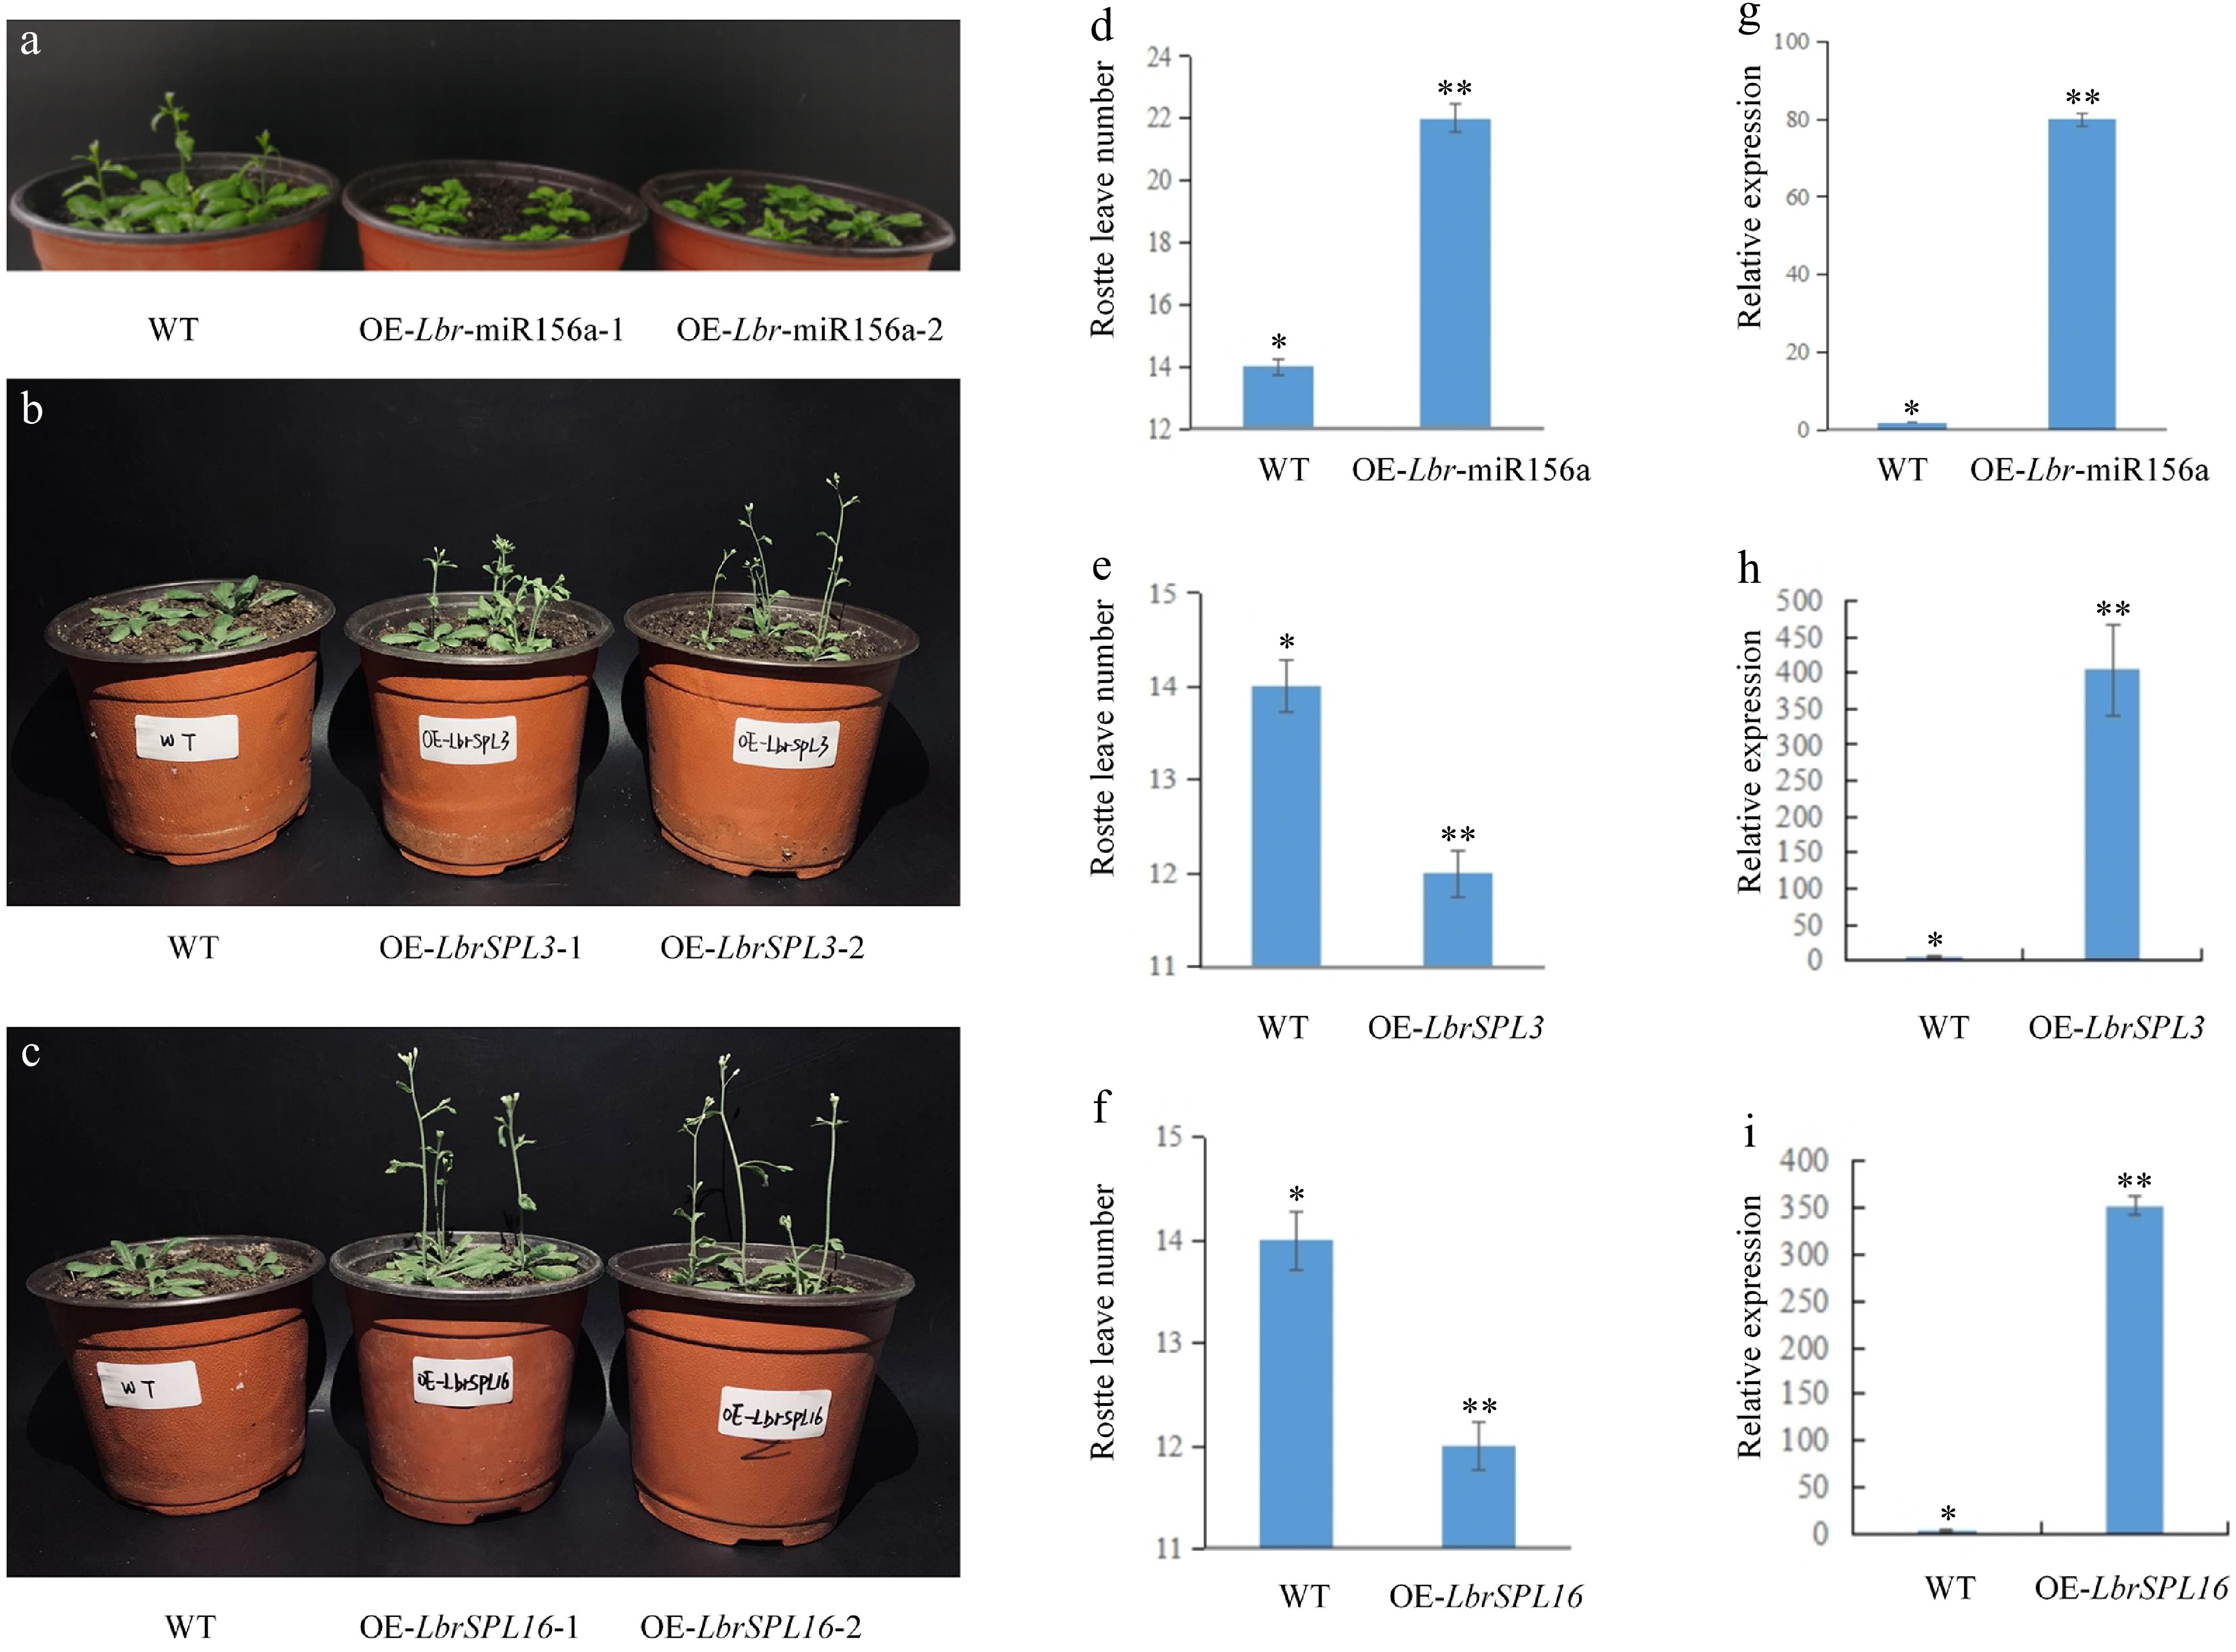
Figure 8.
Overexpression of Lbr-miR156a, LbrSPL3 and LbrSPL16 in A. thaliana. (a) Wild-type (WT), T2 generation transgenic OE-Lbr-miR156a-1, OE-Lbr-miR156a-2 delayed flowering phenotypes. (b) WT, T2 generation transgenic OE-LbrSPL3-1, OE-LbrSPL3-2 early flowering phenotypes. (c) WT, T2 generation transgenic OE-LbrSPL16-1, OE-LbrSPL16-2 early flowering phenotypes. (d) Number of rosette leaves in WT and Lbr-miR156a T2 transgenic plants. (e) Number of rosette leaves in WT and LbrSPL3 T2 transgenic plants. (f) Number of rosette leaves in WT and LbrSPL16 T2 transgenic plants. (g) qRT-PCR was used to analyze the expression levels of Lbr-miR156a in the WT and Lbr-miR156a T2 transgenic plants. (h) qRT-PCR was used to analyze the expression levels of LbrSPL3 in the WT and LbrSPL3 T2 transgenic plants. (i) qRT-PCR was used to analyze the expression levels of LbrSPL16 in the WT and LbrSPL16 T2 transgenic plants. The internal reference used for miR156a was U4, and the internal reference used for LbrSPL3 and LbrSPL16 was 18S rRNA. Twenty biological replicates were performed and averaged, using one-factor ANOVA method for statistical analysis in (d−f) Biological triplicates were averaged and significance analysis of expression in different samples was conducted in (g−i). Asterisks indicate significant differences (p < 0.05).
-
When plants are subjected to biotic and abiotic stresses in the environment, they effectively regulate the expression of relevant functional genes in their bodies through their signaling pathways, which in turn trigger a series of physiological and biochemical responses to form an efficient and orderly signaling regulatory network to reduce or eliminate the damage caused to the plant. Transcriptional regulation plays a role in the response of plants to environmental changes. The process of plant resistance to low temperature stress is a combination of multiple metabolic responses[29]. Low temperature signals are transmitted in the cell cascade by cascade, and response and protection mechanisms are initiated through various signaling pathways. Many transcription factors adapt to low temperatures by participating in the signaling process, regulating downstream gene expression, and altering intracellular metabolic processes. Sucrose metabolism plays a key role in plant development, stress response, and yield formation. The synthesis and catabolism of sugars drive the entire growth and development of plants, and sucrose is involved in regulating the expression of related genes as a signaling factor and can interact with other genes, hormones, and defense signals. Sugar signaling regulates plant development and stress response through direct or indirect interactions with other signaling pathways, including hormonal and redox-mediated processes[30]. Plants may also produce a series of defense responses in response to low temperature stress, such as elevated antioxidant enzyme activities and increased osmoregulatory substances[31]. To investigate the molecular regulatory mechanisms of Lilium after variable temperature treatment, we performed small RNA, degradome sequencing, and 'omics' analysis.
Using a combined omics approach, we discovered that the miRNA families miR156, miR166, miR396, and miR172 play a central role in the temporal phase transition of Lilium plants under low temperature treatment. miR156 belongs to a family of highly conserved microRNAs. miR156 negatively regulates SPL transcription factors, and the activation of SPL promotes phase transition in plants, while miR156 represses SPL expression[32]. miR156 was found to be key in the process of phase transition from juvenile to adult plants herein, and it played an important role in regulating the phase transition and flowering time during plant development[33]. SPLs are plant-specific SBP-like genes that serve as target genes for miR156. They are present in most plants and are involved in plant development, including leaf development, plant epidermal development, vegetative-to-reproductive phase change, flowering development and regulation, sporulation, hormonal regulation, stress responses[34], tillering or branching, and a variety of physiological and biochemical responses. Many studies have shown that SPLs are important regulators of trophic stage phase transition and flowering regulation[35]. In studies on Betula platyphylla, it has been demonstrated that the overexpression of SPLs shortened the phase change from vegetative to reproductive growth[36] and induced early plant flowering.
miR156 and miR164 play a key role in the mechanism of sterility[37]. The target gene of miR164 is the NAC transcription factor. miR164 bind to the NAC target and are involved in processes such as division and secondary wall synthesis in plant cells, as well as being associated with stress response processes such as low temperature and drought[38]. It has been reported that miR164 regulates plant nutritional growth and flower organ formation in A. thaliana, and the expression of miR164 was found to decrease with increasing growth age[39].
miR171 also plays an important regulatory role in the temporal growth transition of plants. In O. sativa, miR171 mediates the shear degradation of the mRNA of the target gene OsHAM (GRAS family transcription factor), thus promoting the transition from nutritional to reproductive growth and the formation of root tip meristematic tissue homeostasis[40]. During the Lilium growth phase transition, both miR156 and miR171 are likely to play a regulatory role by negatively regulating the corresponding target genes.
miR319 has overlapping effects on the regulation of flower development, flowering time, and anther development, mainly by targeting TEOSINTEBRANCHED1/ CYCLOIDEA/ PCF (TCP) transcripts and regulating leaf development, leaf senescence, flower development, and secondary cell wall biosynthesis[41]. Previous studies have reported that the overexpression of miR319 delayed plant senescence[42−44]. miR319 regulates various growth processes, including secondary growth and trichome initiation in P. tomentosa[42], the transition from cell elongation to wall thickening in Gossypium hirsutum[43], and cell division and cell proliferation in A. thaliana[44], suggesting that miR319 is an indispensable miRNA for plants and has critical functions in plant development. miR319-targeted OsTCP21 and OsGAmyb regulate tillering and grain yield in O. sativa[45]. It could be speculated that the early onset of the phase transition in Lilium was associated with the down-regulation of miR319 according to our small RNA sequencing results.
miR169 and its target NF-YAs are involved in developmental and environmental stress responses in plants. PtmiR169o plays a positive role in regulating drought tolerance and growth by targeting the PtNF-YA6 gene in Populus trichocarpa. Overexpression of Gm-miR169c confers increased drought stress sensitivity in transgenic A. thaliana[37]. miR169 may thus play an equally important role in the Lilium phase transition as the microRNAs mentioned above.
The miR156 family has the most complex regulatory relationship and the most regulatory pathways of the miRNA family, playing a significant role in the phase transition process. By targeting AP2-like, miR172 influences floral organ identity and controls sex differentiation and meristem cells[46]. Overexpression of miR172 reduced the translation of the AP2 protein and altered the flowering process in plants, resulting in abnormal flower phenotypes[47]. Previous studies have found that miR156 positively regulates the expression of miR172[19]. Rao et al. found that miR156-SPLs and miR172-AP2 are involved in a delayed flowering phenomenon after chromosome doubling in Lycium ruthencium[48]. It is also likely that miR156 and miR172 had an associated regulatory relationship during the temporal transition of Lilium, jointly regulating growth and development during this phase.
In Lilium bulbs treated with low temperature, miR156 was significantly down-regulated, while its identified target SPL genes, including SPL3 and SPL16, were significantly up-regulated. It can be inferred that miR156 controls the growth phase transition process of Lilium by targeting and regulating SPL transcription factors. We therefore conducted transgenic functional experiments in A. thaliana for validation.
The overexpression of miR156 in A. thaliana led to a longer juvenile phase, with the leaf size and traits of the transgenic A. thaliana being similar to those of the juvenile leaves, as well as the delayed appearance of distal trichomes on the abaxial side of the leaves[49]. Observation of the T2 phenotype in this study revealed delayed flowering in transgenic plants compared to wild-type A. thaliana, along with an increased number of rosette leaves, and similar phenotypic phenomena have been observed with the overexpression of miR156 in multiple species. For instance, the overexpression of Sly-miR156a in Solanum lycopersicum resulted in reduced height, an increased number of leaves, and smaller fruits in transgenic S. lycopersicum plants, and the overexpression of At-miR156b altered the morphology of S. lycopersicum pistils[50]. The overexpression of Gm-miR156b in G. max delayed flowering and also regulated branch development from the juvenile to adult stage[26]. Overexpression of miR156 in Brassica rapa delayed the change from the seedling to rosette stage, while mutants of miR156 sped up the change[51]. In the present study, observation of the phenotypes of overexpressed A. thaliana plants revealed that the transgenic plants had delayed flowering compared to the wild-type A. thaliana, along with an increased number of rosette leaves, probably because of the extended juvenile period and increased rosette leaves for greater assimilate accumulation to increase biomass production. In addition, with reference to previous studies, it was found that the leaves of transgenic A. thaliana plants in this study at the same period still exhibited round and small leaves, apical division of the plant, and were in the juvenile stage, while the leaves of wild-type A. thaliana plants were shuttle-shaped and significantly larger, and had already entered the adult stage. Presumably the overexpression of Lbr-miR156a also prolonged the juvenile phase and delayed flowering, thereby prolonging the maturation time of Lilium. This corroborates reports on S. lycopersicum[51], G. max[26], and M. sativa[16].
In this study, the key genes LbrSPL3 and LbrSPL16, which are the target genes of Lbr-miR156a, were cloned and validated for transgene function and biochemical functions.
SPL genes are involved in plant growth and signal transduction and play an integral role in plant growth phase transition, flowering development, and response to stresses of adversity[52]. Yang et al. found that SPL genes have important effects on the growth and development of Ginkgo biloba[53]. SPLs are important regulators of phase transition and flowering regulation during trophic stages[35]. When the plant is in the juvenile stage, miR156 has the highest transcript abundance and suppresses the expression of SPLs, which in turn suppresses flowering in A. thaliana. In contrast, when A. thaliana transitioned from juvenile to adult stages, the expression of miR156 gradually decreased, while leading to a gradual increase in the expression of SPL, which in turn promoted plant flowering[36].The SPL gene family also plays an important role in plant response to adversity. Cui et al. cloned ZmSPL16 from drought-tolerant maize and validated it as a superior genetic resource for drought stress tolerance in Z. mays[54].
Bioinformatics analysis of LbrSPL3 and LbrSPL16 revealed that they clustered with LfSPL3, OsSPL2, OsSPL16, OsSPL18, OsSPL19, and AtSPL13 with close affinity, and the protein sequences of both contained five motifs. Both LbrSPL3 and LbrSPL16 contained a conserved SBP domain in motif 1, which was consistent with the results of previous studies on the SPL transcription factor family[55]. The SBP domain contains two zinc binding sites and a nuclear localization signal, allowing the transcription factor to not only bind correctly to the target DNA, but also to enter the nuclear region with the help of the nuclear localization signal. In the transgene functional assay, we found that the LbrSPL3 and LbrSPL16 transgenic plants flowered earlier than the wild-type plants, and the number of rosette leaves was reduced. The reason for the reduced number of rosette leaves might be that the plants consumed less assimilates for vegetative growth and supplied more for reproductive growth. It was hypothesized that LbrSPL3 and LbrSPL16 encourage plants to enter the reproductive growth period for early flowering, playing an important role in shortening the maturation time of Lilium following low temperature treatment.
Previous studies have shown that TaSPL17 in Triticum aestivum is mainly expressed in young protoplasts where cell differentiation and division are more active[56]. Our in situ hybridization results showed that LbrSPL3 and LbrSPL16 were mainly expressed in the stem tip meristematic tissues and were consistently expressed after low-temperature treatment.
Transcription factors usually perform their regulatory functions in the nucleus, and SPL transcription factor family genes show their action at the nucleus location upon transfer into green fluorescent proteins. The nucleus fluoresced green when ZmbHLH4 was transfected into A. thaliana protoplasts[57]. The same phenomenon occurred when PpSPL4 was transferred into N. benthamiana[58]. Subcellular localization of LbrSPL3 and LbrSPL16 showed that they were both localized in the nucleus, and it was speculated that they might regulate the expression of related genes by binding to target-acting elements in the nucleus. Our transcriptional activation experiments revealed that LbrSPL3 and LbrSPL16 had transcriptional activation activity, indicating that LbrSPL3 and LbrSPL16 are transcription factors that function in the growth and development of Lilium.
-
Through small RNA, degradome sequencing, and combined omics analysis, we identified key regulatory miRNAs and target genes in the growth phase transition of Lilium; namely Lbr-miR156a and its corresponding target genes LbrSPL3 and LbrSPL16. By transgenic functional experiments, we found that Lbr-miR156a had opposite functions to LbrSPL3 and LbrSPL16. Lbr-miR156a could delay the growth phase transition, while LbrSPL3 and LbrSPL16 could promote the growth phase transition, thereby jointly regulating the growth phase transition in Lilium. Through sequence analysis of LbrSPL3 and LbrSPL16, in situ hybridization, subcellular localization, and transcriptional activation, we further confirmed the expression patterns of LbrSPL3 and LbrSPL16. This research provides a basis for further studies on the molecular mechanism of the phase transition in Lilium.
-
In this experiment, the OT (Oriental × Trumpet) Lilium (Liliaceae) hybrid variety 'Robina' was selected as the experimental material due to its erect stem, high stress tolerance, and short growth period. To produce bulb cuttings, bulbs of uniform size and without disease, insect damage, or mechanical damage were selected for exfoliation. The small bulbils were obtained by placing cuttings of the outer scales of Lilium in moist peat moss. For the control group, the bulbs were cultured under conventional conditions at 25 °C for 16 weeks and 4 °C for 10 weeks (BC25T), while for the treatment group, the bulbs were cultured under conventional conditions at 25 °C for 12 weeks, followed by 15 °C for 4 weeks and 4 °C for 10 weeks (BC15T). Small bulbs of similar weight were selected, and the bud cores were removed from the excluded bulb for the experiment.
RNA extraction, library construction, and sequencing
-
After temperature treatment, the outer scales of the generated bulbs were peeled off and the bud cores were left. The bud cores of bulbs from BC25T and BC15T were then extracted for molecular analysis. All samples were collected randomly and processed in sets of triplicates. Samples were frozen in liquid nitrogen and stored at −80 °C until analysis. Total RNA was isolated using TRIzol reagent (Invitrogen, USA). The quality and purity of the RNA were initially assessed on an agarose gel and NanoDrop 8000 spectrophotometer (NanoDrop, Thermo Scientific, Germany), and then the integrity of the RNA samples was further evaluated using an Agilent 2100 Bioanalyzer (Agilent Technologies, USA). All samples were collected randomly and processed in sets of triplicates. The sRNA libraries were constructed using a NEBNext® Multiplex Small RNA Library Prep Set for Illumina®. Finally, the sRNA libraries were sequenced on a BGISEQ-500 system. For degradome sequencing, mRNA was firstly captured by magnetic beads, and the 3', 5' adaptors were linked. Biotinylated random primers were then combined with the RNA, and the mixed mRNA was reverse transcribed. Quantitative RT-PCR amplification was performed and the entire library preparation was completed. Finally, the constructed library was sequenced on an Illumina HiSeq 2500, and the sequencing read length was 1 × 50 bp with a single end. After the purification of cDNA, Illumina's cluster station generated DNA clusters, following which the sequencing cycle was entered. In each sequencing reaction cycle, the fluorescence signal image was extracted to detect 1 base, and the read length after 50 cycles was 50 nt. Sequencing was performed by Lianchuan Biotechnology Co., Ltd (Beijing, China).
Bioinformatics analysis
-
Small RNA libraries of BC25T and BC15T were constructed, and the clean reads of each library were screened in the range of 16–31 nt. After the clean reads were selected, the total sRNAs were compared with the reference sequences using Bowtie, and the mapping values of the libraries and the reference sequences were around 50%. The above mapped sRNAs were compared with miRBase, Rfam, siRNA, piRNA, snoRNA, and other databases for classification and annotation analysis. To uniquely annotate each sRNA, the sRNAs were annotated in the order of priority: miRNA > piRNA > snoRNA > Rfam > other sRNAs. The 49 nt sequences obtained from sequencing were processed by removing junctions, low-quality reads, and contaminated reads to obtain the target sequences for plausible backup analysis, and the statistics of sequence length distribution and common sequence statistics among samples were performed. The cleaned target sequences were sorted and annotated to obtain information on the components and expressions contained in the samples. After all small RNA fragments were annotated, the remaining unannotated fragments were used for novel miRNA prediction. The tags mapped to the reference sequences were compared with miRBase to identify known miRNAs. Length variation at both 3' and 5' ends and one mismatch inside of the sequence were allowed in the alignment. The unique sequences mapping to specific species mature miRNAs in hairpin arms were identified as known miRNAs. The unique sequences mapping to the other arm of known specific species precursor hairpin opposite to the annotated mature miRNA-containing arm were considered to be novel 5p- or 3p derived miRNA candidates. The remaining sequences were mapped to other selected species precursors (with the exclusion of specific species) in miRBase 21.0 by BLAST search, and the mapped pre-miRNAs were further BLASTed against the specific species genomes to determine their genomic locations. The above two we defined as known miRNAs. The significance threshold was set to be 0.01 and 0.05 in each test.
The raw data obtained by degradome sequencing first needed to be filtered out for sequence articulator primers, while removing low quality sequences. Target gene prediction was performed using CleaveLand 3 (
https://github.com/MikeAxtell/CleaveLand3.git ), and the Oligomap short reading frame calibrator was used to find mRNAs matching the degradome sequences. Degradome sequences were compared with NRPM (reads per million) to eliminate redundancy. Oligomap was again applied to extract 13 sequences upstream and 13 sequences downstream of the pairing site for each mRNA that accurately matched the degraded group sequences to form a 26-nt mRNA. Sequences were obtained in a small RNA library using the Needle program in the EMBOSS package, provided that all matching sequences were scored according to the plant miRNA-target pairing criteria. The score could not exceed a set threshold, and the 10th nucleotide was saved at the 5' end of the degradome sequence paired with the small RNA. Using CleaveLand 3, the information of degradation sites was counted and classified, and the degradation sites were grouped according to the distribution of degradation fragments on the transcript and the number of fragment supports of the degradation sites. The plant target transcripts obtained by degradome sequencing could match different numbers of reads at different sites on the same mRNA, and the predicted sequences on these sites had to have corresponding miRNAs. The 178 Lilium miRNA sequences were thus matched with the target mRNA sequences on the Lilium transcriptome obtained by degradome sequencing to obtain accurate target gene identification results.qRT-PCR
-
For qRT-PCR expression analysis, RNA samples were reverse transcribed by using the TransScript miRNA First-Strand cDNA Synthesis Super Mix (Transgen Biotech, Beijing, China). The qRT-PCR used SYBR GREEN (TransGen, Beijing, China) and a Light Cycle 480 system (Roche Diagnostics). The PCR cycling conditions were: 94 °C for 30 s; 40 cycles of 94 °C for 5 s, 60 °C for 30 s. Each reaction was conducted in triplicate. The internal reference used for miRNAs and target genes, and their primer sequences were shown in Supplemental Table S1. The internal reference used for miRNA was U4, and the internal reference used for the SPL gene was 18S rRNA. The relative expression level was determined by the 2−ΔΔCᴛ method. The average of three biological replicates was taken and significance analysis of expression in different samples was conducted. Different letters in the same graph indicate significant differences (p < 0.05).
Phylogenetic analysis of LbrSPL3 and LbrSPL16
-
Clusters of LbrSPL3 and LbrSPL16 transcription factors and SPLs families of A. thaliana, O. sativa, and Taiwan Lilium were analyzed by MEGA7.0 software. The evolutionary history of the LbrSPL3 and LbrSPL16 transcription factors was deduced by the proximity method. The evolutionary distance was calculated by the P-distance method, and the phylogenetic tree was constructed based on the number of amino acid differences at each site. The MEME online tools (
http://meme-suite.org/tools/meme ) were used to identify protein conserved motifs in LbrSPL3 and LbrSPL16. MEME was run locally with the following parameters: number of repetitions = any, maximum number of motifs = 10, minimum width = 6, and maximum width = 200.Subcellular localization and transcriptional activation
-
The target gene plasmid was linked to the pYBA-1132-EGFP vector after adding the universal joint. The recombinant vectors GFP-LbrSPL3 and GFP-LbrSPL16 were constructed. The constructed plasmid was transferred into Agrobacterium GV3101 by the chemical transformation method, and positive clones were selected. The positive clones were expanded in YEB liquid medium to prepare subcellular localization infection solution, which was injected into the back of the tobacco leaves. After 24 h dark treatment, the samples were cultured normally for 3−5 days. The lower epidermis of the tobacco leaves was removed and sliced, and observed under a fluorescence microscope.
If the expressed protein is able to interact with the target gene, it will activate the transcription of the downstream reporter gene, thus indicating that the TF is transcriptionally active in the yeast one-hybrid system. The recombinant expression vectors of LbrSPL3 and LbrSPL16 with the pGBKT7 vector were constructed using this technique. The constructed correct recombinant vector was converted into AH109 yeast competent cells, coated on the solid medium with SD/-Trp deletion, and cultured in an incubator at 30 °C for 2−3 days. The positive clone results were selected and inoculated in SD/-Trp-deficient medium, oscillated at 30 °C for 2−3 days, diluted to OD600 = 0.1, coated on SD/Trp-His-3AT 15 mM solid medium, and cultured in a 30 °C incubator for 2−3 days. The growth of bacteria on the two-deficient-media was observed, and the transcriptional activities of LbrSPL3 and LbrSPL16 were detected.
In situ hybridization
-
Plant paraffin sections were subjected to BCIP/NBT colorimetric in situ hybridization (CISH) using Lilium bud cores treated with low temperature and control bud cores. The material was treated overnight in fixative (DEPC water preparation) solution and then dehydrated and sectioned, and then the paraffin sections were dewaxed with water and digested. Pre-hybridization solution was added dropwise and incubated at 37 °C for 1 h. After pouring off the pre-hybridization solution, hybridization solution containing the positive probe SPL16ORF/SPL3ORF/SPL3ORF was added dropwise at a concentration of 1 μM and hybridized overnight at 42 °C in a thermostat. Following washing and the addition of blocking solution dropwise, mouse anti-digoxigenin-labeled alkaline phosphatase (anti-DIG-AP) was added dropwise, incubated for 50 min at 37 °C, and then washed 4 times with TBS for 5 min. BCIP/NBT chromogenic solution was added dropwise and then observed by microscopy. After rinsing with pure water, the films were sealed with glycerol gelatin. Microscopic examination was performed, and images were collected for analysis.
Transgenic functional verification
-
Nimble Cloning (NC cloning) can clone the DNA of linear DNA or ringed plasmid (entry clone) directly to the ringed expression vector of the NC system through Nimble Mix without linearization of the expression vector. The target gene plasmid was attached to the modified pNC-CAMBIA1304 vector: pNC-CAMBIA1304-MCS35S after adding the universal joint of nimble cloning by PCR. The overexpression vectors 1304-LbrSPL3 and 1304-LbrSPL16 were constructed by the NC cloning system. The overexpression vector pCAMBIA1301-miR156a was constructed by double-enzyme digestion. The constructed overexpression vector was transformed into Agrobacterium GV3101 by chemical transformation, and the wild-type A. thaliana plants were infiltrated by floral dipping. To transform Agrobacterium, approximately 1 μg of recombinant plasmid was added to 100 µL of Agrobacterium GV3101 receptor cells, mixed and placed on ice for 5 min, liquid nitrogen for 5 min, 37 °C water bath for 5 min and ice bath for 5 min. Seven hundred microlitres of liquid YEB medium was then added and incubated in a 28 °C shaking incubator at 180 rpm for 2−3 h. The finished Agrobacterium was collected to increase the concentration and then incubated to YEB solid medium containing double antibiotics, and then PCR identification was performed. The infected A. thaliana plants were carefully cultured and selected to T2 generation. The number of rosette leaves of the wild-type and transgenic A. thaliana was counted, and qRT-PCR verification of Lbr-miR156a, LbrSPL9, and LbrSPL15 at the T2 generation was performed. Total RNA was extracted from 3–4-week-old A. thaliana wild-type leaves and LbrSPL3 and LbrSPL16 transgenic plants using the TRIzol RNA extraction kit (Aidlab, Beijing, China). The cDNA of LbrSPL3 and LbrSPL16 was synthesized using TransScript One-Step gDNA Removal and cDNA Synthesis Super Mix kits (TransGen, Beijing, China). The DNA was extracted using the CTAB Plant Genome DNA Rapid Extraction Kit purchased from Beijing Aidlab Biotechnology Co (Aidlab, Beijing, China). The shooting period, the number and leaf shape of the rosette leaves at the shoots, and the morphology of epidermal hairs on the proximal and distal axial surfaces were observed in the transgenic plants.
Statistical analysis
-
The data were analyzed by Excel (Microsoft Corp.) and SPSS statistics 26.0 (IBM Corp.).
Accession numbers
-
Sequence data from this article can be found at NCBI's Short Read Archive (SRA) under accession number PRJNA785364.
The authors thank the editor and the anonymous reviewers for their efforts to improve the manuscript. This project was supported by the Beijing Natural Science Fund-Municipal Education Commission Jointly Funded Projects (grant No. KZ201810020029) and Beijing Excellent Training Project to WG (grant No. 68).
-
The authors declare that they have no conflict of interest.
- Supplementary Fig. S1. Morphological characteristics of different groups of Lilium after two weeks of terrestrial planting. a: Plant growth in the control group. b: Plant growth in the treatment group.
- Supplementary Fig. S2. Total sRNA length distribution.
- Supplemental Table S1 Identification of known miRNAs
- Supplementary Fig. S3. Known differentially expressed miRNA genes. Clustering with log10 (TPM+1) values.
- Supplementary Fig. S4. Novel differentially expressed miRNA genes. Clustering with log10 (TPM+1) values.
- Supplementary Fig. S5. qRT-PCR results of miRNAs. After variable temperature treatment, miR167a-1 and miR167d-5 were up-reguleted. While miR169a-5, miR169m, miR171b-3p and miR171d-1 were down-regulated. The average of three biological replicates was taken and significance analysis of expression in different samples was conducted. Different letters in the same graph indicate significant differences (p<0.05).
- Supplementary Fig. S6. qRT-PCR results of novel miRNAs and their target genes. The figure shows the interactions between: a: novel_mir1 and DUSP12, b: novel_mir7 and LRK10, c: novel_mir53 and NADH4, d: novel_mir56 and F-box. After variable temperature treatment, novel_mir1 and novel_mir53 were up-regulated, while novel_mir7 and novel_mir56 were down-regulated. Their target genes were opposite to their regulatory relationships. The average of three biological replicates was taken and significance analysis of expression in different samples was conducted. Different letters in the same graph indicate significant differences (p<0.05).
- Supplemental Table S2 Primers used for qRT-PCR
- Supplementary Table S3. Statistical analysis of the sequencing data of the degradome.
- Supplementary Table S4. Target genes regulated by miRNAs related to growth and development.
- Supplementary Fig. S7. miRNA-target genes regulatory network. The green circle indicated the gene ID of the target genes, and the red arrow represented the miRNA. a: All miRNA-target genes regulatory network. b: miR156-SPLs regulatory network.
- Supplemental Fig. S8 Functional classification of miRNA target genes GO (Gene Ontology).
- Supplemental Fig. S9 Classification of miRNA target gene KEGG (Kyoto Encyclopedia of Genes and Genomes) pathways. The statistics were analyzed from the degradome. The KEGG pathways were classified and the percentage of genes in each pathway is shown. The 17 different pathways were divided into five categories.
- Supplemental Fig. S10 Transcriptional activity of LbrSPL3 and LbrSPL16 proteins in yeast.
- Copyright: © 2022 by the author(s). Published by Maximum Academic Press, Fayetteville, GA. This article is an open access article distributed under Creative Commons Attribution License (CC BY 4.0), visit https://creativecommons.org/licenses/by/4.0/.
-
About this article
Cite this article
Chen Y, Zhao M, Wang X, Cui J, Ge W, et al. 2022. Key microRNAs and target genes involved in regulating maturation in Lilium. Ornamental Plant Research 2:9 doi: 10.48130/OPR-2022-0009 

Key microRNAs and target genes involved in regulating maturation in Lilium
- Received: 16 March 2022
- Accepted: 25 May 2022
- Published online: 22 June 2022
Abstract:
Lilium is an ornamental bulb with a long juvenile stage, making its cultivation under natural conditions lengthy and costly. SQUAMOSA promoter-binding protein-like (SPL) transcription factors are related to plant growth and development, including phase transition. However, their role in phase transition in Lilium is not known. To explore the molecular mechanisms associated with the phase transition in Lilium, bulbs of Lilium Oriental Trumpet 'Robina' were treated with lowered temperature to induce phase transition, and the small RNA and degradome were sequenced. A total of 161 miRNAs were identified as targets. Twenty-nine known miRNAs were differentially expressed, including 16 up-regulated miRNAs and 13 down-regulated miRNAs. Lbr-miR156a was significantly down-regulated, and the target genes of Lbr-miR156a were identified as LbrSPL3 and LbrSPL16.
Phylogenetic analysis showed that LbrSPL3 and LbrSPL16 had high homology with other plant SPLs. Subcellular localization and transcriptional activation experiments confirmed that LbrSPL3 and LbrSPL16 were mainly located in the nucleus and had transcriptional activity. The in situ hybridization results showed that the expression of LbrSPL3 and LbrSPL16 was increased following low-temperature treatment. Functional verification experiments of Arabidopsis transgenic plants showed that the overexpression of LbrSPL3 and LbrSPL16 could promote plant phase change, while the overexpression of Lbr-miR156a could inhibit this process. These results help elucidate the mechanism of phase transition regulation in Lilium and provide a reference for breeding research in other bulbous flowers.