-

Figure 1.
Expression, purification and identification of Cra a 4. (a) Base sequence alignment analysis of sequencing and template. (b) Optimization of the expression conditions for Cra a 4 after induced by isoprophyl-β-D-thiogalactoside using SDS-PAGE. (c) Optimization of the expression conditions for Cra a 4 after induced by isoprophyl-β-D-thiogalactoside using Western blotting. Lane M, protein marker; Lane 1, the supernatant of cell lysate after being induced for 4 h; Lane 2, the precipitate of cell lysate after being induced 4 h; Lane 3, the supernatant of cell lysate after being induced for 6 h; Lane 4, the precipitate of cell lysate after being induced for 6 h; Lane 5, the supernatant of cell lysate after being induced for 8 h; Lane 6, the precipitate of cell lysate after being induced for 8 h; Lane 7, pET-22b vector. (d) Purification of Cra a 4 by Ni2+-NTA resin. Lane M, protein marker; Lane sample, the super-natant of cell lysate after being induced 4 h; The other numbers 4, 8, 22, 23, 24, 25, 26 and 29 on the top of the lanes correspond to the fraction number. (e) SDS-PAGE of purified Cra a 4. (f) Western blotting verification of purified Cra a 4 by rabbit anti Cra a 4 pAb. (g) IgE binding activity of Cra a 4 by ELISA with sera. NC-1 and NC-2: the sera of non-atopic individuals were used as the negative control. S1−S12 were the sera of oyster sensitive individuals.
-
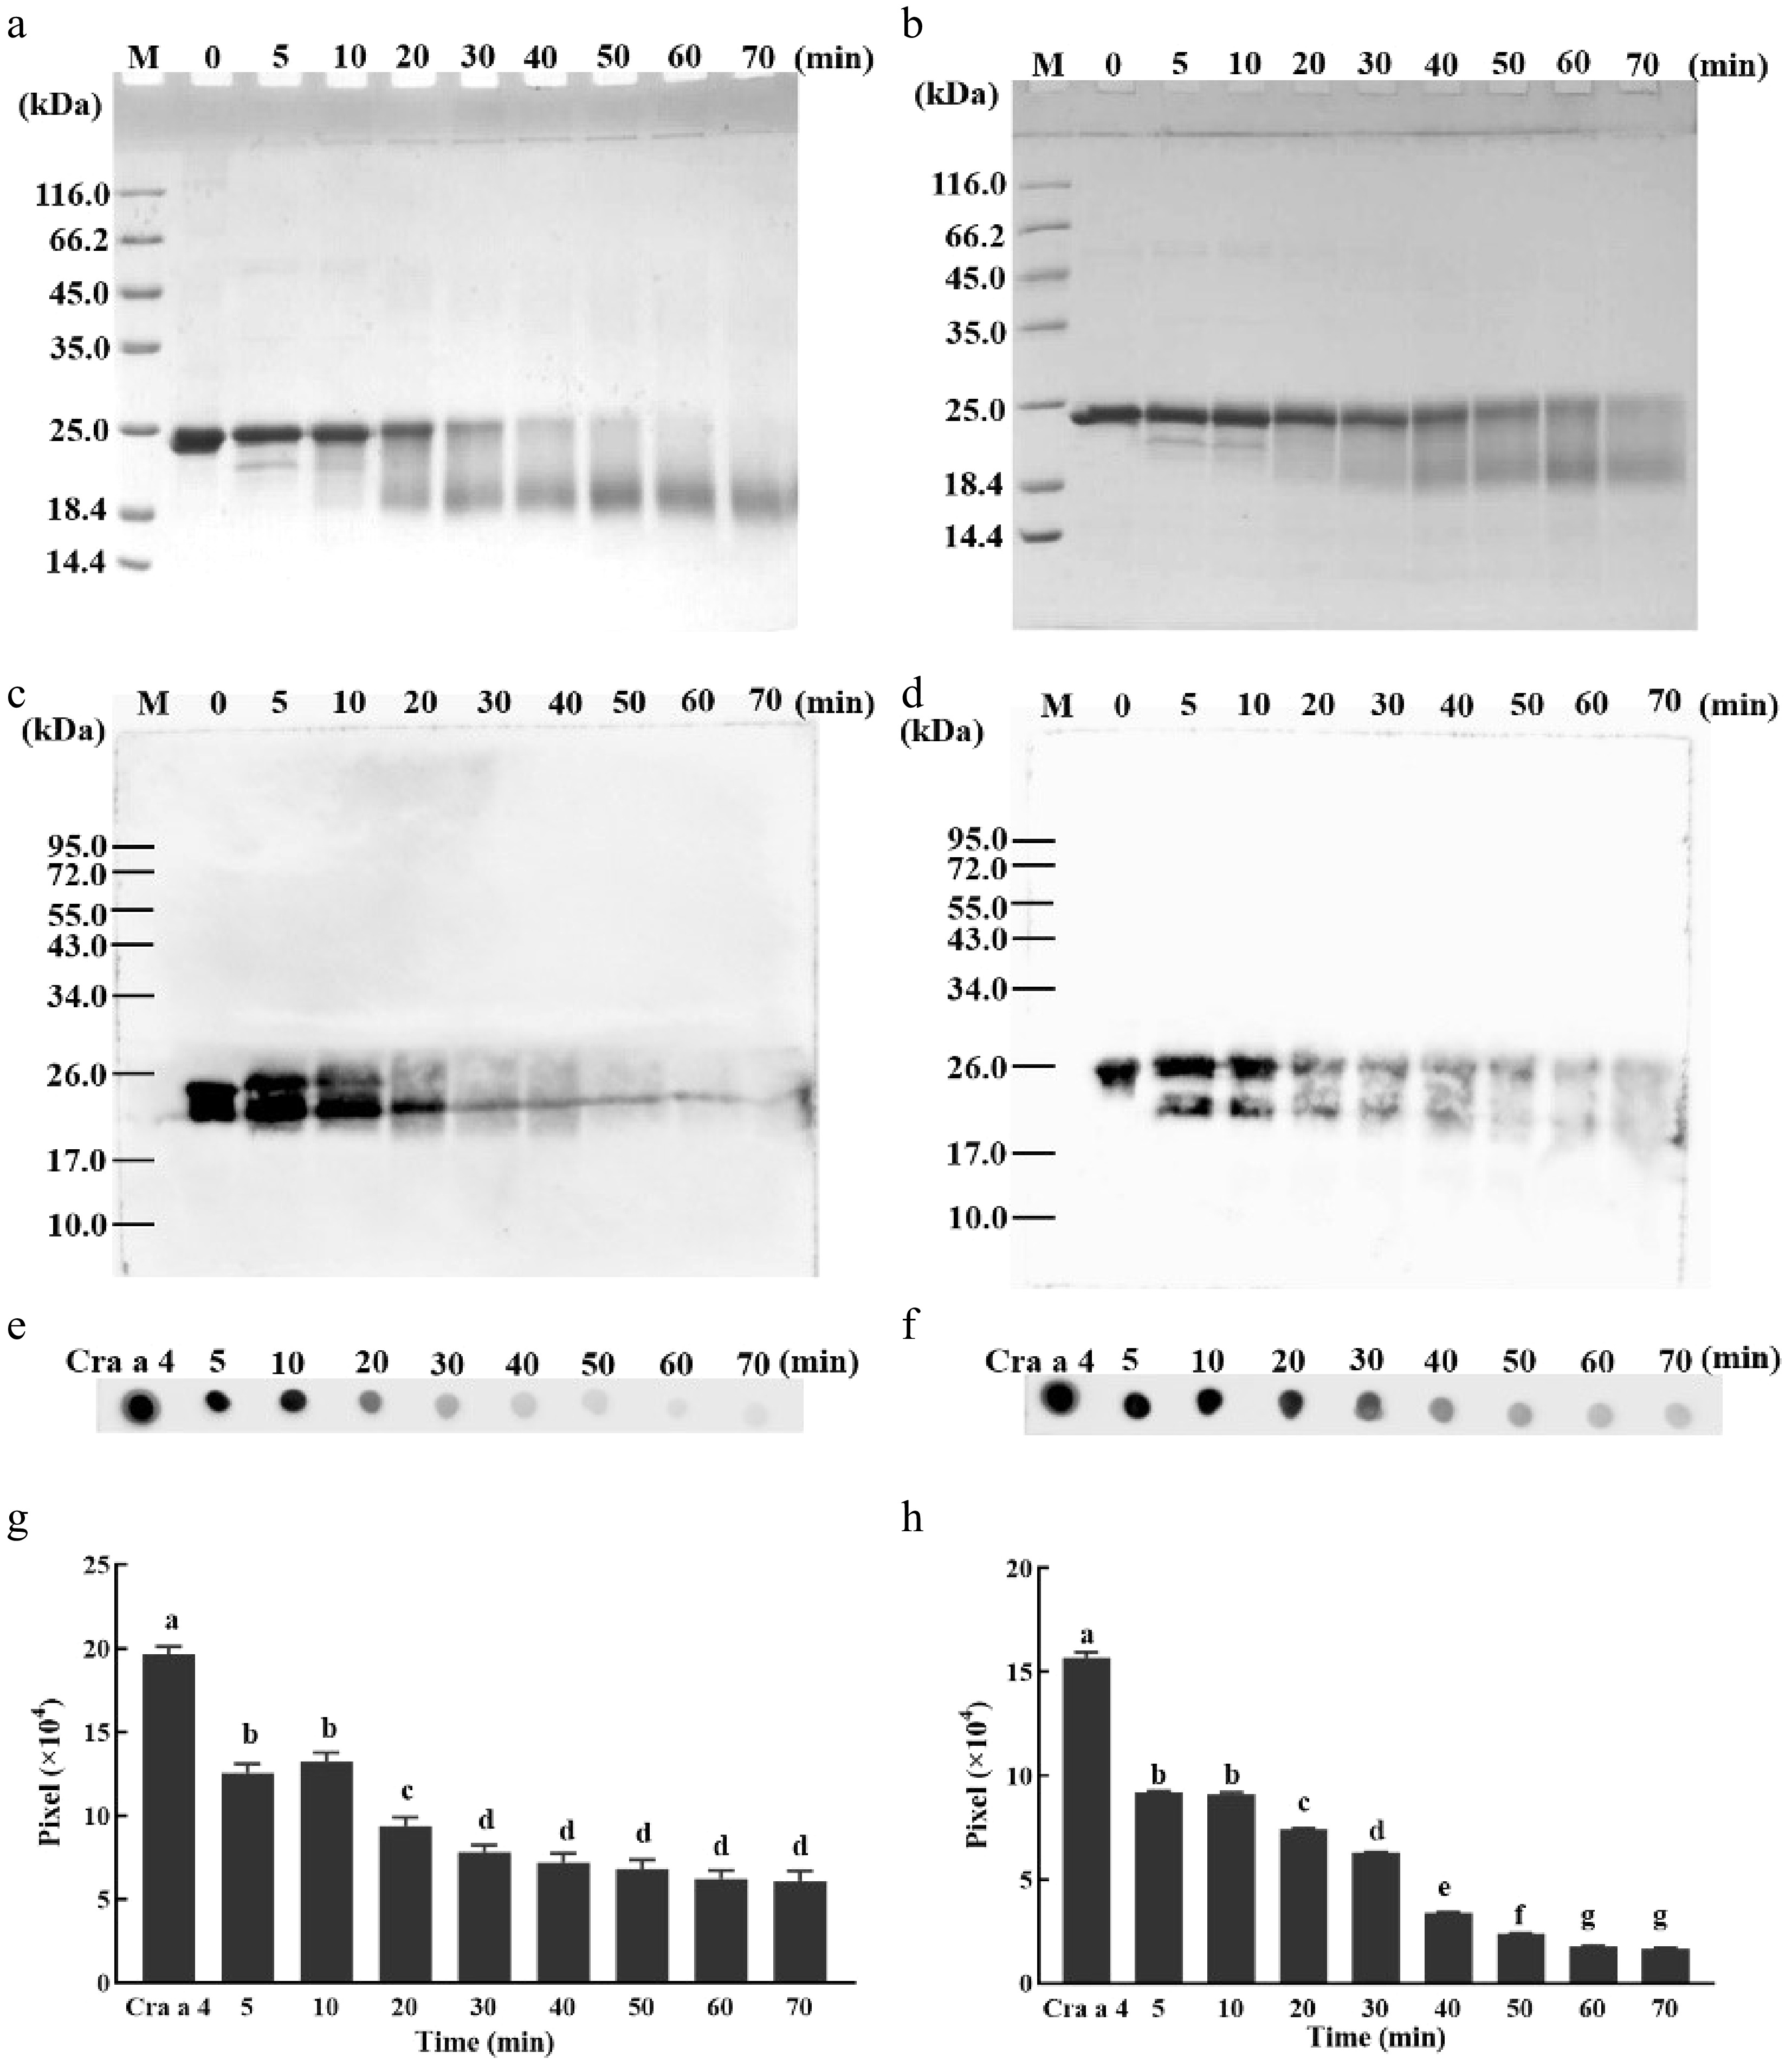
Figure 2.
Optimization of the reaction time for MR. (a) SDS-PAGE profile of Cra a 4 incubated with xylose for different time periods. Lane M, protein marker; The other numbers 0, 5, 10, 20, 30, 40, 50, 60 and 70 on the top of the lanes represent the different reaction times. (b) SDS-PAGE profile of Cra a 4 incubated with glucose for different time periods. Lane M, protein marker; The other numbers 0, 5, 10, 20, 30, 40, 50, 60 and 70 on the top of the lanes represent the different reaction times. (c) Western blotting of Cra a 4 incubated with xylose for different time periods. Lane M, protein marker; The other numbers 0, 5, 10, 20, 30, 40, 50, 60 and 70 on the top of the lanes represent the different reaction times. (d) Western blotting of Cra a 4 incubated with glucose for different time periods. Lane M, protein marker; The other numbers 0, 5, 10, 20, 30, 40, 50, 60 and 70 on the top of the lanes represent the different reaction times. (e) Dot blotting of Cra a 4 incubated with xylose for different time periods by rabbit anti Cra a 4 pAb. Lane M, protein marker; The other numbers 0, 5, 10, 20, 30, 40, 50, 60 and 70 on the top of the lanes represent the different reaction times. (f) Dot blotting of Cra a 4 incubated with glucose for different time periods by rabbit anti Cra a 4 pAb. Lane M, protein marker; The other numbers 0, 5, 10, 20, 30, 40, 50, 60 and 70 on the top of the lanes represent the different reaction times. (g) The intensity of the dots shown in part (e). The quantification of grayscale dots was analyzed using ImageJ software. (h) The intensity of the dots shown in part (f). The quantification of grayscale dots was analyzed using ImageJ software.
-
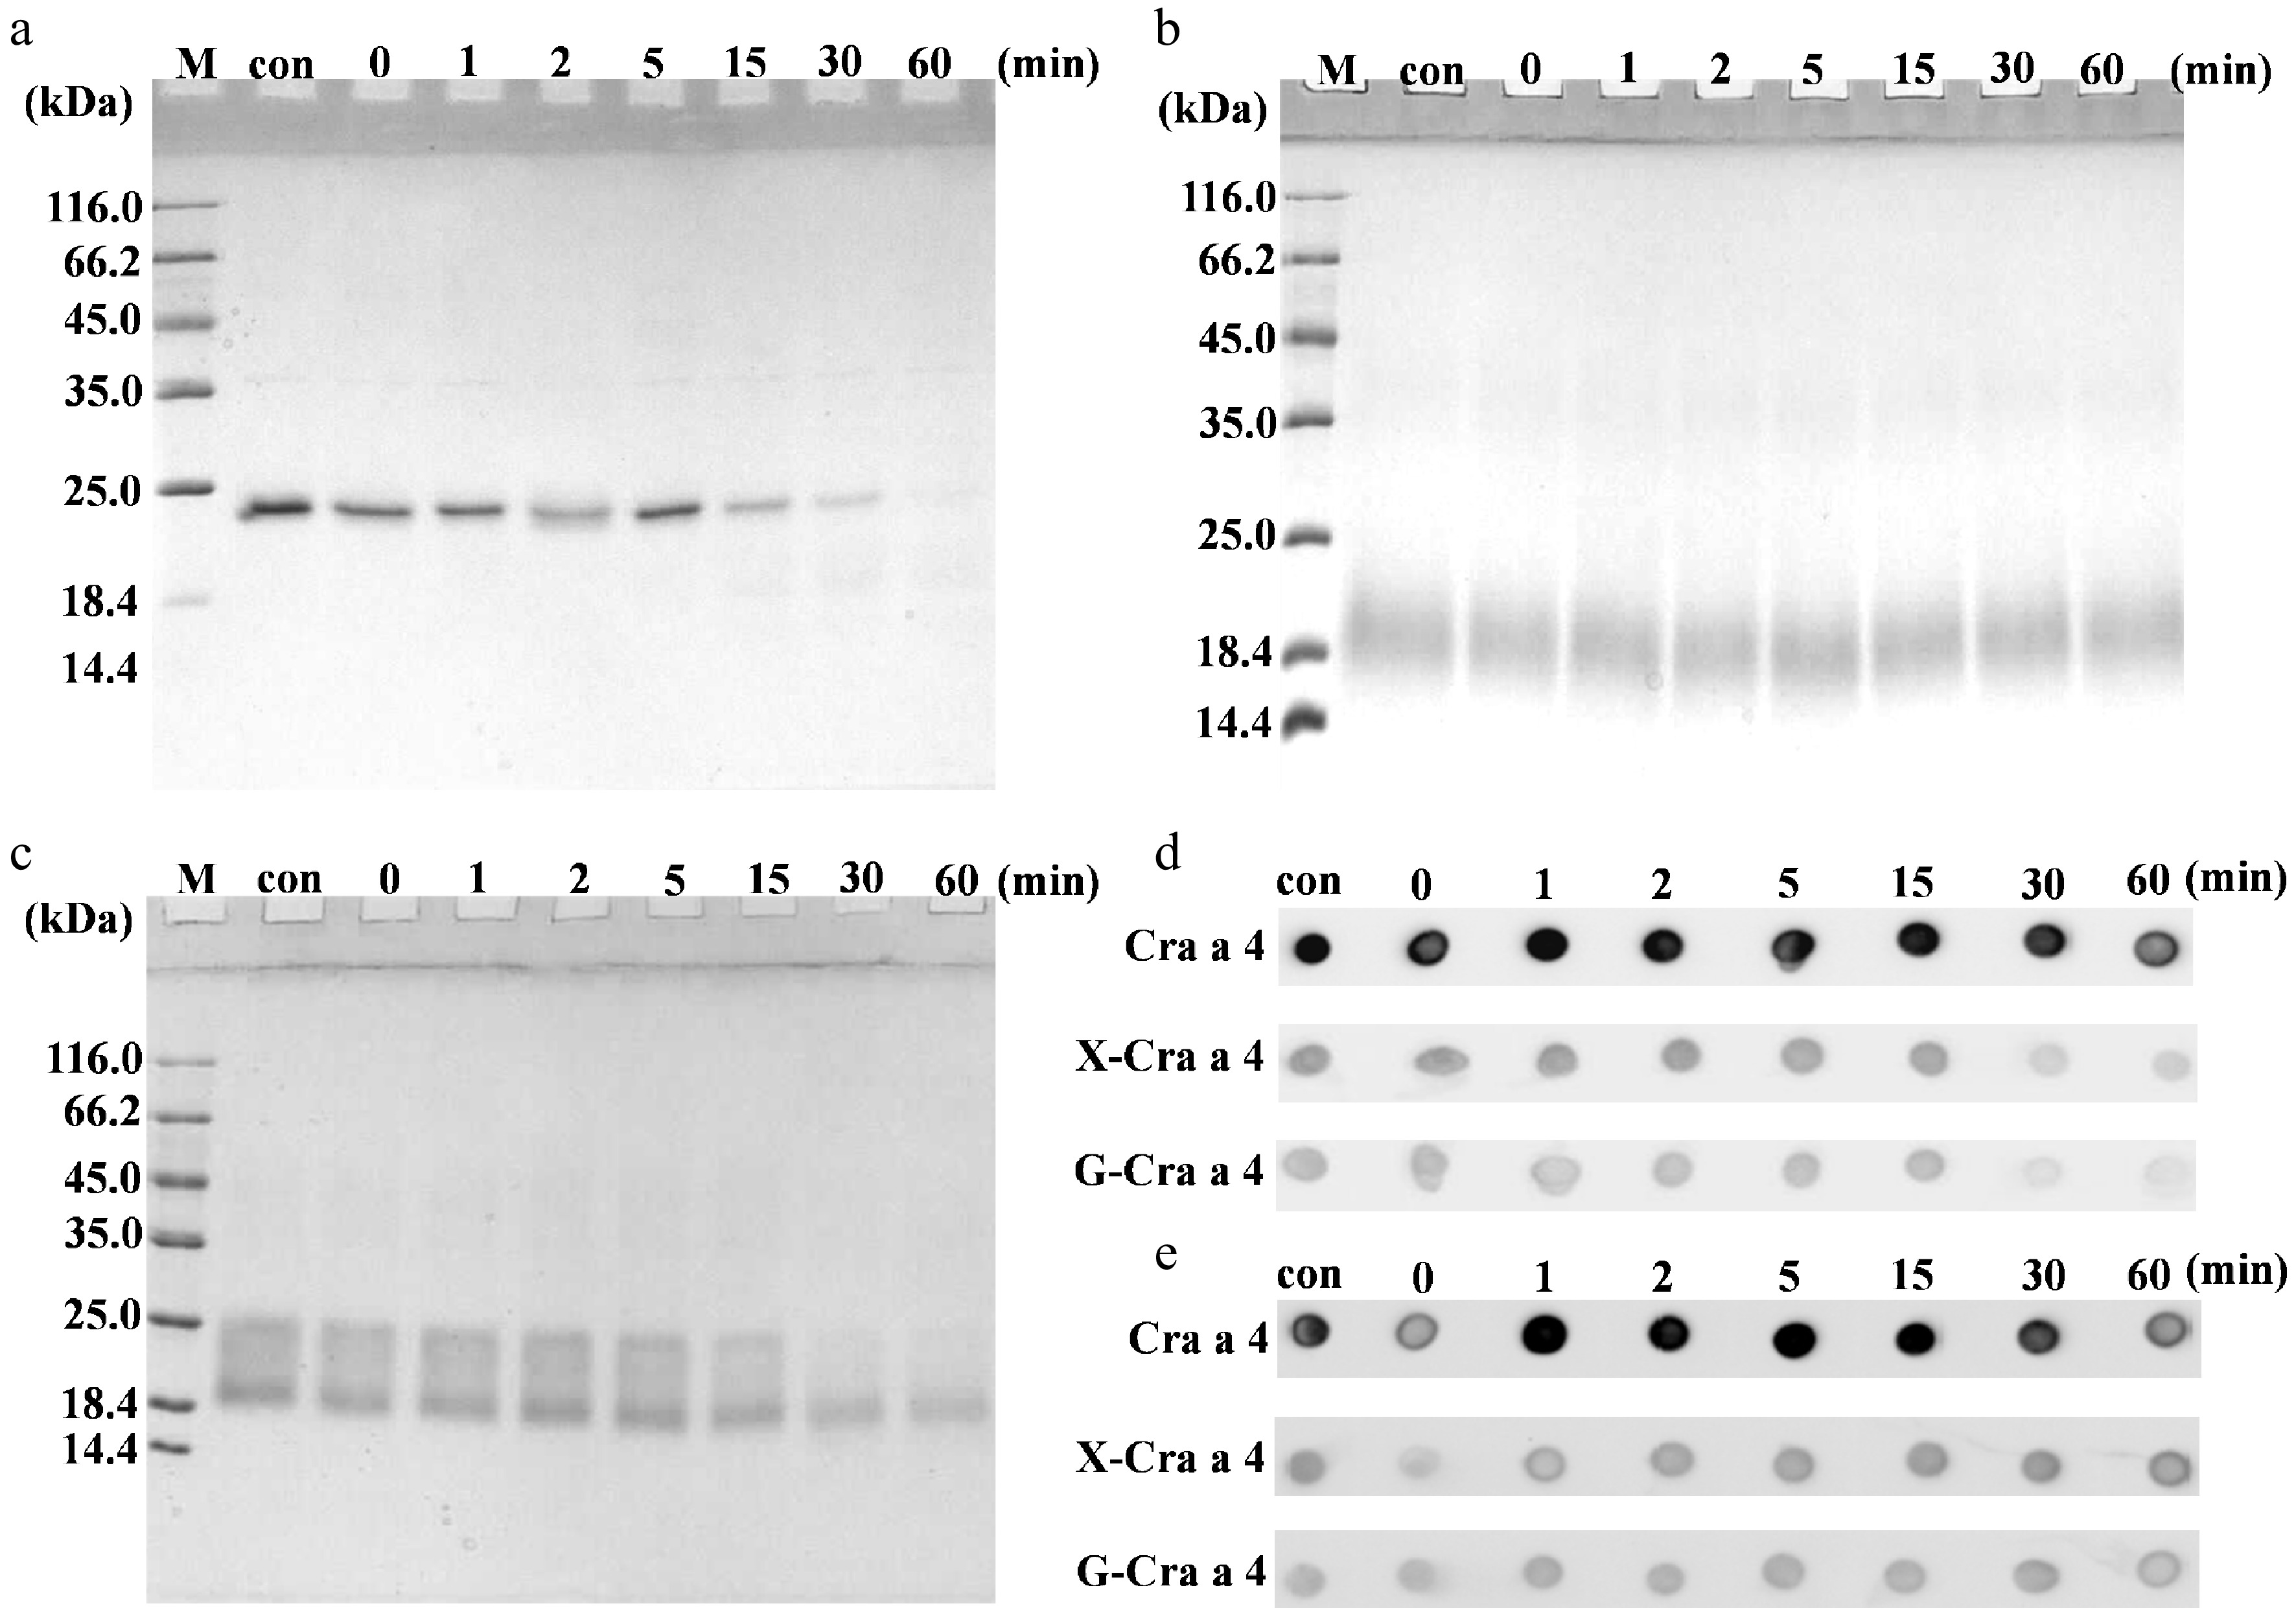
Figure 3.
Protein profiles of the glycoconjugates after MR during the simulated gastric digestion in vitro. (a) SDS-PAGE of the purified Cra a 4. (b) SDS-PAGE of the glycoconjugates between Cra a 4 and xylose. (c) SDS-PAGE of the glycoconjugates between Cra a 4 and glucose. (d) IgG-immunoblot assay of the digested samples by rabbit anti Cra a 4 pAb. (e) IgE-immunoblot assay of the digested samples by the specific sensitized sera pool. Lane M, protein marker. Lane con, the samples after processing and before pepsin digestion. The other numbers 0, 1, 2, 5, 15, 30 and 67 on the top of the lanes represents the different digestion times. X-Cra a 4, the glycoconjugates between Cra a 4 and xylose. G-Cra a 4, the glycoconjugates between Cra a 4 and glucose.
-
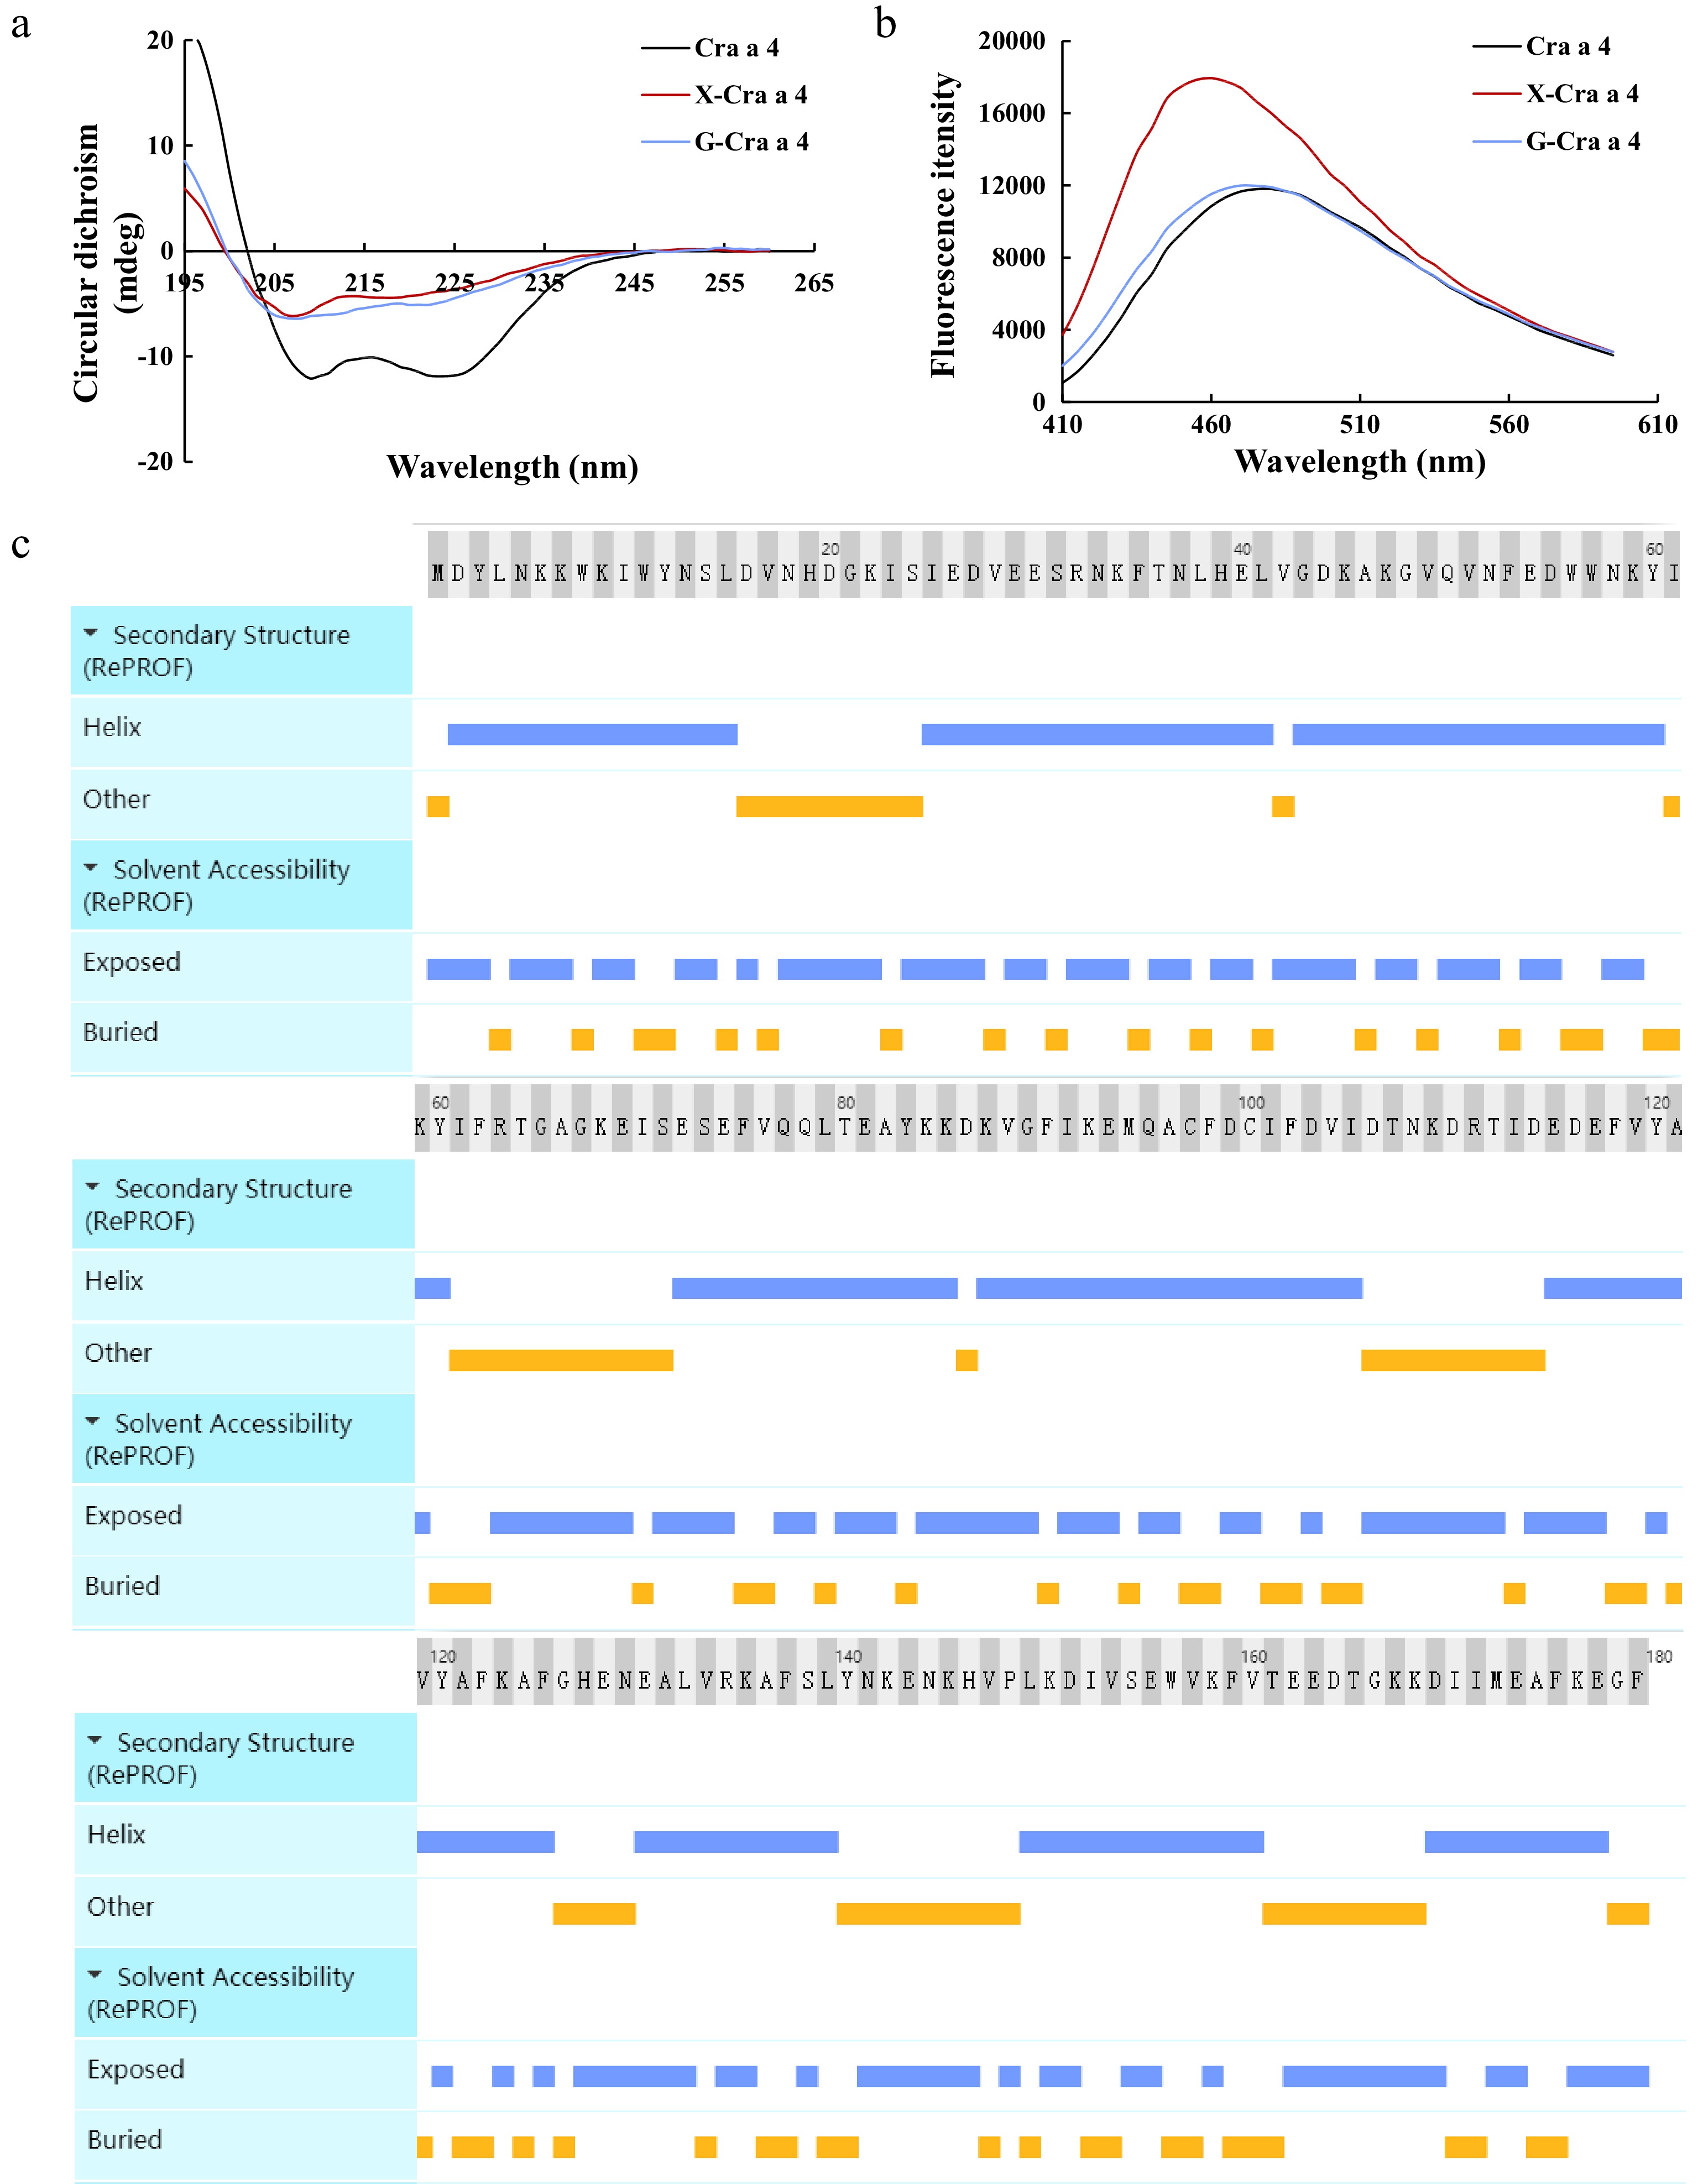
Figure 4.
Analysis of the structure in Cra a 4 and the glycoconjugates. (a) Secondary structural analysis of the glycoconjugates after MR. (b) Surface hydrophobicity analysis of the glycoconjugates after MR. (c) Secondary structure and solvent accessibility of Cra a 4 in silicon. X-Cra a 4, the glycoconjugates between Cra a 4 and xylose. G-Cra a 4, the glycoconjugates between Cra a 4 and glucose.
-

Figure 5.
Analysis of amino acid sequence in Cra a 4. (a) The distribution frequency of amino acids in Cra a 4. (b) Alignment of amino acid sequence of SCP in C. angulate and S. paramamosain. The linear epitopes of Cra a 4 are marked in blue; the heat/digested epitope regions of Scy p 4 are marked in red; the pepsin-cutting sites of Cra a 4 are marked by amino acid residues in blue.
-
Sera No. Age Sex OD450 a Symptoms NC-1 b 24 M 0.0608 − c NC-2 b 23 F 0.0611 − c S1 12 M 0.1082 Cough S2 8 F 0.1576 Anaphylactic rhinitis S3 9 F 0.1295 Atopic dermatitis S4 9 M 0.1004 Chronic urticaria S5 7 F 0.1051 Chronic urticaria S6 8 M 0.1062 Allergic purpura S7 6 F 0.1013 Bronchitis S8 10 M 0.1089 Acute tonsillitis S9 6 M 0.1040 Atopic dermatitis S10 4 M 0.1491 Urticaria S11 11 M 0.1067 Atopic dermatitis S12 3 F 0.1033 Atopic dermatitis a A serum with specific IgE≥0.10 is defined as positive.
b A nonallergic individual.
c Means no symptoms at the time of the experiment.
M, male; F, female.Table 1.
Specific IgE levels and symptoms of the oyster-sensitized individuals.
Figures
(5)
Tables
(1)