-
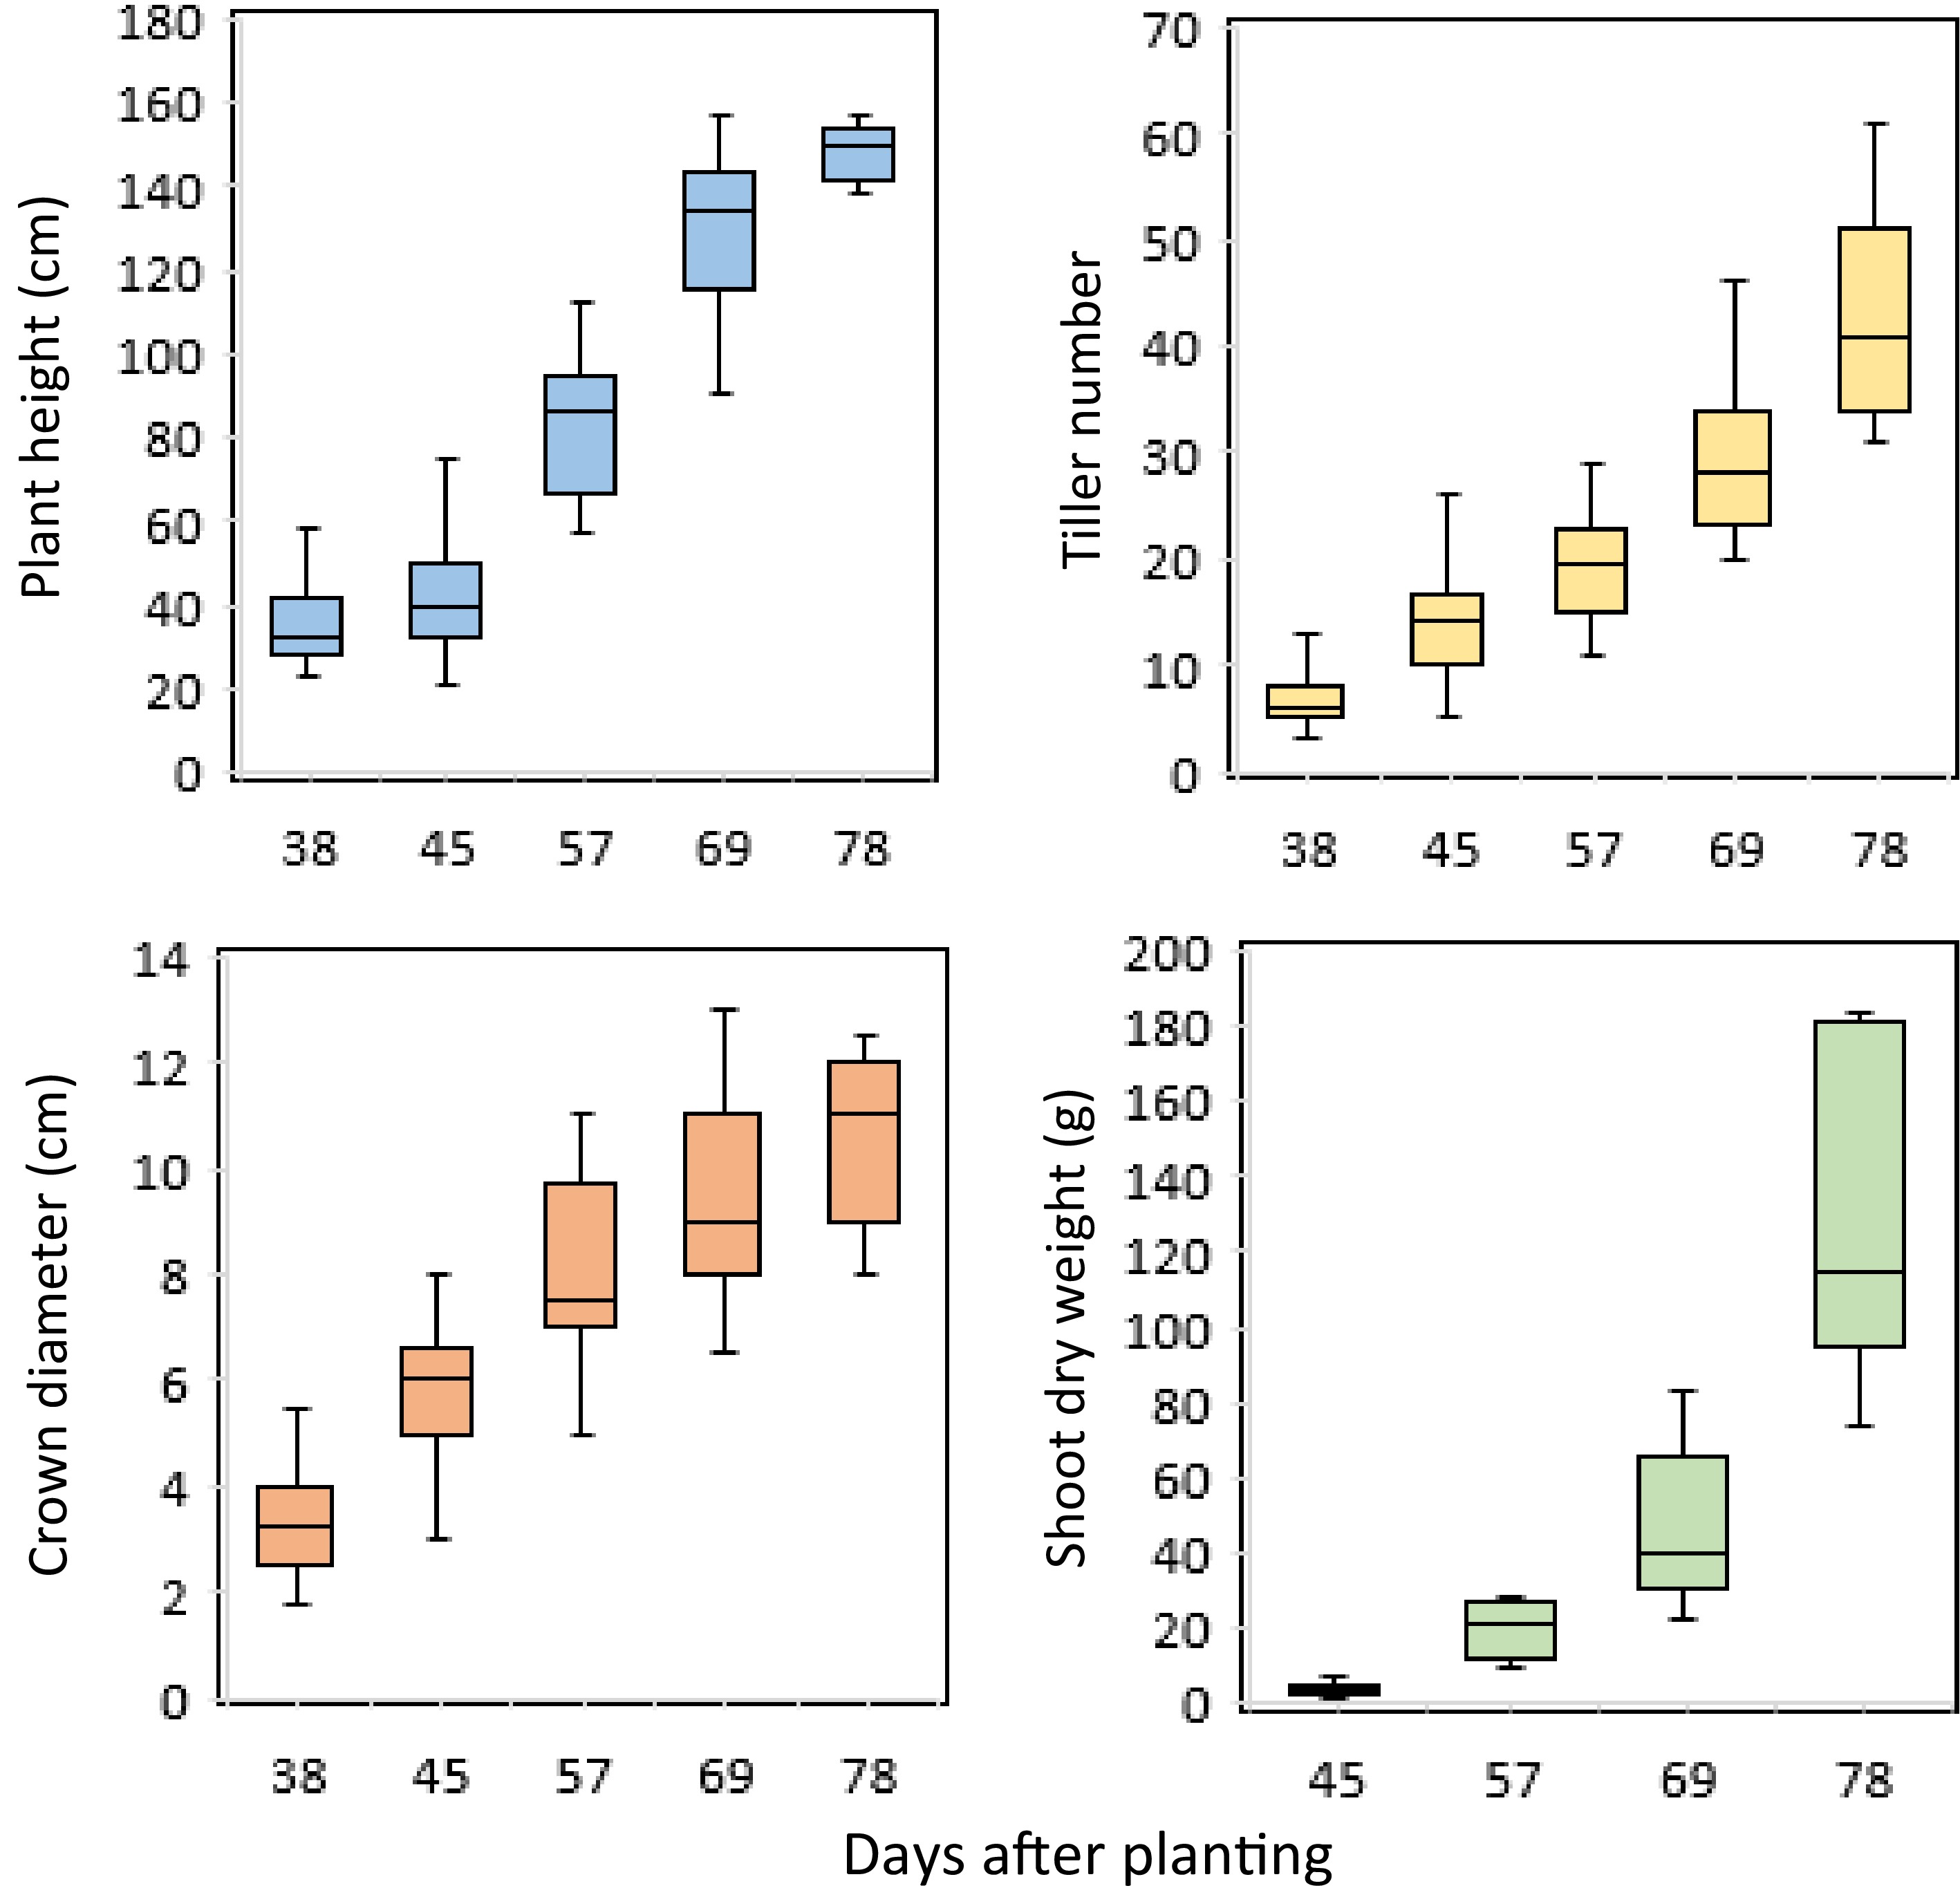
Figure 1.
Boxplots of the manually collected traits of switchgrass at different times of plant growth under controlled environment conditions.
-
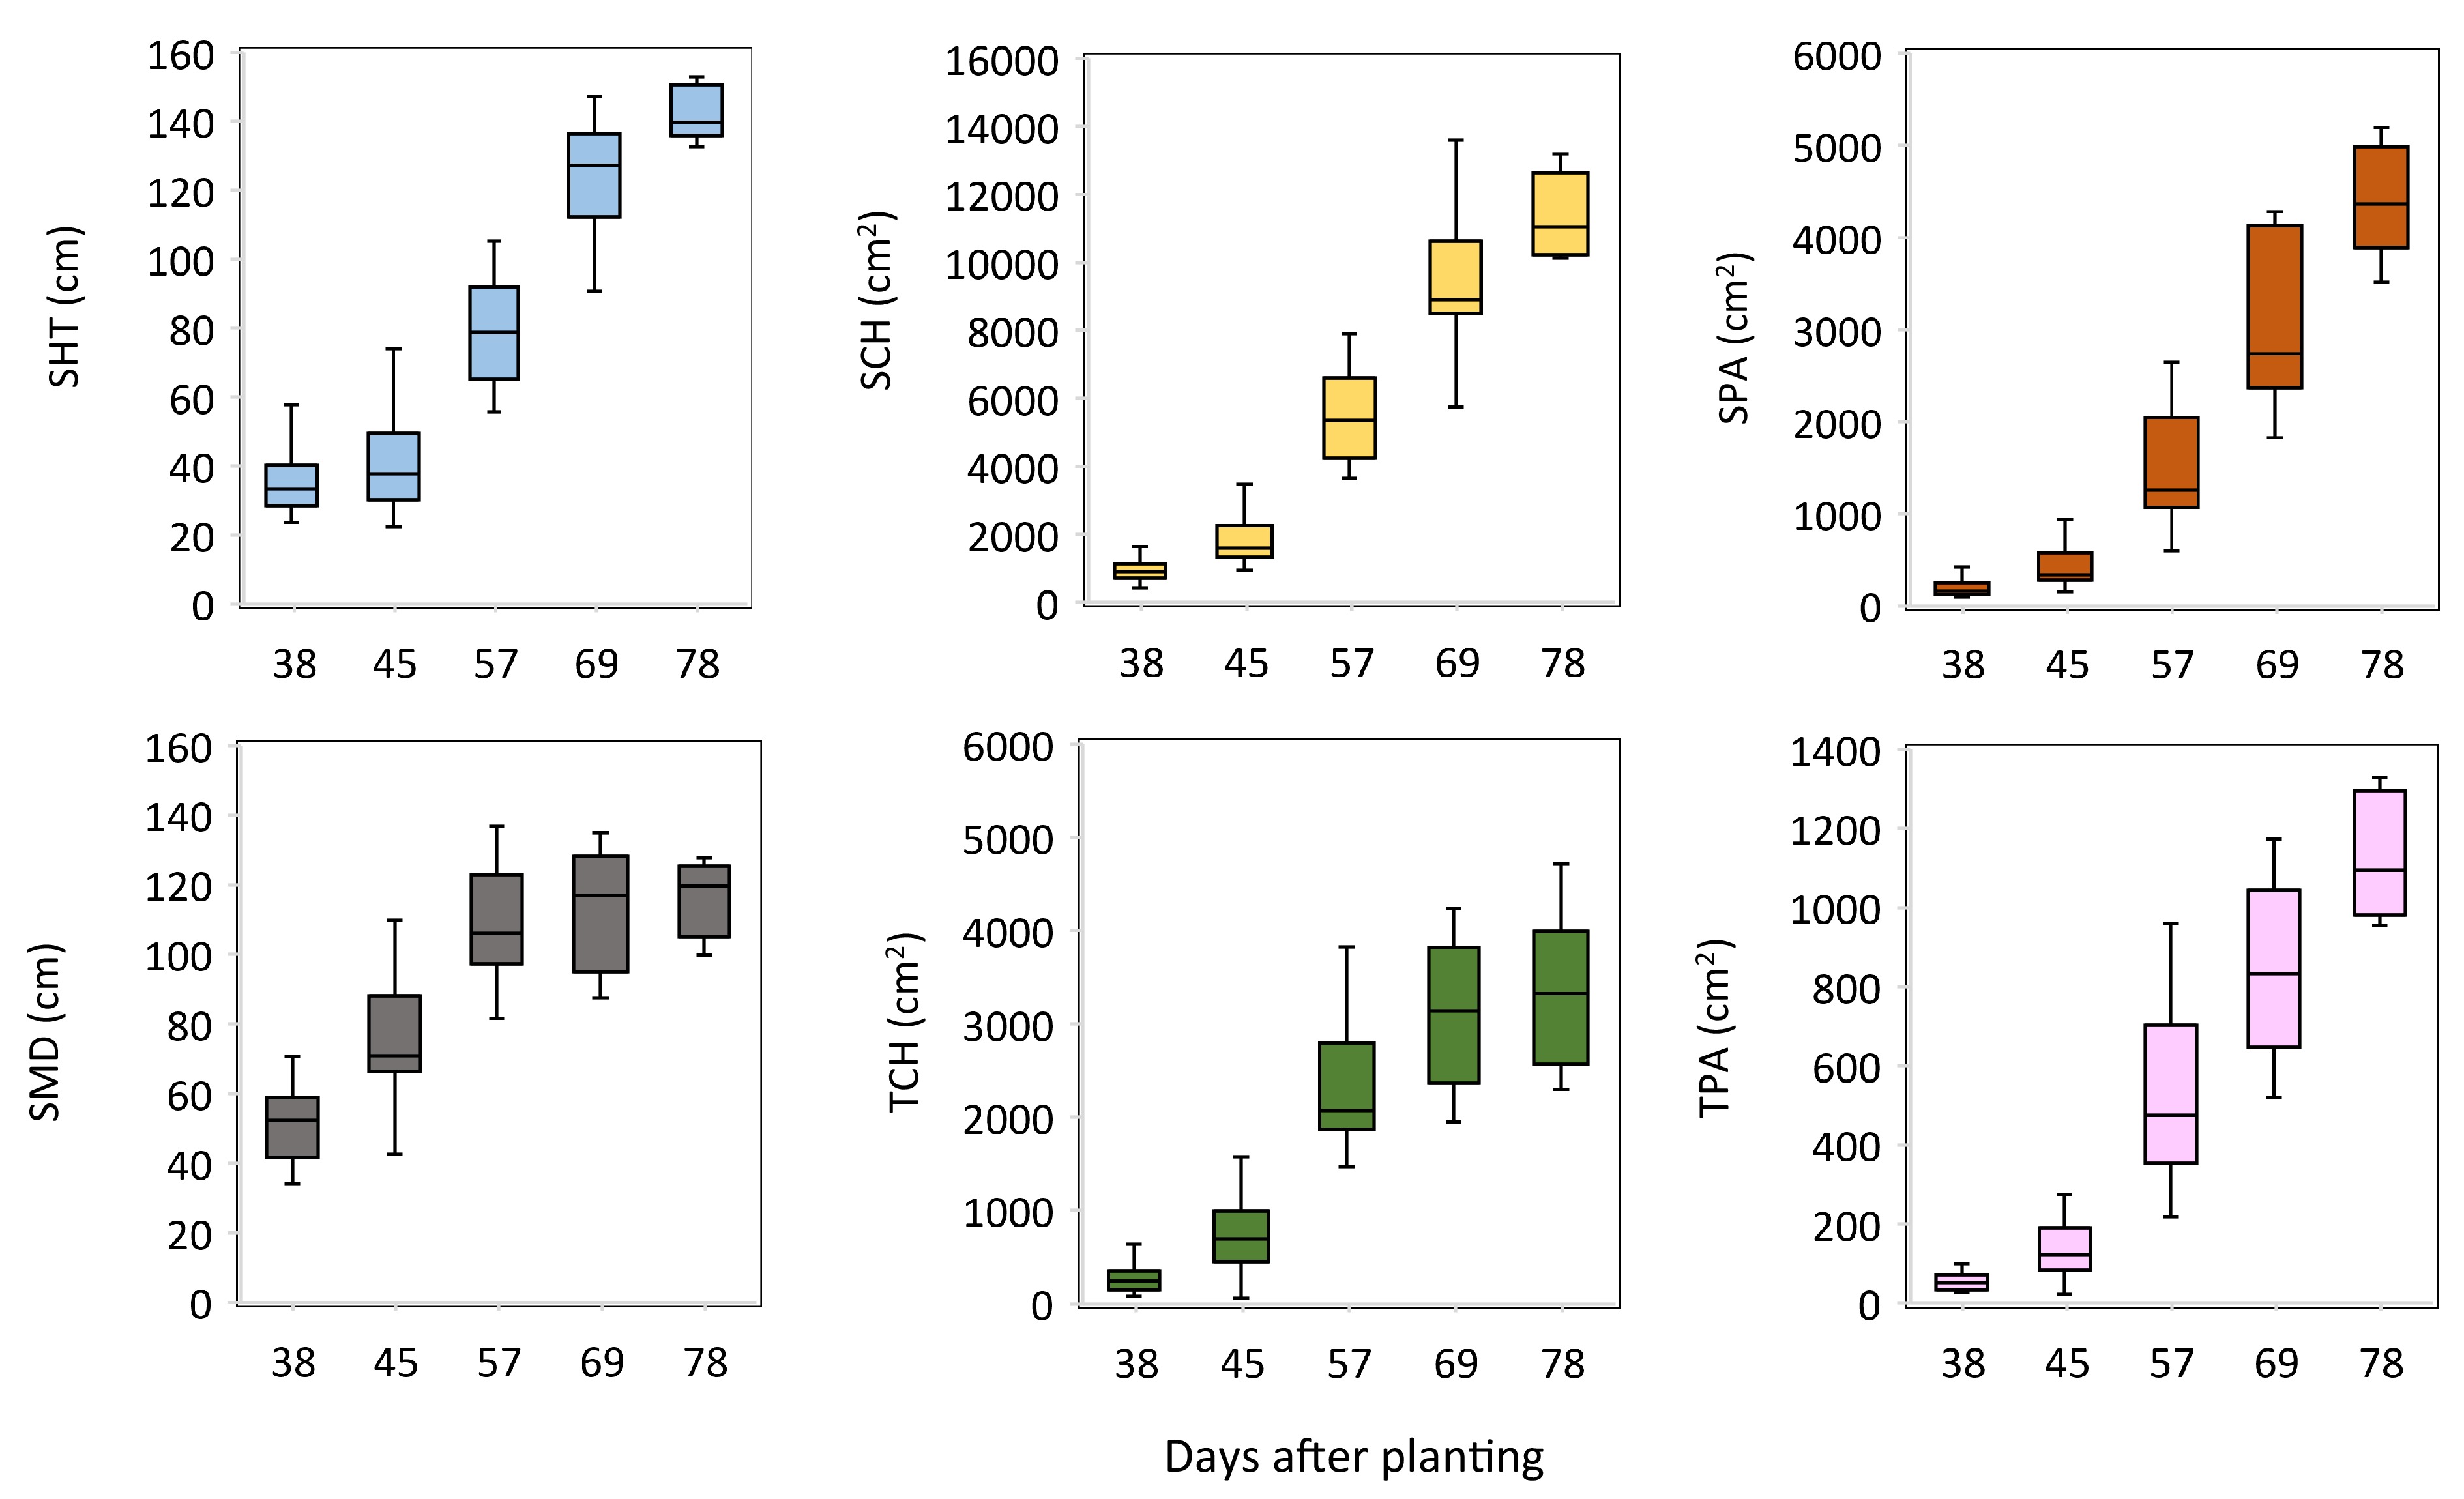
Figure 2.
Boxplots of the red-green-blue image-extracted measurements of switchgrass at different times of plant growth.
-
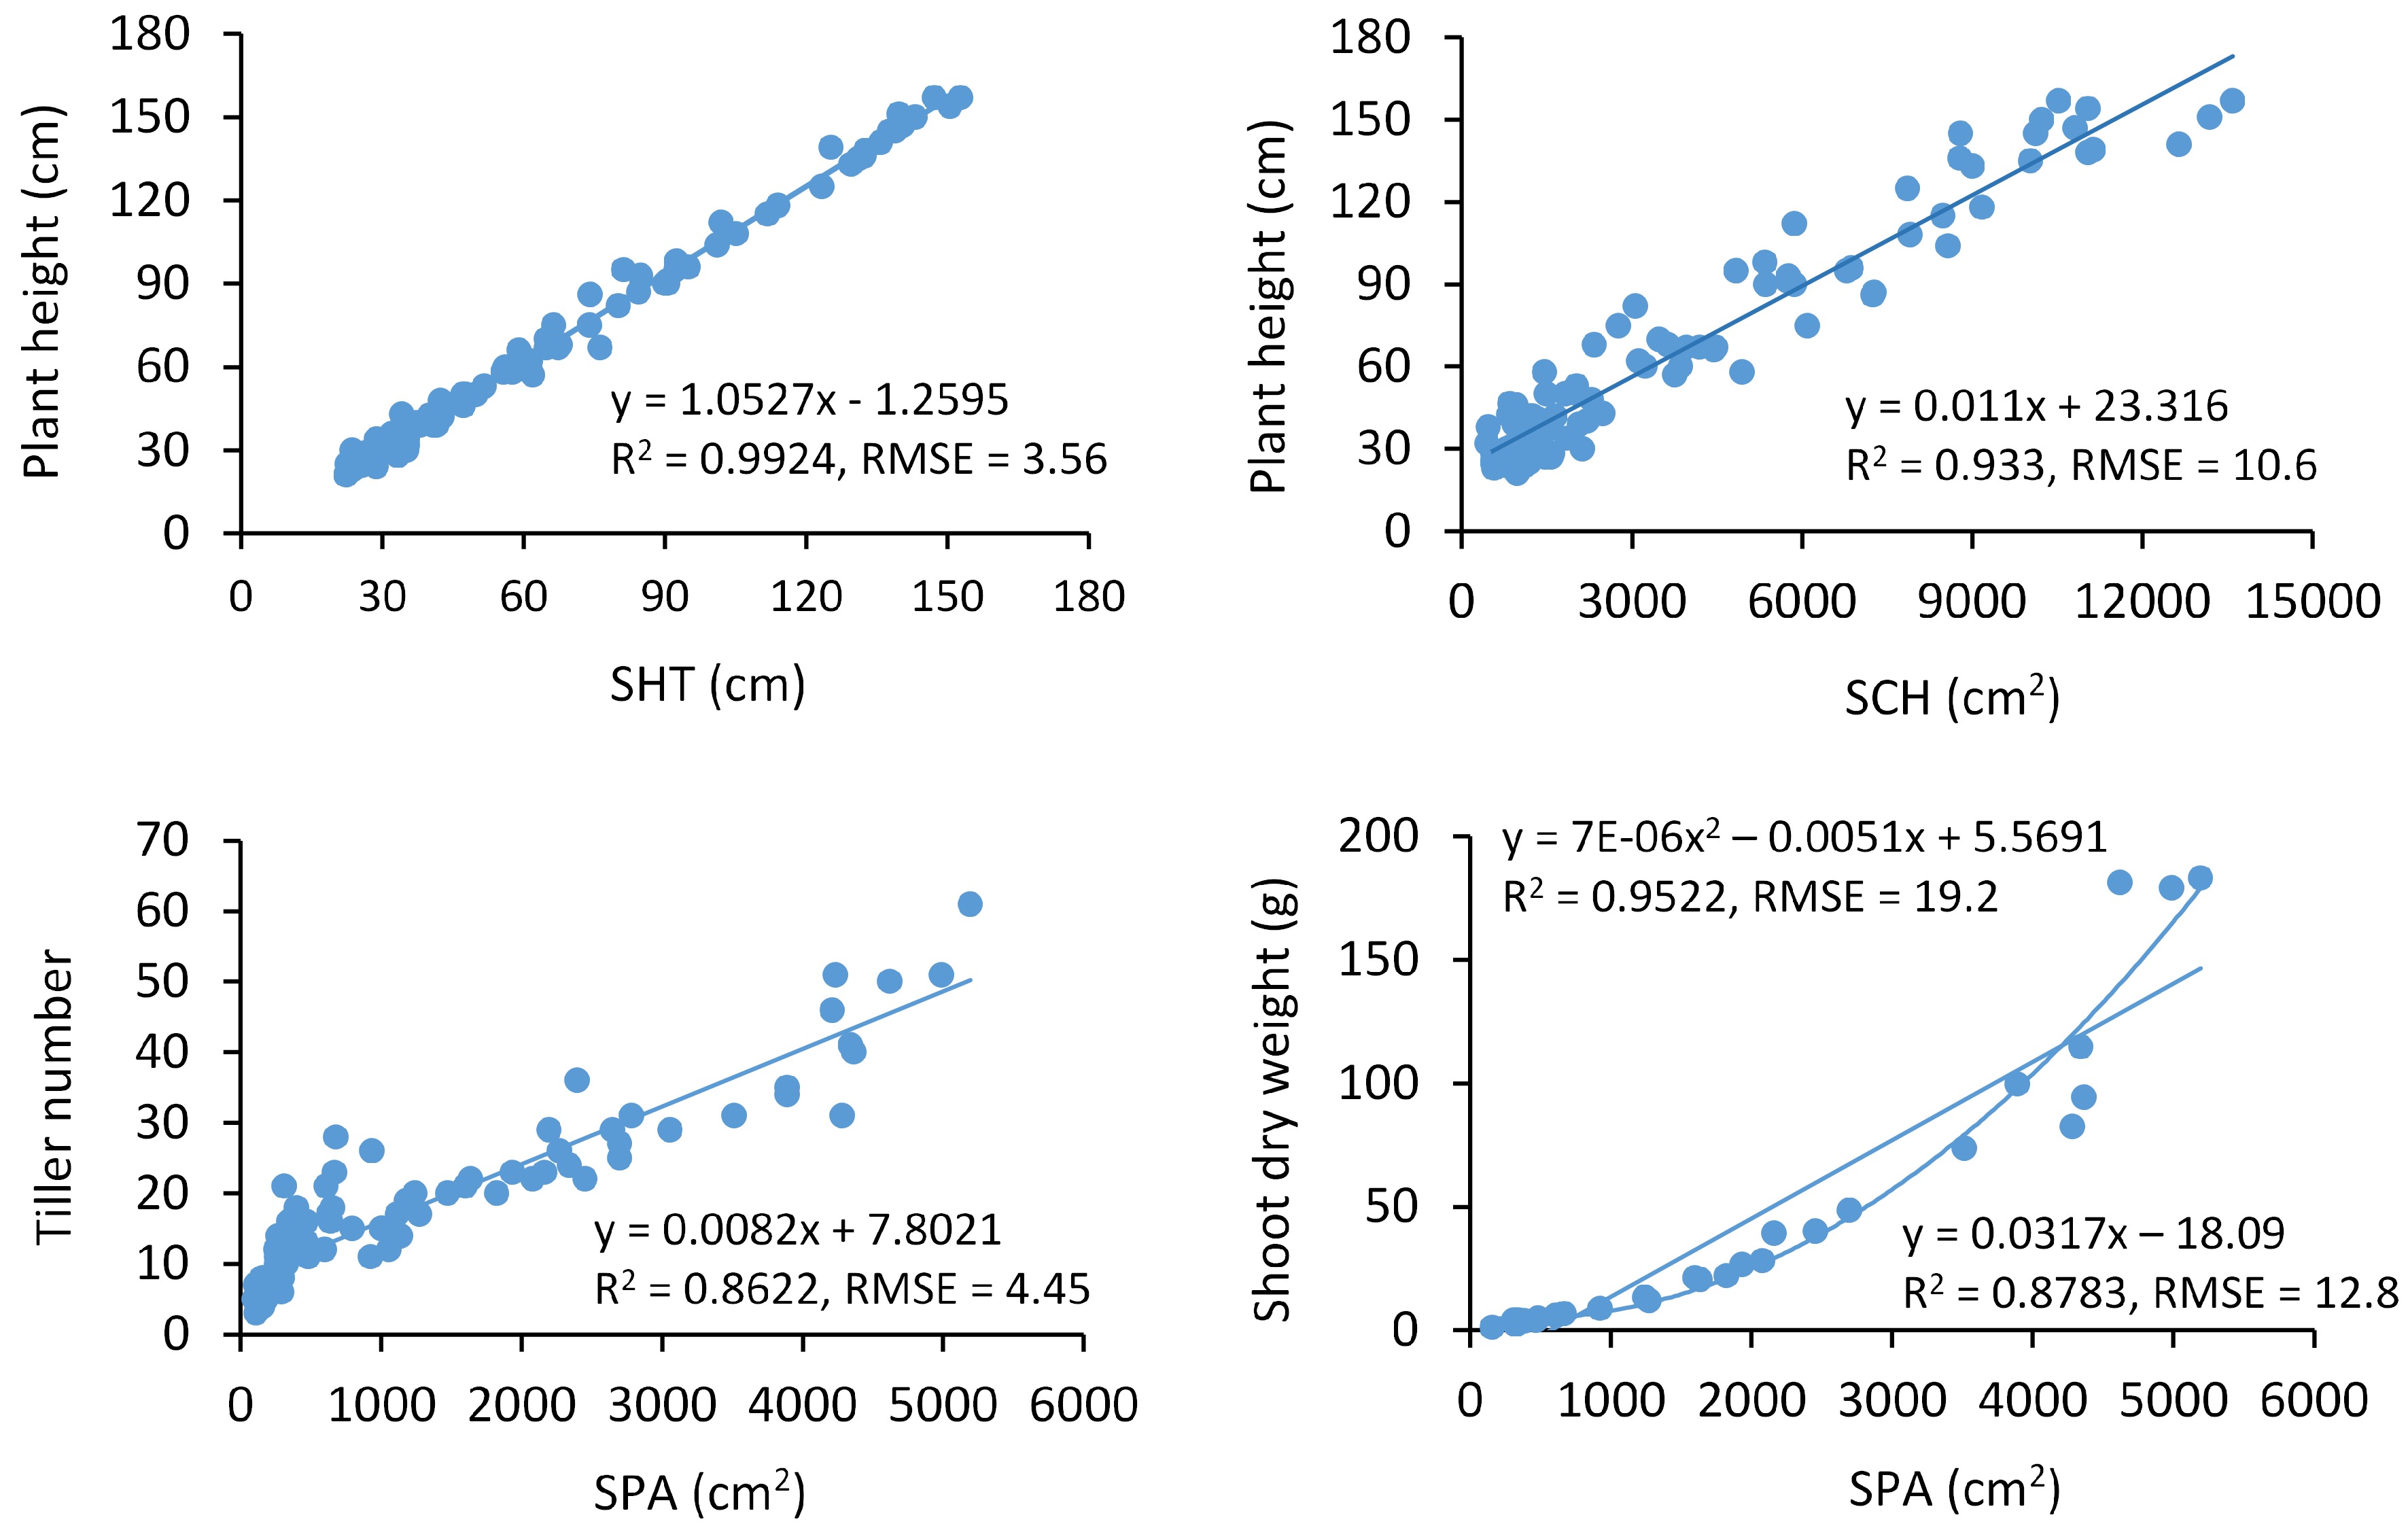
Figure 3.
The selected models to predict the manually collected traits using red-green-blue image-extracted measurements across sampling times. RMSE, the root mean square error. N = 97 for plant height and tiller number analysis. N = 31 for shoot dry weight.
-
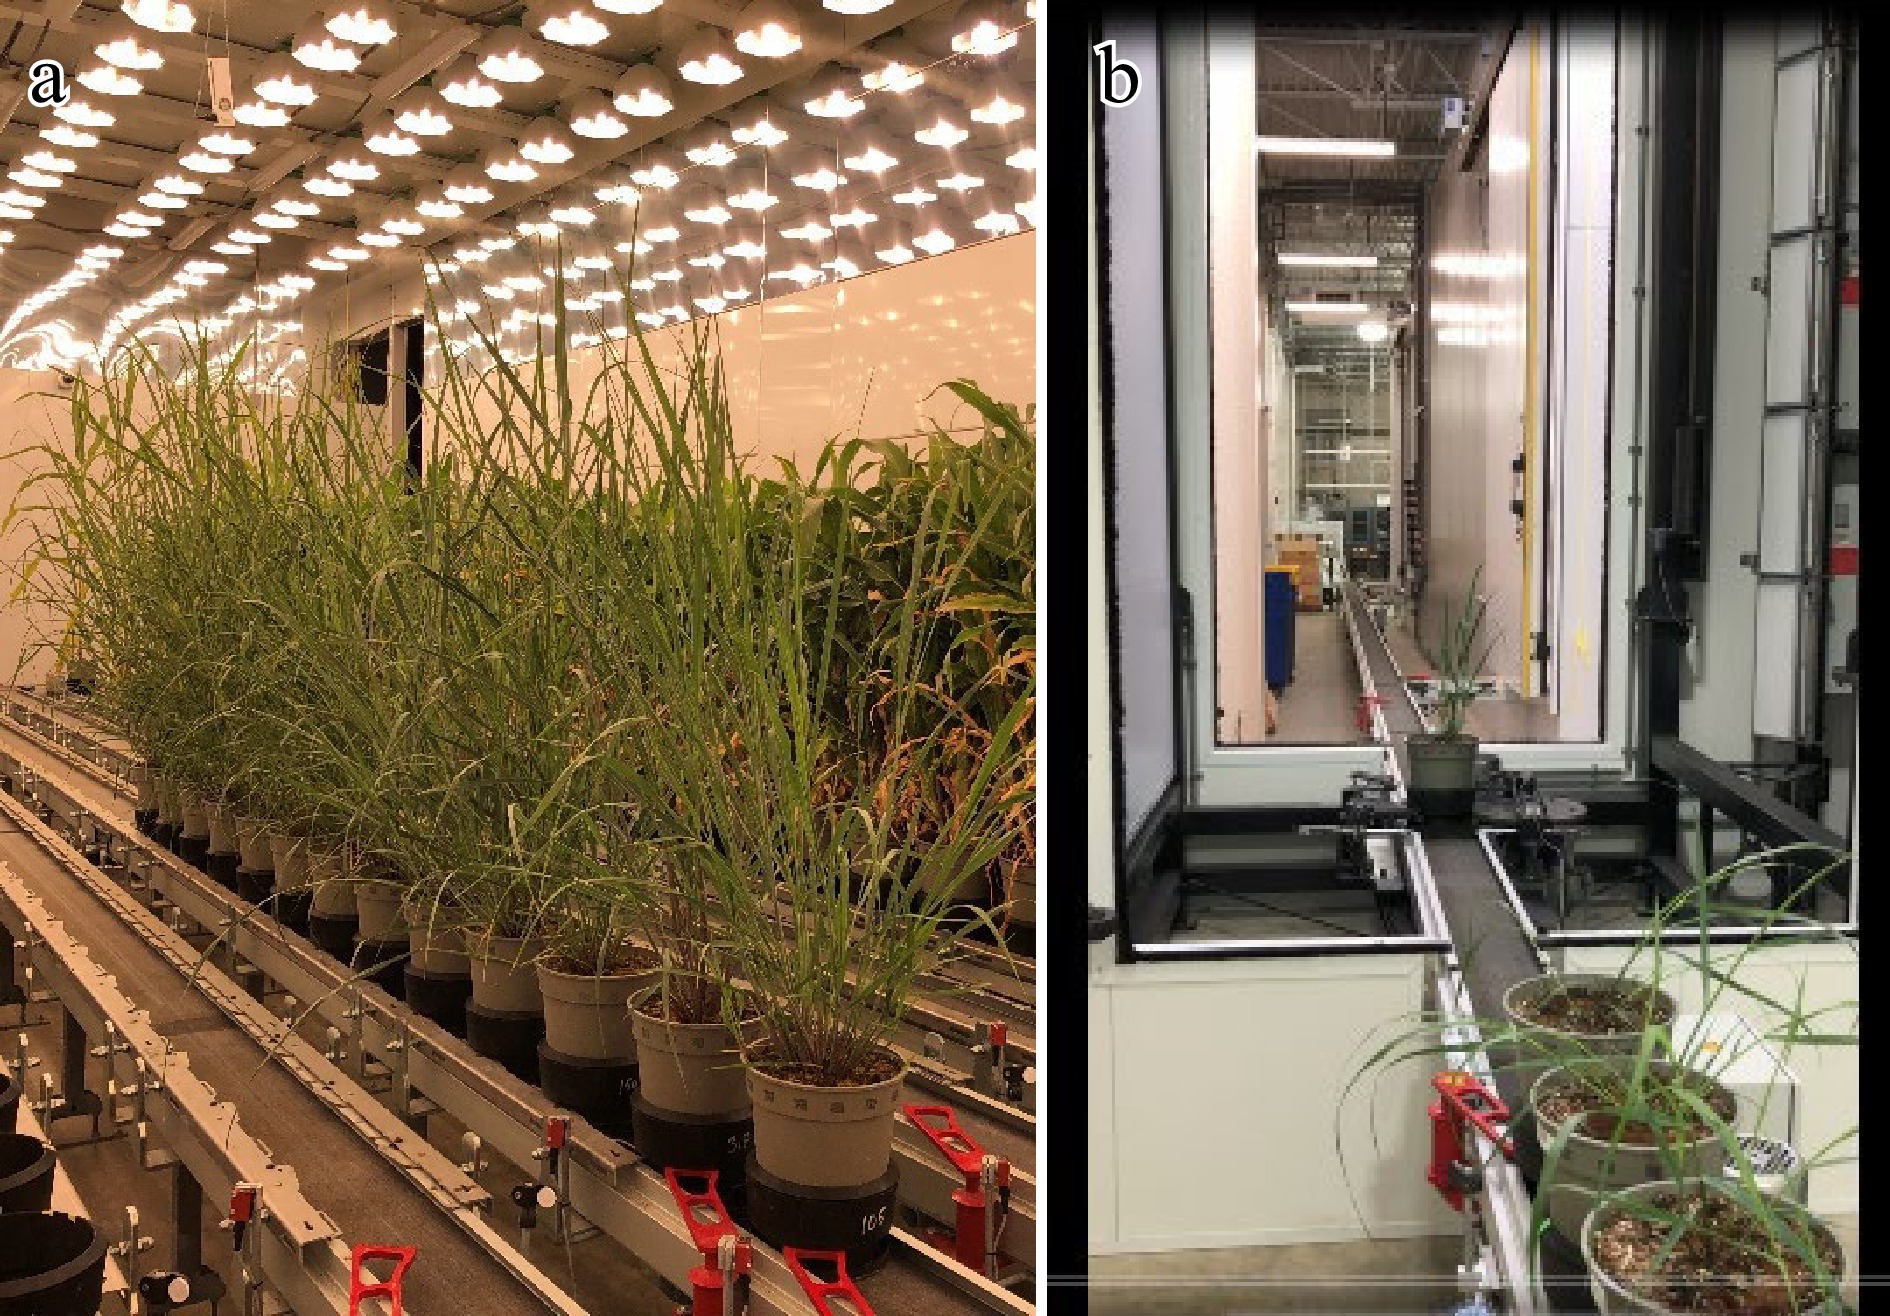
Figure 4.
(a) Growth chamber and (b) red-green-blue imaging tower in the Ag Alumni Seed Phenotyping Facility at Purdue University (IN, USA)
-
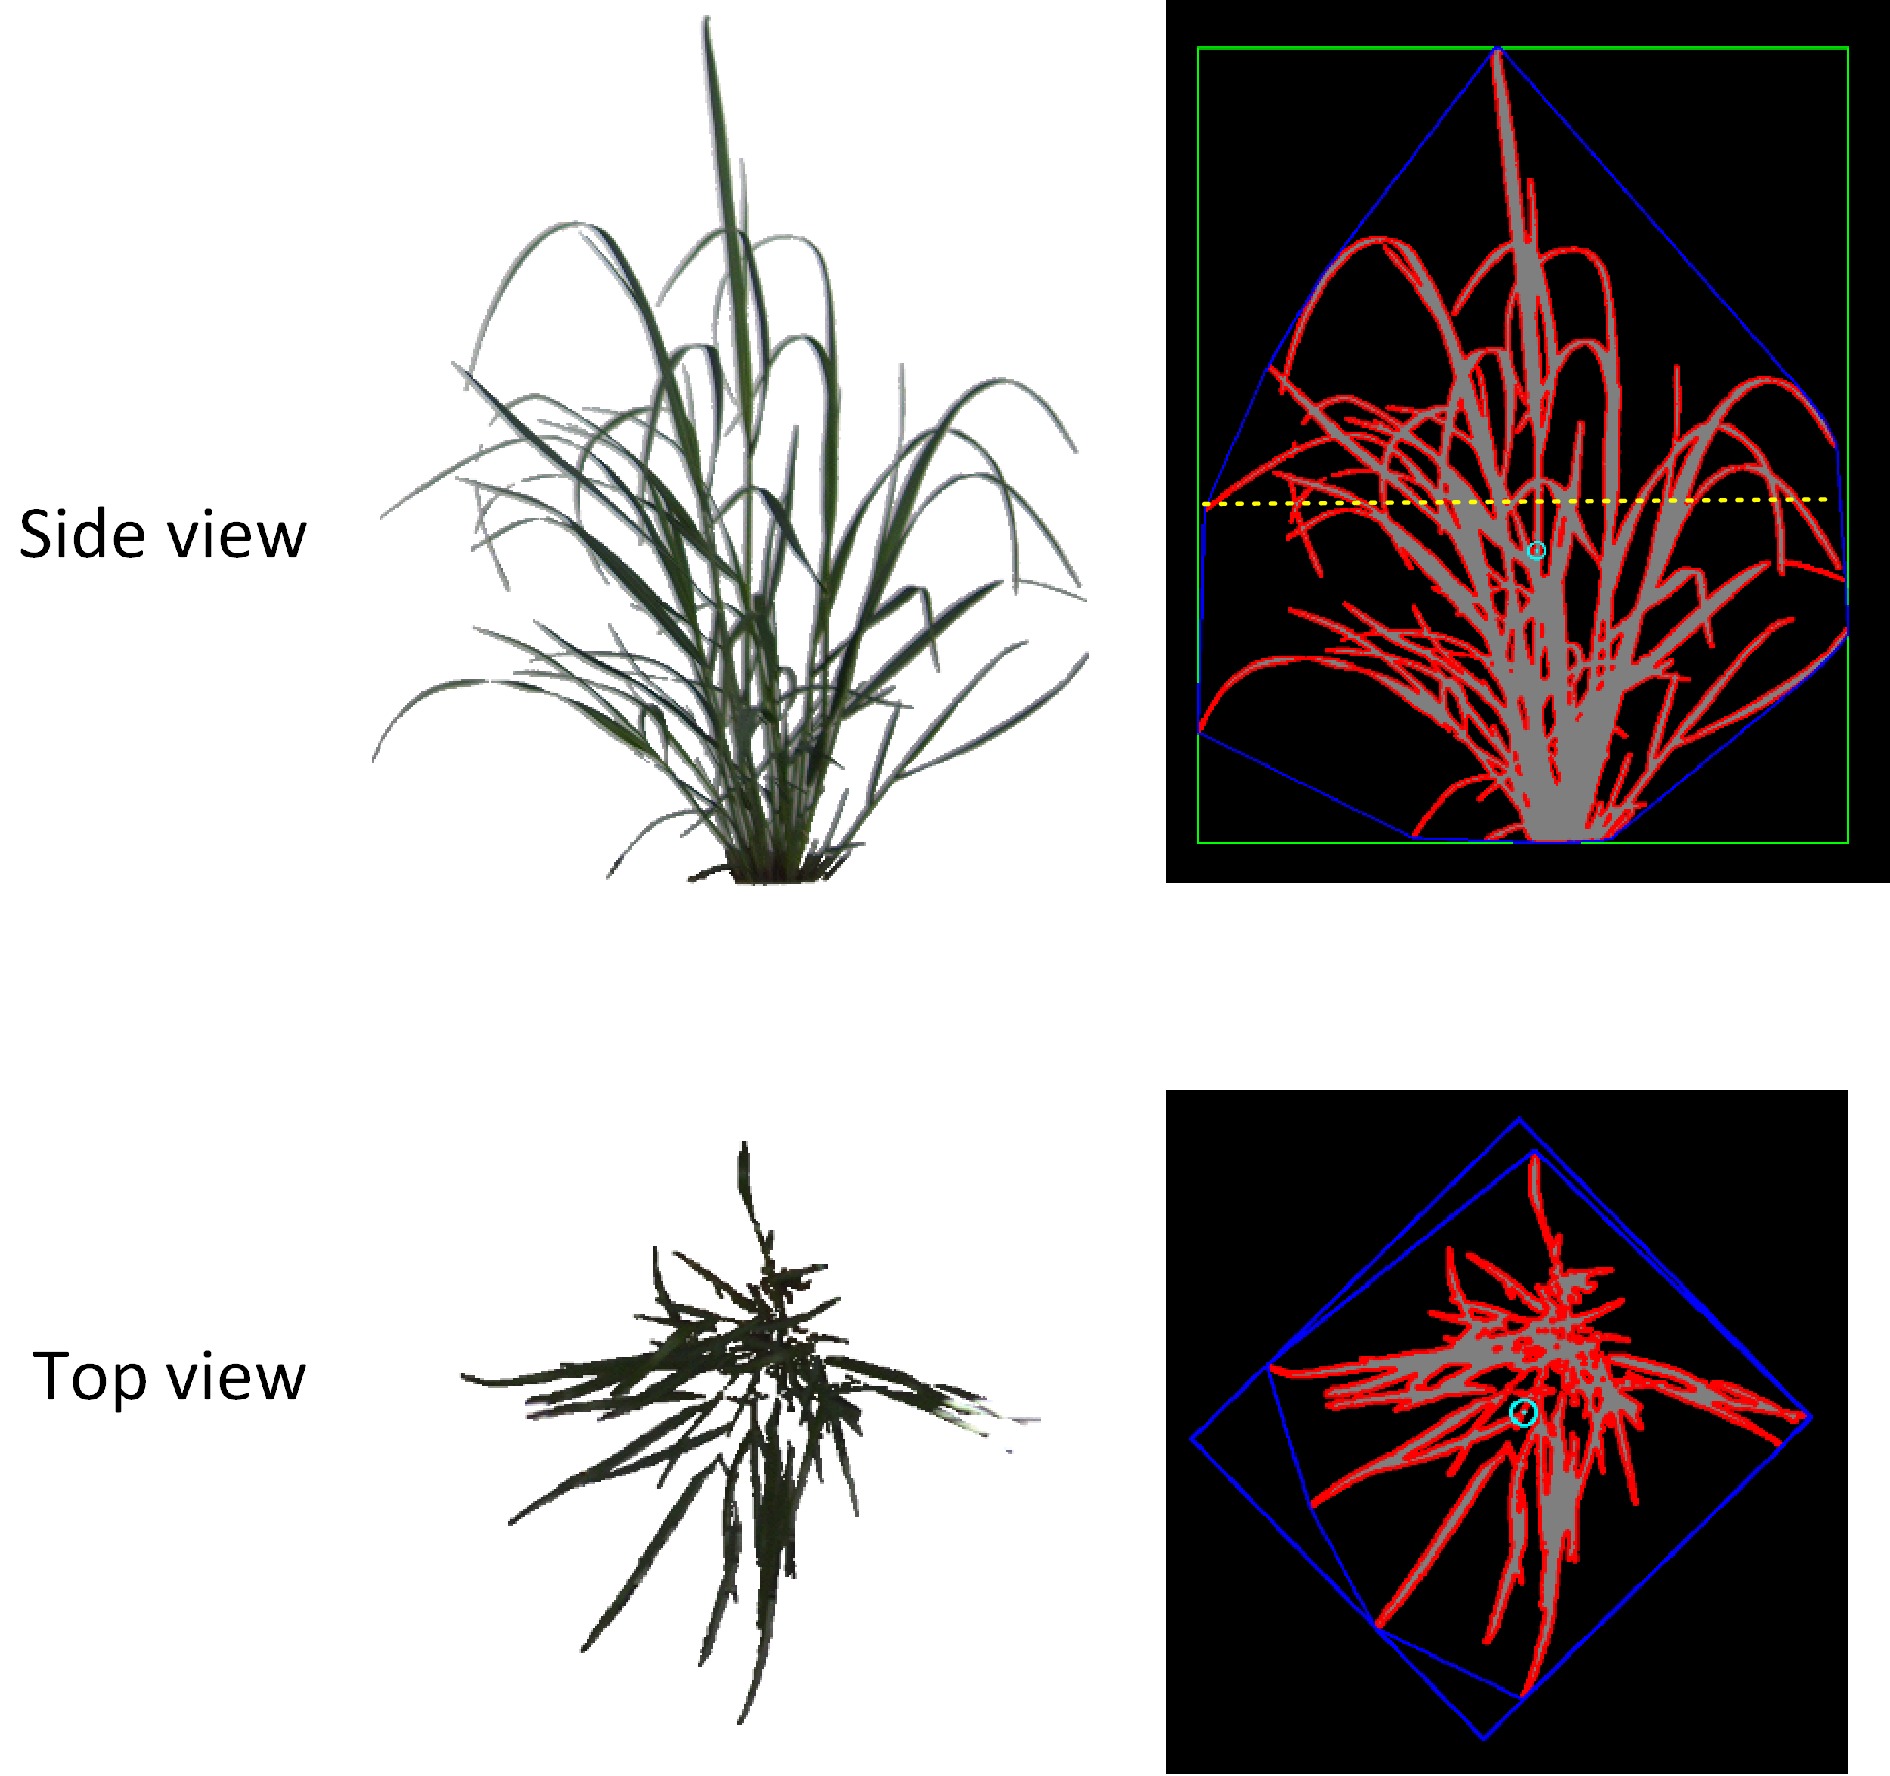
Figure 5.
Depiction of the extraction of red-green-blue image-based traits. For side-view, the length of the green box is an estimate of height (SHT), the yellow dash line is the maximum width of the plants, the area of the blue polygon is convex hull (SCH), and the red outline of the plant is the estimated side projected area (SPA). For top-view, the area inside the blue polygon is convex hull (TCH) and the red outline of the plant is the estimated side projected area (TPA).
-
Plant height Tiller number Crown diameter Shoot dry weight SCH 0.97*** 0.85*** 0.85*** 0.79*** SHT 0.996*** 0.84*** 0.79*** 0.82*** SPA 0.94*** 0.93*** 0.76*** 0.94*** SMD 0.74*** 0.67*** 0.83*** 0.37* TCH 0.85*** 0.77*** 0.82*** 0.55** TPA 0.91*** 0.91*** 0.79*** 0.86*** N = 97 for correlation analysis between plant height, tiller number and crown diameter with all images based on measurements; N = 31 for correlation analysis between shoot dry weight and image-based measurements. *, **, *** represent significance at P < 0.05, 0.01, and 0.001, respectively. Table 1.
Pearson correlation coefficients among manually collected traits and red-green-blue image-extracted measurements in switchgrass across sampling times.
-
Trait Abbreviation Definition Side-view height SHT Length from the lowest to the highest point of the plant Side-view convex hull SCH Smallest polygon that contains all plant materials from the side Side-view projected area SPA Total side-view projected area obtained by outlining all plant materials Side-view maximum width SMD Maximum width of the plants from side to side Top-view convex hull TCH Smallest polygon that contains all plant materials from the top Top-view projected area TPA Total top-view projected area obtained by outlining all plant materials Table 2.
Definition and abbreviation of each image-based high-throughput trait.
Figures
(5)
Tables
(2)