


-
Switchgrass (Panicum virgatum L.) is one of the primary grass species used as a bioenergy crop to support conversion of cellulosic biomass to energy[1]. Although switchgrass has the potential for high biomass yield, the sustainable biomass production of this species can be the principal limitation, particularly in the northern United States where growing seasons are short[2]. While biomass yield is a key target for most breeding programs in switchgrass, assessment of yield-related traits such as plant height, tiller number, and stem thickness can be useful in indirect selection for biomass yield[3,4]. To develop a rational strategy for developing switchgrass with improved biomass yield, it would be beneficial to gain a better understanding of biomass related traits. This requires yield component traits of switchgrass plants to be timely and accurately evaluated when creating new germplasm in comparison with existing cultivars.
Frequent monitoring of yield component traits through traditional phenotyping methods are time-consuming, laborious, and destructive to plants, especially while managing multiple populations consisting of hundreds of individual plants. With the development of high-throughput phenotyping (HTP) platforms, sensor-based sophisticated phenotyping approaches have greatly improved the capacity for rapid and accurate estimation of phenotypic traits including plant growth and architecture or biomass of single plants or populations without destroying plants. To date, various sensors and digital images have been used for HTP[5,6]. Of them, red-green-blue (RGB) imaging is one of the most widely applied technologies for quantifying phenotypic traits of interest. For example, RGB image-extracted measurements have been used to predict biomass yield-related traits in grain crops grown in controlled environments or in the field, including plant height[7−11], tiller number[7, 12], leaf or shoot area[10,13,14], stem diameter[8], and biomass[9, 15, 16], as well as ground cover and persistence of perennial ryegrass (Lolium perenne L.)[17]. The use of RGB images can also distinguish growth patterns in grass-legume mixed pasture systems in response to nutrient application[18]. All previous research works have demonstrated promising results when using HTP for crop improvement and production.
HTP provides a feasible and efficient way for continuous trait analysis for plant species that are harvested as biomass; however, such technology has not been extensively studied in perennial tall grass species including switchgrass. Since HTP is the utilization of engineering, algorithmic and computational techniques for acquiring data, a reliable model needs to be developed to ensure the accuracy of HTP-based predictions. In this study, RGB images were taken to capture plant growth changes and biomass yield development in switchgrass grown in a well-controlled environment. We attempted to reveal the relationship between RGB image-extracted measurements and manually measured traits in switchgrass to demonstrate whether we can leverage the image-based traits in quantifying the growth and development of switchgrass, thereby significantly reducing time and labor inputs in phenotypic data collection. The correlation results and prediction model will help design for future experiments, especially for HTP of complex traits of switchgrass germplasm. Knowledge generated from this study will aid crop management and breeding programs in developing varieties of switchgrass and other perennial grass species.
-
Plant height, tiller number, and crown diameter were measured five times and shoot dry weight was measured four times during the experiment. Across sampling times, substantial changes of these traits were observed for individual pots, ranging from 21.0 to 157.0 cm for plant height, 3 to 61 for tiller number, 1.8 to 13.0 cm for crown diameter, and 1.1 to 183.1 g for shoot dry weight (Fig. 1). Moreover, all traits were significantly correlated with each other, with the highest correlation found between tiller number and shoot dry weight (r = 0.96***), followed by tiller number and plant height (r = 0.84***), shoot dry weight and plant height (r = 0.82***), shoot dry weight and crown diameter (r = 0.80***), and tiller number with crown diameter (r = 0.75***) (Supplemental Table S1).
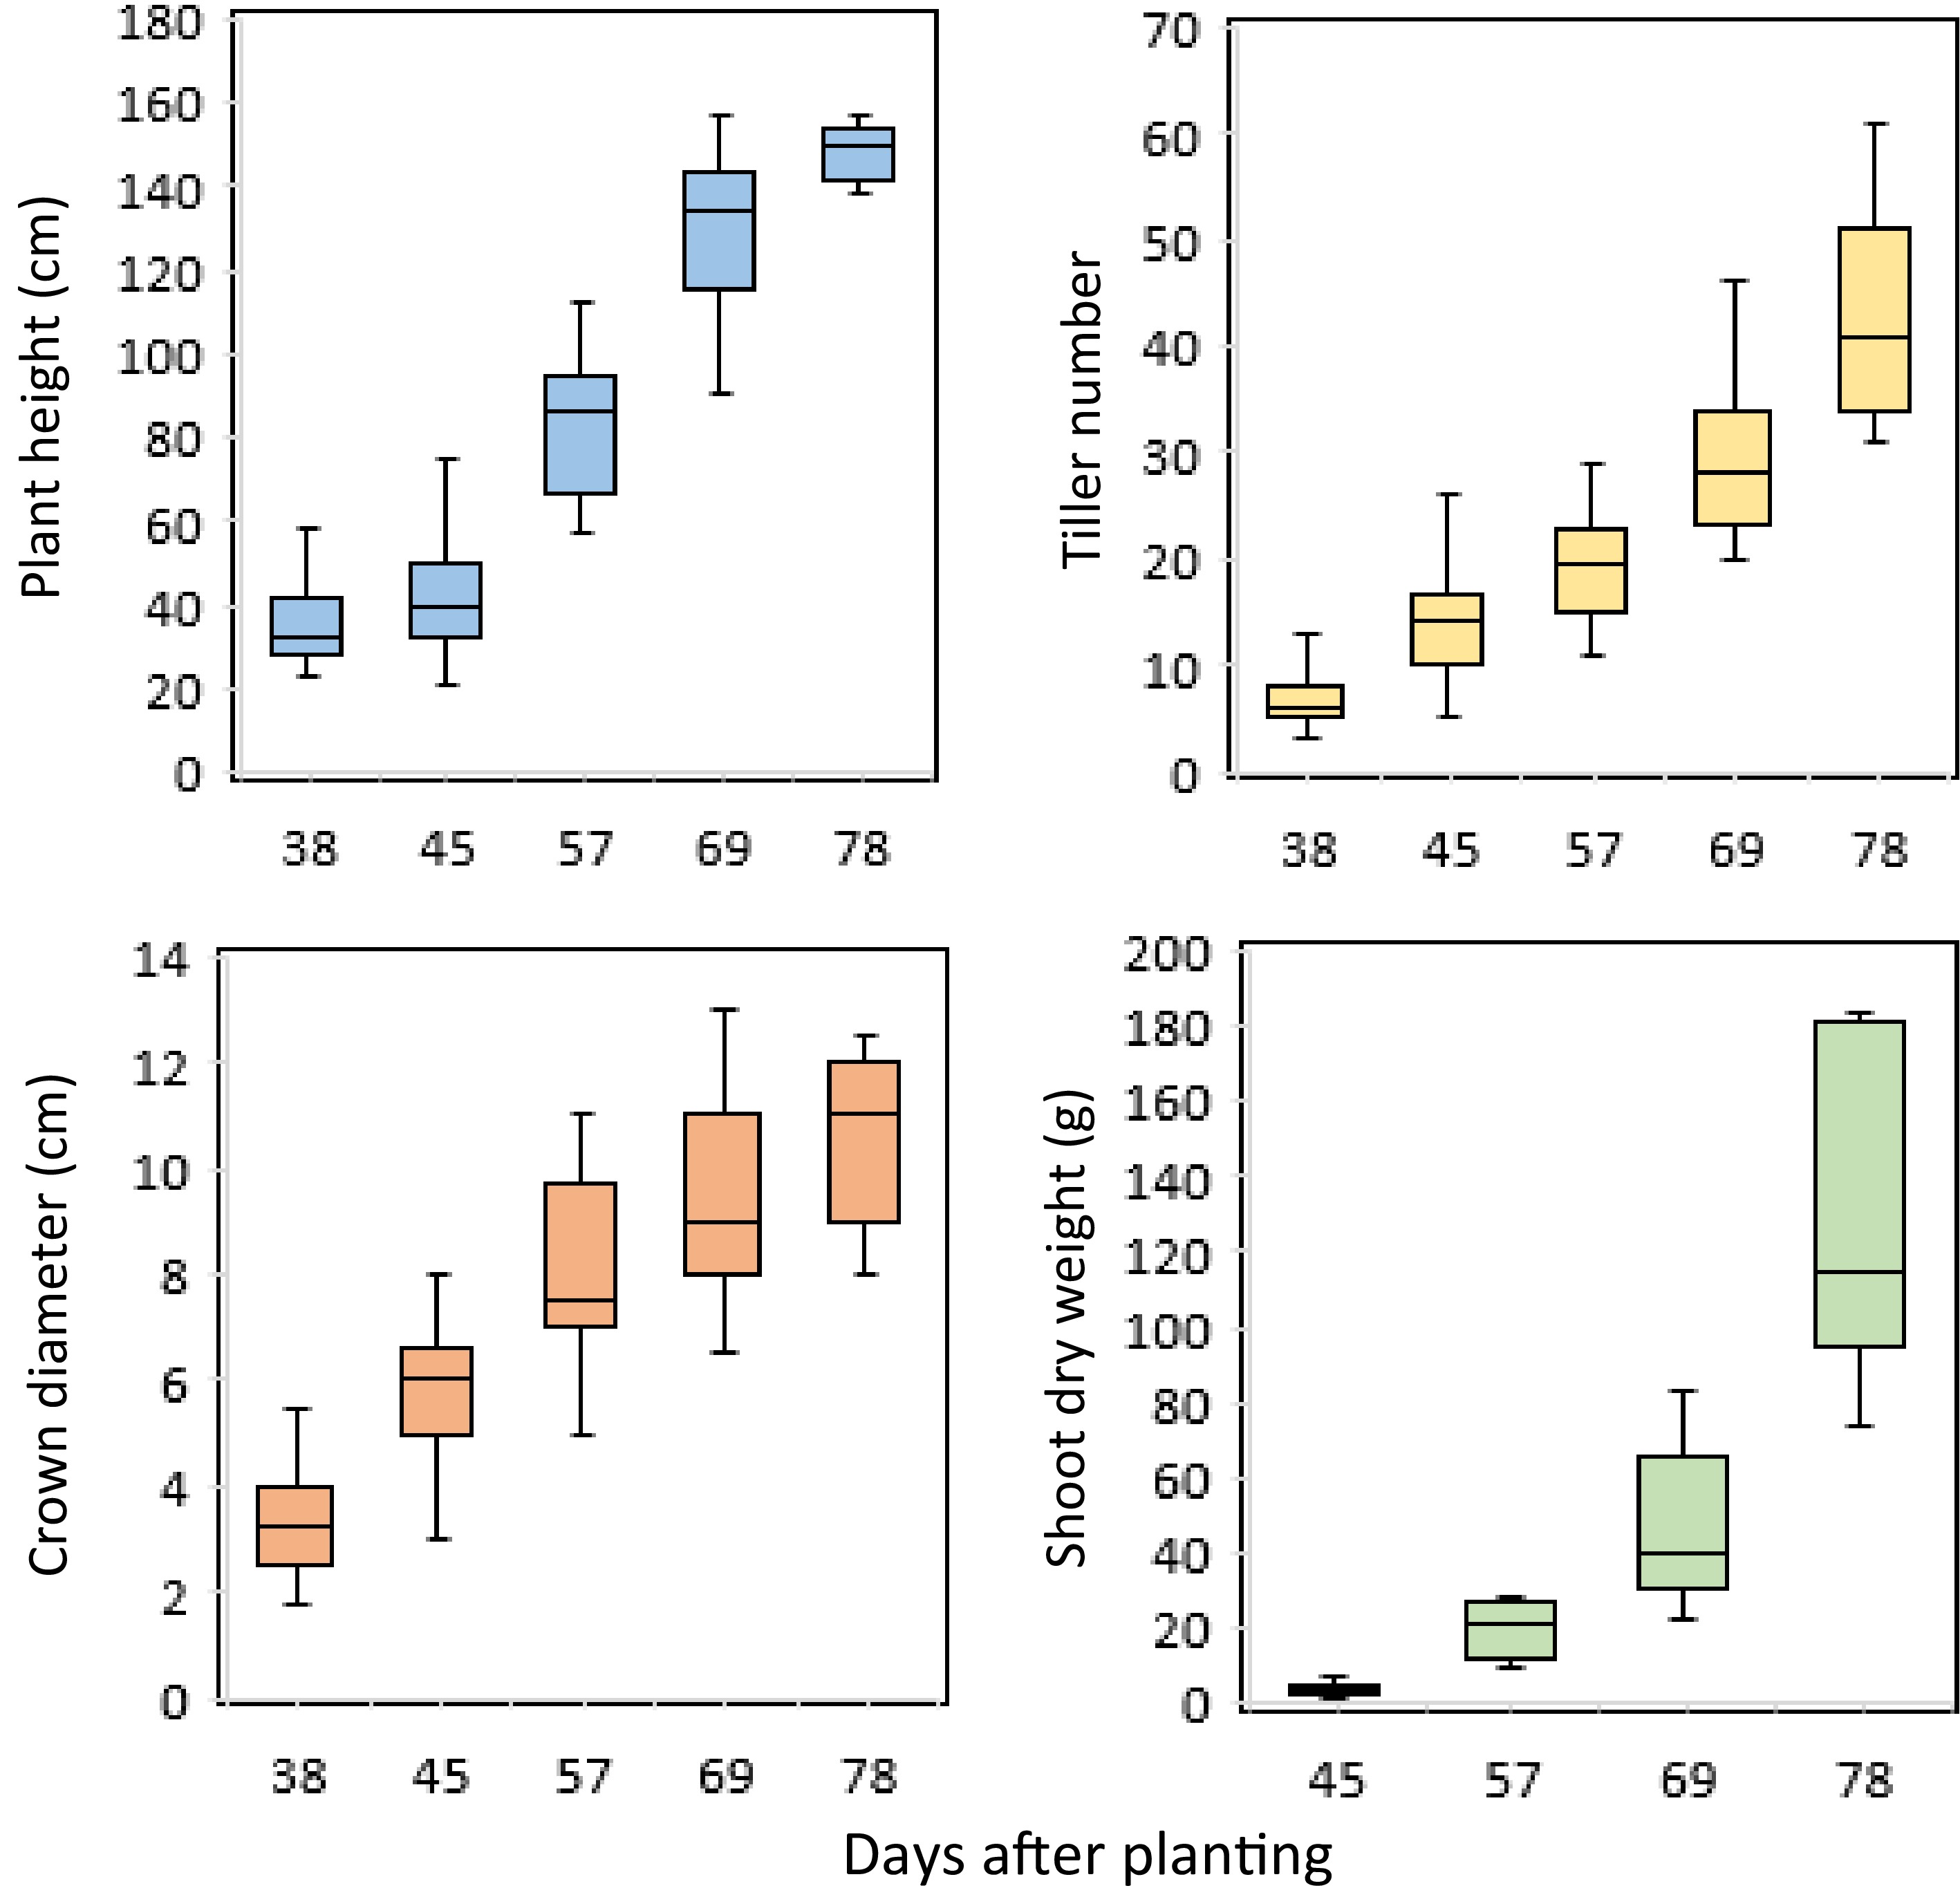
Figure 1.
Boxplots of the manually collected traits of switchgrass at different times of plant growth under controlled environment conditions.
RGB image-based parameters
-
RGB images were collected on the day prior to manual trait collection during the experiment. The image-extracted measurements also varied considerably across sampling times and pots, ranging from 22.4 to 152.8 cm for side-view height (SHT), 443.5 to 13,590.6 cm2 for side-view convex hull (SCH), 97.8 to 5,193.9 cm2 for side-view projected area (SPA), 34.1 to 13.7 cm for side-view maximum width (SMD), 56.7 to 4,723.8 cm2 for top-view convex hull (TCH), and 22.1 to 1,328.4 cm2 for top-view projected area (TPA) (Fig. 2). These measurements were all significantly correlated with each other, including those derived from side-view, top-view, and between side-and top-view images (Supplemental Table S2). Specifically, the highest correlation was found between SPA and TPA (r = 0.97***), followed by SCH and SHT (r = 0.96***), SCH and SPA (r = 0.95***), SCH and TPA (r = 0.95***), SHT and SPA (r = 0.94***), SCH and TCH (r = 0.93***), TCH and TPA (r = 0.91***), and TPA and SMD (r = 0.91***).
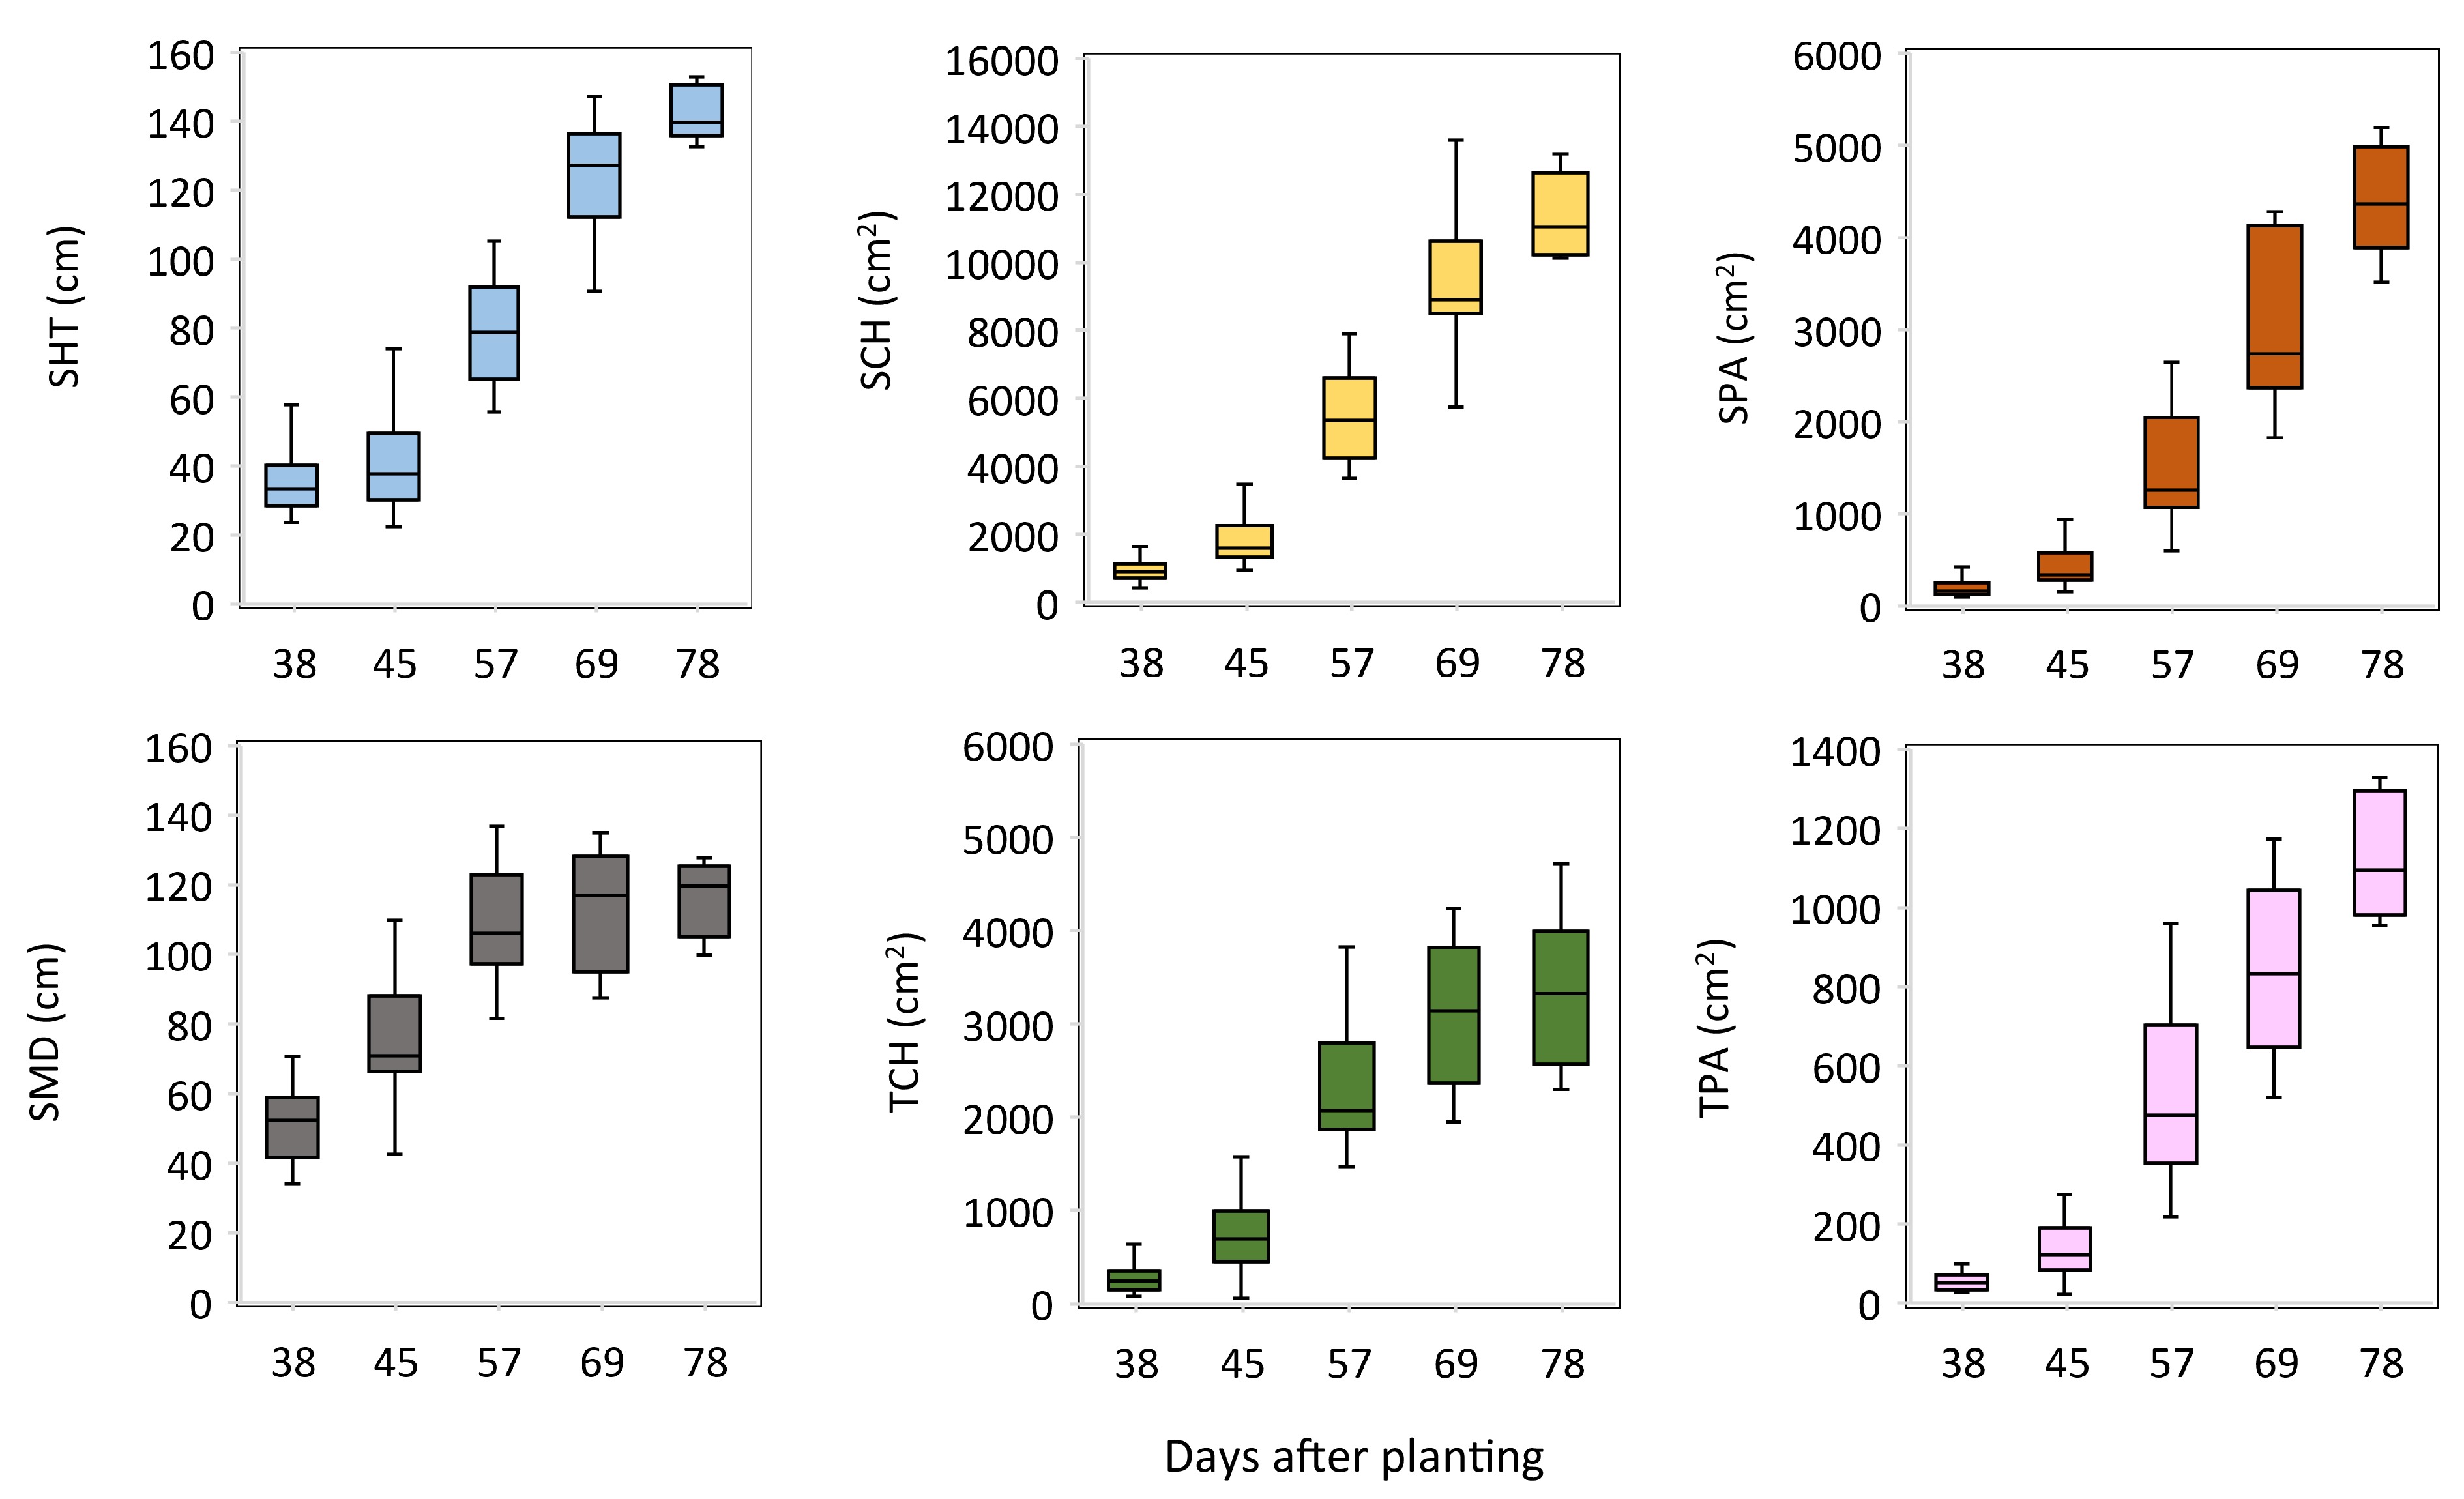
Figure 2.
Boxplots of the red-green-blue image-extracted measurements of switchgrass at different times of plant growth.
Correlation and model between RGB image-based and manually collected measurements
-
The correlation between image-extracted and manually collected measurements is of importance in determining prediction accuracy made by HTP. In this study, we found that the manually collected traits were all significantly associated with the image-extracted measurements. Plant height was highly correlated with side-view measurements SHT (r = 0.996), SCH (r = 0.97), and SPA (r = 0.94) (Table 1). Plant height was well predicted by SHT and SCH, with R2 of 0.99 for SHT and 0.93 for SCH (Fig. 3). The root mean square error (RMSE) of the model was 3.56 for SHT and 10.6 for SCH (Fig. 3). Plant height was also well correlated with the top-view-image measurements such as TPA (r = 0.91) and TCH (r = 0.85) (Table 1). Although significant, plant height was less correlated with SMD (r = 0.74). Tiller number was strongly correlated with SPA (r = 0.93) (Table 1), followed by TPA (r = 0.91), SCH (r = 0.85), SHT (r = 0.84), and TCH (r = 0.77) (Table 1). Tiller number was relatively well predicted by SPA with R2 of 0.86 (Fig. 3) and RMSE of 4.45 (Fig. 3). A relatively lower correlation was observed between tiller number and SMD (r = 0.67). Crown diameter was significantly correlated with SCH (r = 0.85), SMD (r = 0.83), TCH (r = 0.82), SHT (r = 0.79), TPA (r = 0.79), and SPA (r = 0.76) (Table 1).
Table 1. Pearson correlation coefficients among manually collected traits and red-green-blue image-extracted measurements in switchgrass across sampling times.
Plant height Tiller number Crown diameter Shoot dry weight SCH 0.97*** 0.85*** 0.85*** 0.79*** SHT 0.996*** 0.84*** 0.79*** 0.82*** SPA 0.94*** 0.93*** 0.76*** 0.94*** SMD 0.74*** 0.67*** 0.83*** 0.37* TCH 0.85*** 0.77*** 0.82*** 0.55** TPA 0.91*** 0.91*** 0.79*** 0.86*** N = 97 for correlation analysis between plant height, tiller number and crown diameter with all images based on measurements; N = 31 for correlation analysis between shoot dry weight and image-based measurements. *, **, *** represent significance at P < 0.05, 0.01, and 0.001, respectively. 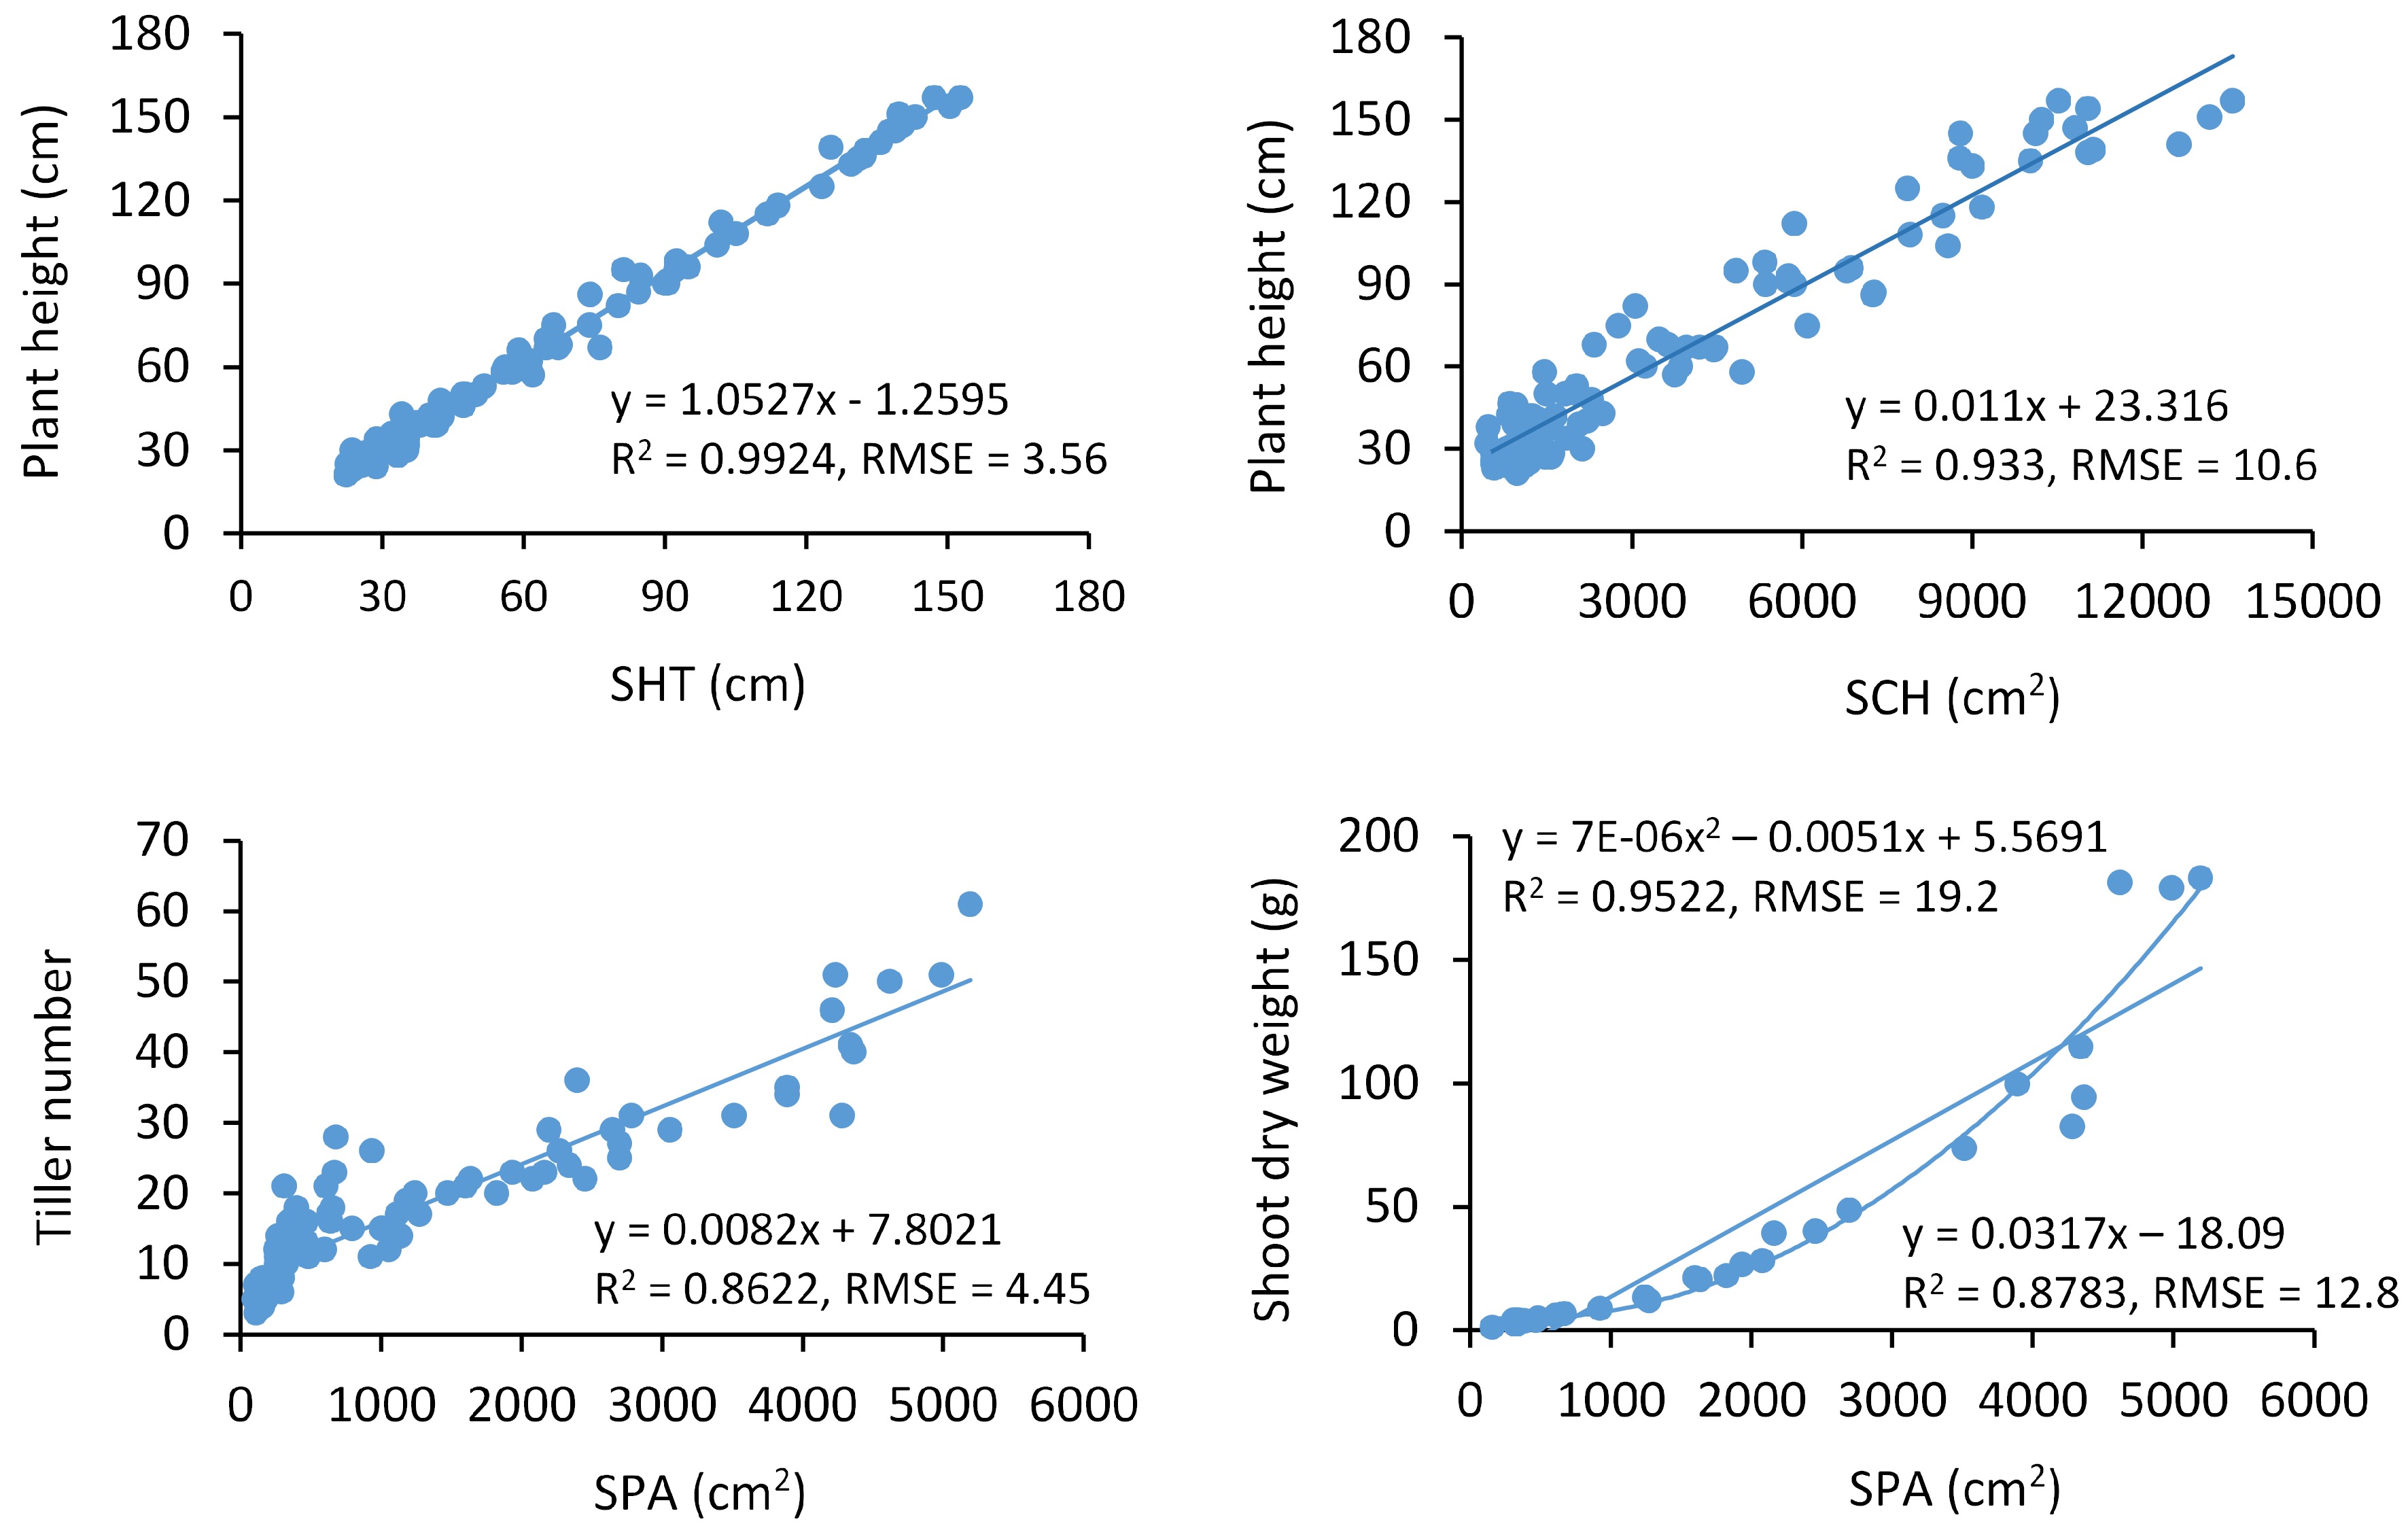
Figure 3.
The selected models to predict the manually collected traits using red-green-blue image-extracted measurements across sampling times. RMSE, the root mean square error. N = 97 for plant height and tiller number analysis. N = 31 for shoot dry weight.
Shoot dry weight was correlated with SPA (r = 0.94) (Table 1). However, it was better predicted by SPA with a polynomial with R2 of 0.95, compared to the linear model with R2 ≈ 0.88 (Fig. 3). The RMSEs of the linear and polynomial models were 19.2 and 12.8 (Fig. 3). Shoot dry weight was also correlated with TPA (r = 0.85), SHT (r = 0.82), and SCH (r = 0.79), but SMD and TCH were less correlated with shoot dry weight (Table 1). We also analyzed shoot dry weight correlation by excluding the data from the final harvest date. As a result, correlations between shoot dry weight and RGB image-based measurements were improved by 4 to 26% (except for TPA) (Supplemental Table S3), increasing from 0.79 to 0.93 for SCH, 0.80 to 0.90 for SHT, 0.94 to 0.98 for SPA, 0.37 to 0.63 for SMD, and 0.55 to 0.77 for TCH.
-
In this study, manual data were collected at different growth stages for switchgrass during the experiment, which allowed variations of biomass-related traits to be captured for further analysis. The range and average values of plant height were comparable to our previous results obtained from a segregating mapping population of switchgrass grown in the field[19]. In addition, correlations among plant height, crown diameter, and shoot dry weight were consistent with that found in the field study, but much higher levels of correlations were identified in this controlled environment study, possibly because the measurements in controlled environments were more accurate compared to the field study. Variations and correlations of the trait measurements provided a good basis for establishing a relationship with measurements generated through RGB images.
Consistent with changes of manually-collected traits over time, the corresponding RGB image-based measurements also varied largely during the experiment. We found high correlations within the side- or top-view based measurements and between the two types of imaging positions. Notably, SCH was well correlated with SHT, SPA, and TPA with a correlation coefficient ≥ 0.95, suggesting that SCH could be one of the most important parameters representing image-based traits of switchgrass. Good correlations between SHT and SPA, SPA and TCH, and TPA and TCH indicated that plant projected area might also explain relationships among image-based traits. With the same RGB imaging platform at the Ag Alumni Seed Phenotyping Facility (AAPF), a high correlation (r = 0.90) was shown between SCH and SPA in wheat (Triticum aestivum L.) plants[9]. Our results demonstrated that RGB image-based measurements were reliable for differentiating plant growth of switchgrass grown in a controlled environment.
The use of HTP has shown great potential to predict plant growth and yield component traits for crop improvement and production. It is crucial to evaluate the relationship between imaging parameters with ground truth measurements for a plant species before a model is developed and used to predict the actual plant growth and biomass yield accumulation. Our results showed that plant height was well predicted by SHT (r = 0.996), demonstrating that plant height of switchgrass could be accurately assessed by using RGB images. Similarly, a high correlation was shown on wheat (r = 0.99) using the same HTP platform[9]. The RGB images for measuring plant height of grass species were also assessed in the field by using an unmanned aerial vehicle or phenotyping robot, with good correlations found in rice (Oryza sativa L.) (r ≈ 0.84)[20], sorghum (Sorghum bicolor L.) (r ≈ 0.87)[8], and maize (Zea mays L.) (r ≈ 0.95)[21]. Collectively, it appeared that RGB images or images generated by other remote sensing techniques were reliable for indicating the changes of plant height in annual or perennial grass species.
Tiller number is a key component of plant architecture that affects biomass yield of switchgrass[22]. In this study, we observed that SPA (r = 0.93) and TPA (r = 0.91) were good indicators for tiller numbers in switchgrass. In wheat, approximately 81% of the variation of tiller number was explained by a model containing both SPA and TCH[9], while 64% of the variation in tiller number was explained by using image-based height/width ratios with shoot fresh matter in Setaria[7]. Moreover, RGB imaging measurements have been used for assessing tillering and architecture traits in germplasm of rice and barley (Hordeum vulgare L.)[23, 24]. Therefore, we expect that SPA or TPA or both serve as good references for predicting tiller numbers of switchgrass plants, especially valuable for evaluating a large amount of germplasm.
The HTP for rapid assessment of plant biomass yield is promising for crop improvement and production. The projected area produced by RGB image analysis could estimate shoot biomass in rice and wheat[9,13]. In this study, among all image-extracted measurements, SPA had the highest correlation with shoot dry weight (r = 0.94), further supporting that SPA is a reliable estimate of shoot dry matter of perennial grasses. Taken together, image-based HTP is accurate and useful for assessing biomass development of switchgrass.
It is known that plant biomass of switchgrass reaches a maximum at the flowering stage[25]. In this study, the final set of data of shoot dry weight was collected after some plants flowered. We speculated that the linear correlation between shoot biomass and image-derived measurements might be somewhat affected due to a flowering event of some plants. The results showed that shoot dry weight was better predicted with SPA using a quadratic polynomial instead of linear model (Fig. 3). Moreover, the linear correlations between shoot dry weight and RGB image-based measurements were also improved when the last-harvest data set was excluded from the analysis (Table 1, Supplemental Table S3). A previous study found that the use of RGB traits well predicted shoot dry matter and leaf area at early growth stages of maize, but such predictions became less accurate when estimating these traits at later growth stages[15]. Depending on plant species, the influence of plant growth stage may need to be taken into consideration when developing a model with image-based measurements. Nevertheless, SPA was consistently well correlated with shoot dry weight, demonstrating a good and reliable indicator for predicting shoot biomass yield of switchgrass.
The advantages of using the HTP platform over manual phenotyping methods include time and labor savings as well as being non-destructive to plants. In AAPF at Purdue University, the RGB imaging system is capable of measuring up to 120 switchgrass plants per hour. In comparison, a group consisting of five to six people normally would be able to process at most 15 plants per hour. Without the HTP platform, when large quantities of samples need to be processed, some parts of the experiment design and data collection plan would not be carried out due to the lack of capacity in handling a large number of samples. The investment in the AAPF as a facility is indeed significant. However, for the cost of each imaging event, the charge is set at $0.05/image (12 images taken per plant). Even when the cost for growing plants in the growth chamber inside the AAPF is taken into consideration, the current expense rate comes to 1.5 per pot per day, still an affordable amount. Therefore, the HTP in a controlled environment is an efficient and affordable platform for rapidly assessing plant traits. Nevertheless, there is the limitation of space and a cost associated with using a growth chamber, limiting the number of plants to be assessed. In a field setting, the cost to maintain greater numbers of plants may be reduced, which could be an advantage for imaging more switchgrass germplasm using HTP. To date, RGB-based HTP has been used in the field for crop species, with imagery acquired using unmanned aerial vehicles (UAVs)[8, 11, 16, 20]. Our results in a controlled environment will provide a good reference for future phenotyping plant growth of switchgrass in the field using such technology. As more advanced imaging and computing technologies becoming available, it is expected that HTP will gain more popularity in studying crop plants including perennial grass species.
-
This study illustrated an application of HTP in predicting low throughput phenotypic measurements in switchgrass grown in a controlled environment. Plant height, tiller number, and shoot dry weight were highly correlated with RGB image-based measurements, especially with side-view image-extracted parameters. The models generated from these parameters could be helpful in predicting plant growth and biomass yield of switchgrass. Our results also demonstrated a feasible means by which germplasm resources of other perennial grass species may be assessed through HTP for their potential use in breeding programs and crop management. Further research could be conducted to develop the variety-specific correlations between image-traits and physically measured traits to verify if there exists a generic model across different varieties. Such research will especially be valuable for germplasm enhancement for crop improvement and production.
-
The switchgrass cultivar Cave-in-Rock was used in the experiment, as it is commonly cultivated and highly adaptable to a wide range of soils and growing conditions. Seeds were sown in 32 bar-coded pots (23 cm diameter, 21 cm deep) filled with propagation potting mix (Sungro, Agawam, MA, USA). The pots were placed in a well-controlled growth chamber room in the AAPF at Purdue University (IN, USA) (Fig. 4a). Seven days after germination, one healthy plant was kept in each pot. Plants were grown under temperatures of 29 °C/26 °C (day/night) and photosynthetically active radiation of 800 μmol m−2 s−1 with a 16-h photoperiod. Plants were automatically watered as needed and fertilized with a soluble fertilizer (N-P-K, 15-5-15 Cal-Mag) (Scotts Inc., Marysville, OH, USA). After 38 d of establishment, manual trait collection started along with initiation of high-throughput imaging.
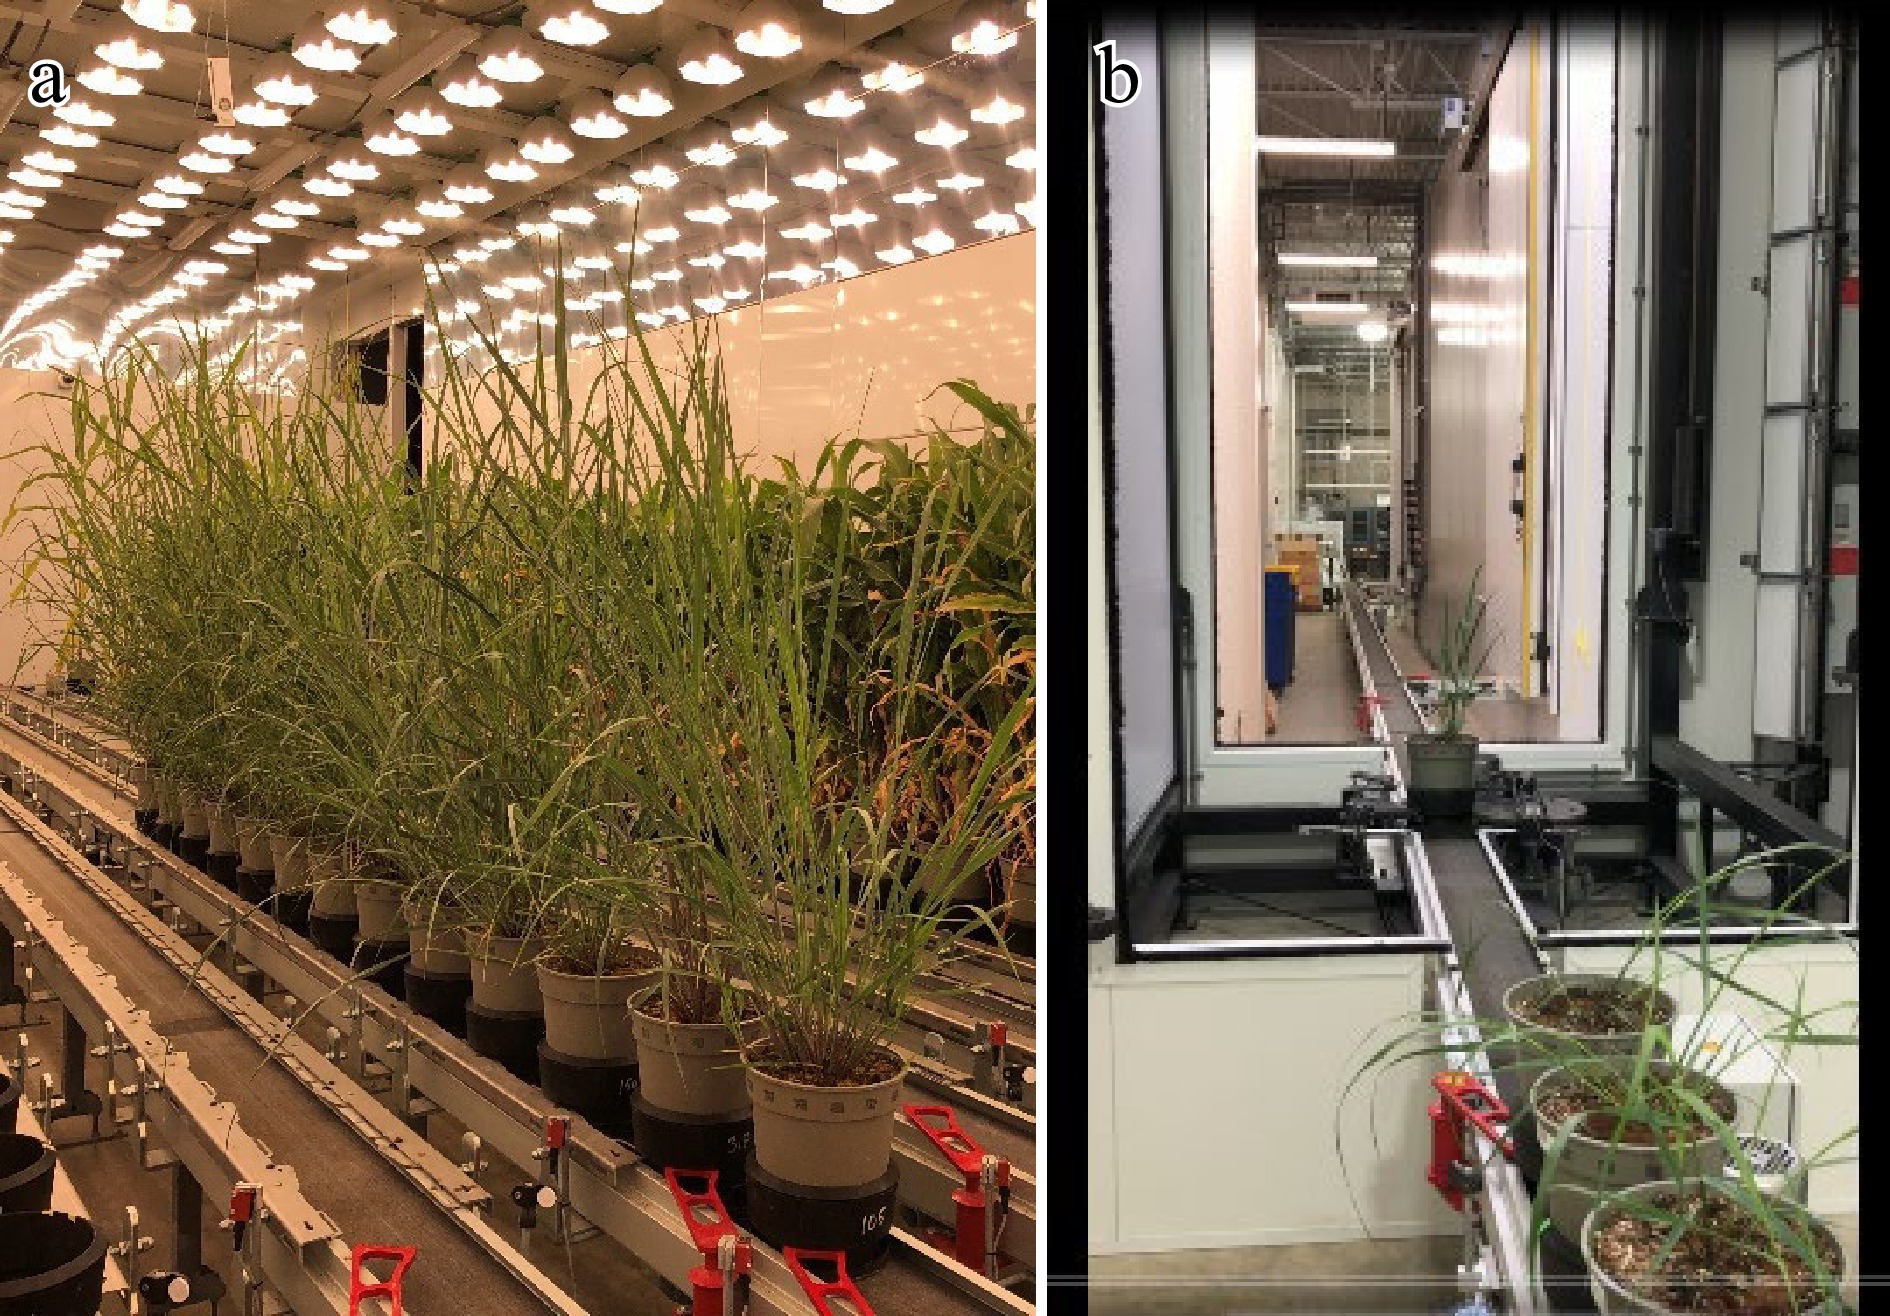
Figure 4.
(a) Growth chamber and (b) red-green-blue imaging tower in the Ag Alumni Seed Phenotyping Facility at Purdue University (IN, USA)
Manual trait measurements
-
Plant growth and biomass component traits were manually measured at 38, 45, 57, 69, and 78 d after planting (DAP), except that shoot dry weight measurement was omitted at 38 d. This ensured a range of plant growth stages to be characterized during the experiment. Plant height was determined from the soil surface to the top of the uppermost leaf blade. Tiller number was counted for each pot. Crown diameter was taken by measuring the widest point across plants approximately 2.0 cm above the soil surface. At each harvest, all tillers from the randomly selected pots were collected for determining shoot dry weight after drying at 80°C in an oven for 3 d. The remaining pots were kept for continuous measuring and imaging. There were 32, 32, 20, 13, and 7 pots for measurements of plant height, tiller number, and crown diameter at their respective DAPs. For shoot dry weight, there were 12, 7, 5, and 7 pots harvested at 45, 57, 69, and 78 DAPs, respectively.
High-throughput phenotyping
-
AAPF is an automated HTP facility that enables imaging-based, high-throughput, nondestructive measurements of crop traits. The plants were imaged each time prior to manual trait collection. For imaging, bar-coded pots in growth chambers at the AAPF were automatically transferred to the AAPF’s RGB imaging tower (Fig. 4b). A custom-made ARIS RGB imager (ARIS, Eindhoven, The Netherlands) equipped with a standard 5 Megapixel RGB camera (Basler Ace, Germany) and a monochrome camera (acA2440-20gm) for chlorophyll fluorescence image acquisition were used to automatically acquire side- and top-view plant images, which are illustrated in Fig. 5. The detailed description of image acquisition processes through multiple imaging booths at AAPF were described previously[10]. Briefly, the fluorescence images were leveraged in the early step of image processing, namely the image segmentation step. Using the fluorescence image of a plant, the black and white template of an image was established using the Otsu algorithm. This template was used to isolate the corresponding RGB plant from its background, leaving only the plant’s pixels in the cut out image. After the plant in the RGB image was segmented, the traits such as the width, height, and area were measured. We used the script developed in Python for computations.
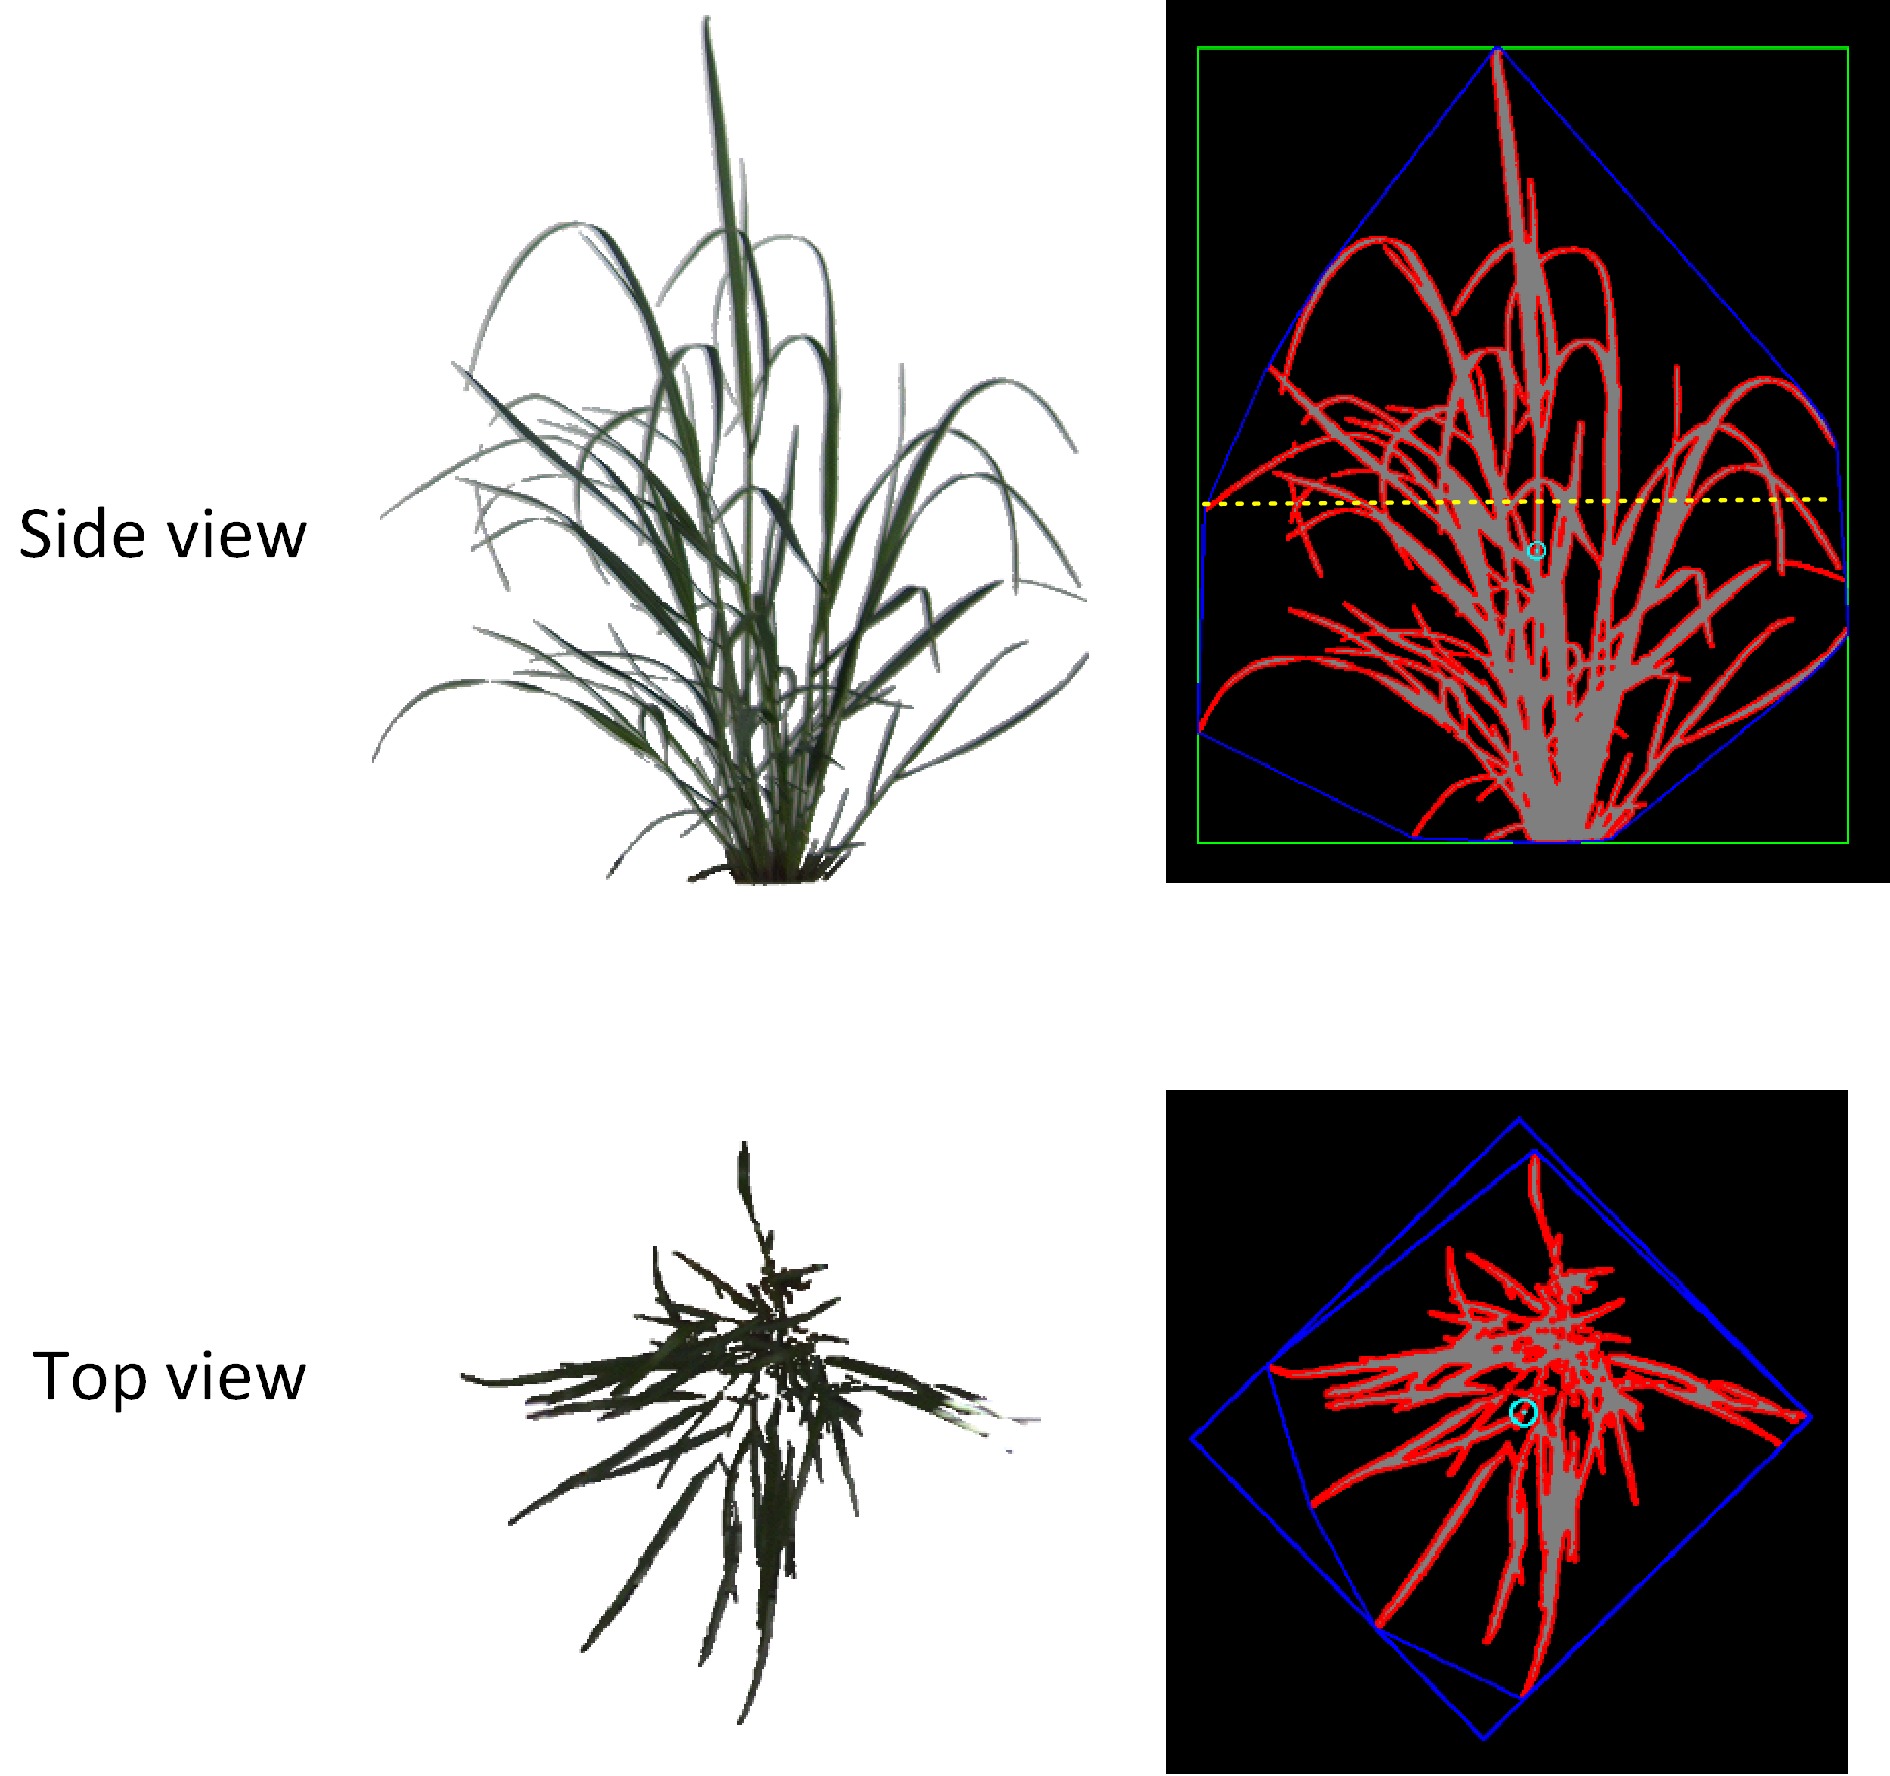
Figure 5.
Depiction of the extraction of red-green-blue image-based traits. For side-view, the length of the green box is an estimate of height (SHT), the yellow dash line is the maximum width of the plants, the area of the blue polygon is convex hull (SCH), and the red outline of the plant is the estimated side projected area (SPA). For top-view, the area inside the blue polygon is convex hull (TCH) and the red outline of the plant is the estimated side projected area (TPA).
In each RGB imaging event, 12 predefined side-view images from 360 degree angles (0, 30, 60, 90, 120, 150, 180, 210, 240, 270, 300, and 330) and one top-view image were acquired for each pot. Several RGB image-based traits were extracted including SHT, SCH, SPA, SMW, TCH, and TPA. The descriptions of these parameters are provided in Table 2. All images were analyzed by using a proprietary image analysis pipeline provided by ARIS, which conducts image segmentation using the chlorophyll fluorescence image of a plant[10].
Table 2. Definition and abbreviation of each image-based high-throughput trait.
Trait Abbreviation Definition Side-view height SHT Length from the lowest to the highest point of the plant Side-view convex hull SCH Smallest polygon that contains all plant materials from the side Side-view projected area SPA Total side-view projected area obtained by outlining all plant materials Side-view maximum width SMD Maximum width of the plants from side to side Top-view convex hull TCH Smallest polygon that contains all plant materials from the top Top-view projected area TPA Total top-view projected area obtained by outlining all plant materials Statistical data analysis
-
The values from the image-extracted measurements obtained through 12 side-views from 0 to 330 degree angles were averaged for each pot at each sampling time for correlation analysis with manually collected traits. For the top-view, one image was collected for each pot at each sampling time and was used for correlation analysis. The data from different sampling times across all individual pots was pooled for determining Pearson correlation coefficients using the SAS program (version 9.4; SAS Institute, Cary, NC, USA). Seven data points were excluded from all correlation analysis due to a failure in obtaining a top-view image at a particular time during the experiment.
-
We thank Purdue Institute for Plant Sciences for facilitating controlled environment phenotyping research and thank Chris Hoagland for technical help and assistance in high-throughput phenotyping. We also thank Yunfei Gao, Mengxin Xu, Jia Tang, and Yankai Wang for their assistance in planting and harvesting plants.
-
The authors declare that they have no conflict of interest.
- Supplemental Table S1 Pearson correlation coefficients among manually measured plant height, tiller number, crown diameter, and shoot dry weight in switchgrass across sampling times.
- Supplemental Table S2 Pearson correlation coefficients among red-green-blue images-extracted measurements of side-view convex hull (SCH), side-view height (SHT), side-view projected area (SPA), side-view max width (SMD), top-view convex hull (TCH), and top-view projected area (TPA) in switchgrass across sampling times (N= 97) .
- Supplemental Table S3 Pearson correlation coefficients among shoot dry weight with red-green-blue image-extracted measurements in switchgrass across sampling times excluding the last harvest time .
- Copyright: © 2022 by the author(s). Published by Maximum Academic Press, Fayetteville, GA. This article is an open access article distributed under Creative Commons Attribution License (CC BY 4.0), visit https://creativecommons.org/licenses/by/4.0/.
-
About this article
Cite this article
Jiang Y, Yang Y. 2022. High-throughput phenotyping for plant growth and biomass yield of switchgrass under a controlled environment. Grass Research 2:4 doi: 10.48130/GR-2022-0004 

High-throughput phenotyping for plant growth and biomass yield of switchgrass under a controlled environment
- Received: 23 February 2022
- Accepted: 29 June 2022
- Published online: 28 July 2022
Abstract: Switchgrass (Panicum virgatum L.) is a native and prominent perennial grass species used for feedstocks. High-throughput phenotyping of biomass component traits is desirable for switchgrass improvement and production. The objective of this study was to establish correlations between the manually measured traits and image-extracted measurements in switchgrass grown in a controlled environment. Red-green-blue (RGB) images from side- and top-views were automatically collected from the plants varying in growth stages for assessing their relationships with manually measured traits. Plant height, tiller number, crown diameter, and shoot dry weight were all significantly correlated with RGB image-based measurements including side-view height (SHT), side convex hull (SCH), side projected area (SPA), top convex hull (TCH), and top projected area (TPA). For a particular plant trait, a good prediction was observed based on an image-based measurement, including plant height and SHT (R2 = 0.992), tiller number and SPA (R2 = 0.86), crown diameter and SCH (R2 = 0.72), and shoot dry weight and SPA (R2 = 0.88). Plant height was also well predicted by SCH (R2 = 0.94) and SPA (R2 = 0.88). Overall, SHT, SCH, and SPA extracted from RGB images well predicted plant height, tiller number and shoot dry weight. The results demonstrated that the image-based parameters could be leveraged in quantifying the growth and development of switchgrass.
-
Key words:
- Biomass yield components /
- High-throughput phenotyping /
- RGB images /
- Switchgrass