-
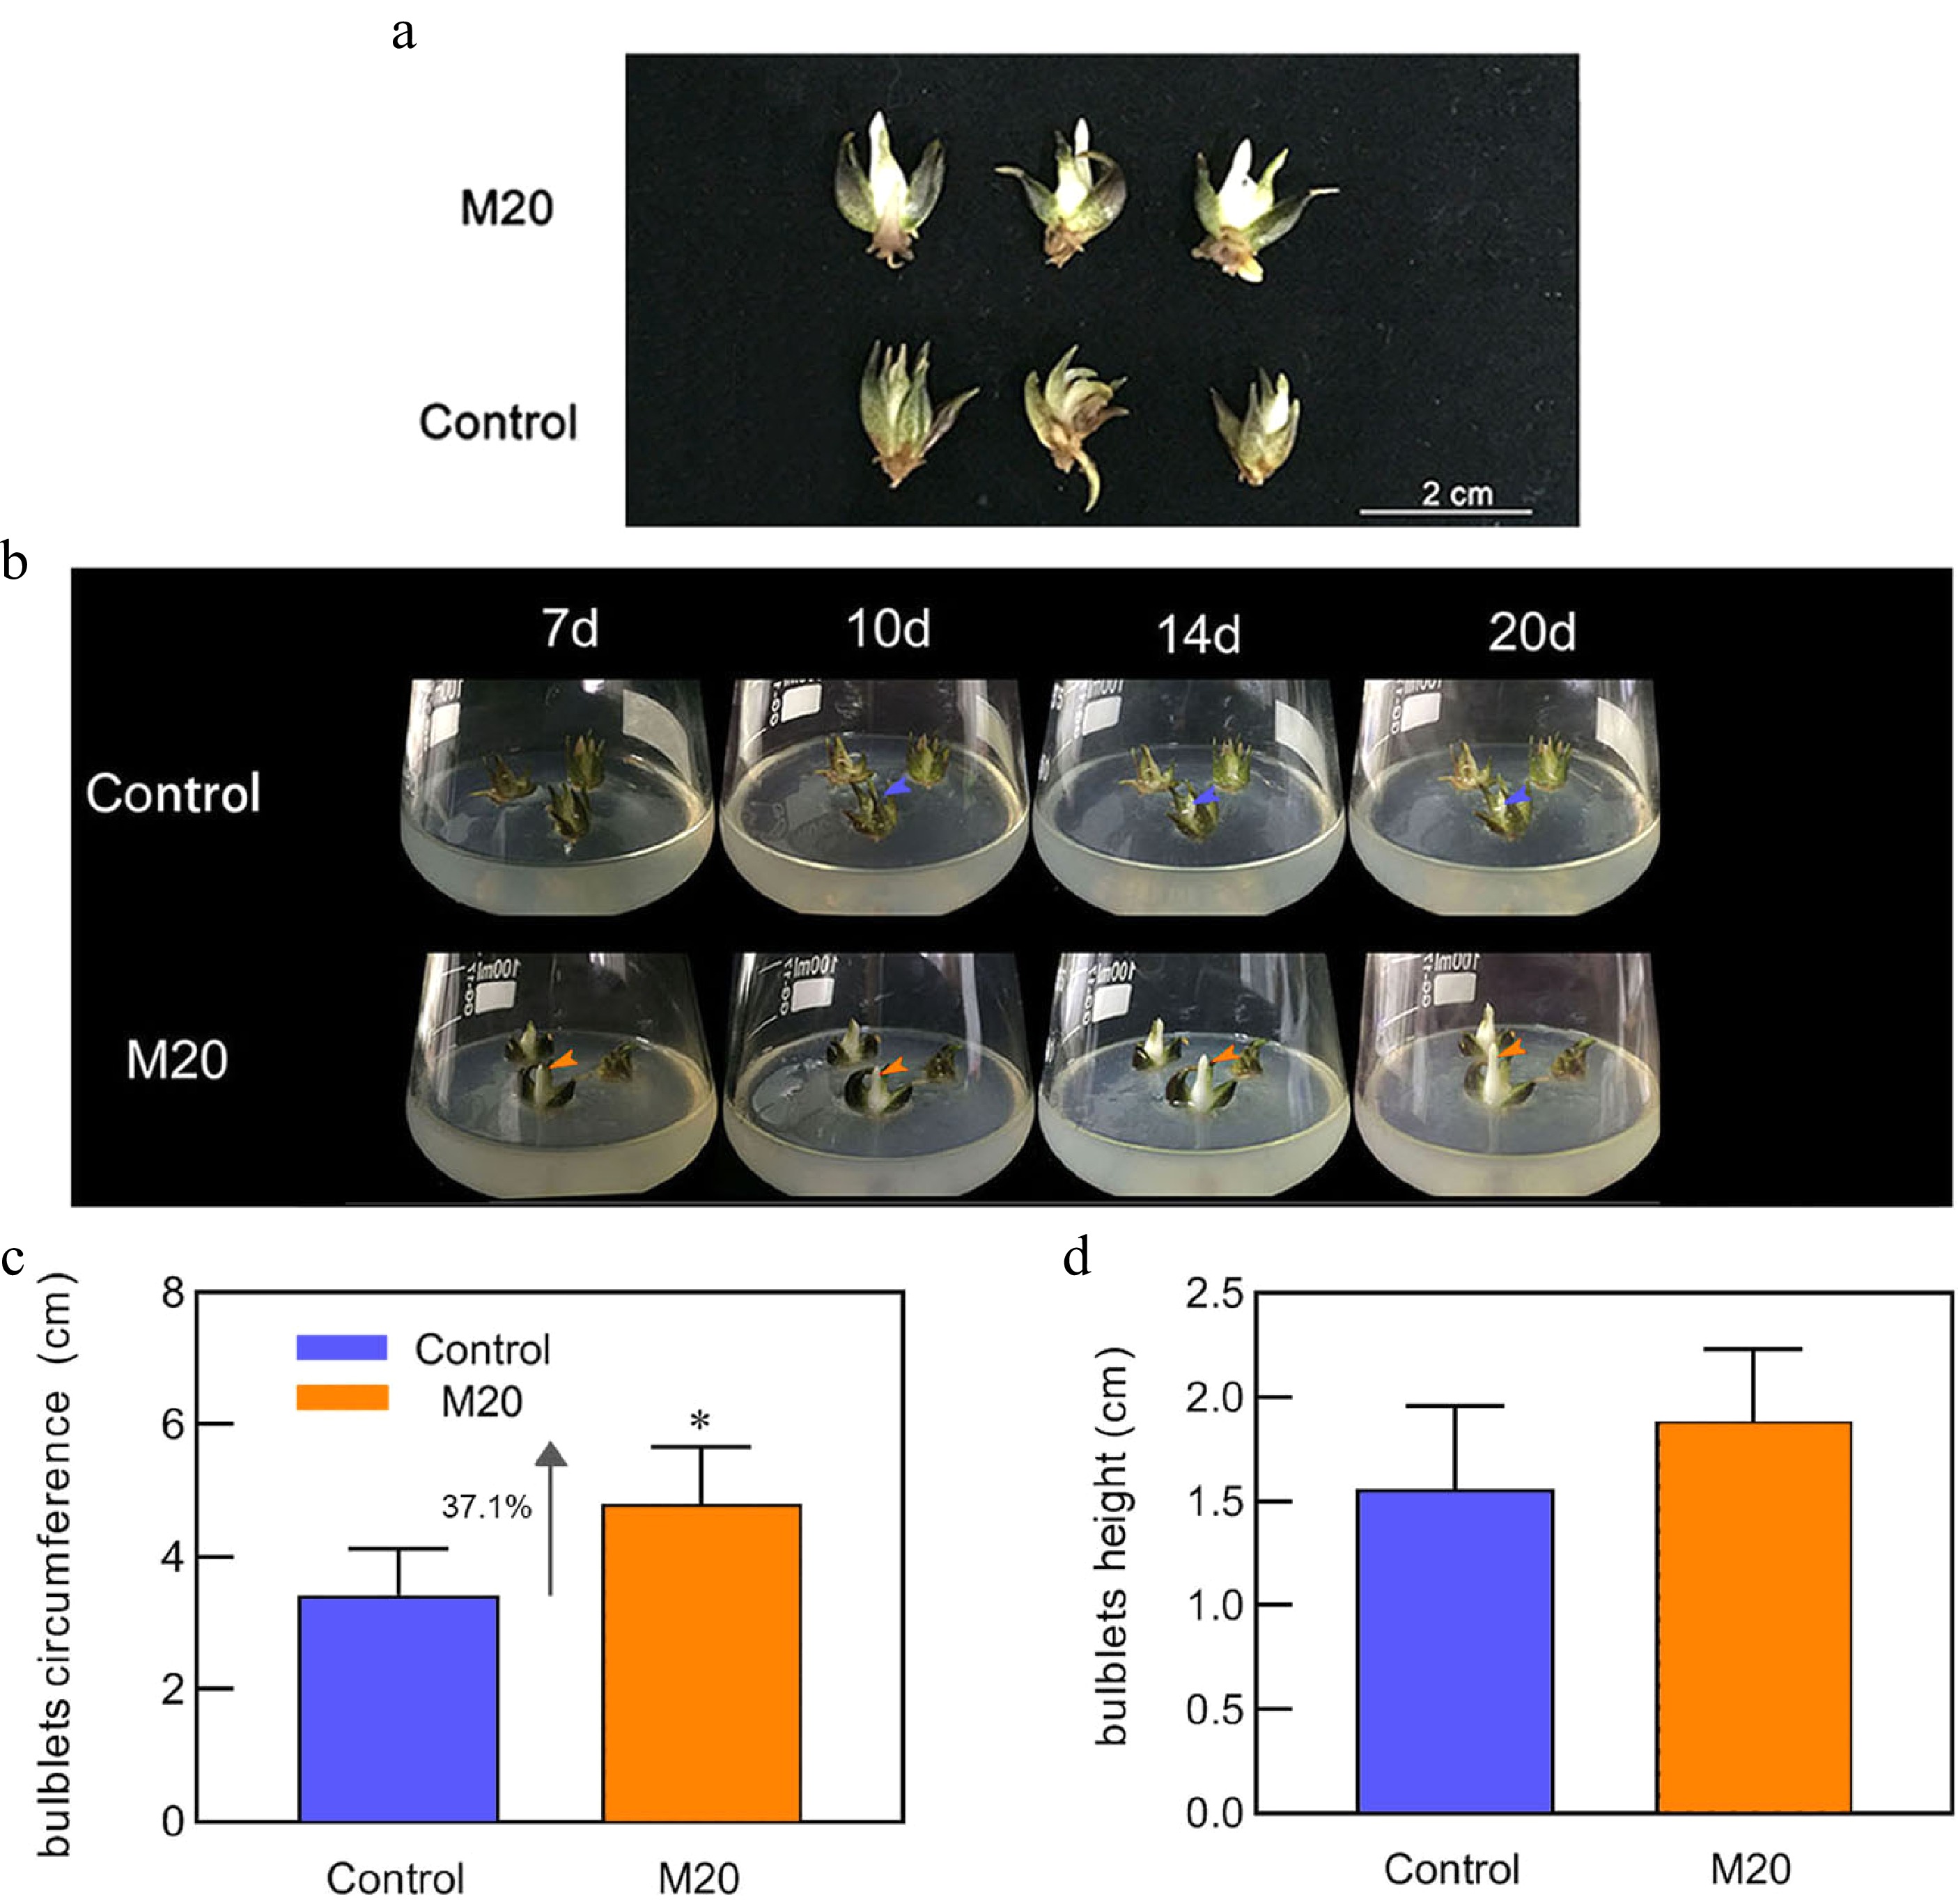
Figure 1.
Morphology of the bulblets in different media. (a) Phenotype of bulblets on day 20 in different treatment groups. (b) Growth status of bulblets in the control and M20 medium (containing 20 μM melatonin) at different incubation time points. Blue and orange arrows indicate internal scales in different treatment groups. (c) Bulblet circumference. (d) Bulblet height. Blue and orange boxes indicate the control and melatonin treatment groups, respectively. Values are presented as the means of three replicates ± SD. Data were analyzed using one-way analysis of variance (ANOVA) followed by Duncan's test; * indicates a significant difference (P < 0.05).
-
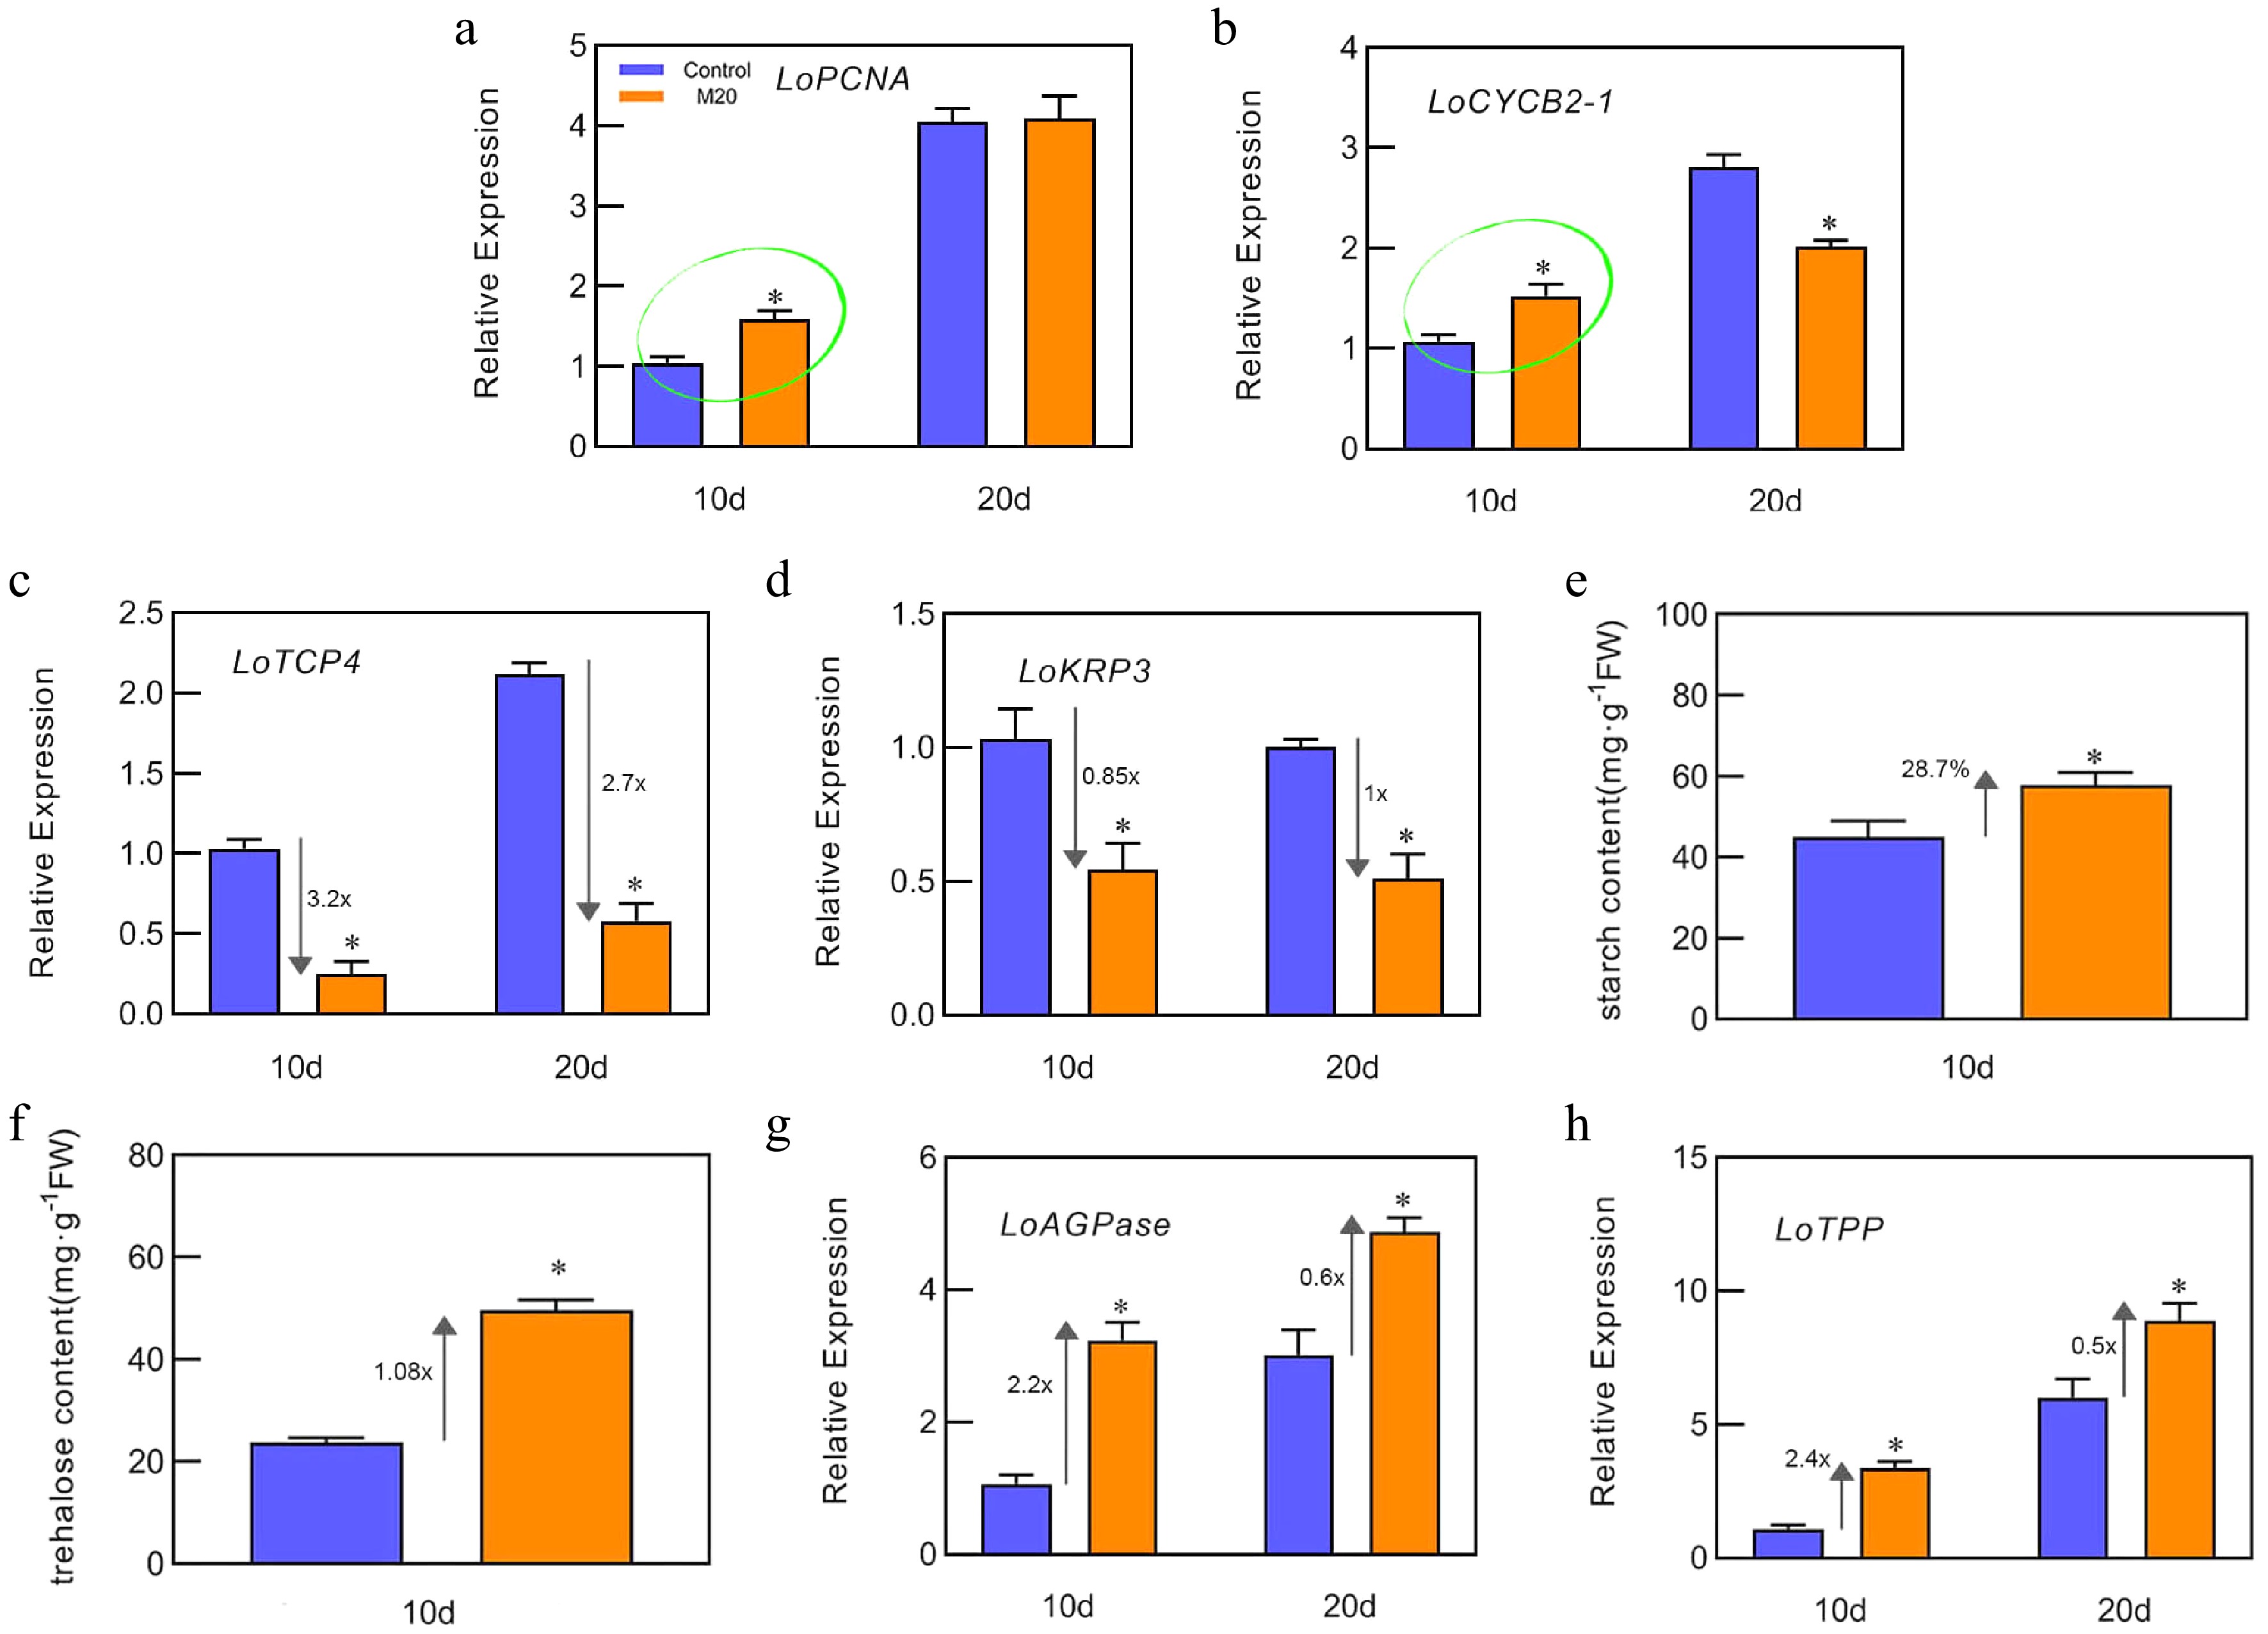
Figure 2.
Effects of melatonin on starch and trehalose metabolism. (a)−(d), (g)−(h) The expression levels of LoPCNA, LoCYCB2-1, LoTCP4, LoKRP3, LoAGPase, and LoTPP on days 10 and 20 of bulblet cultivation, respectively. (e), (f) The content of trehalose and starch in bulblets from the control and melatonin-treated groups on day 10. Expression levels were calculated relative to those of Lilium FP mRNA. Blue and orange boxes indicate the control and melatonin treatment groups, respectively. Values are presented as the means of three replicates ± SD. Data were analyzed using one-way analysis of variance (ANOVA) followed by Duncan's test; * indicates a significant difference (P < 0.05).
-
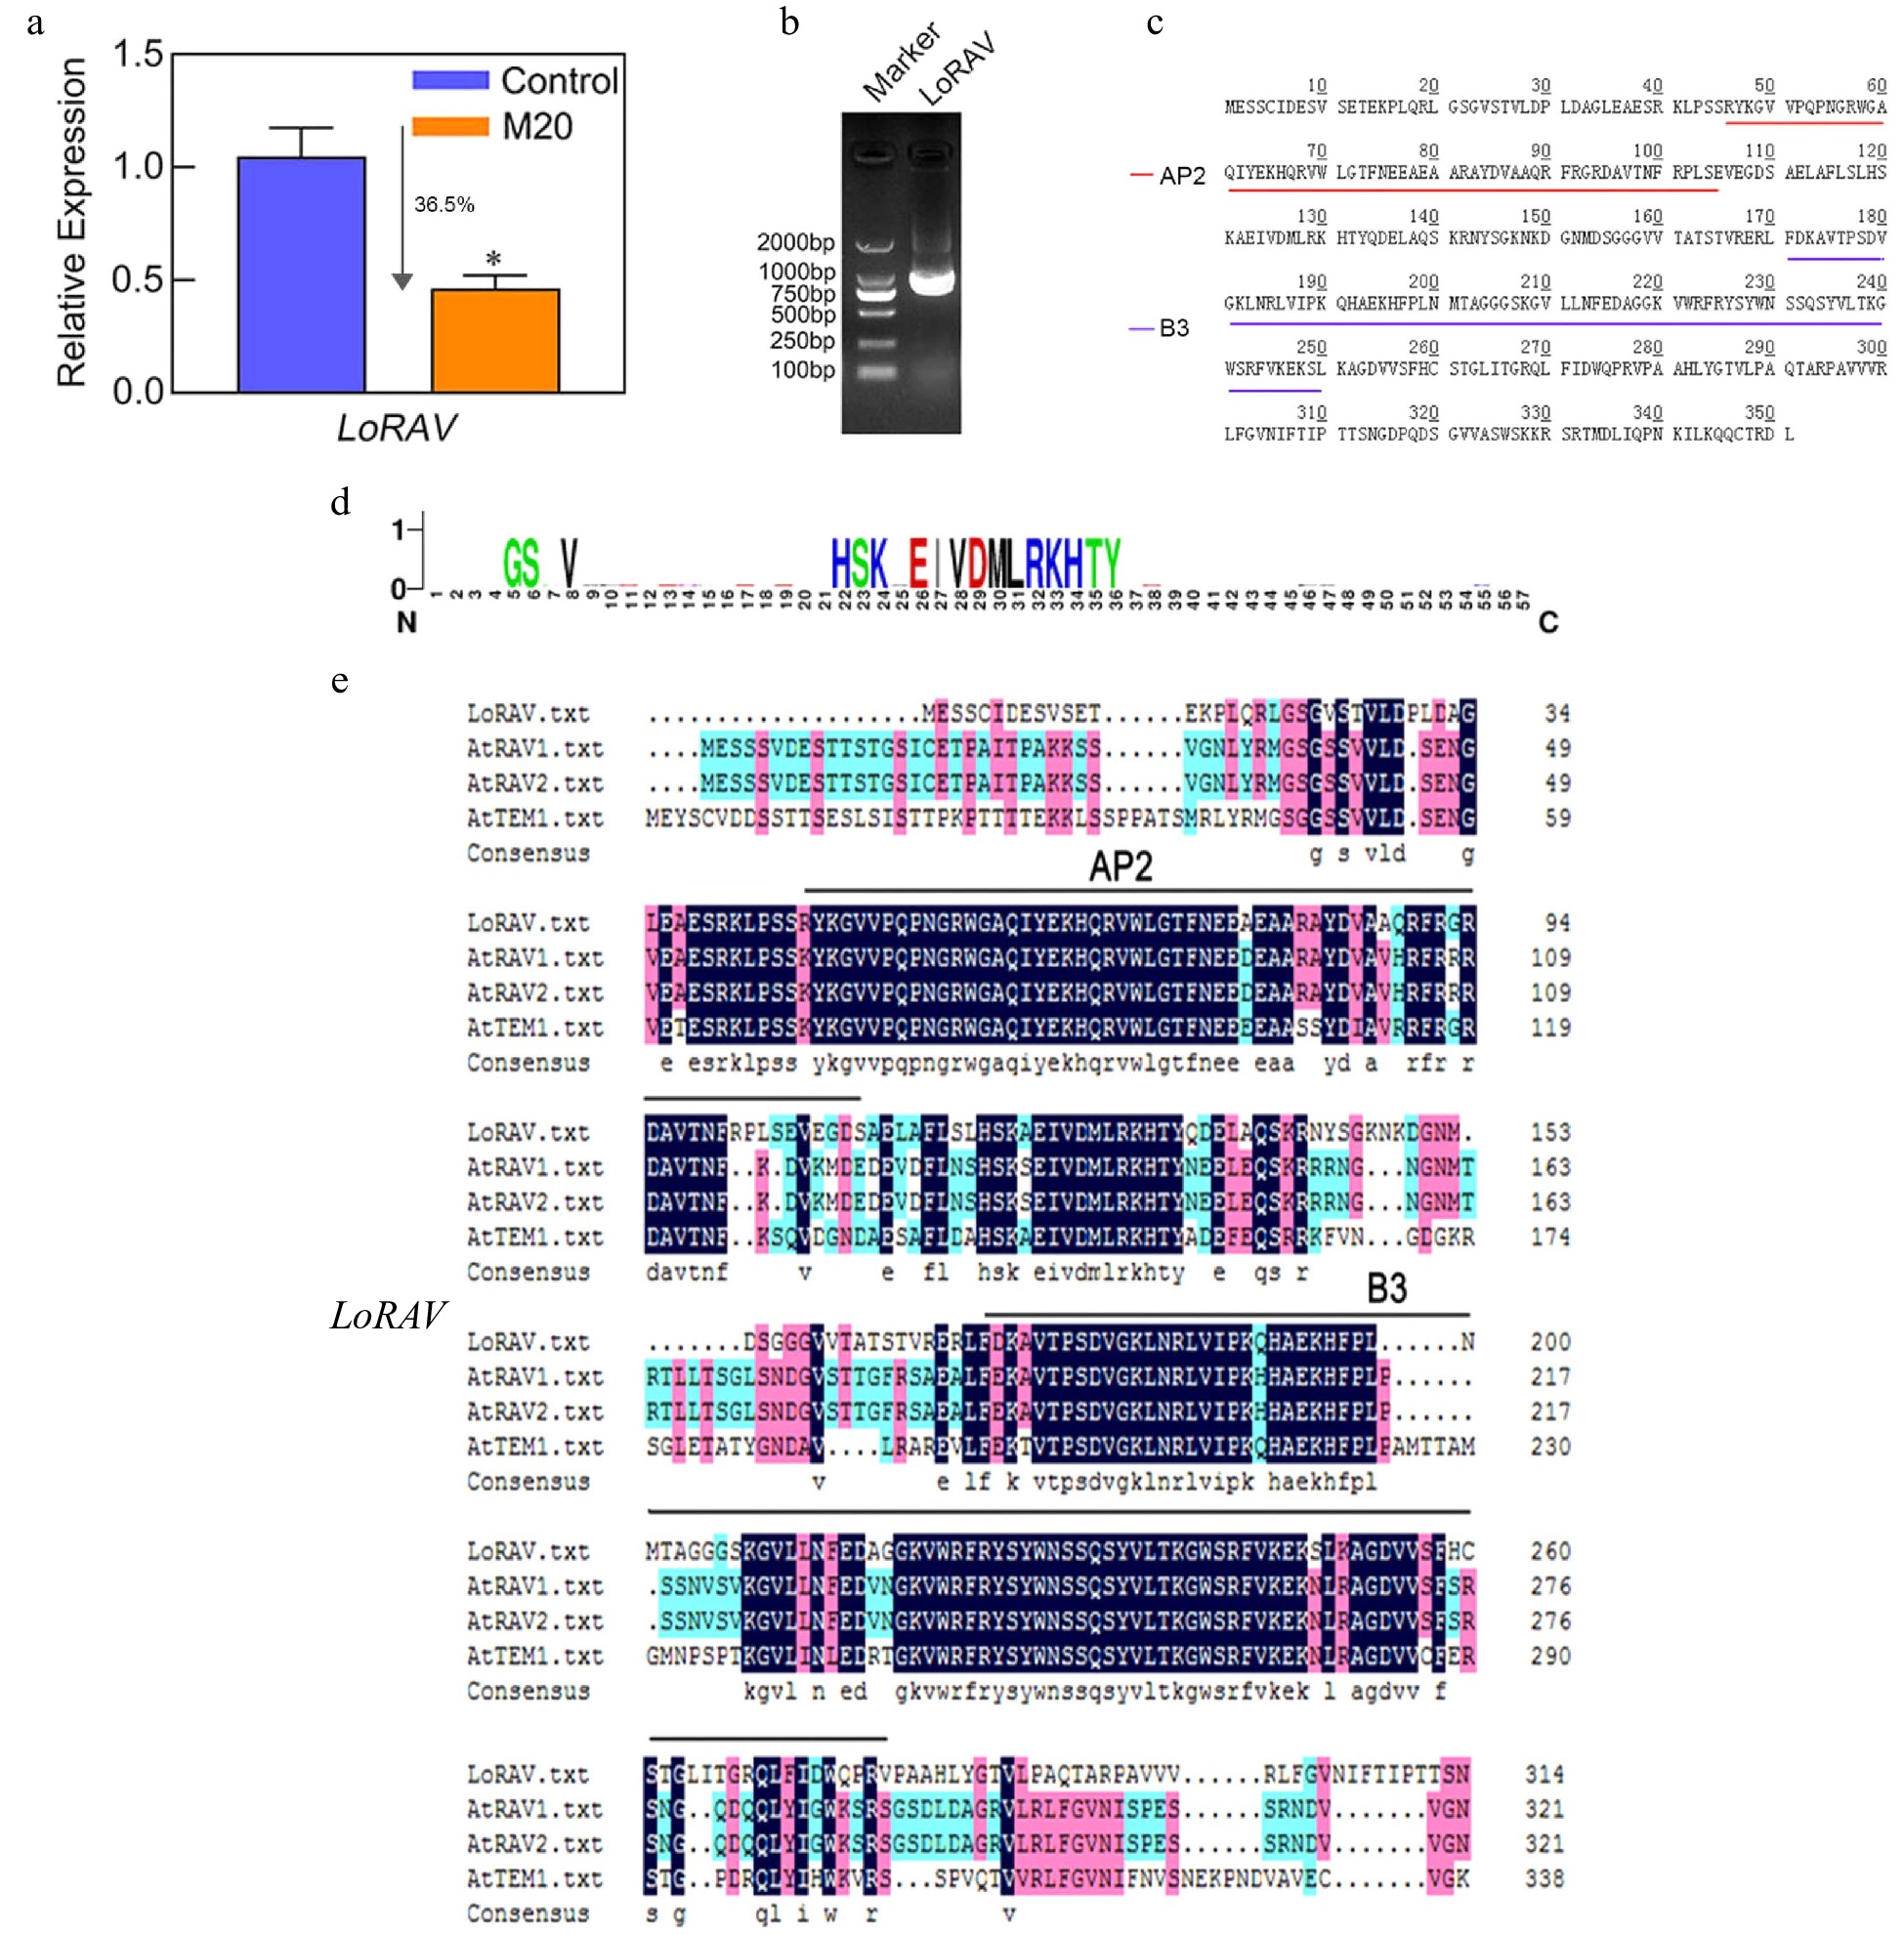
Figure 3.
LoRAV expression, cloning, and amino acid sequence analysis. (a) The expression of the LoRAV gene in bulblets on day 10 in the control and melatonin-treated groups. The expression levels were calculated relative to those of Lilium FP mRNA. Blue and orange boxes indicate the control and melatonin-treated groups, respectively. Values are presented as the means of three replicates ± SD. Data were analyzed using one-way ANOVA followed by Duncan's test; * indicates a significant difference (P < 0.05). (b) The product of LoRAV cloning; the left lane is a 2000 bp DNA marker. (c) The amino acids of LoRAV; red and purple lines indicate the AP2 and B3 structural domains, respectively. (d) LoRAV-like ubiquitinated reciprocal motifs predicted by the Cuckoo work group website. (e) Multiple sequence alignment of LoRAV with RAV family member genes of Arabidopsis.
-
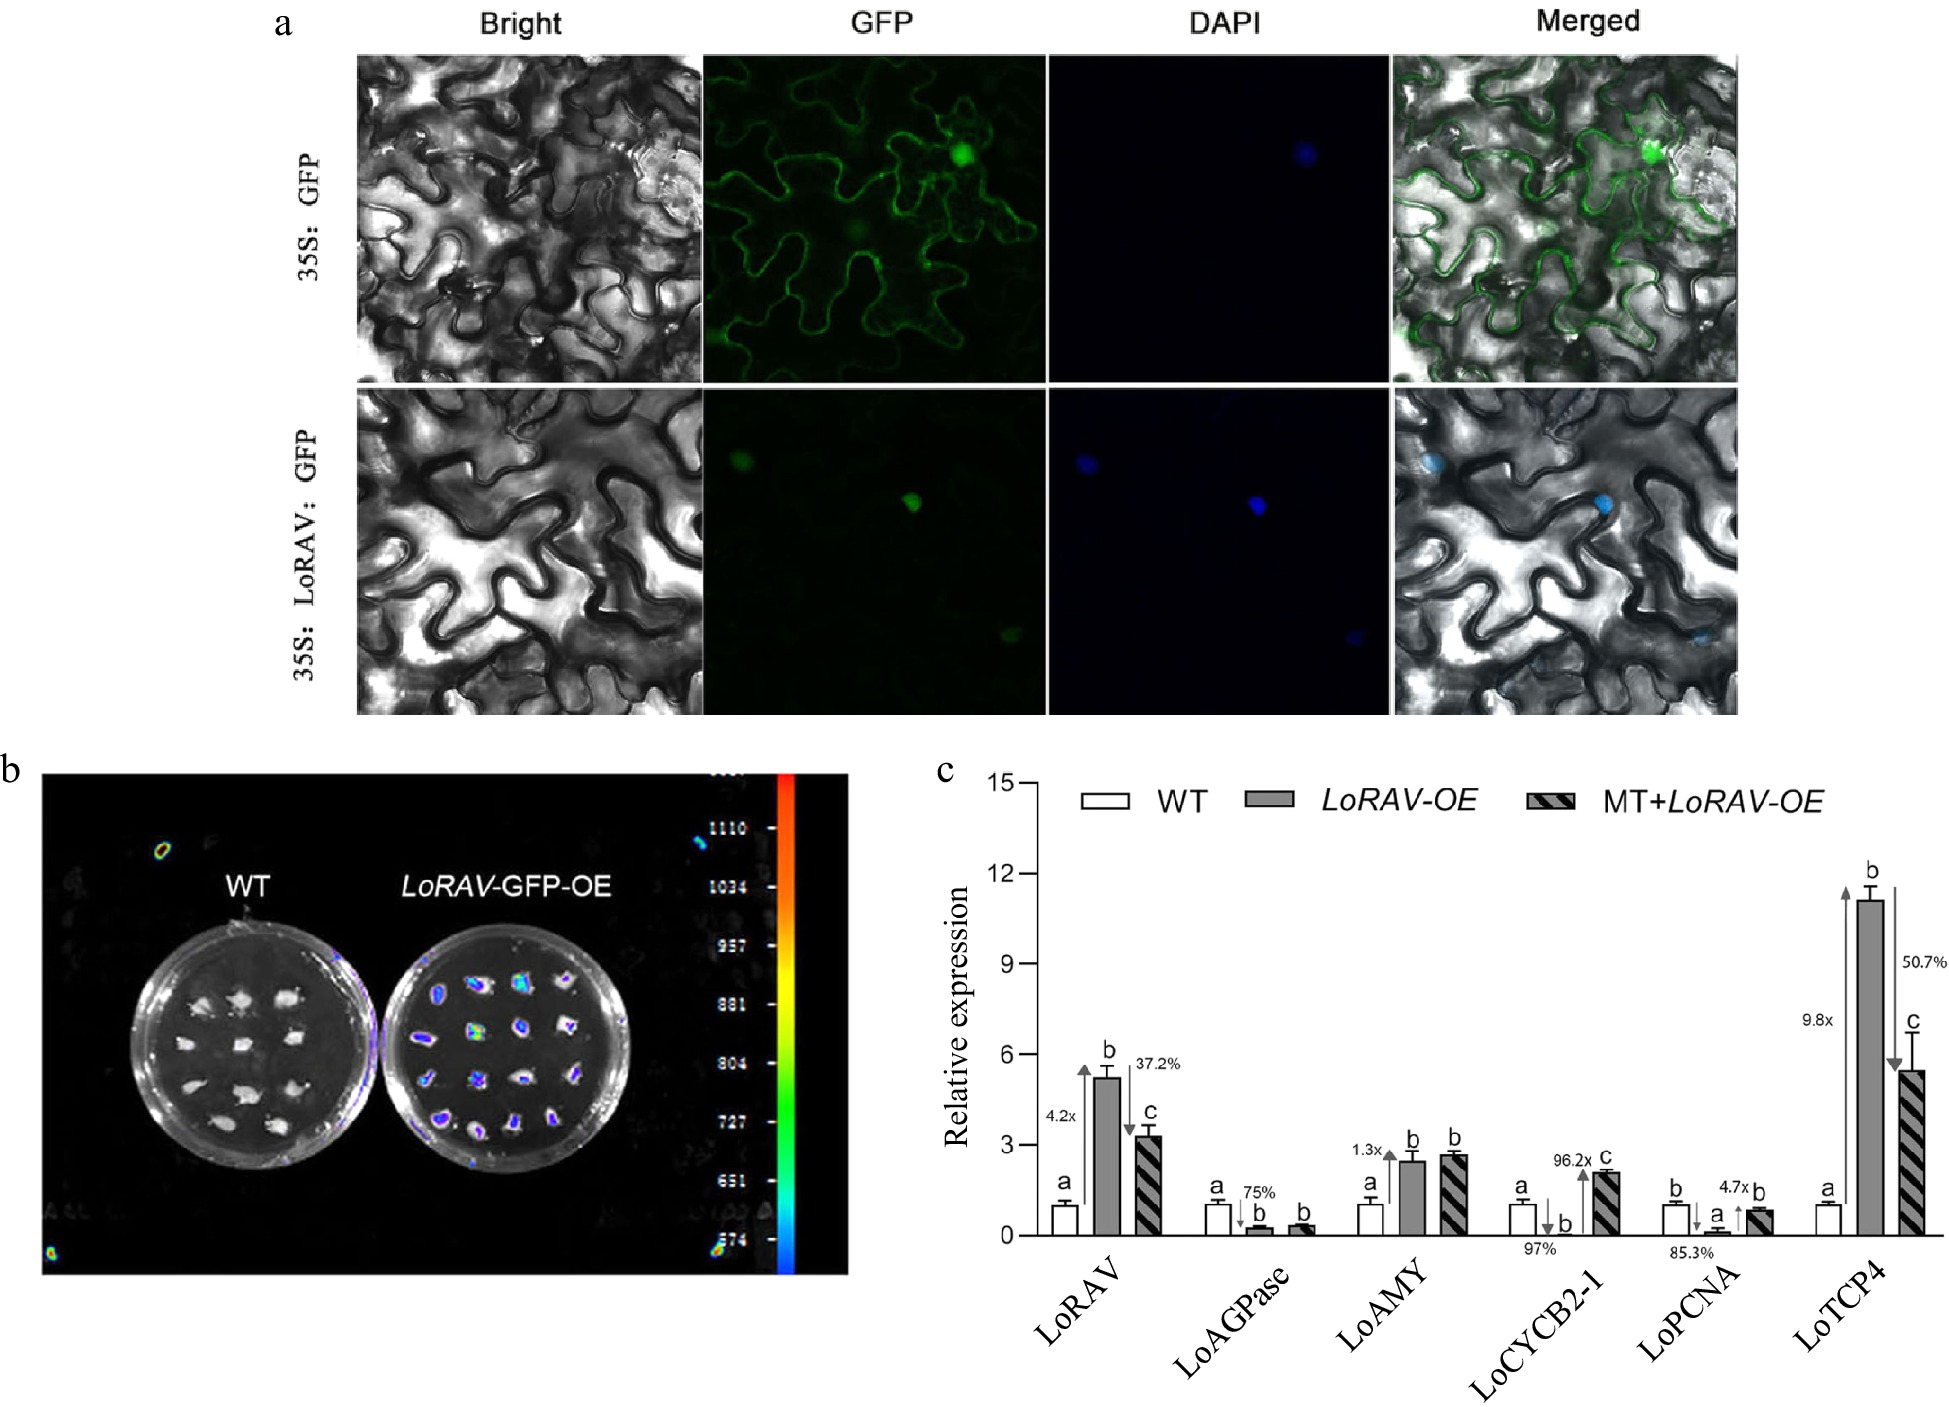
Figure 4.
Subcellular localization and functional analysis of LoRAV. (a) Transient transformation of tobacco leaves with pRI101-LoRAV-GFP; 35S:GFP served as a control. (b) Fluorescence detection after transient transformation of scales with pRI101-LoRAV-GFP. (c) The expression of cell proliferation and starch metabolism genes in bulblets with transient overexpression of LoRAV. White boxes indicate wild type (WT), gray boxes indicate LoRAV transient overexpression (LoRAV-OE), and slash boxes indicate that the LoRAV transient overexpression strain received 20 μM melatonin treatment (MT-LoRAV-OE). The expression levels were calculated relative to those of Lilium FP mRNA. Values are presented as the means of three replicates ± SD. Data were analyzed using one-way ANOVA followed by Duncan's test. Different lowercase letters indicate a significant difference (P < 0.05), and the same lowercase letters indicate no significance.
-
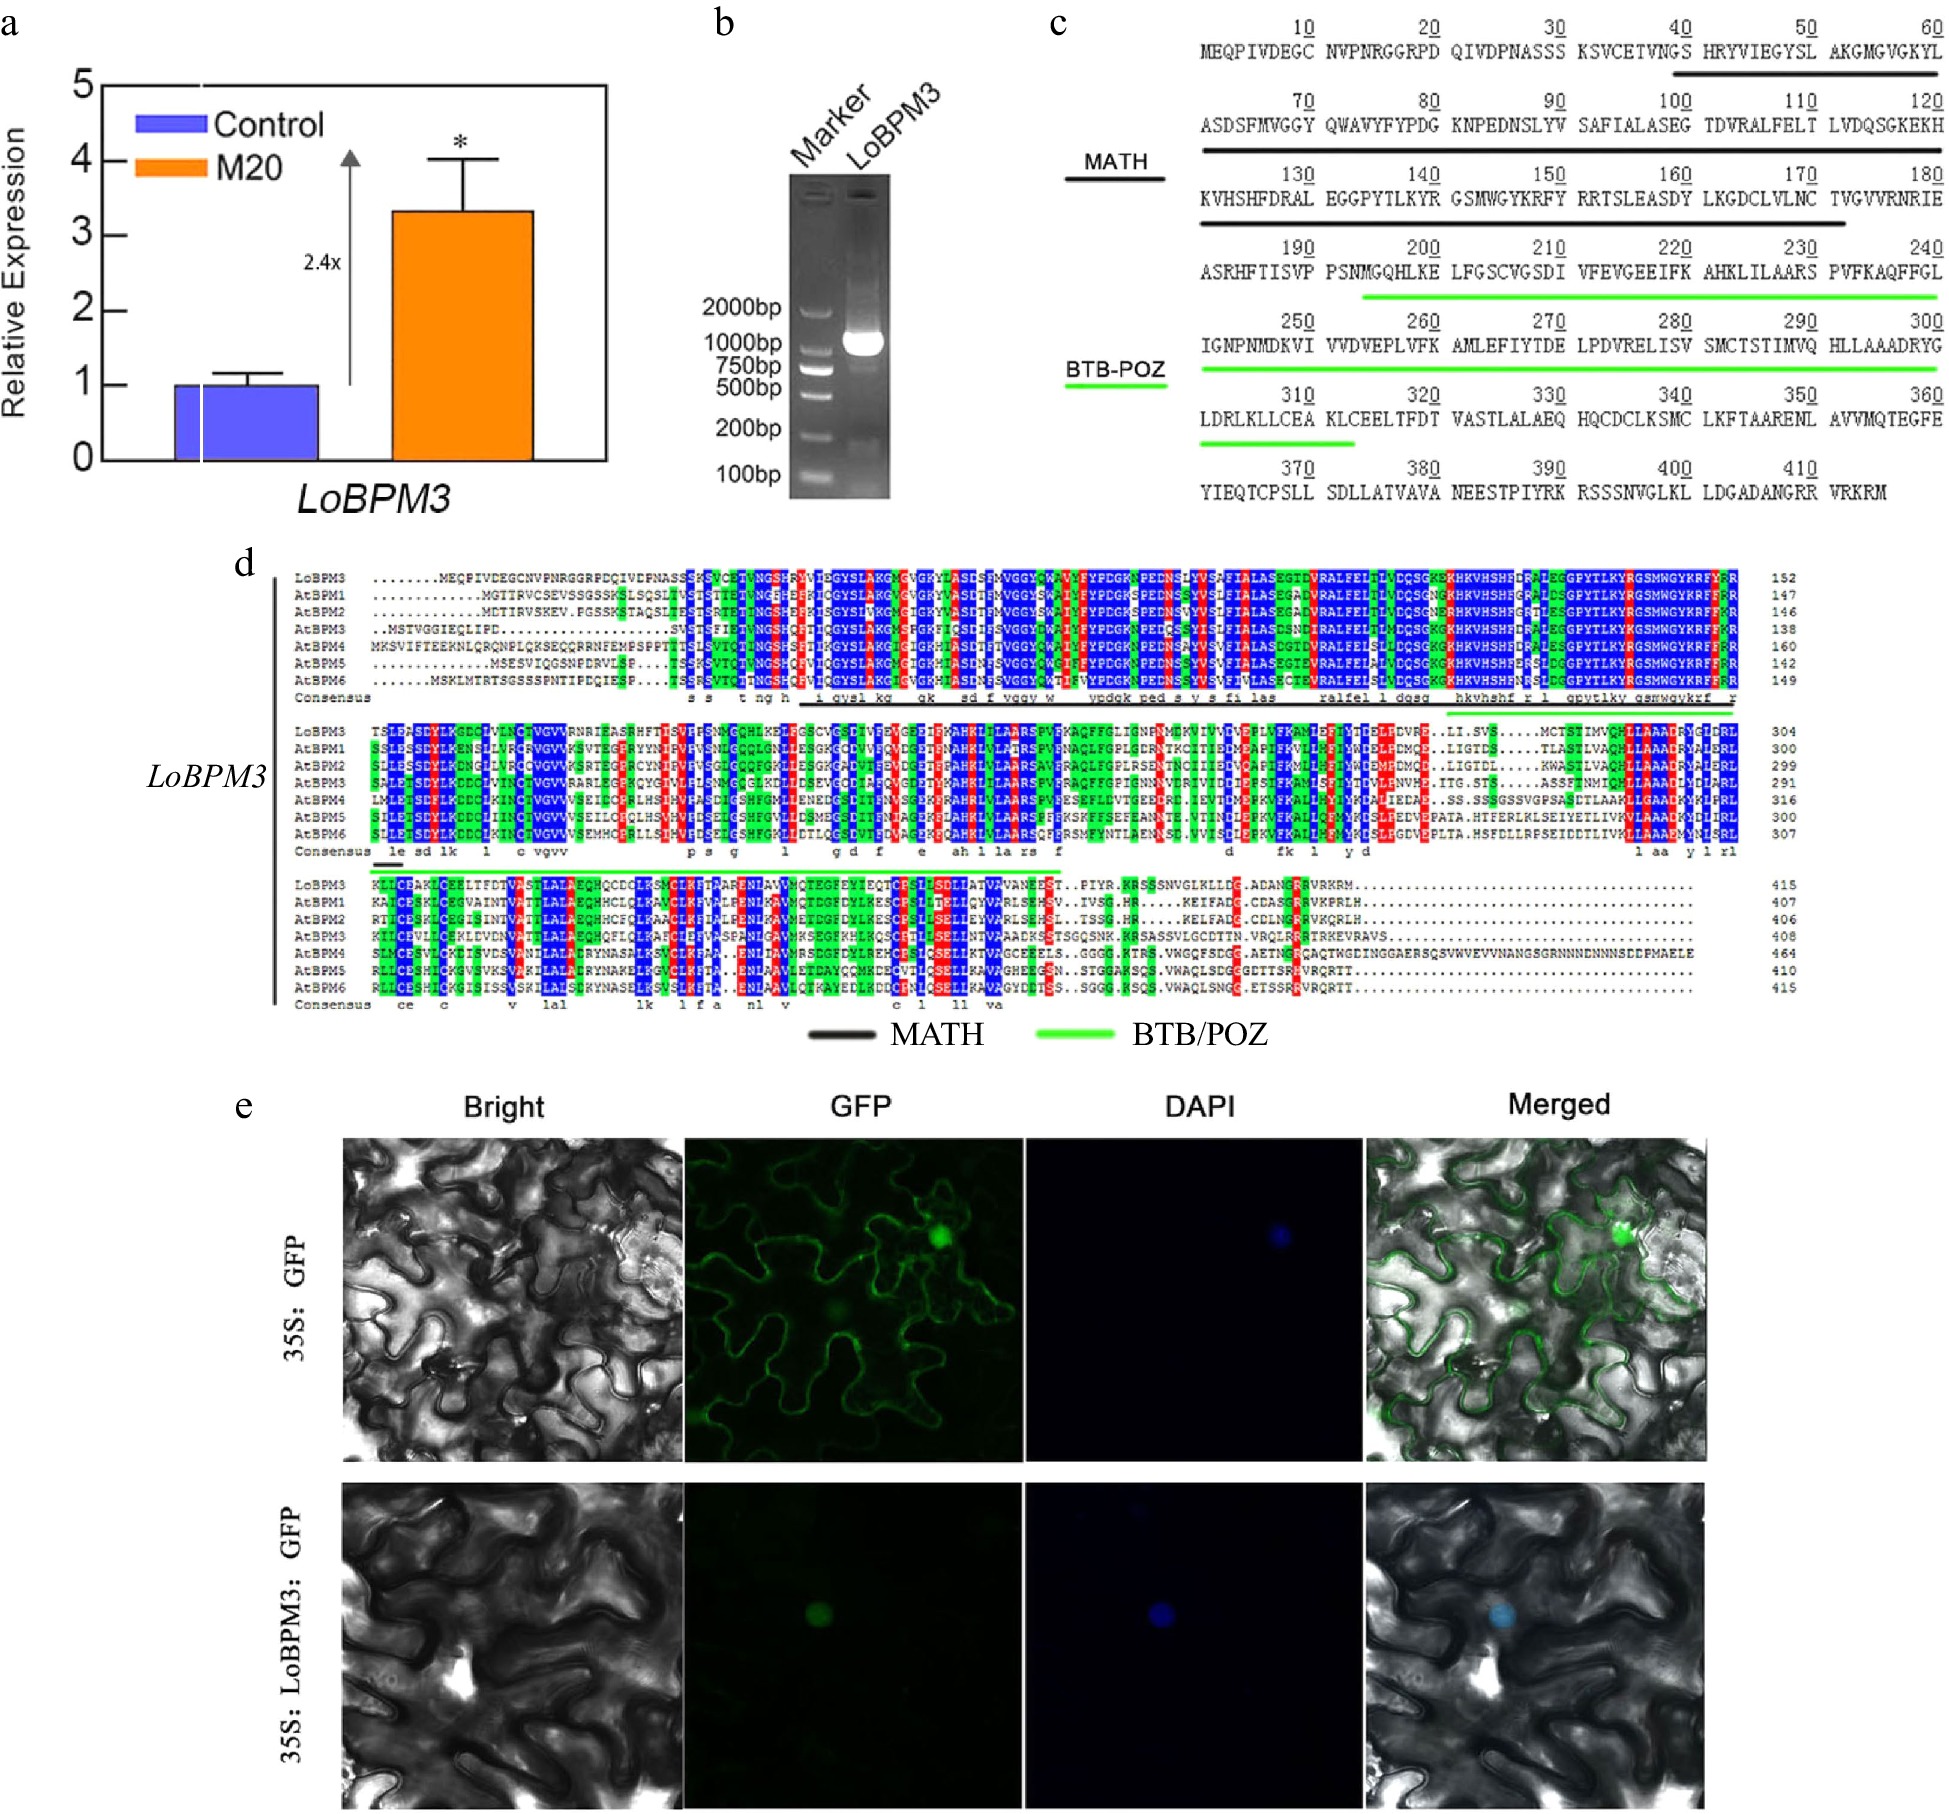
Figure 5.
The expression of LoBPM3, cloning, and amino acid sequence analysis. (a) The expression of the LoBPM3 gene in bulblets after 24 h of treatment of the control and 20 μM melatonin groups. Blue and orange boxes indicate control and 20 μM melatonin treatments, respectively. The expression levels were calculated relative to those of Lilium FP mRNA. Values are presented as the means of three replicates ± SD. Data were analyzed using one-way ANOVA followed by Duncan's test; * indicates a significant difference (P < 0.05). (b) The product of the LoBPM3 clone; the left lane is a 2000 bp DNA marker. (c) The amino acids of LoBPM3, black and green lines indicate the MATH and BTB-POZ structural domains, respectively. (d) Multiple sequence alignment of LoBPM3 with BPM family member genes of Arabidopsis. (e) Transient transformation of tobacco leaves with pRI101-LoBPM3-GFP; 35S:GFP served as a control.
-
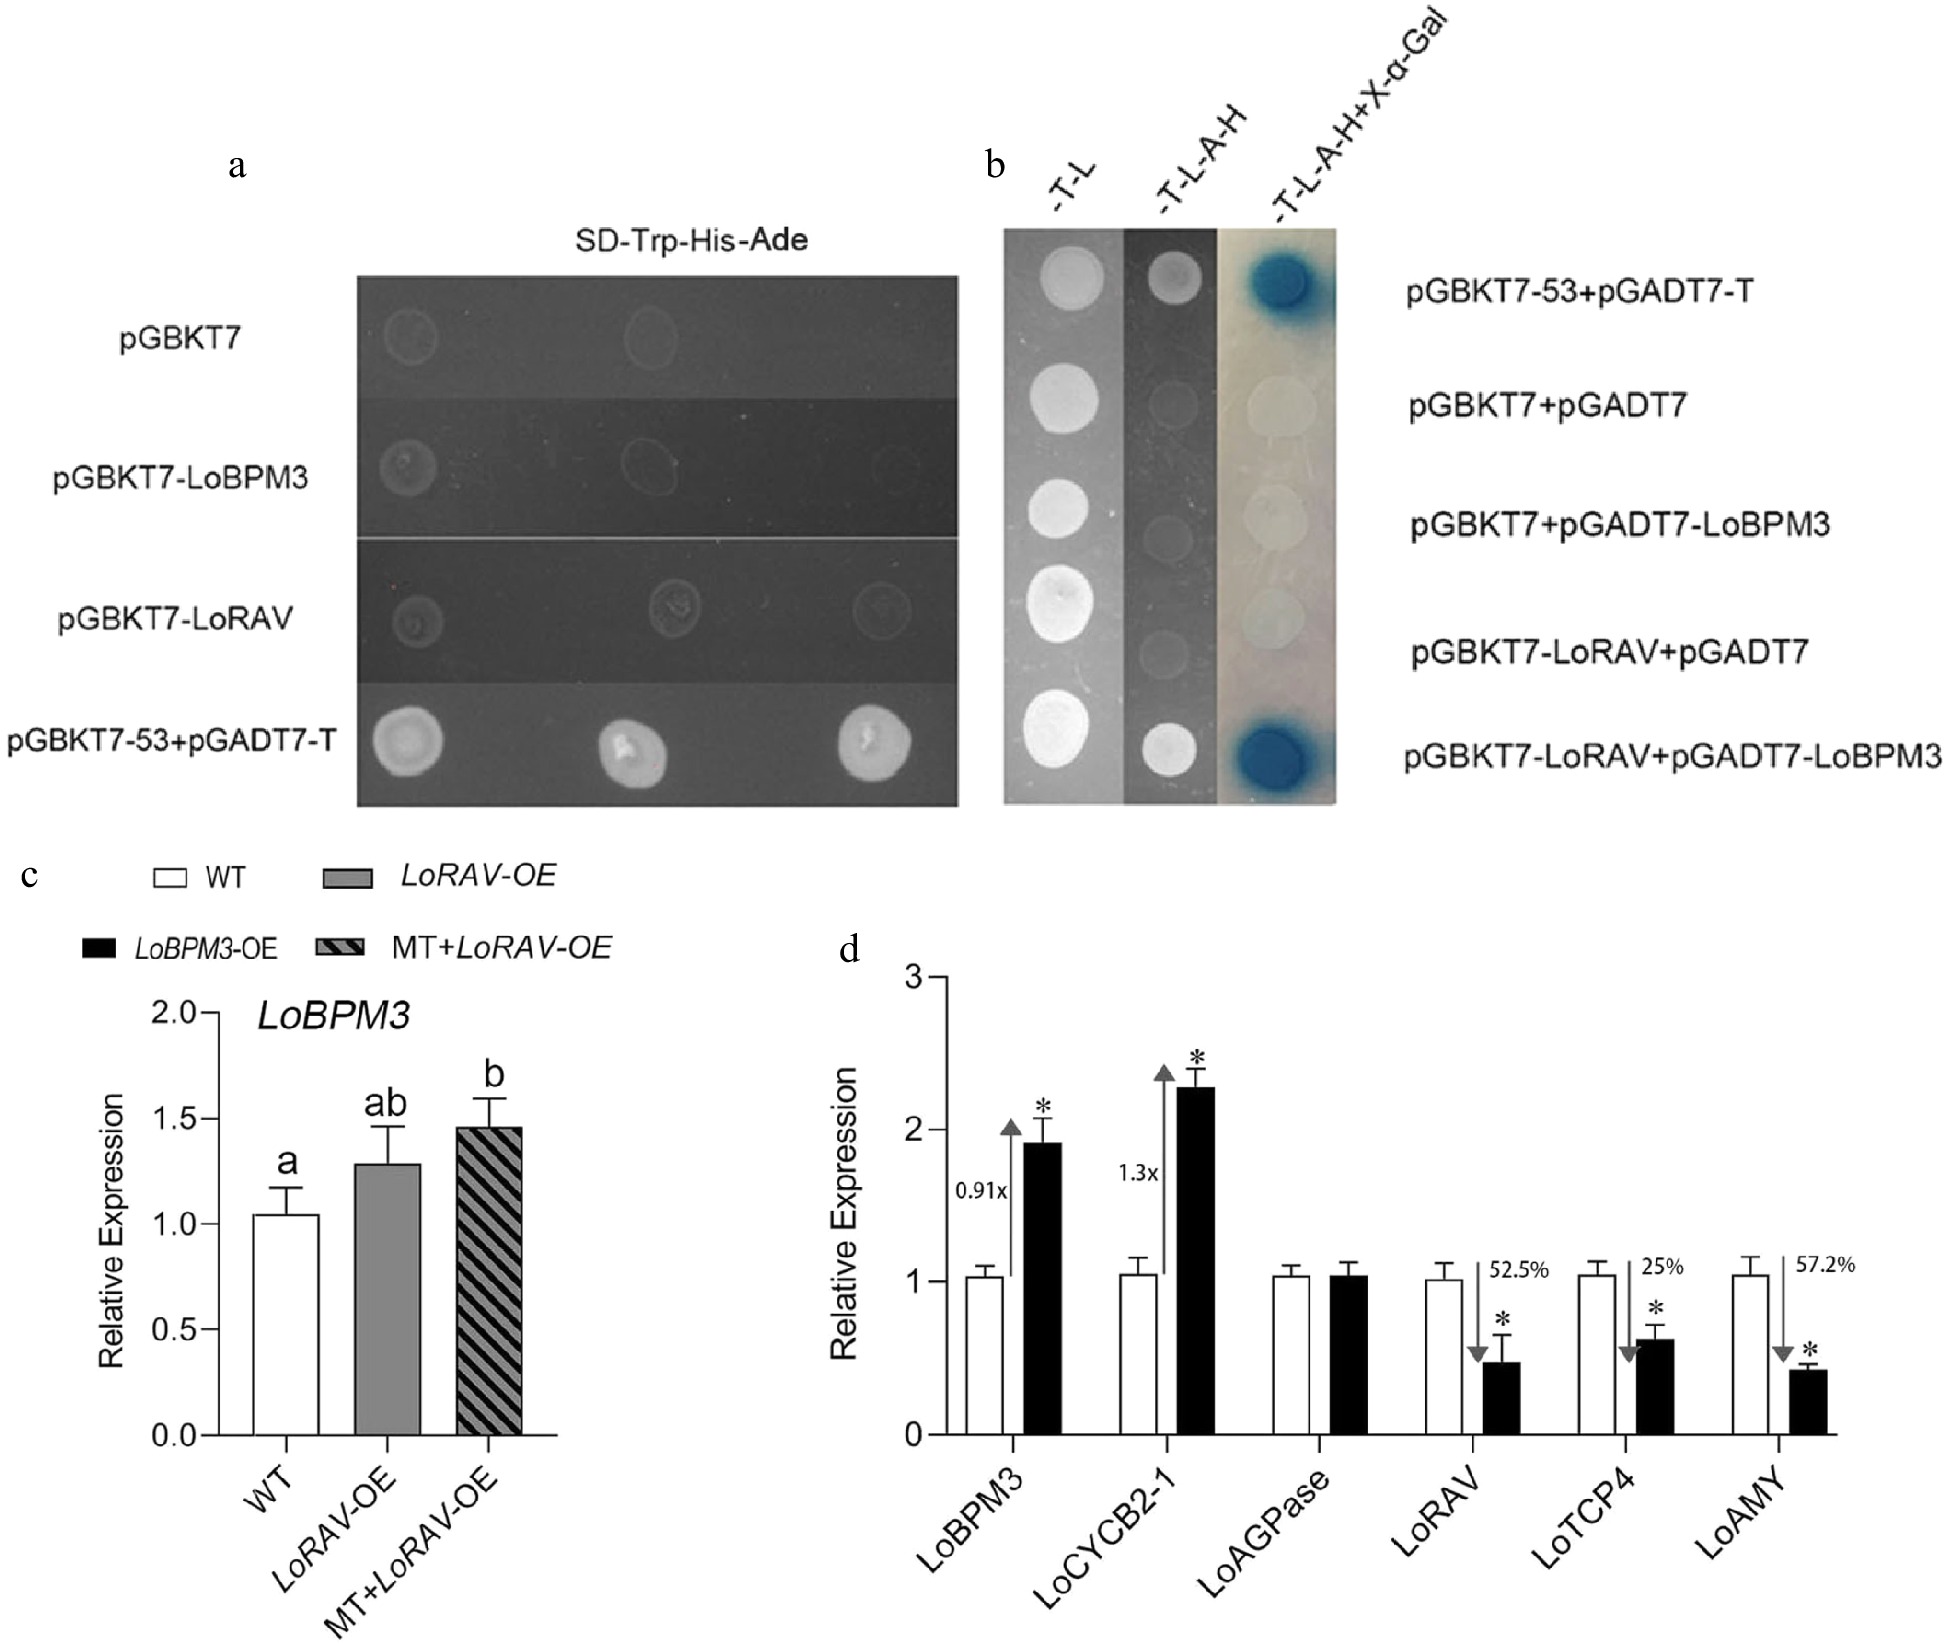
Figure 6.
Analysis of the transcriptional activation of LoRAV and LoBPM3 and their correlation. (a), (b) Fragments of LoRAV and LoBPM3 were ligated into the pGBKT vector (BD, binding domain), and LoBPM3 was ligated into the pGADT7 vector (AD, activation domain). -T-L, SD medium lacking Trp and Leu; -T-L-A-H, SD medium lacking Trp, Leu, His and Ade; -T-L-A-H+X-α-Gal, -T-L-A-H medium containing X-a-gal, and pGBKT7+pGADT7 were used as negative controls (Empty BD+Empty AD). pGBKT53 and pGADT7-T were used as positive controls. The blue plaque indicates the interaction between two proteins. (c) Upstream and downstream relationship between LoRAV and LoBPM3. White boxes indicate the wild-type (WT) strain, gray boxes indicate LoRAV transient overexpression lines (LoRAV-OE), and slashed boxes indicate LoRAV transient overexpression lines that received 20 μM melatonin treatment (MT-LoRAV-OE). (d) The expression of cell proliferation and starch metabolism genes in bulblets with transient overexpression of LoBPM3. Black boxes indicate the LoBPM3 transient overexpression strain (LoBPM3-OE). The expression levels were calculated relative to those of Lilium FP mRNA. Values are presented as the means of three replicates ± SD. Data were analyzed using one-way ANOVA followed by Duncan's test. Different lowercase letters and * indicate a significant difference (P < 0.05), and the same lowercase letters indicate no significance.
-
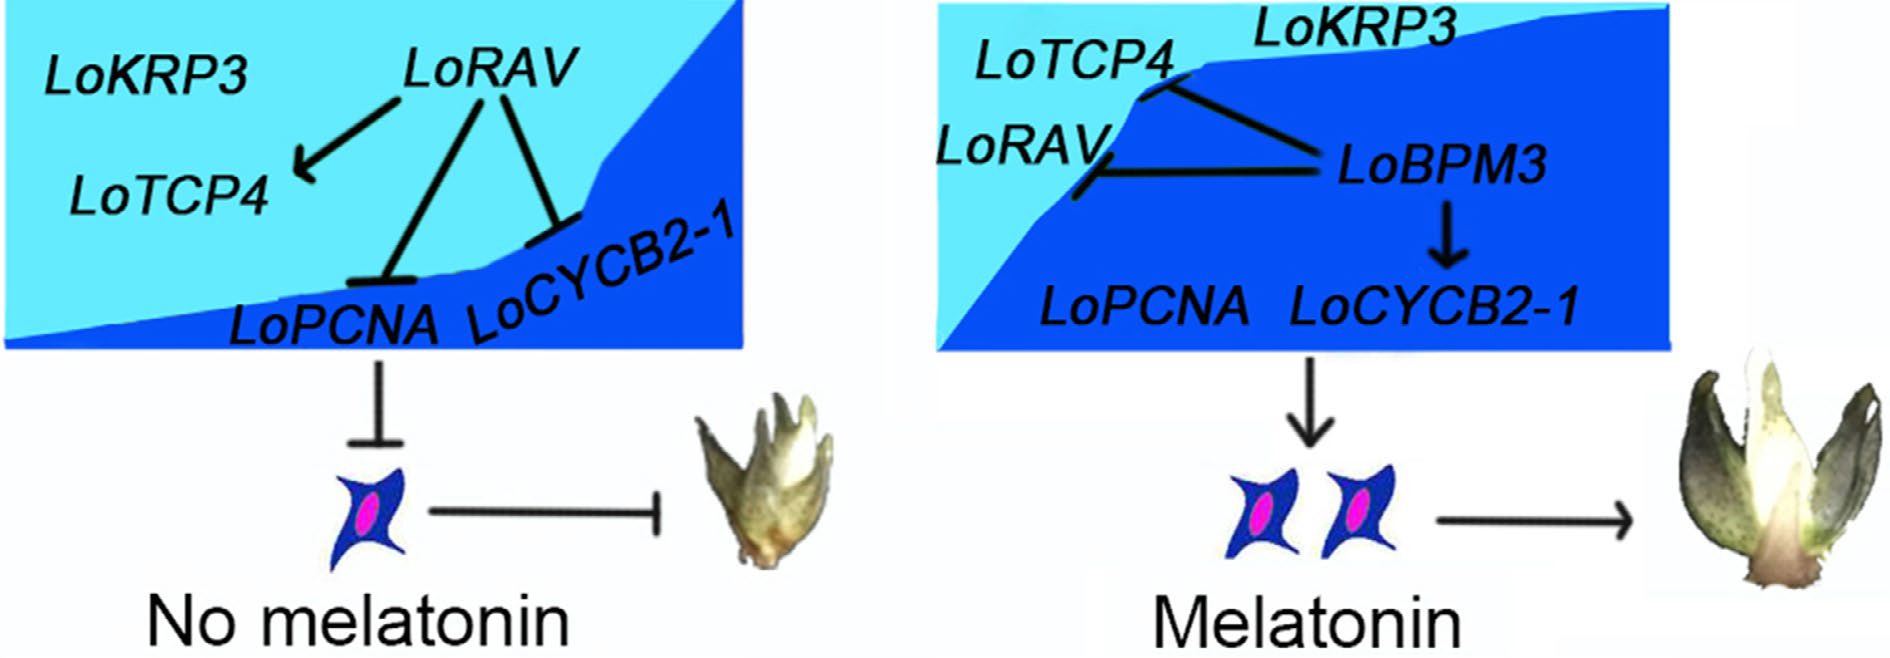
Figure 7.
A working model of melatonin regulating bulb development by mediating cell proliferation. Dark blue and arrows indicate positive interactions, and light blue and flat lines indicate negative interactions.
Figures
(7)
Tables
(0)