-
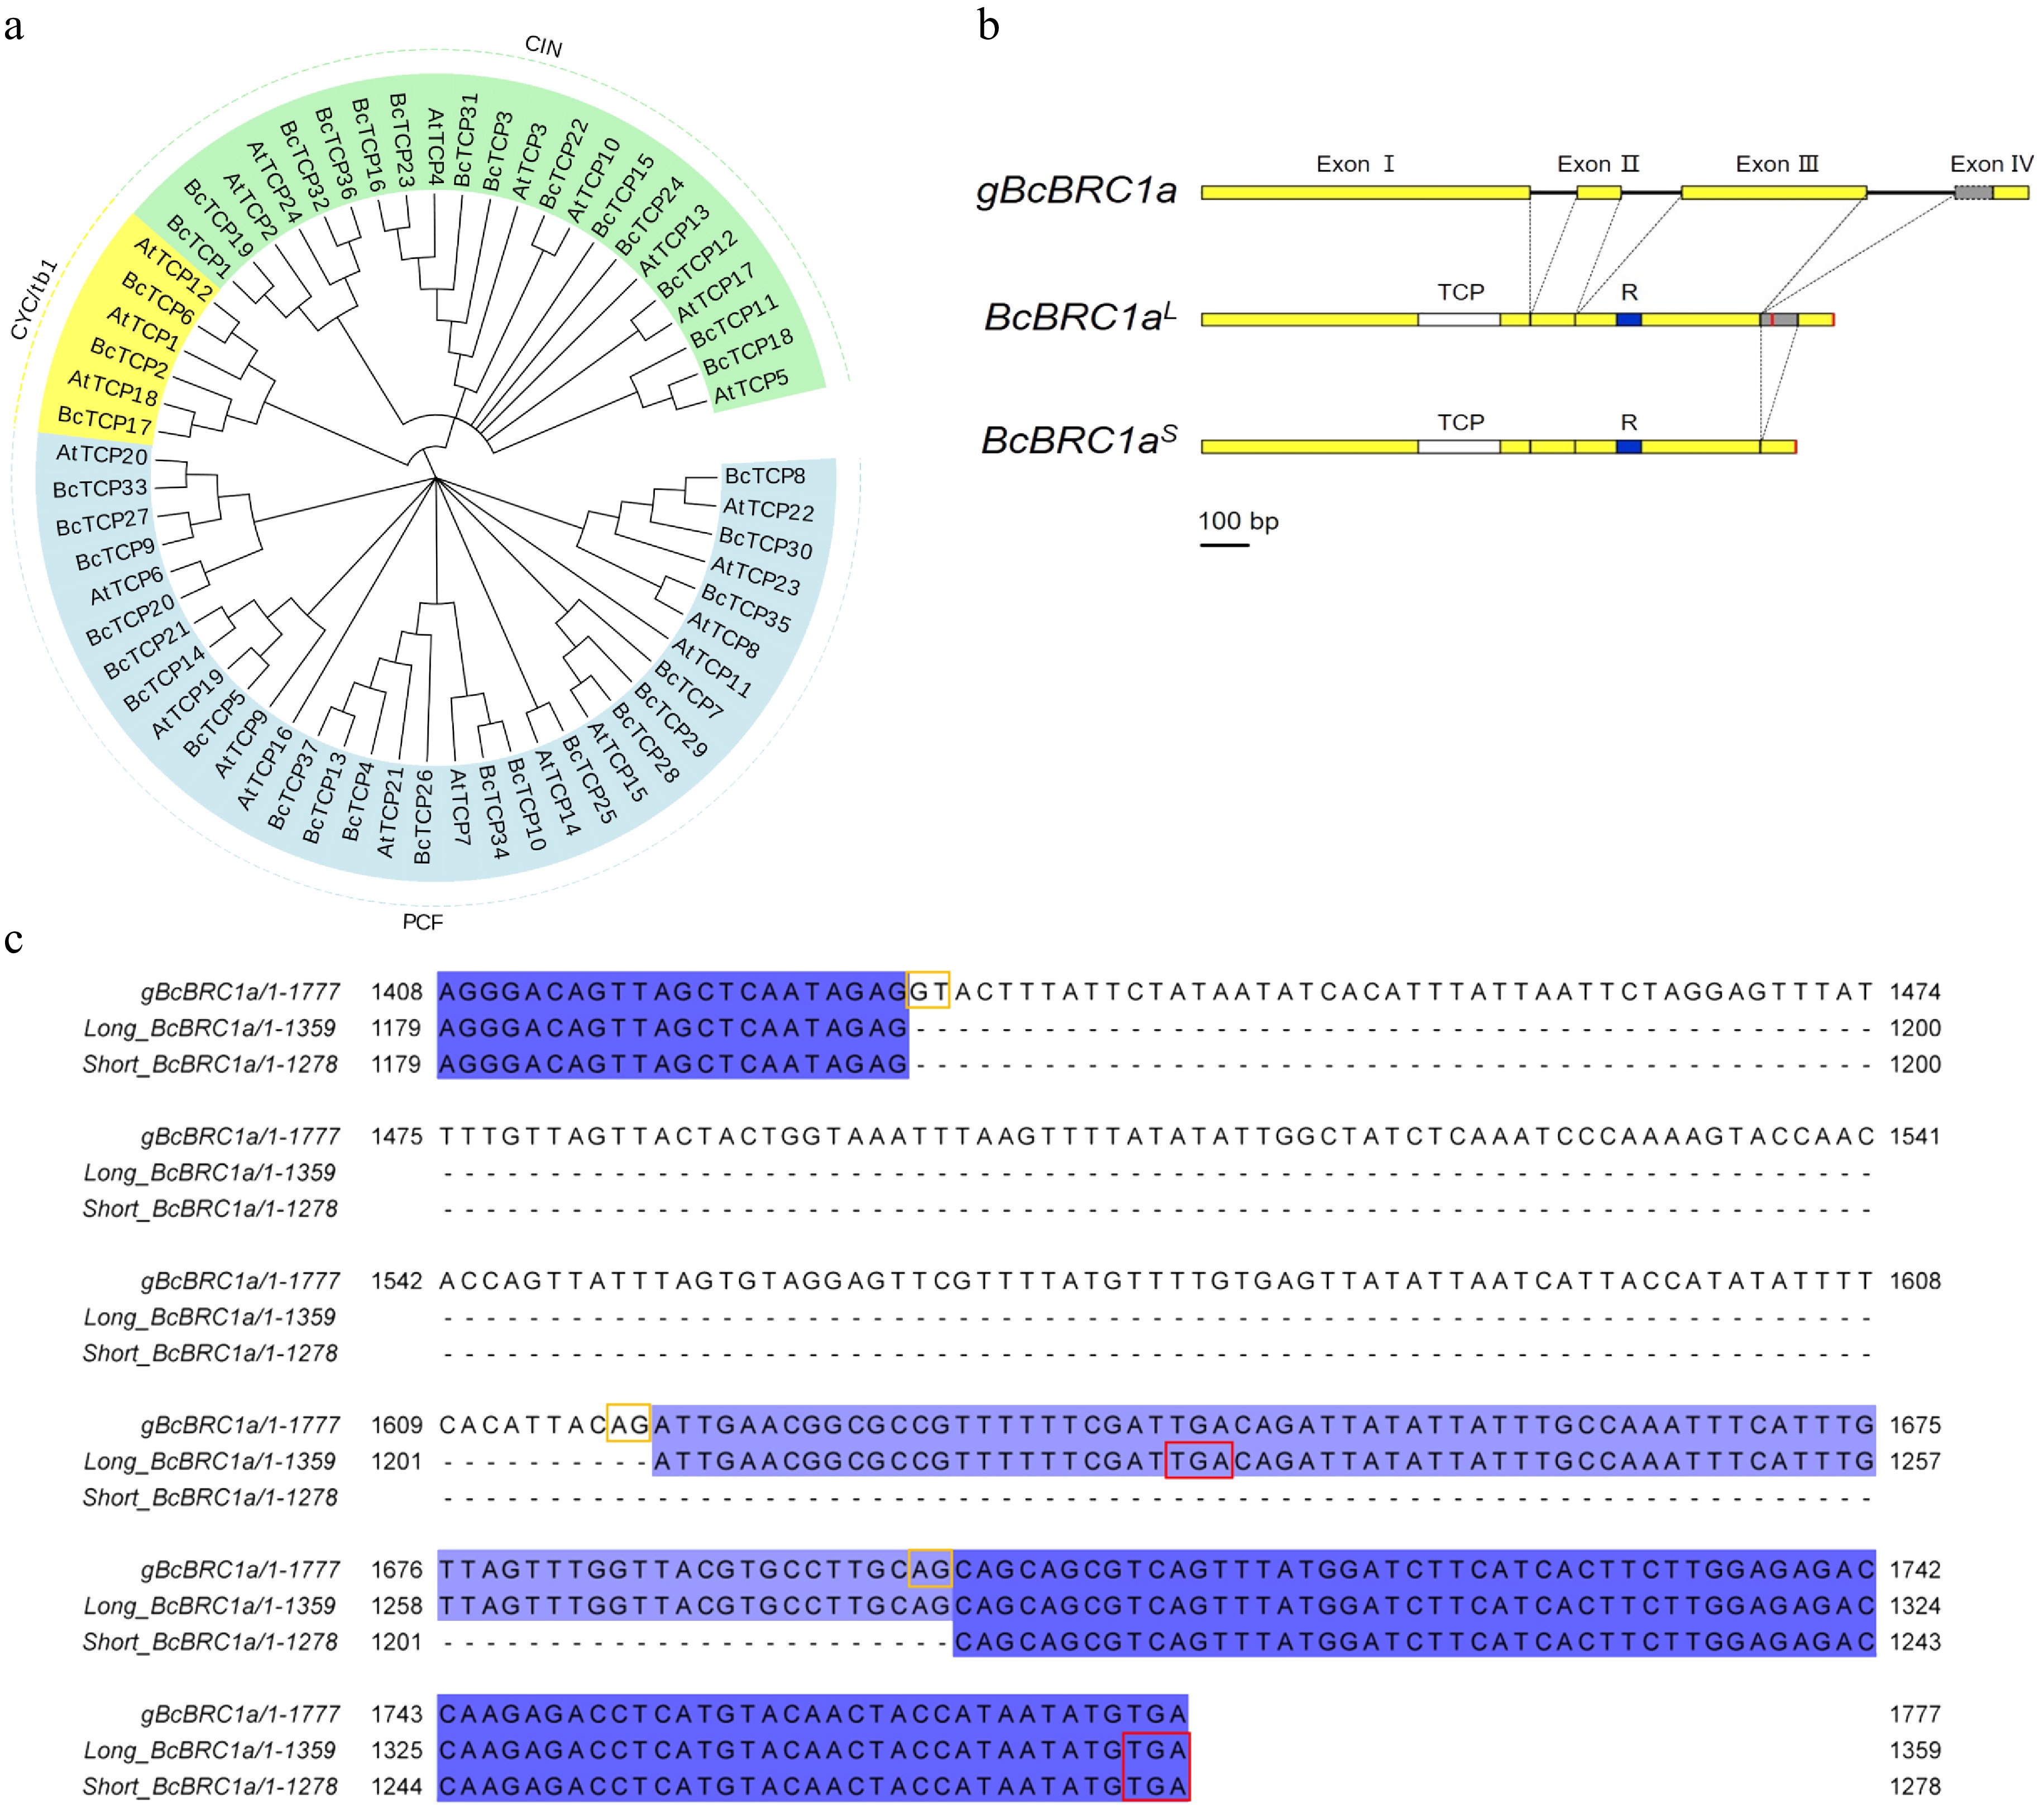
Figure 1.
TCP family analysis and BcBRC1a gene structure and partial sequence. (a) Phylogenetic tree showing relationships between TCP family transcription factors in B. campestris and A. thaliana. Blue, yellow and green backgrounds represent PCF, CYC/tb1 and CIN clades respectively. AtTCP18 is BRC1, BcTCP17 is BcBRC1a and BcTCP2 is BcBRC1b. (b) BcBRC1a gene structure. Yellow boxes represent exons and black lines represent introns. Grey box is alternative splicing region. TCP and R domain are filled with white and blue, respectively. The red color indicates termination codon. Scale bar = 100 bp. (c) BcBRC1a 3’ end sequence. Termination codons are bounded by red squares and alternative splicing sites are bounded by yellow squares.
-
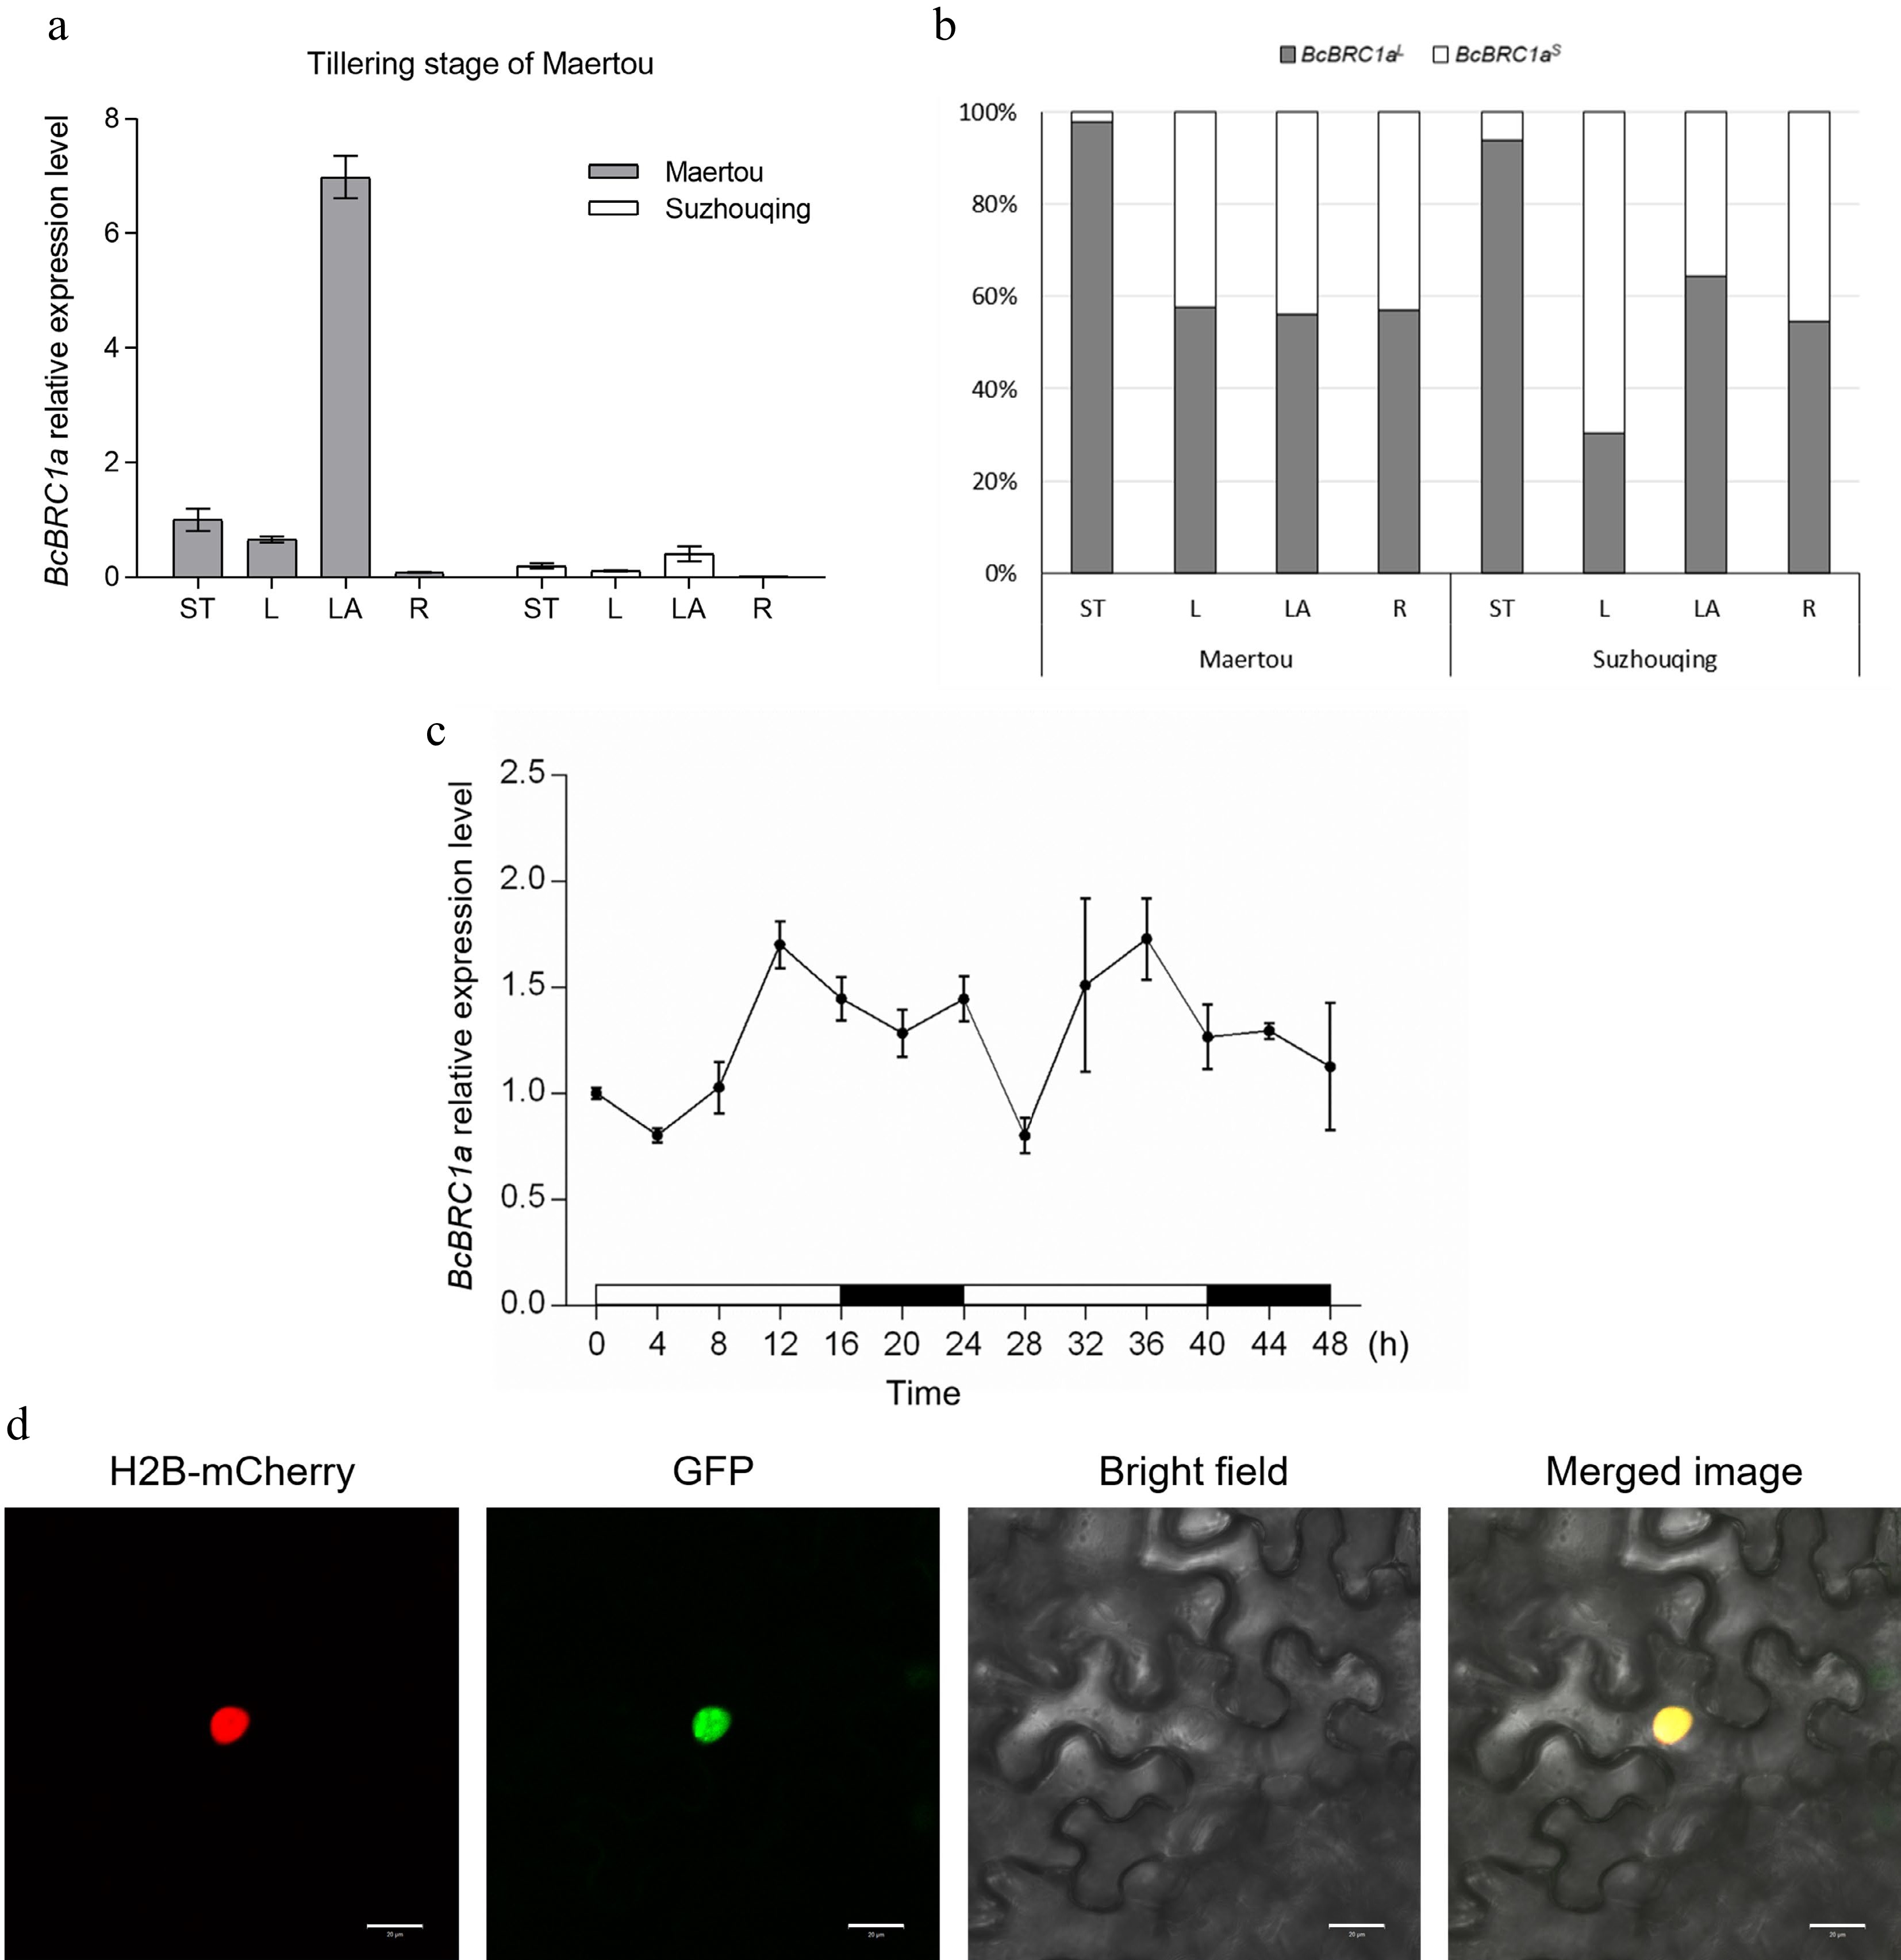
Figure 2.
Expression pattern of BcBRC1a in 'Maertou' and 'Suzhouqing' at the 'Maertou' tillering stage. (a) BcBRC1a relative expression level within four tissues. ST, shoot tip; L, leaf; LA, leaf axil; R, root. Error bars represent SE. (b) Proportion of BcBRC1aL and BcBRC1aS expression within four tissues. (c) Circadian expression of BcBRC1a. White bars represent daylight and black bars represent darkness. Error bars represent SE. (d) Subcellular location of BcBRC1aL. Scale bar = 20 μm.
-
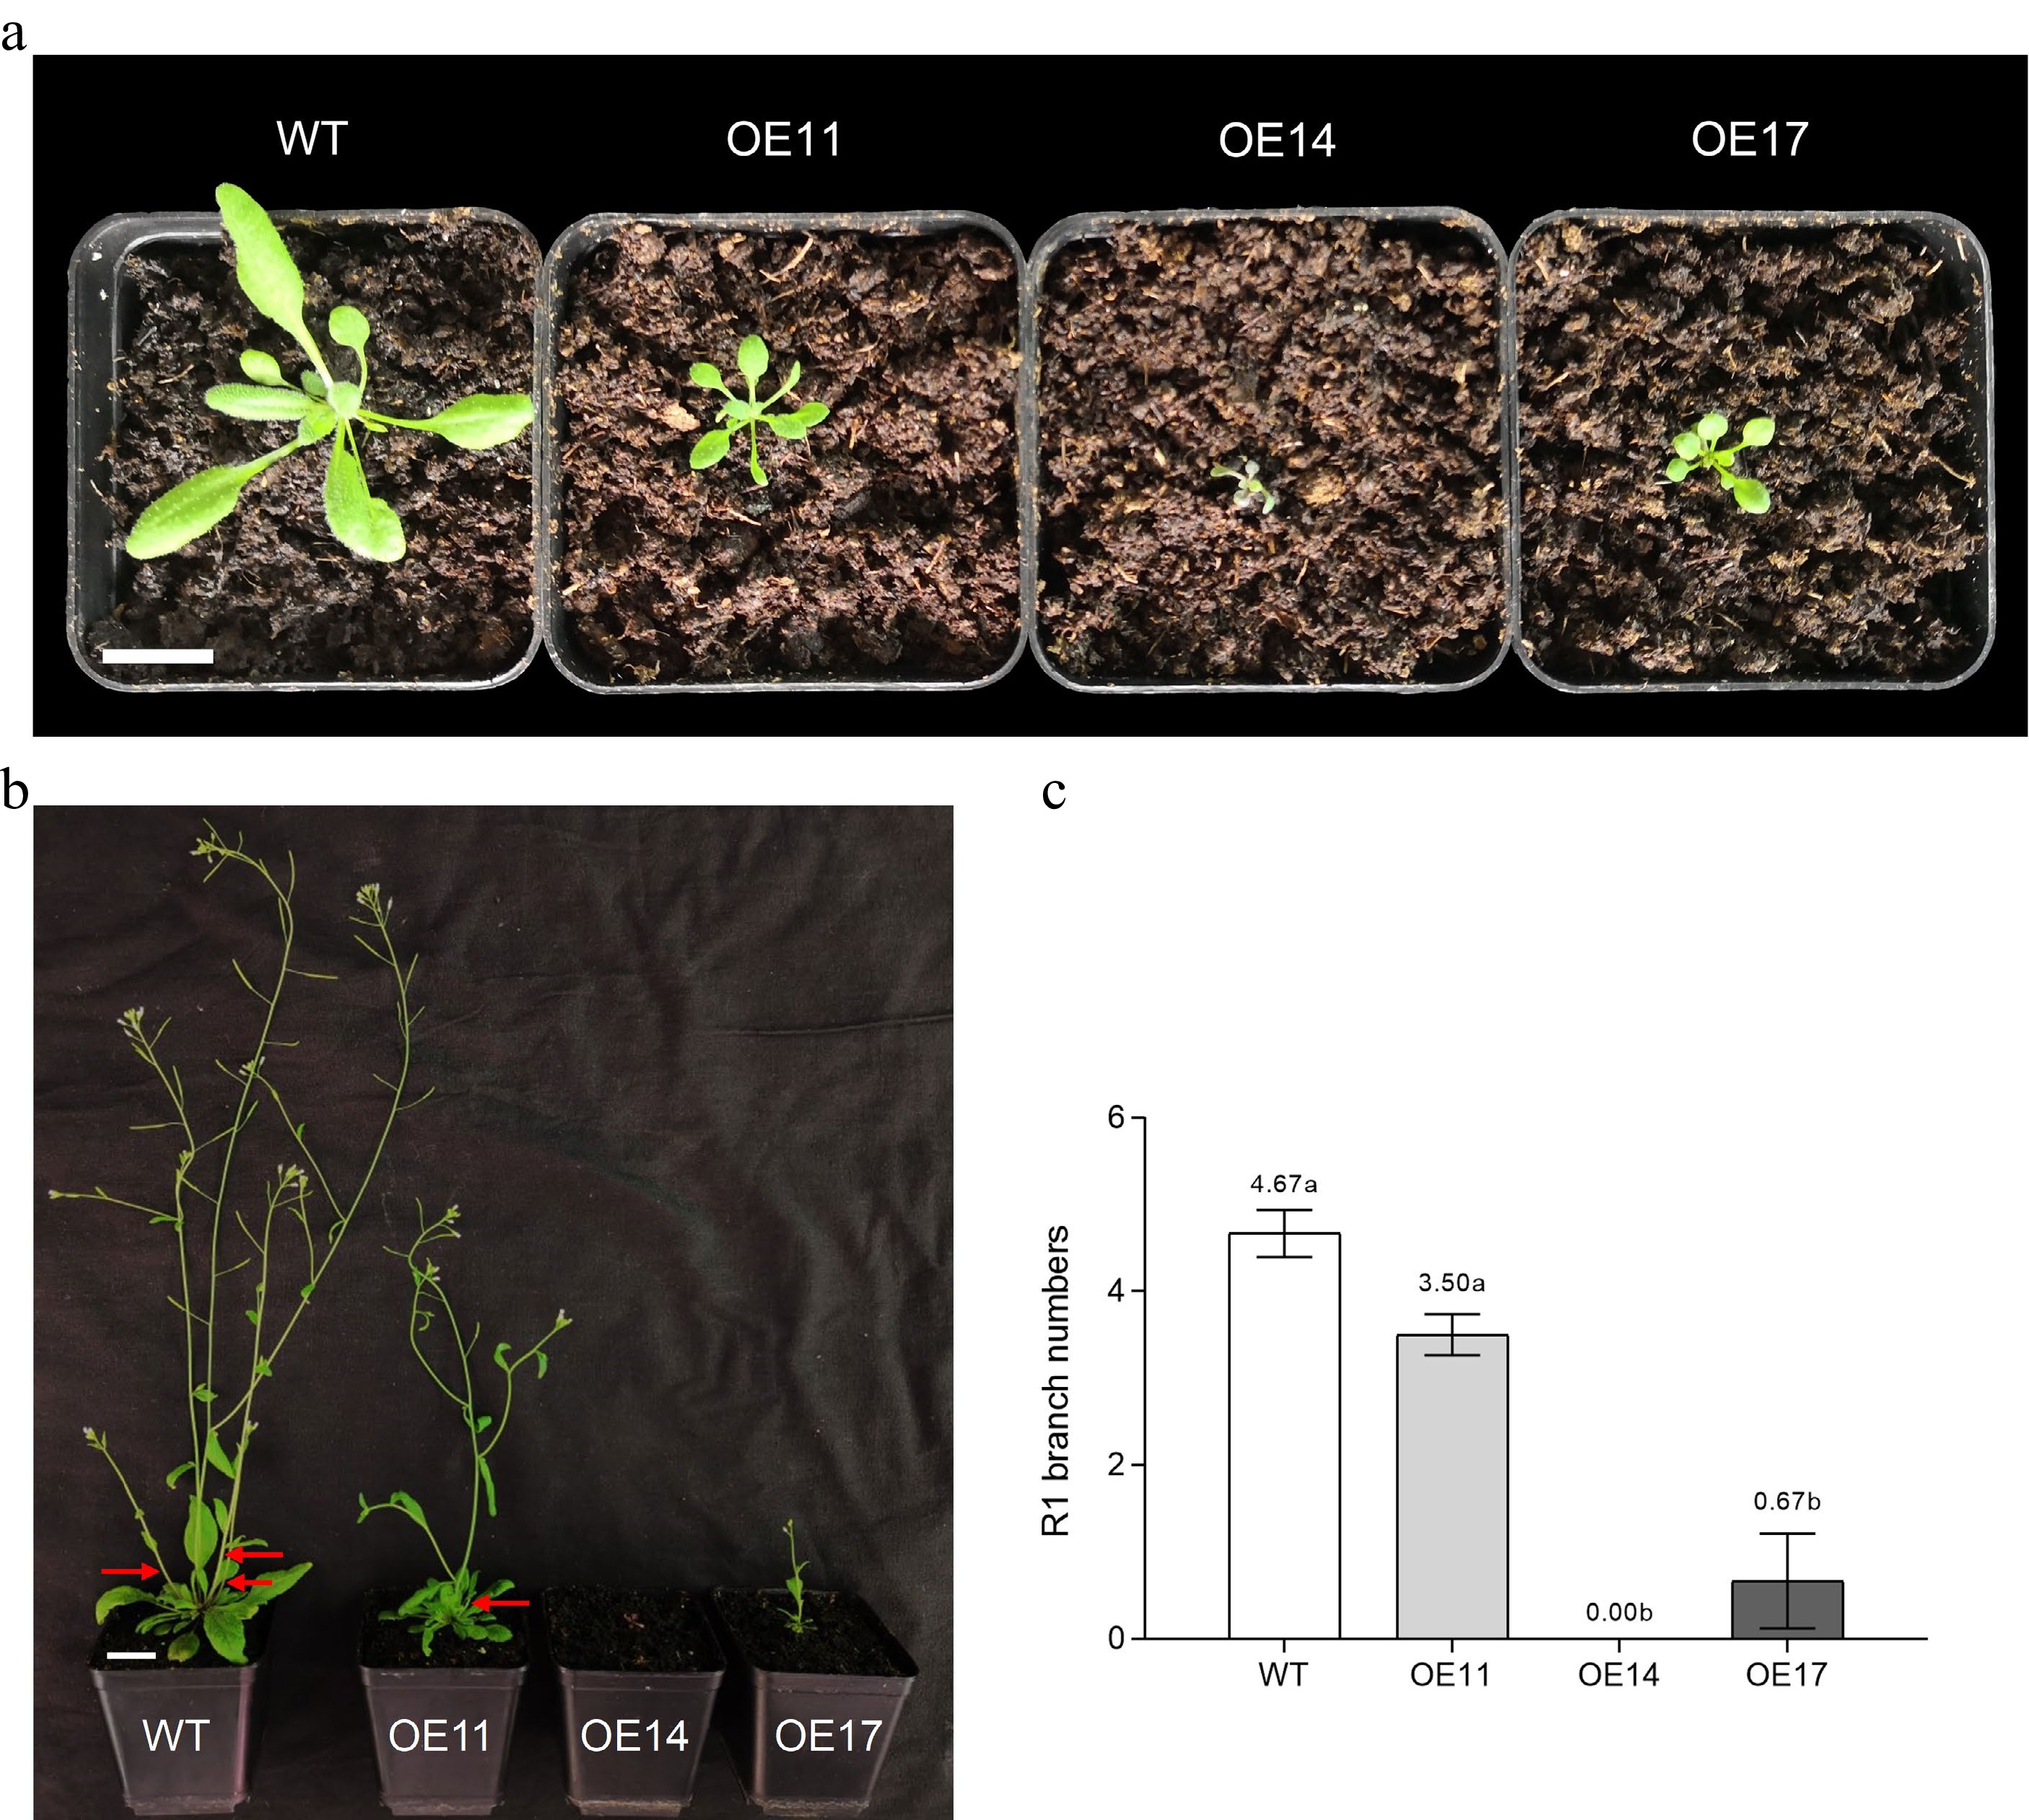
Figure 3.
Overexpression of BcBRC1aL in Arabidopsis (T2 lines). (a) Phenotype during vegetative period. Scale bar = 2 cm. (b) Phenotype during reproductive period. Red arrows indicate primary rosette-leaf (R1) branches. Scale bar = 2 cm. (c) R1 branch numbers of Arabidopsis transgenic lines. Three biological replicates, α = 0.05.
-
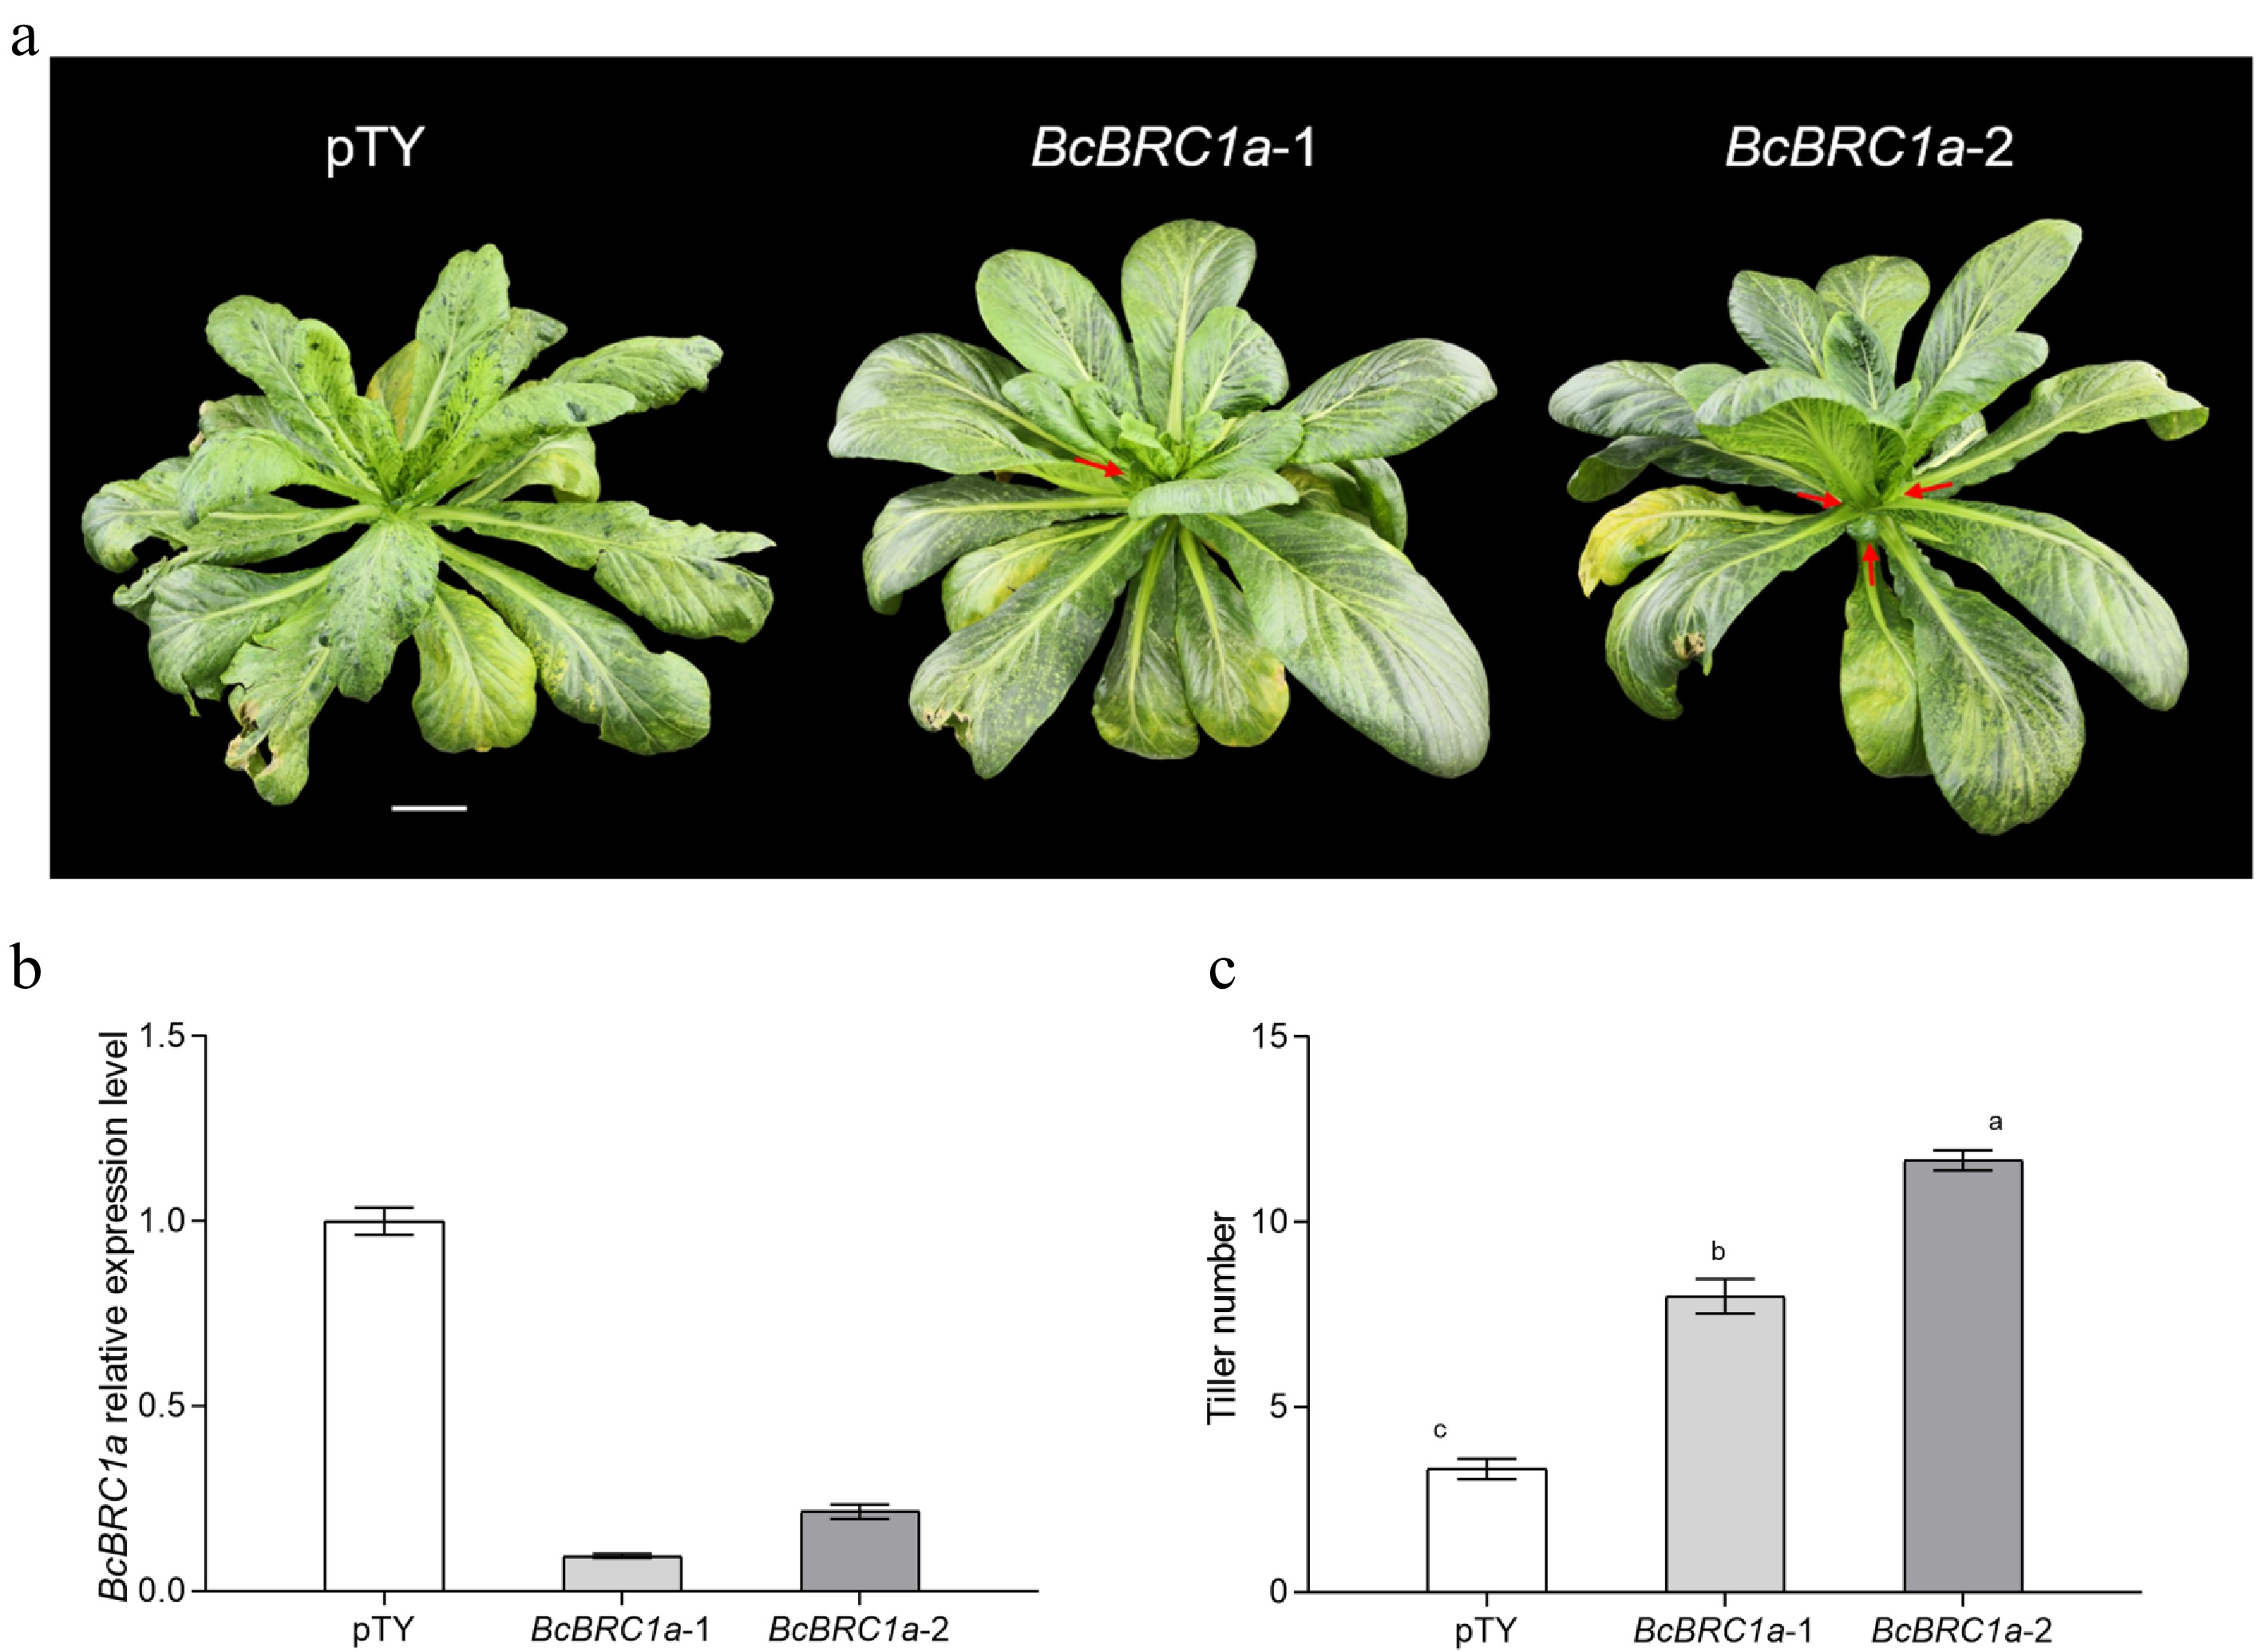
Figure 4.
BcBRC1a silencing in 'Maertou'. (a) Phenotype of ‘Maertou’ after silencing BcBRC1a. Scale bar = 2 cm. Red arrows indicate tillers. BcBRC1a relative expression level (b) and tiller numers (c) of BcBRC1a silencing plants. Three biological replicates, α = 0.05.
-
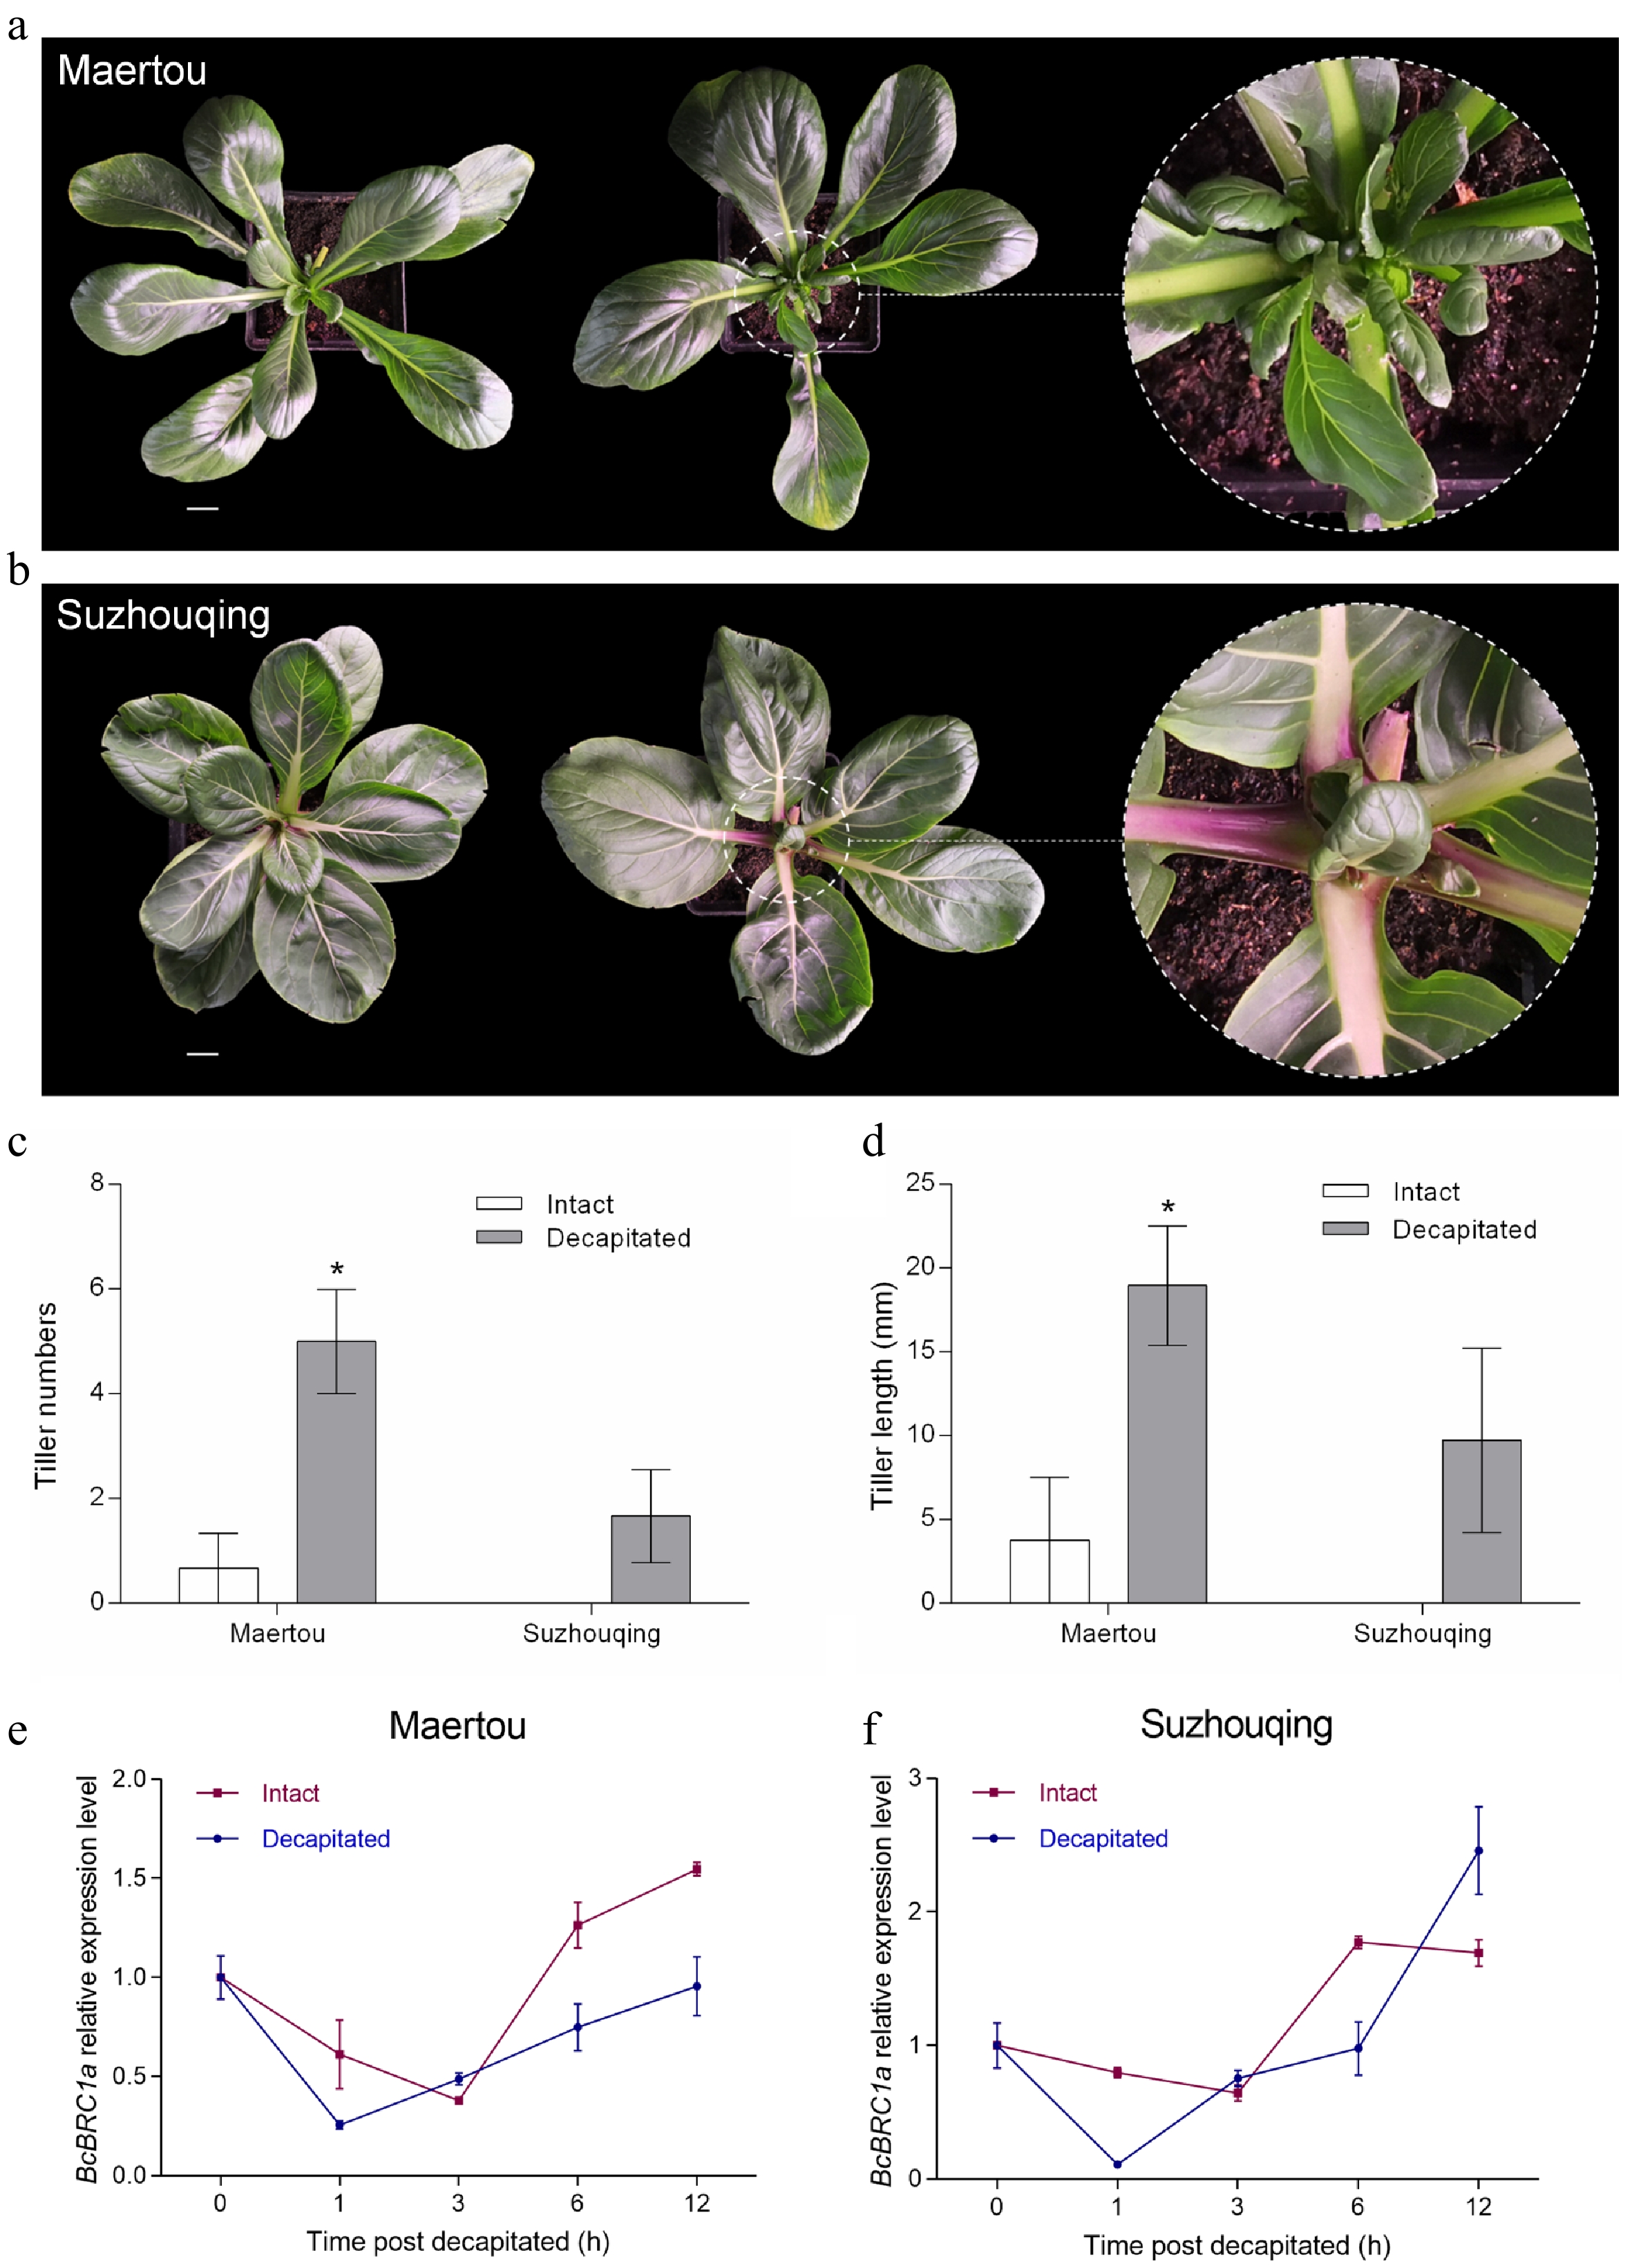
Figure 5.
Decapitated treatment for NHCC. ‘Maertou’ (a) and ‘Suzhouqing’ (b) tillering phenotype after 10 d of decapitation. Scale bars = 2 cm. Left, intact plant; right, decapitated plant. Tiller numbers (c) and length (d) of ‘Maertou’ and ‘Suzhouqing’ after 7 d of decapitation. Error bars represent SE (the same below). BcBRC1a expression in ‘Maertou’ (e) and ‘Suzhouqing’ (f) responds to decapitation. * represents P < 0.05.
Figures
(5)
Tables
(0)