-
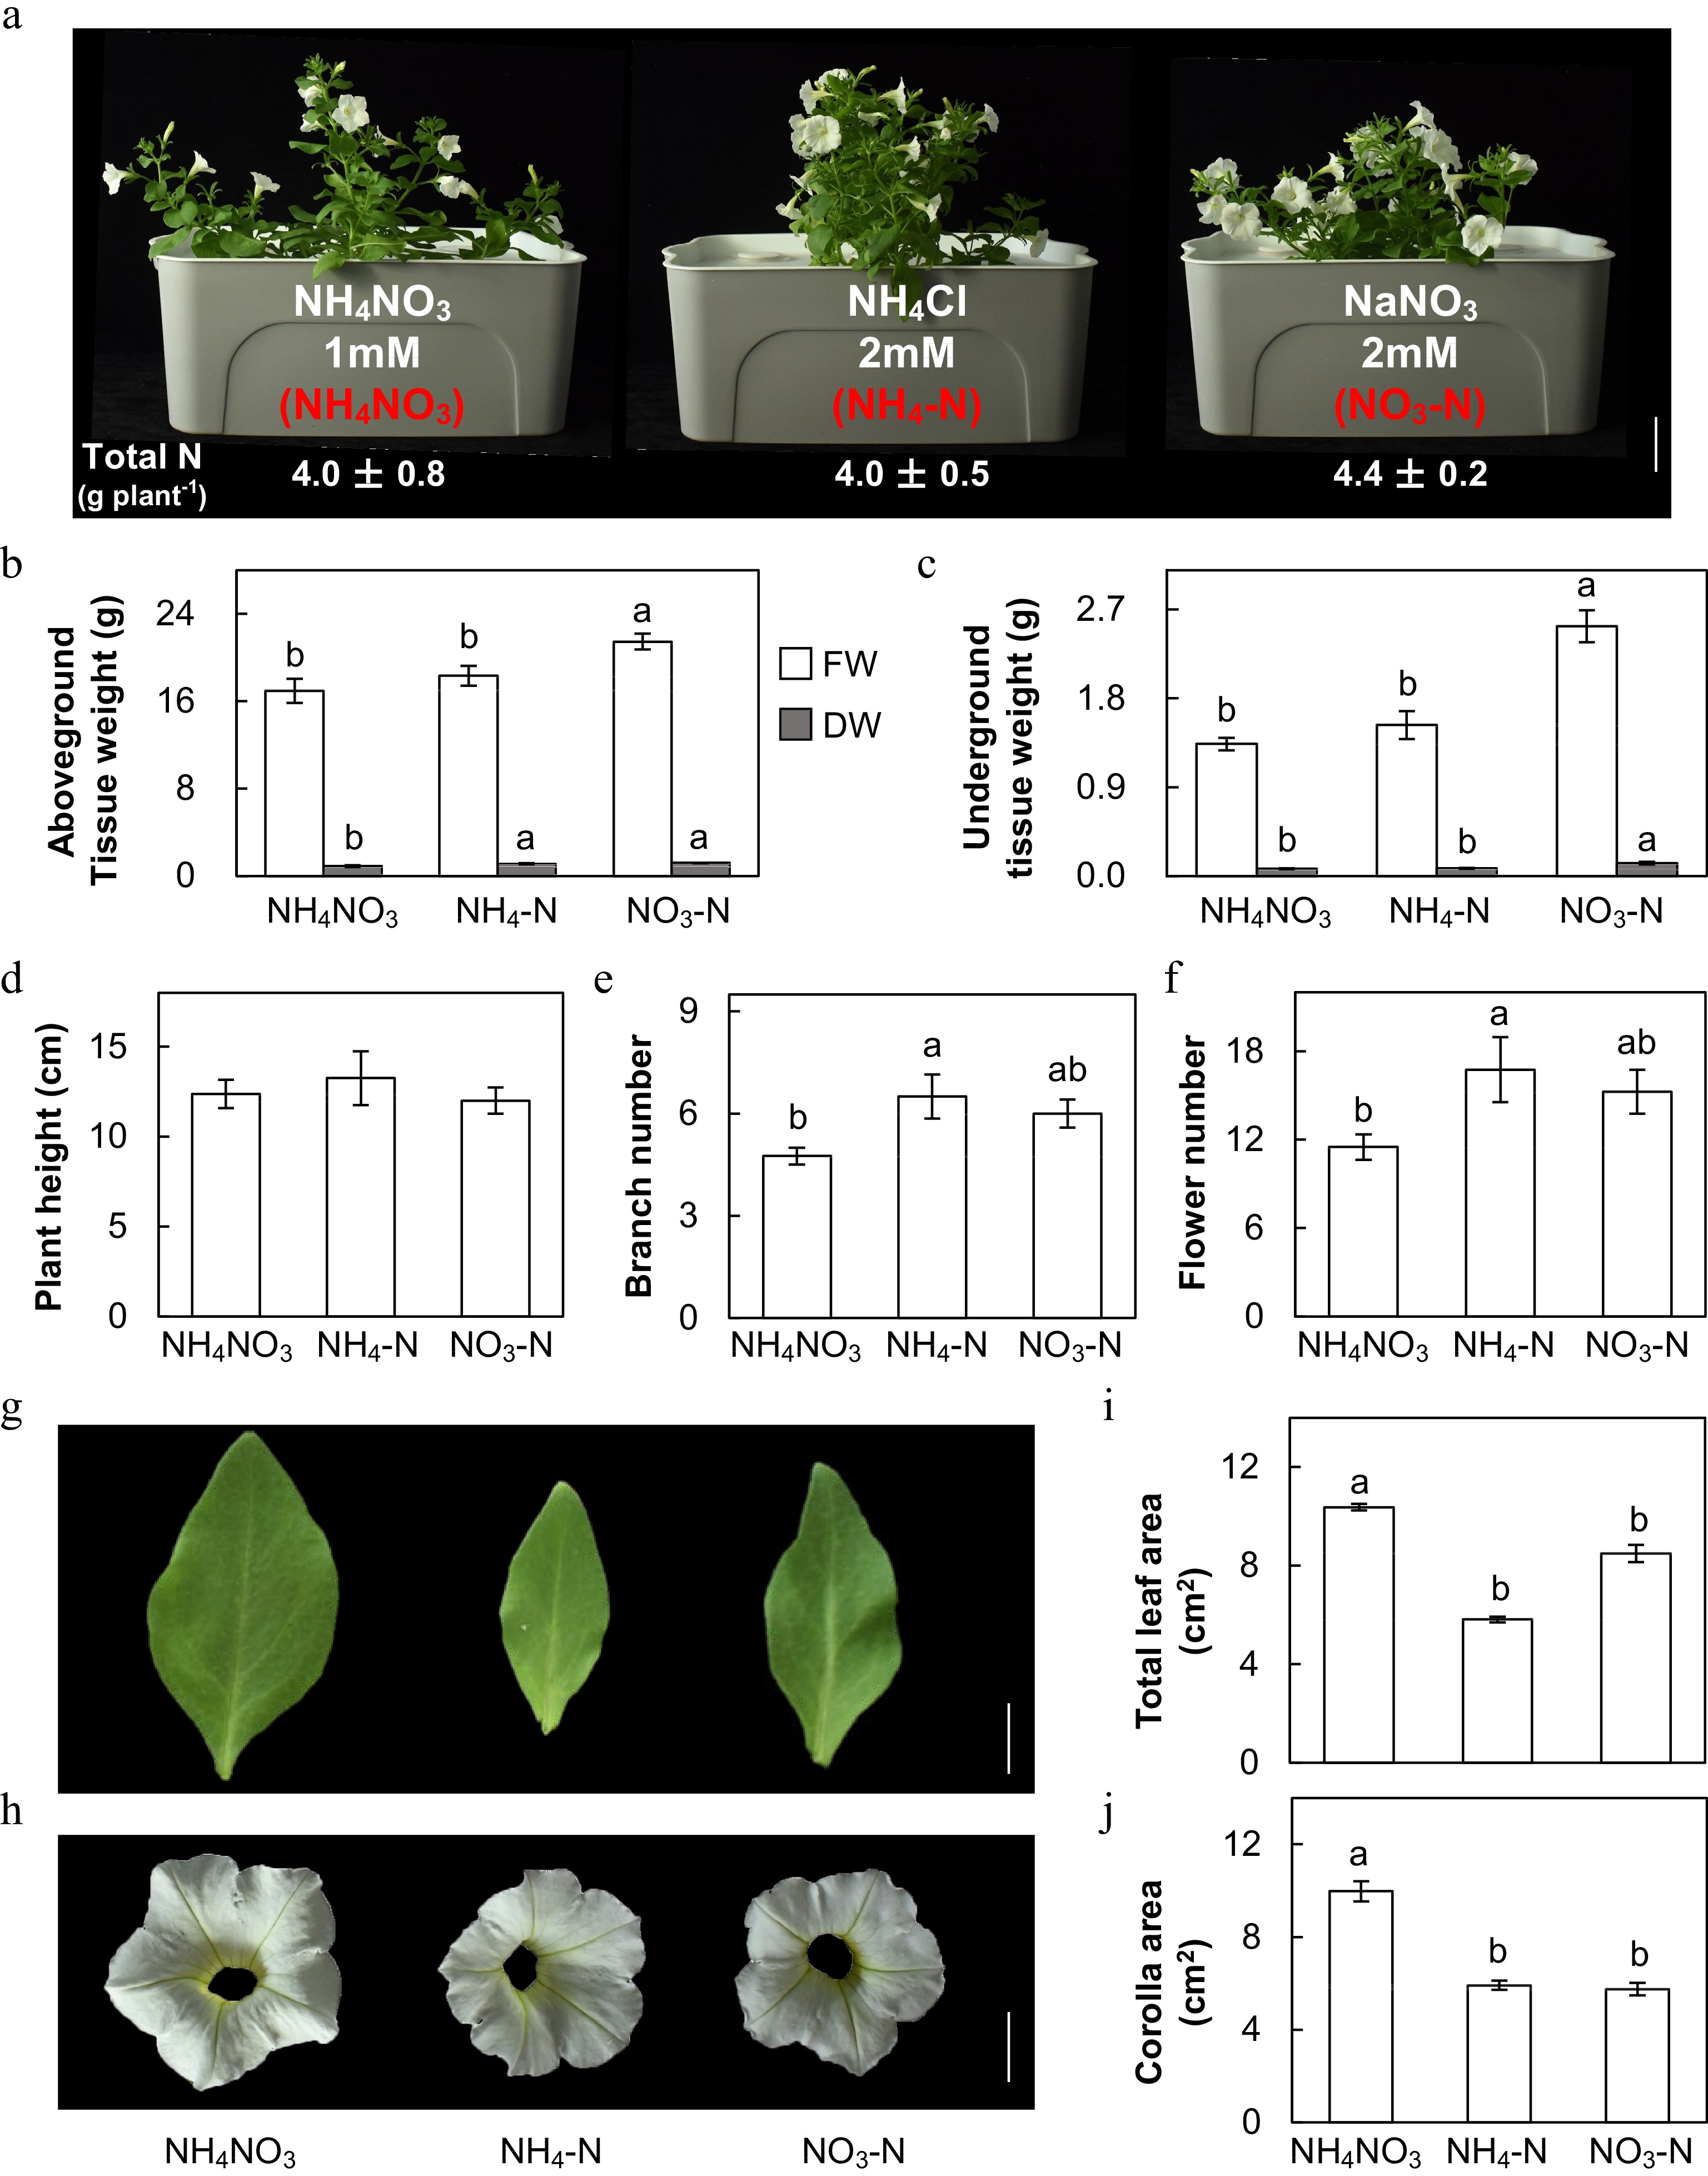
Figure 1.
Effects of ammonium-nitrate (NH4NO3), ammonium (NH4-N), and nitrate (NO3-N) on Petunia plants. (a) Petunia plants (MD) after treatment (scale bar = 5 cm). (b), (c) Fresh weight (FW) and dry weight (DW) of above- and under-ground tissues (SE, n = 4). (d)−(f) Plant height, number of branches and number of flowers measured for each treatment (SE, n = 4). (g), (h) Close-up view of the representative, fully expanded leaves and petals of fully-opened flowers of each treatment (scale bar = 1 cm). (i), (j) Total leaf area and corolla area measured for each treatment (SE, n = 4). Different letters above the bars indicate significant difference between treatments using one-way ANOVA test in SPSS software at P < 0.05.
-
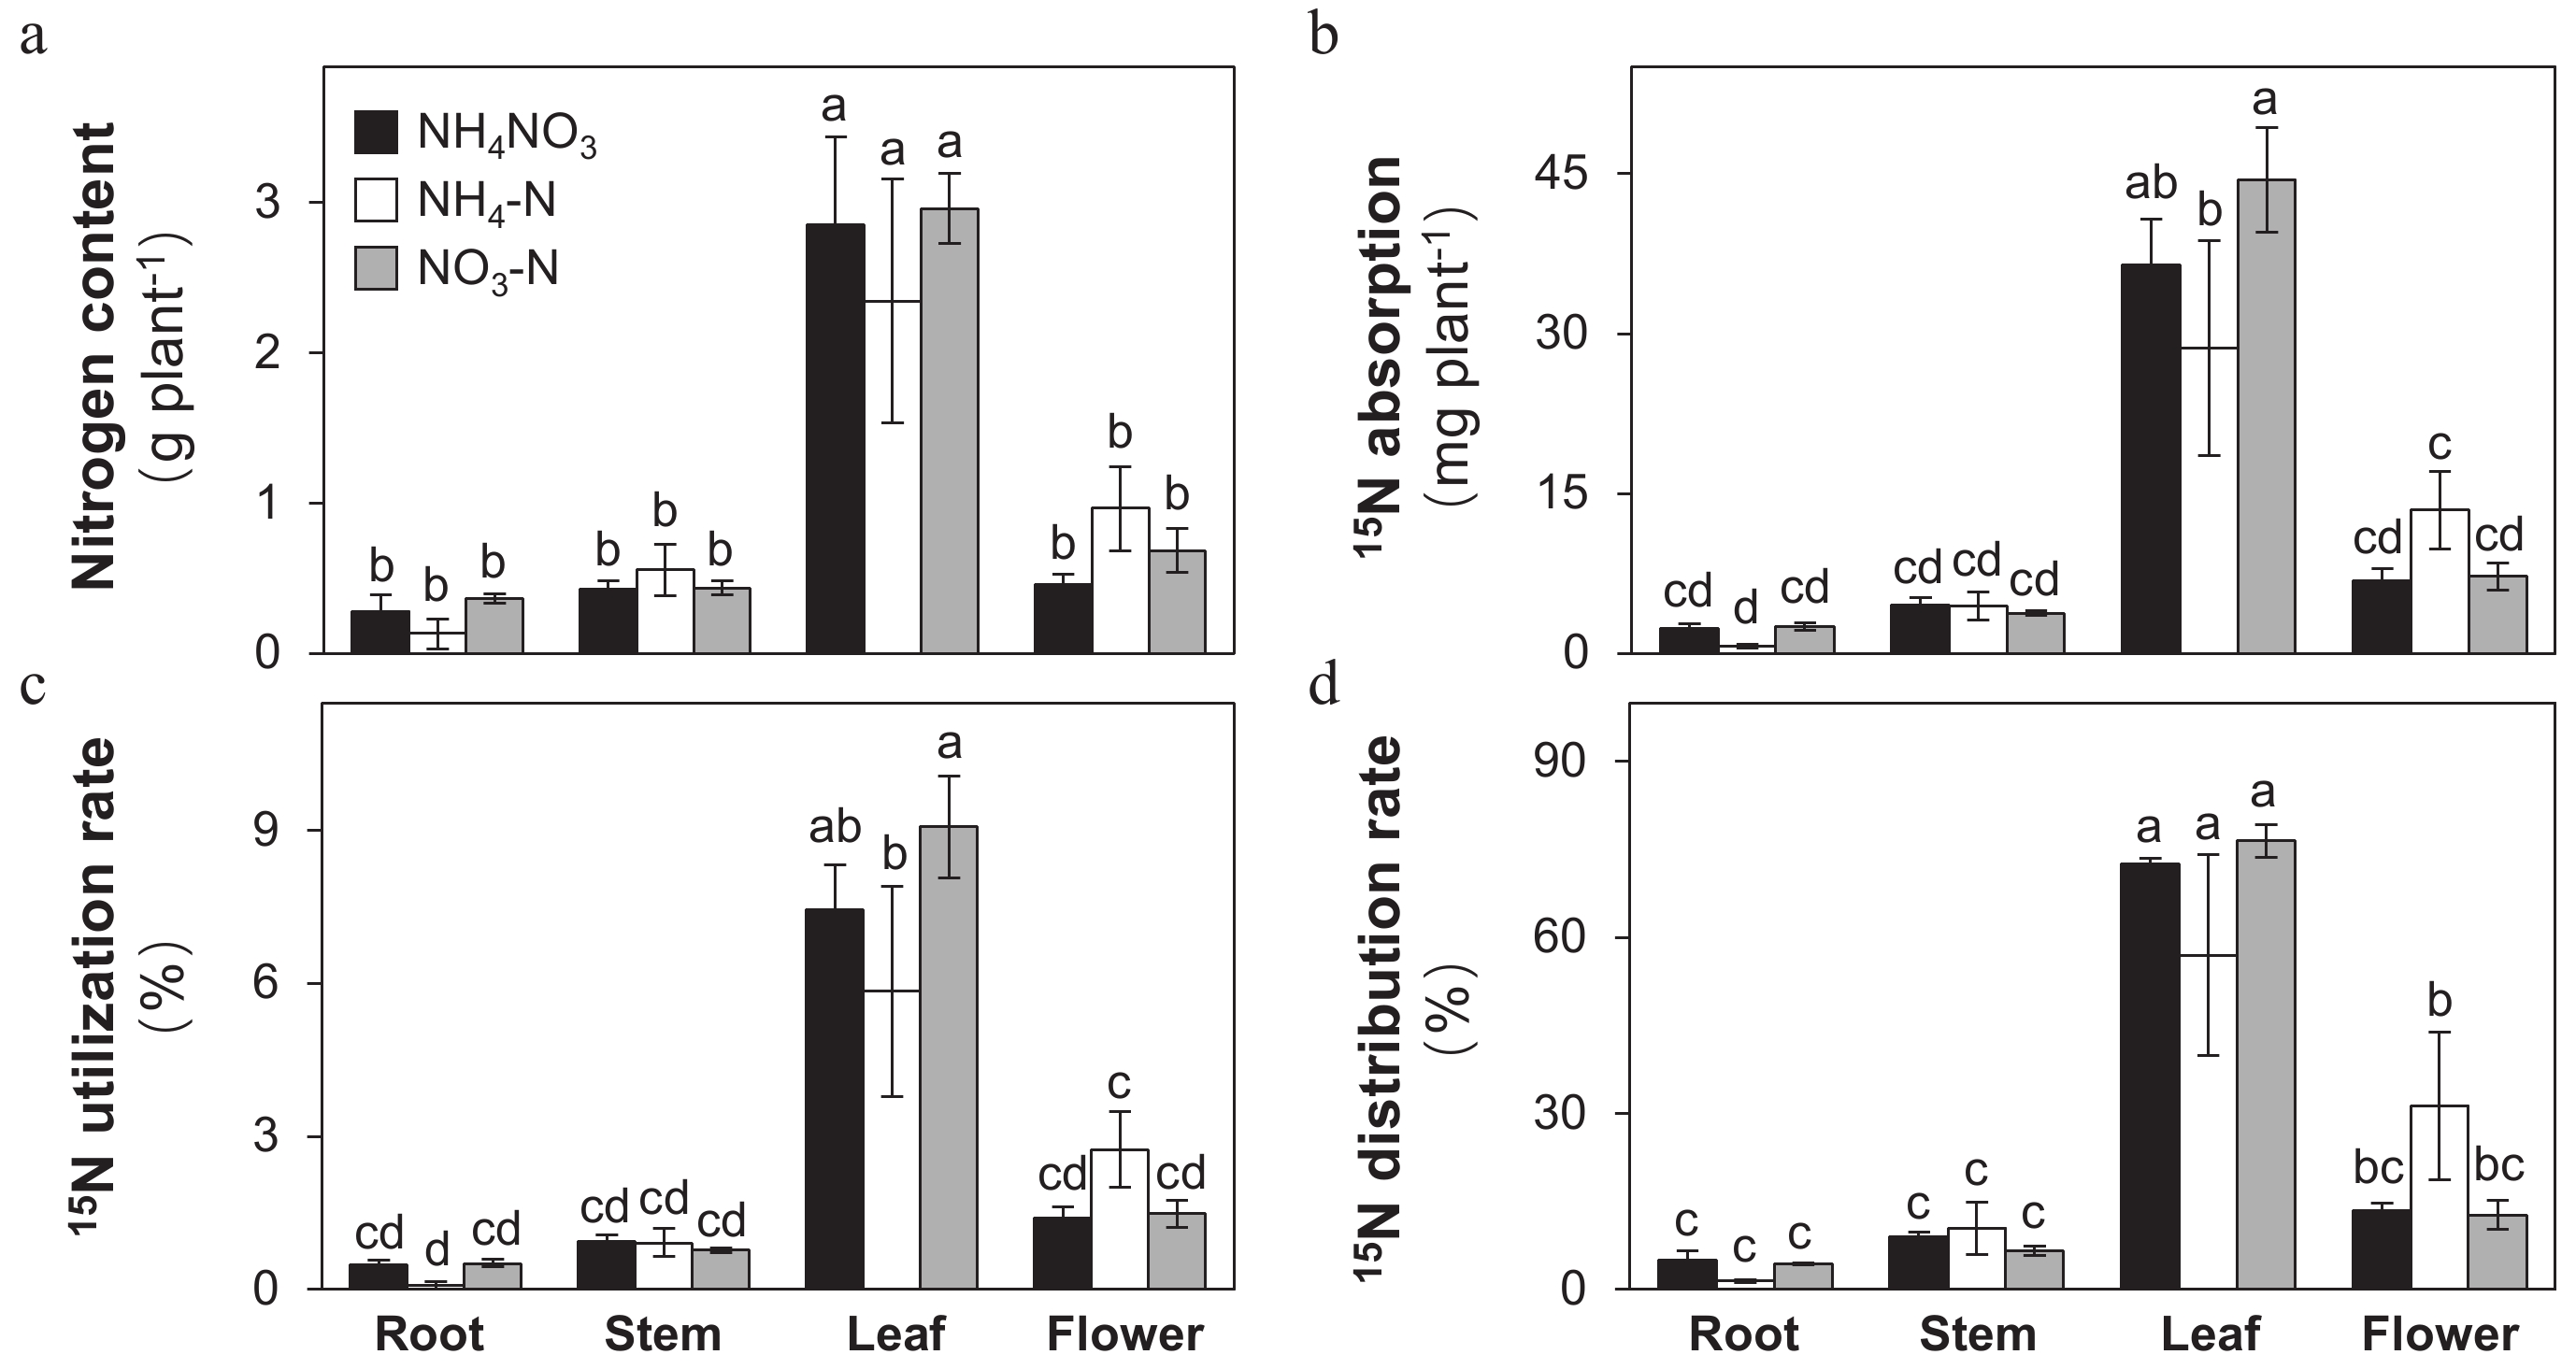
Figure 2.
Effects of ammonium-nitrate (NH4NO3), ammonium (NH4-N), and nitrate (NO3-N) on the tissue-level distribution of N within Petunia plants. (a) Nitrogen content , (b) 15N absorption content, (c) 15N utilization rate, and (d) 15N distribution rate in roots, stems, leaves and flowers measured for each treatment (SE, n = 3). Different letters above the bars in each tissue indicate significant difference between treatments using one-way ANOVA test in SPSS software at P < 0.05.
-
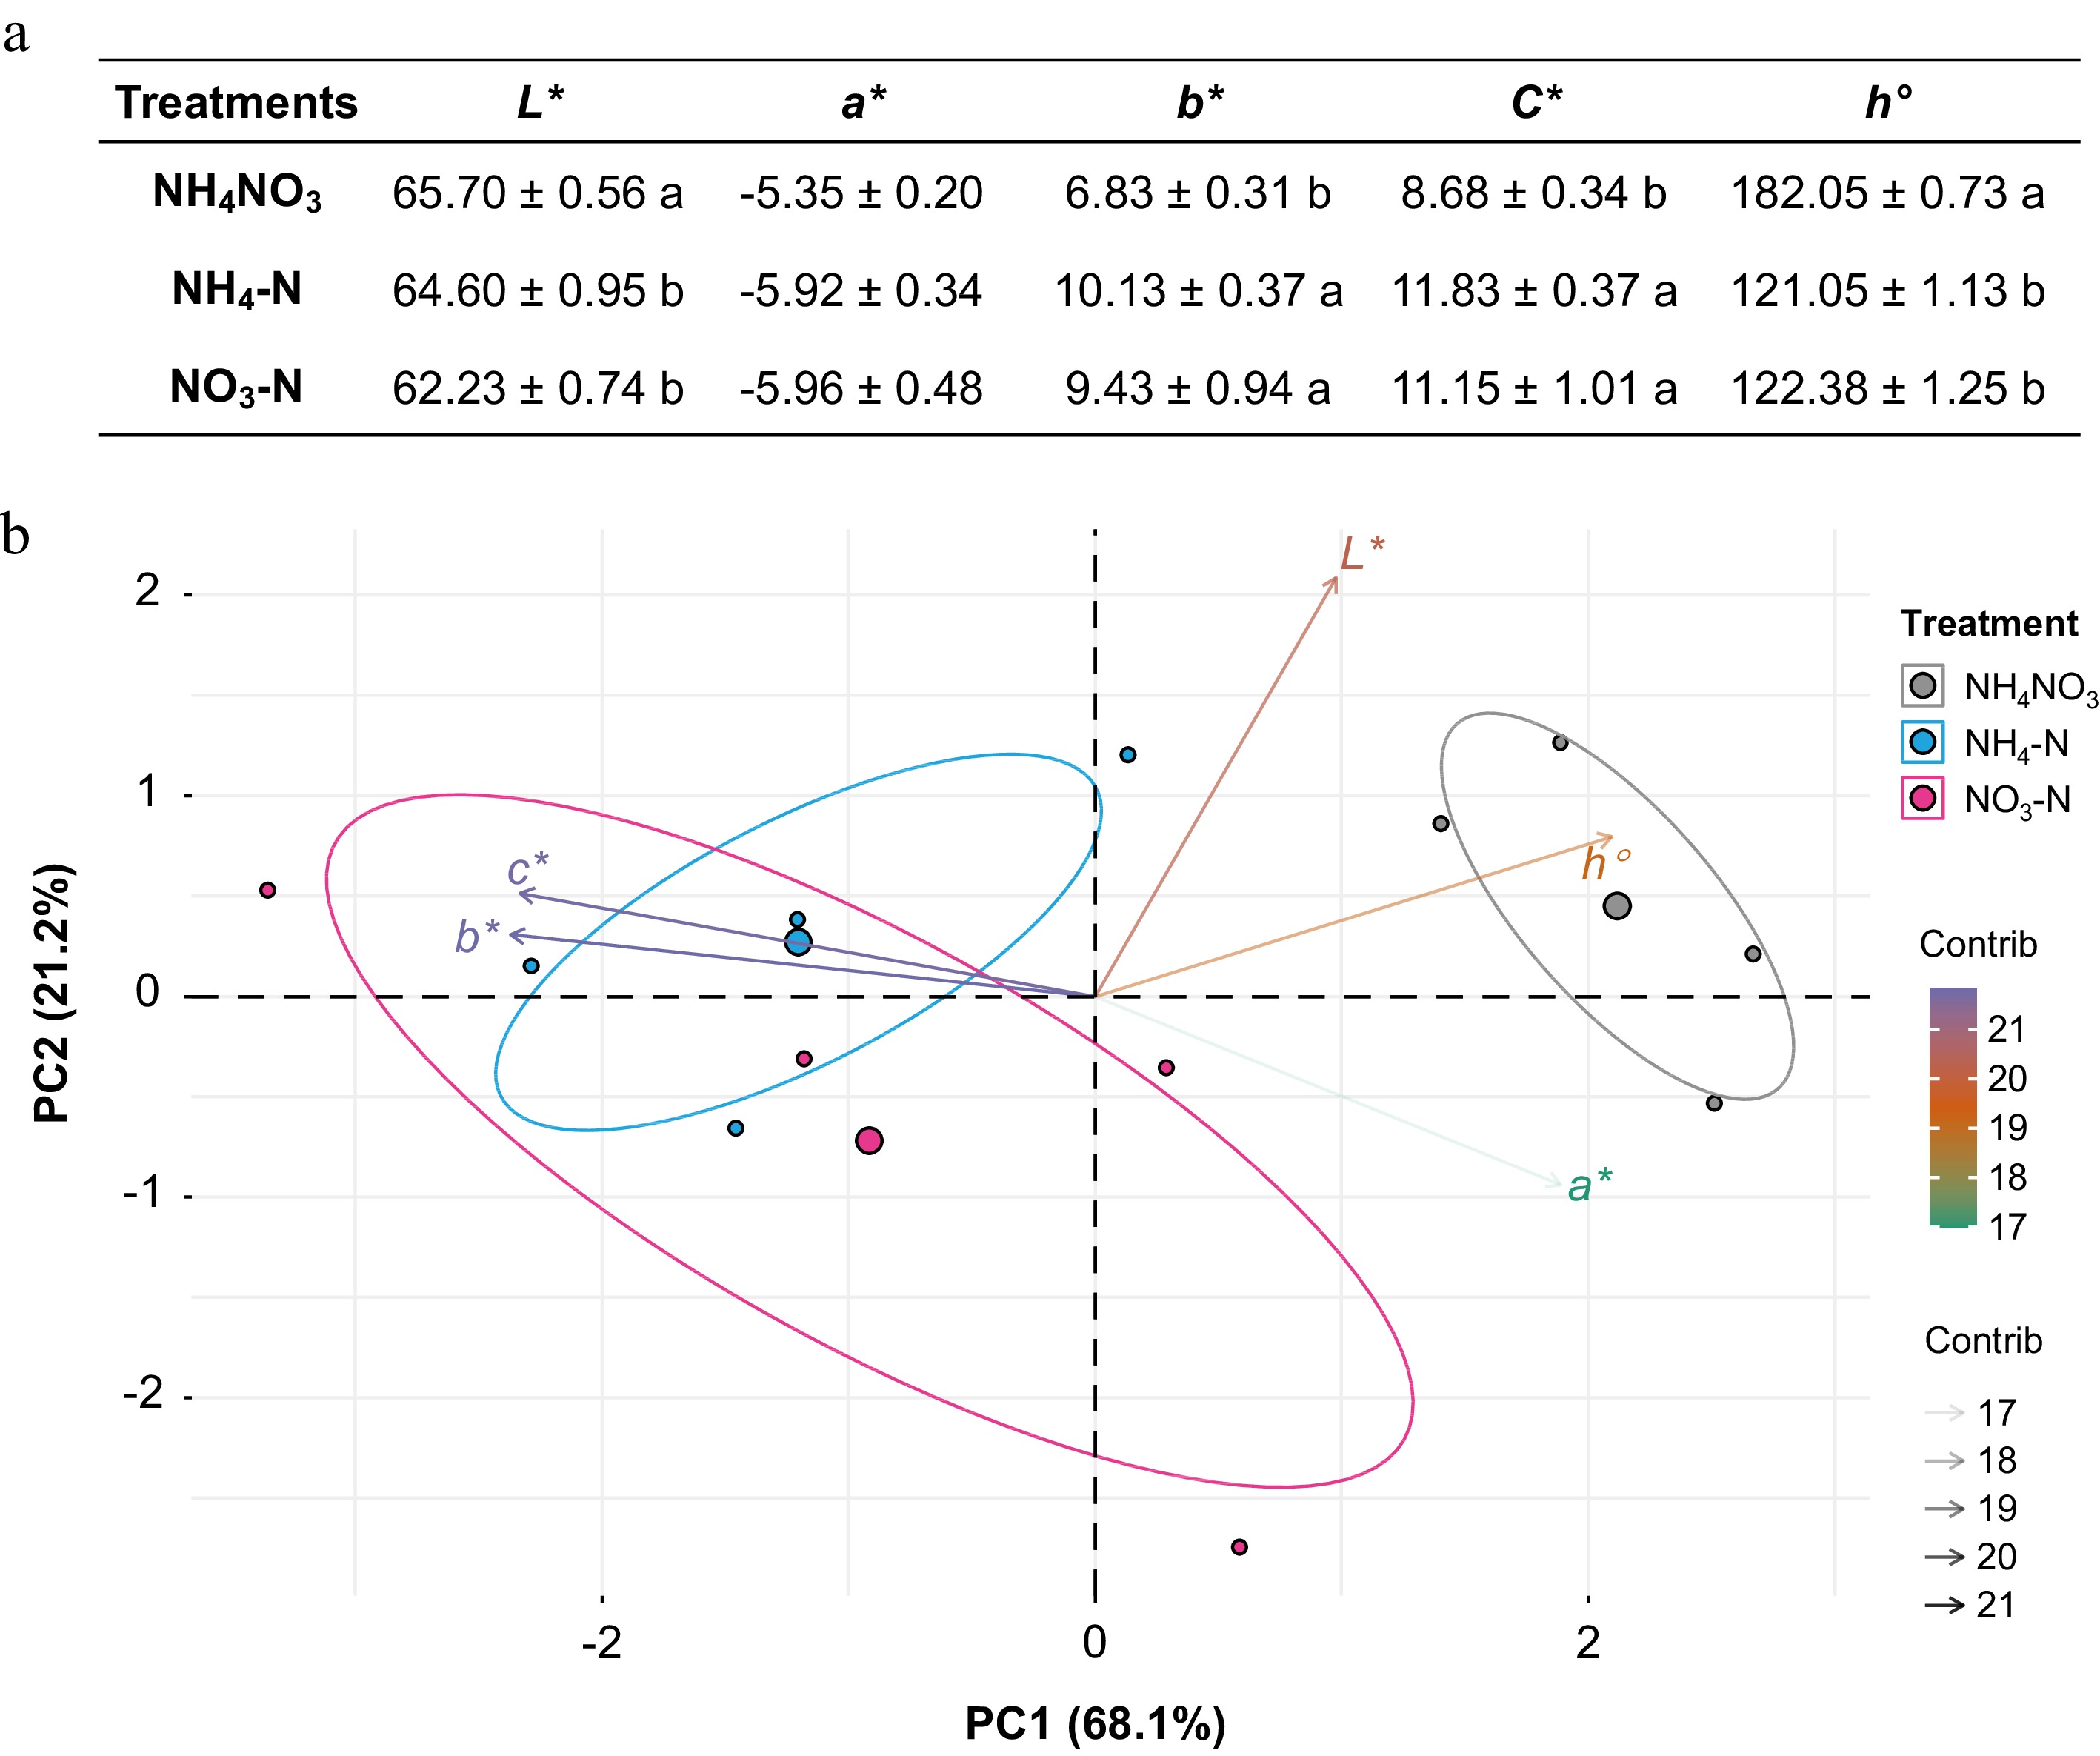
Figure 3.
Effects of ammonium-nitrate (NH4NO3), ammonium (NH4-N), and nitrate (NO3-N) on petal color traits. (a) CIELab coordinates including perceptual lightness (L*), redness/greenness (a*), yellowness/blueness (b*), chroma (C*), and hue angle (h°) of Petunia petals measured for each treatment via a portable colorimeter (SE, n = 4). Colors (green to purple) and transparency of arrows toward each parameter indicate their contributions to the principal components. Different letters above the bars in each column indicate significant difference between treatments using one-way ANOVA test in SPSS software at P < 0.05. (b) The principal component analysis (PCA) of color traits in three treatments.
-
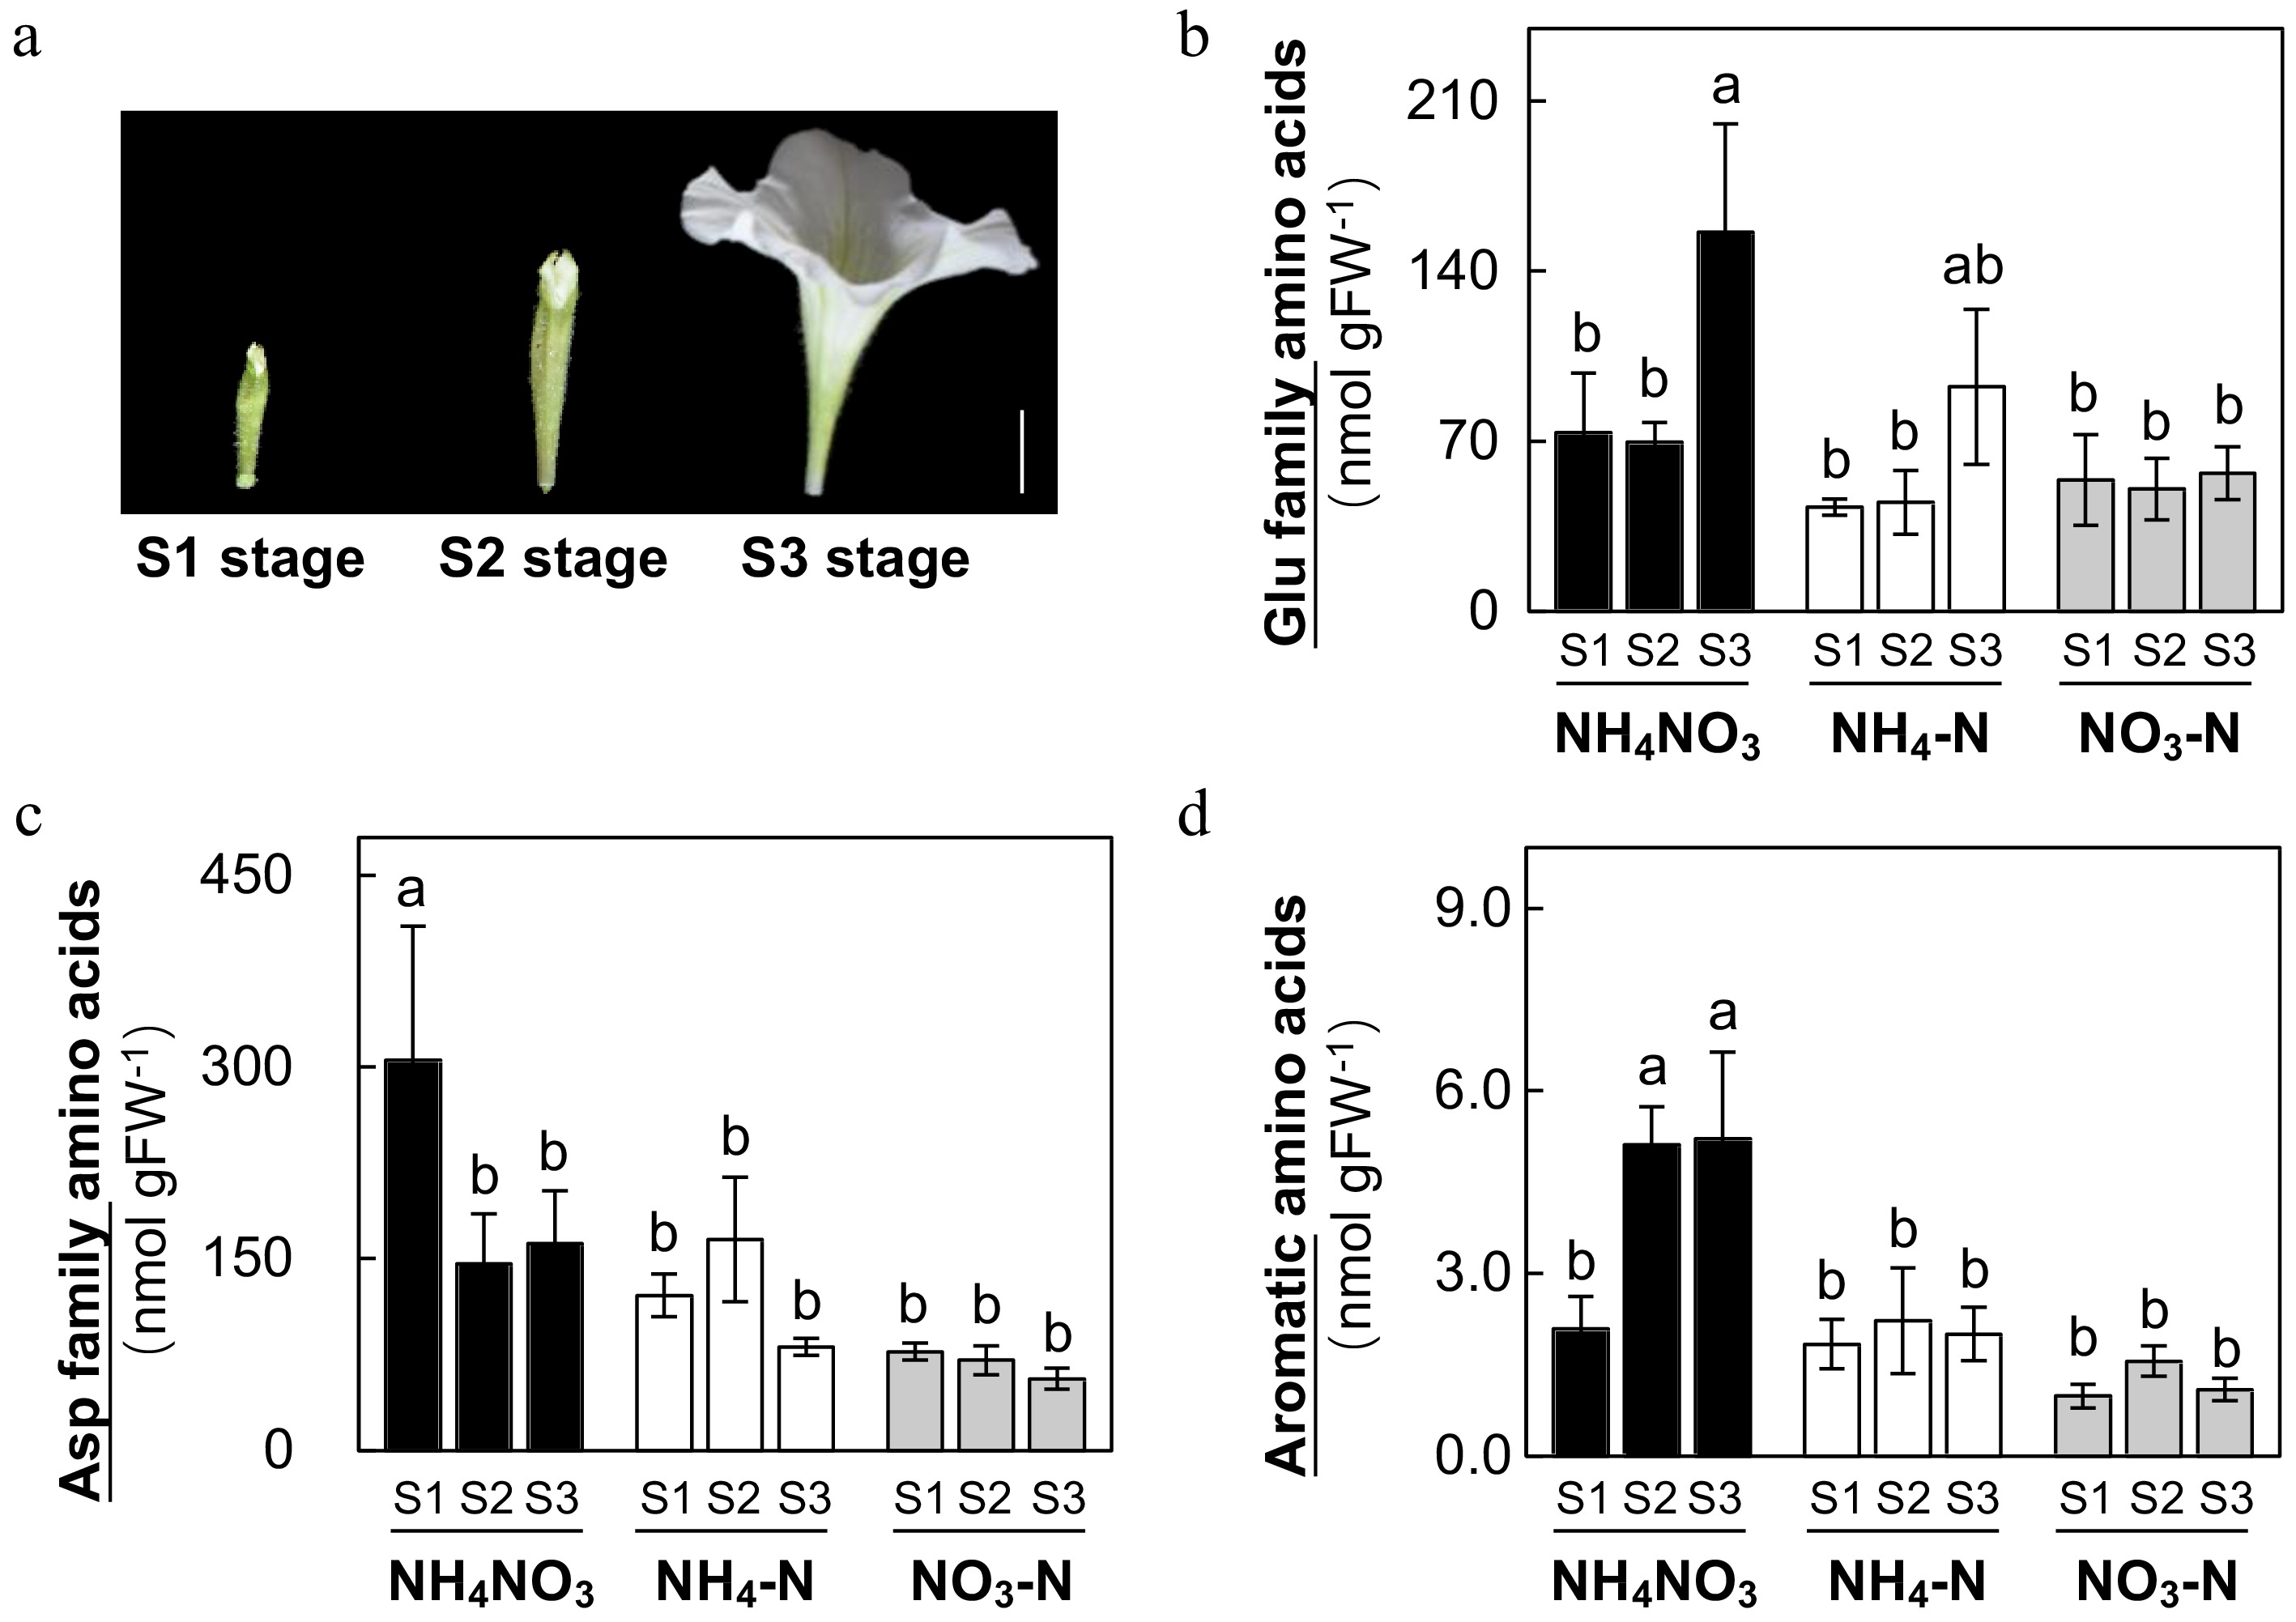
Figure 4.
Effects of ammonium-nitrate (NH4NO3), ammonium (NH4-N), and nitrate (NO3-N) on petal amino acid profiles in Petunia plants. Petal tissues were collected at S1, S2 and S3 stages indicated in (a) (scale bar = 1 cm) and total concentrations of glutamate family amino acids, aspartate amino acids and aromatic amino acids (b)−(d) (SE, n = 4). Different letters above the bars indicate significant difference between treatments using one-way ANOVA test in SPSS software at P < 0.05. Concentrations (nmol g FW−1) of individual amino acids are reported Supplemental Table S1.
-
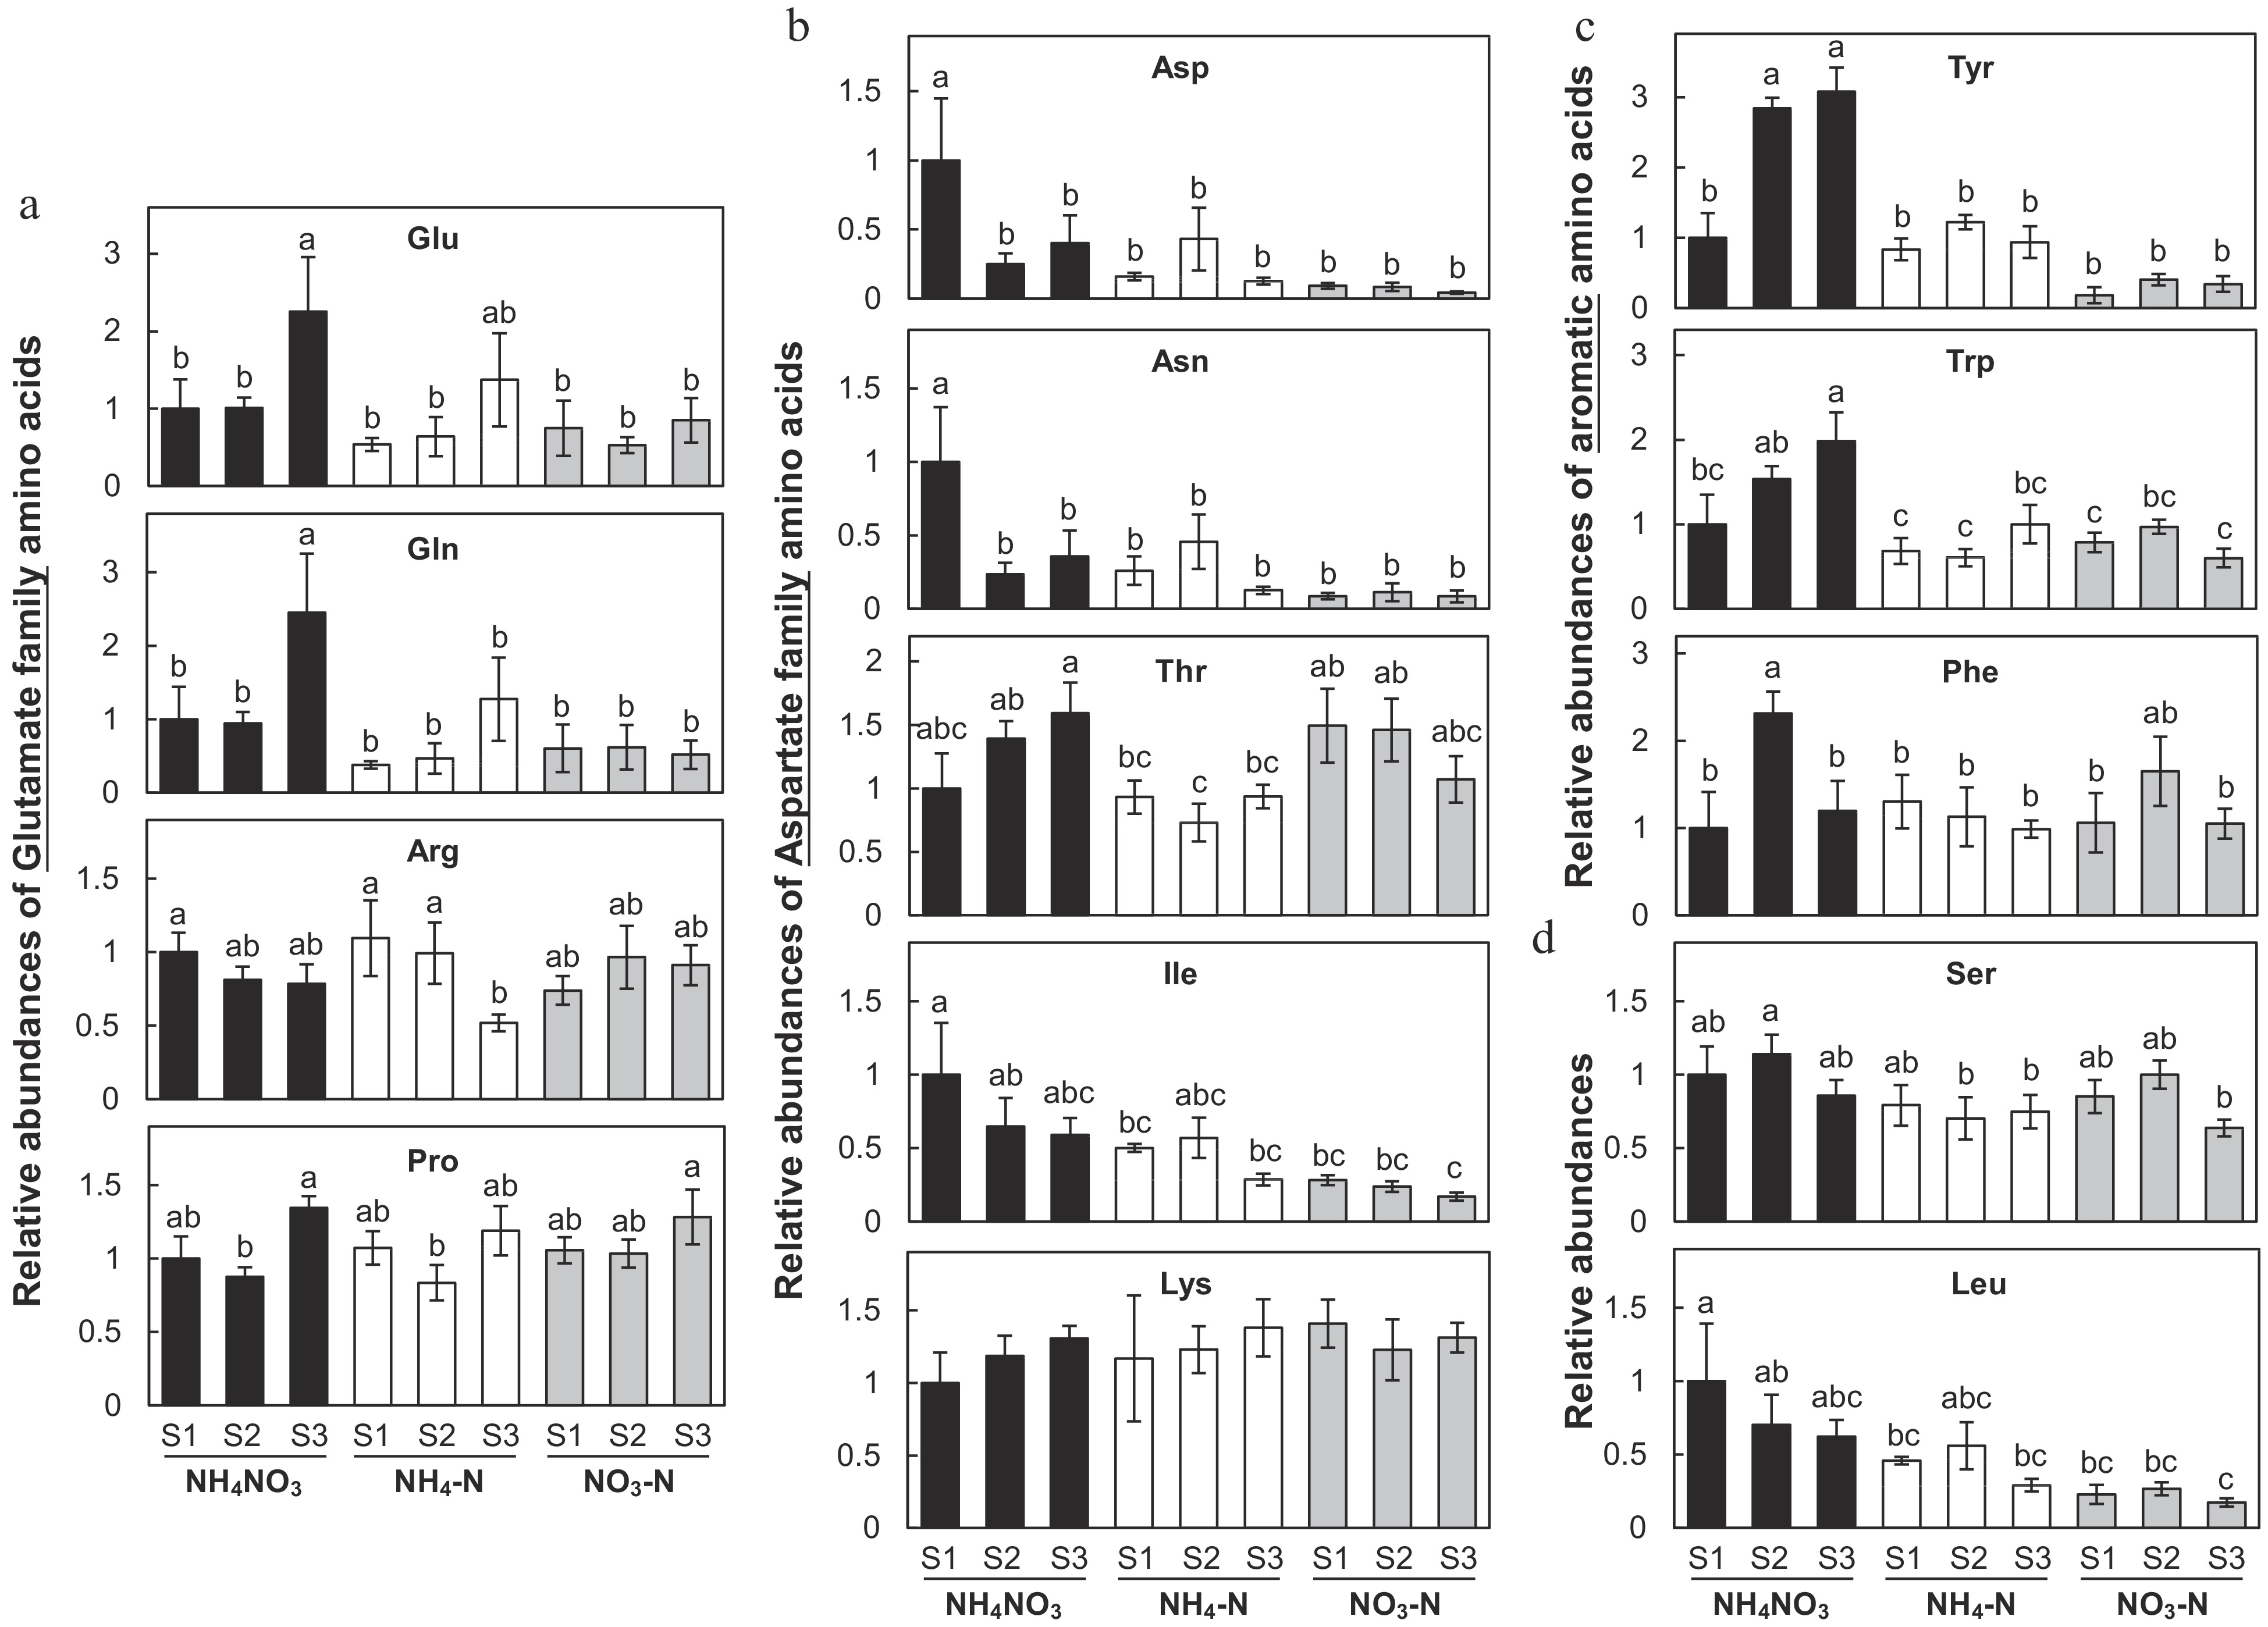
Figure 5.
Effects of ammonium-nitrate (NH4NO3), ammonium (NH4-N), and nitrate (NO3-N) on relative abundance of amino acids in Petunia petals. (a) Relative abundance of glutamate family amino acids, (b) aspartate family amino acids, (c) aromatic amino acids, and (d) Ser as well as Leu were displayed in column plots (SE, n = 4). Different letters above the bars indicate significant difference between treatments using one-way ANOVA test in SPSS software at P < 0.05. Concentrations (nmol g FW−1) of individual amino acids are reported in Supplemental Table S1.
-
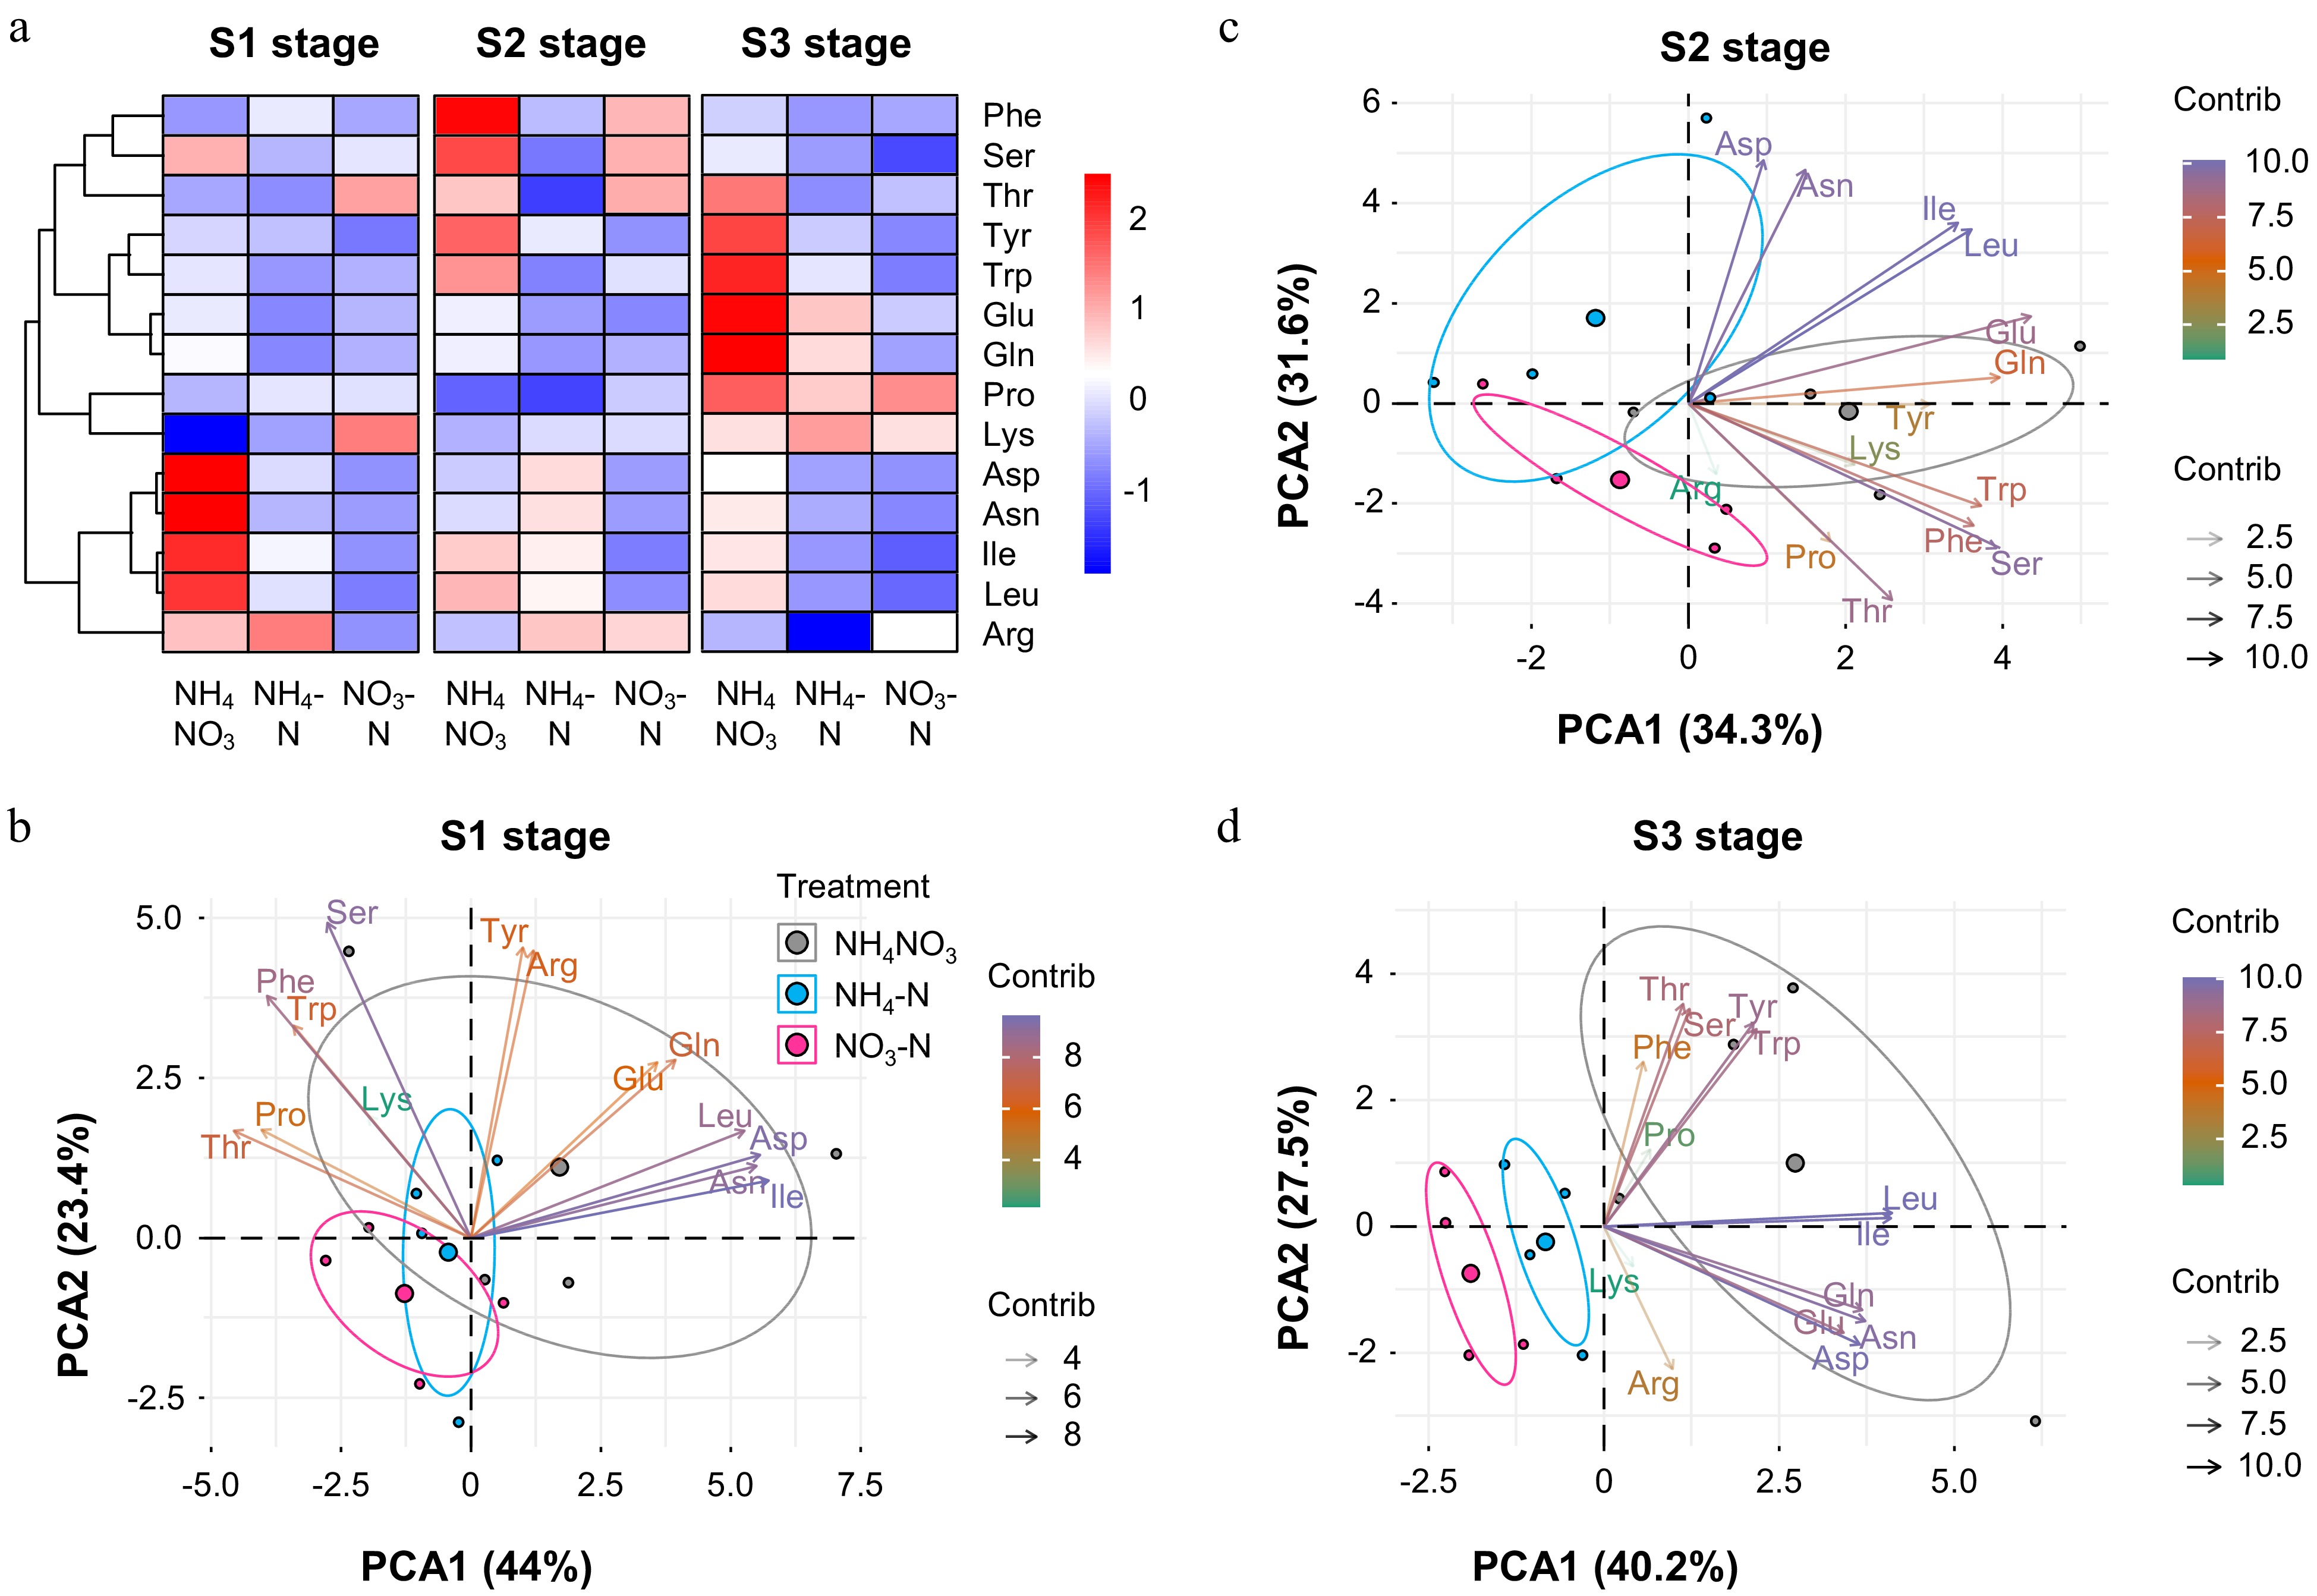
Figure 6.
Further analysis of amino acid data. Heatmap representation of concentrations of 14 amino acids at (a) S1−S3 stages and (b), (c), (d) PCA of amino acids at each developmental stage. Colors (green to purple) and transparency of arrows toward each parameter indicate their contributions to the principal components.
-
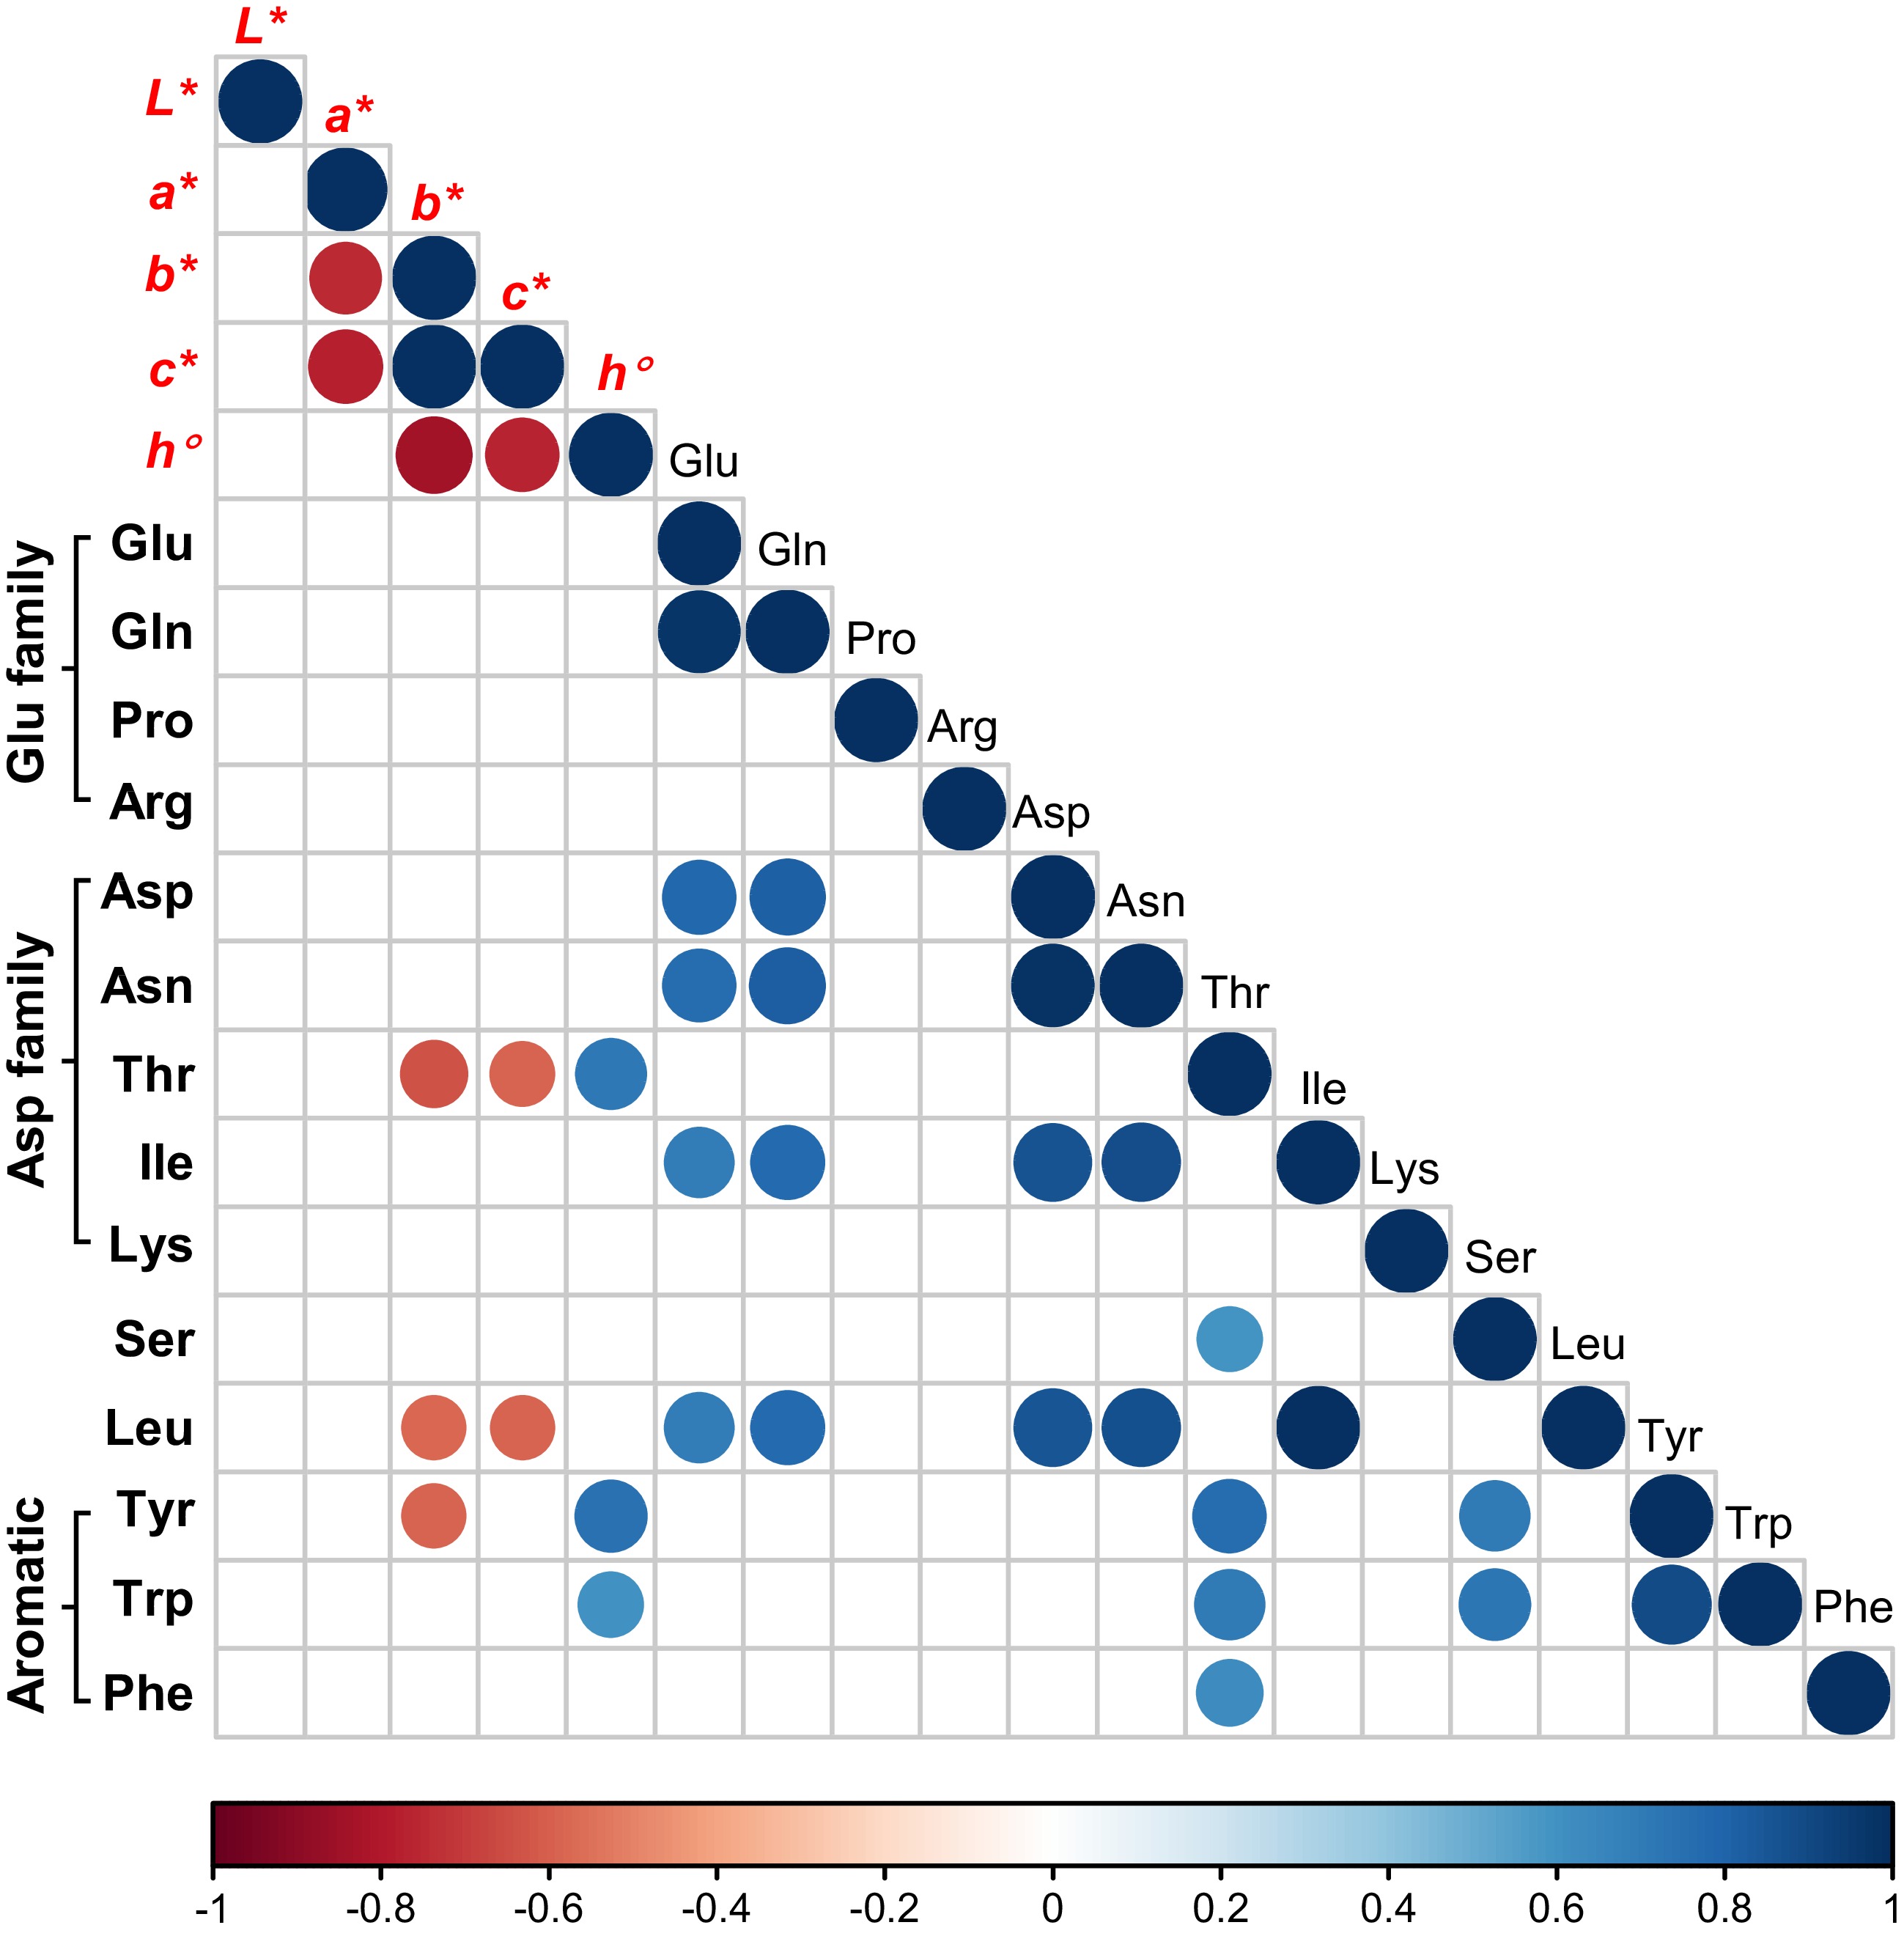
Figure 7.
Correlation analysis of L*, a*, b*, c*, h° and 14 amino acids. Data were processed via R programming. The intensity of blue and red color as well as the size of each dot are proportional to the calculated correlation coefficient (r).
-
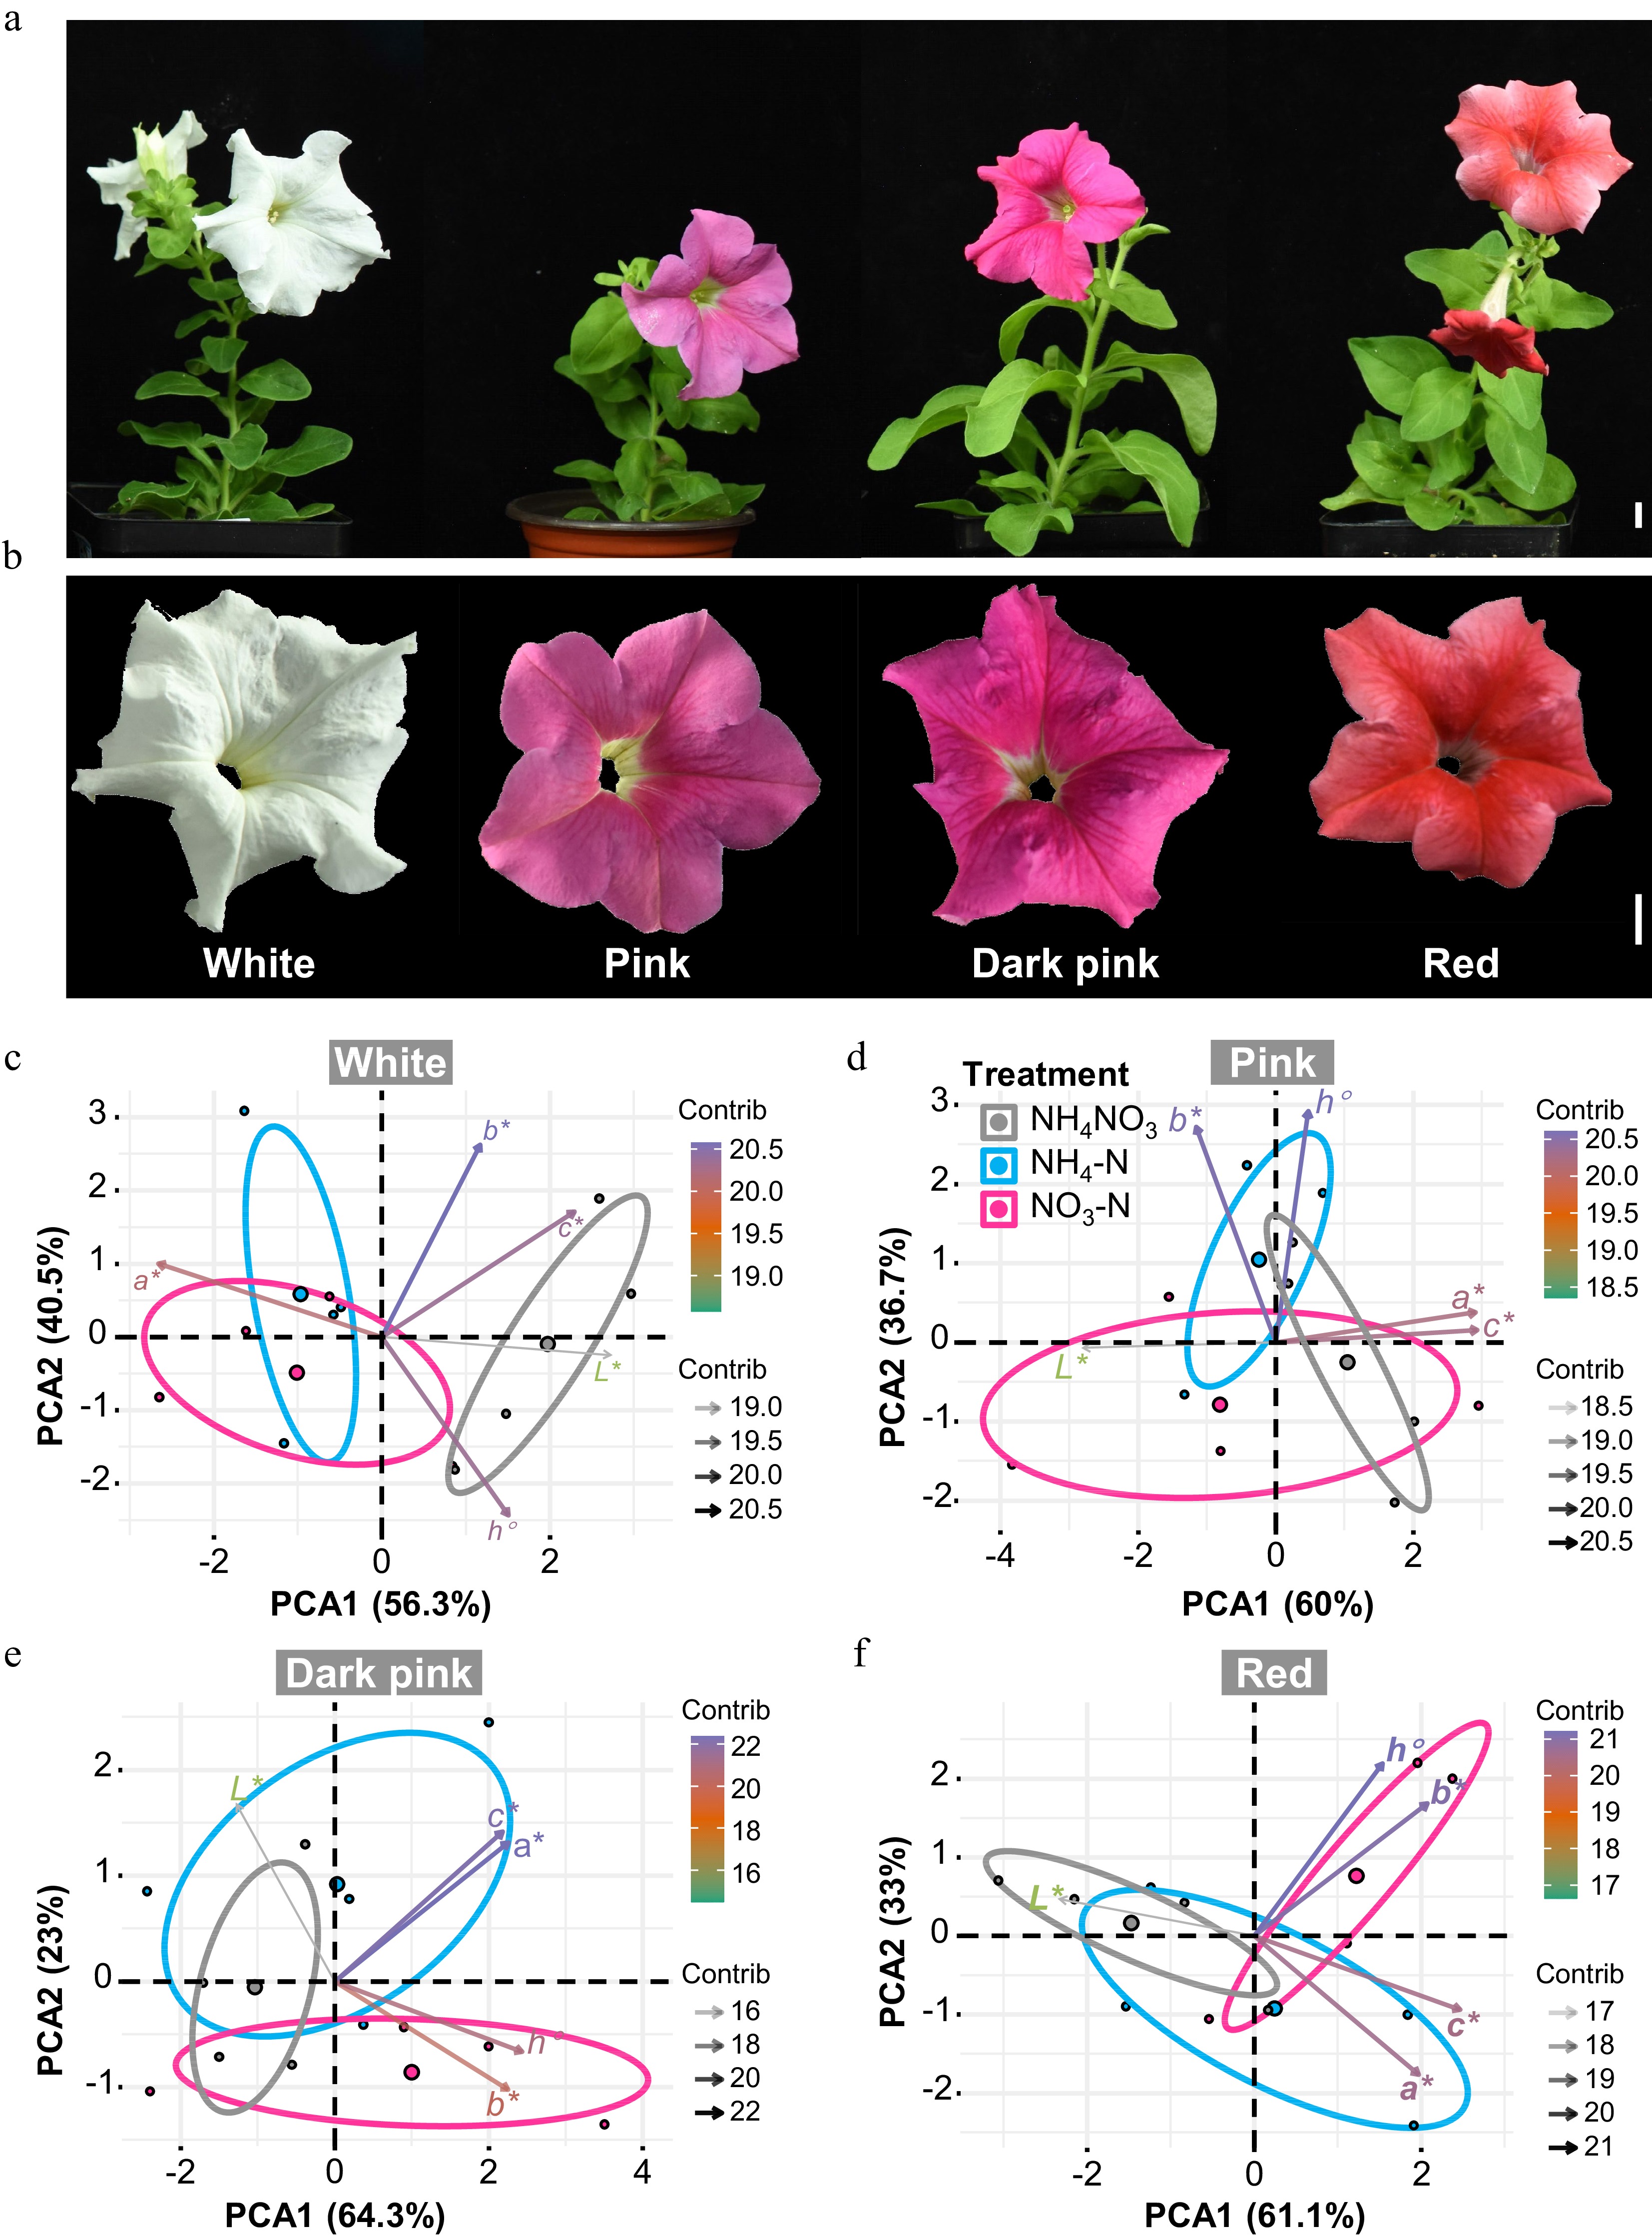
Figure 8.
Relations between amino acids and petal color traits of Petunia cultivars with different colors. (a), (b) Plant and petal appearance of four Petunia cultivars (Scale bar = 1 cm). (c)−(f) PCA of L*, a*, b*, C* and h° in each cultivar. Colors (green to purple) and transparency of arrows toward each parameter indicate their contributions to the principal components.
Figures
(8)
Tables
(0)