-
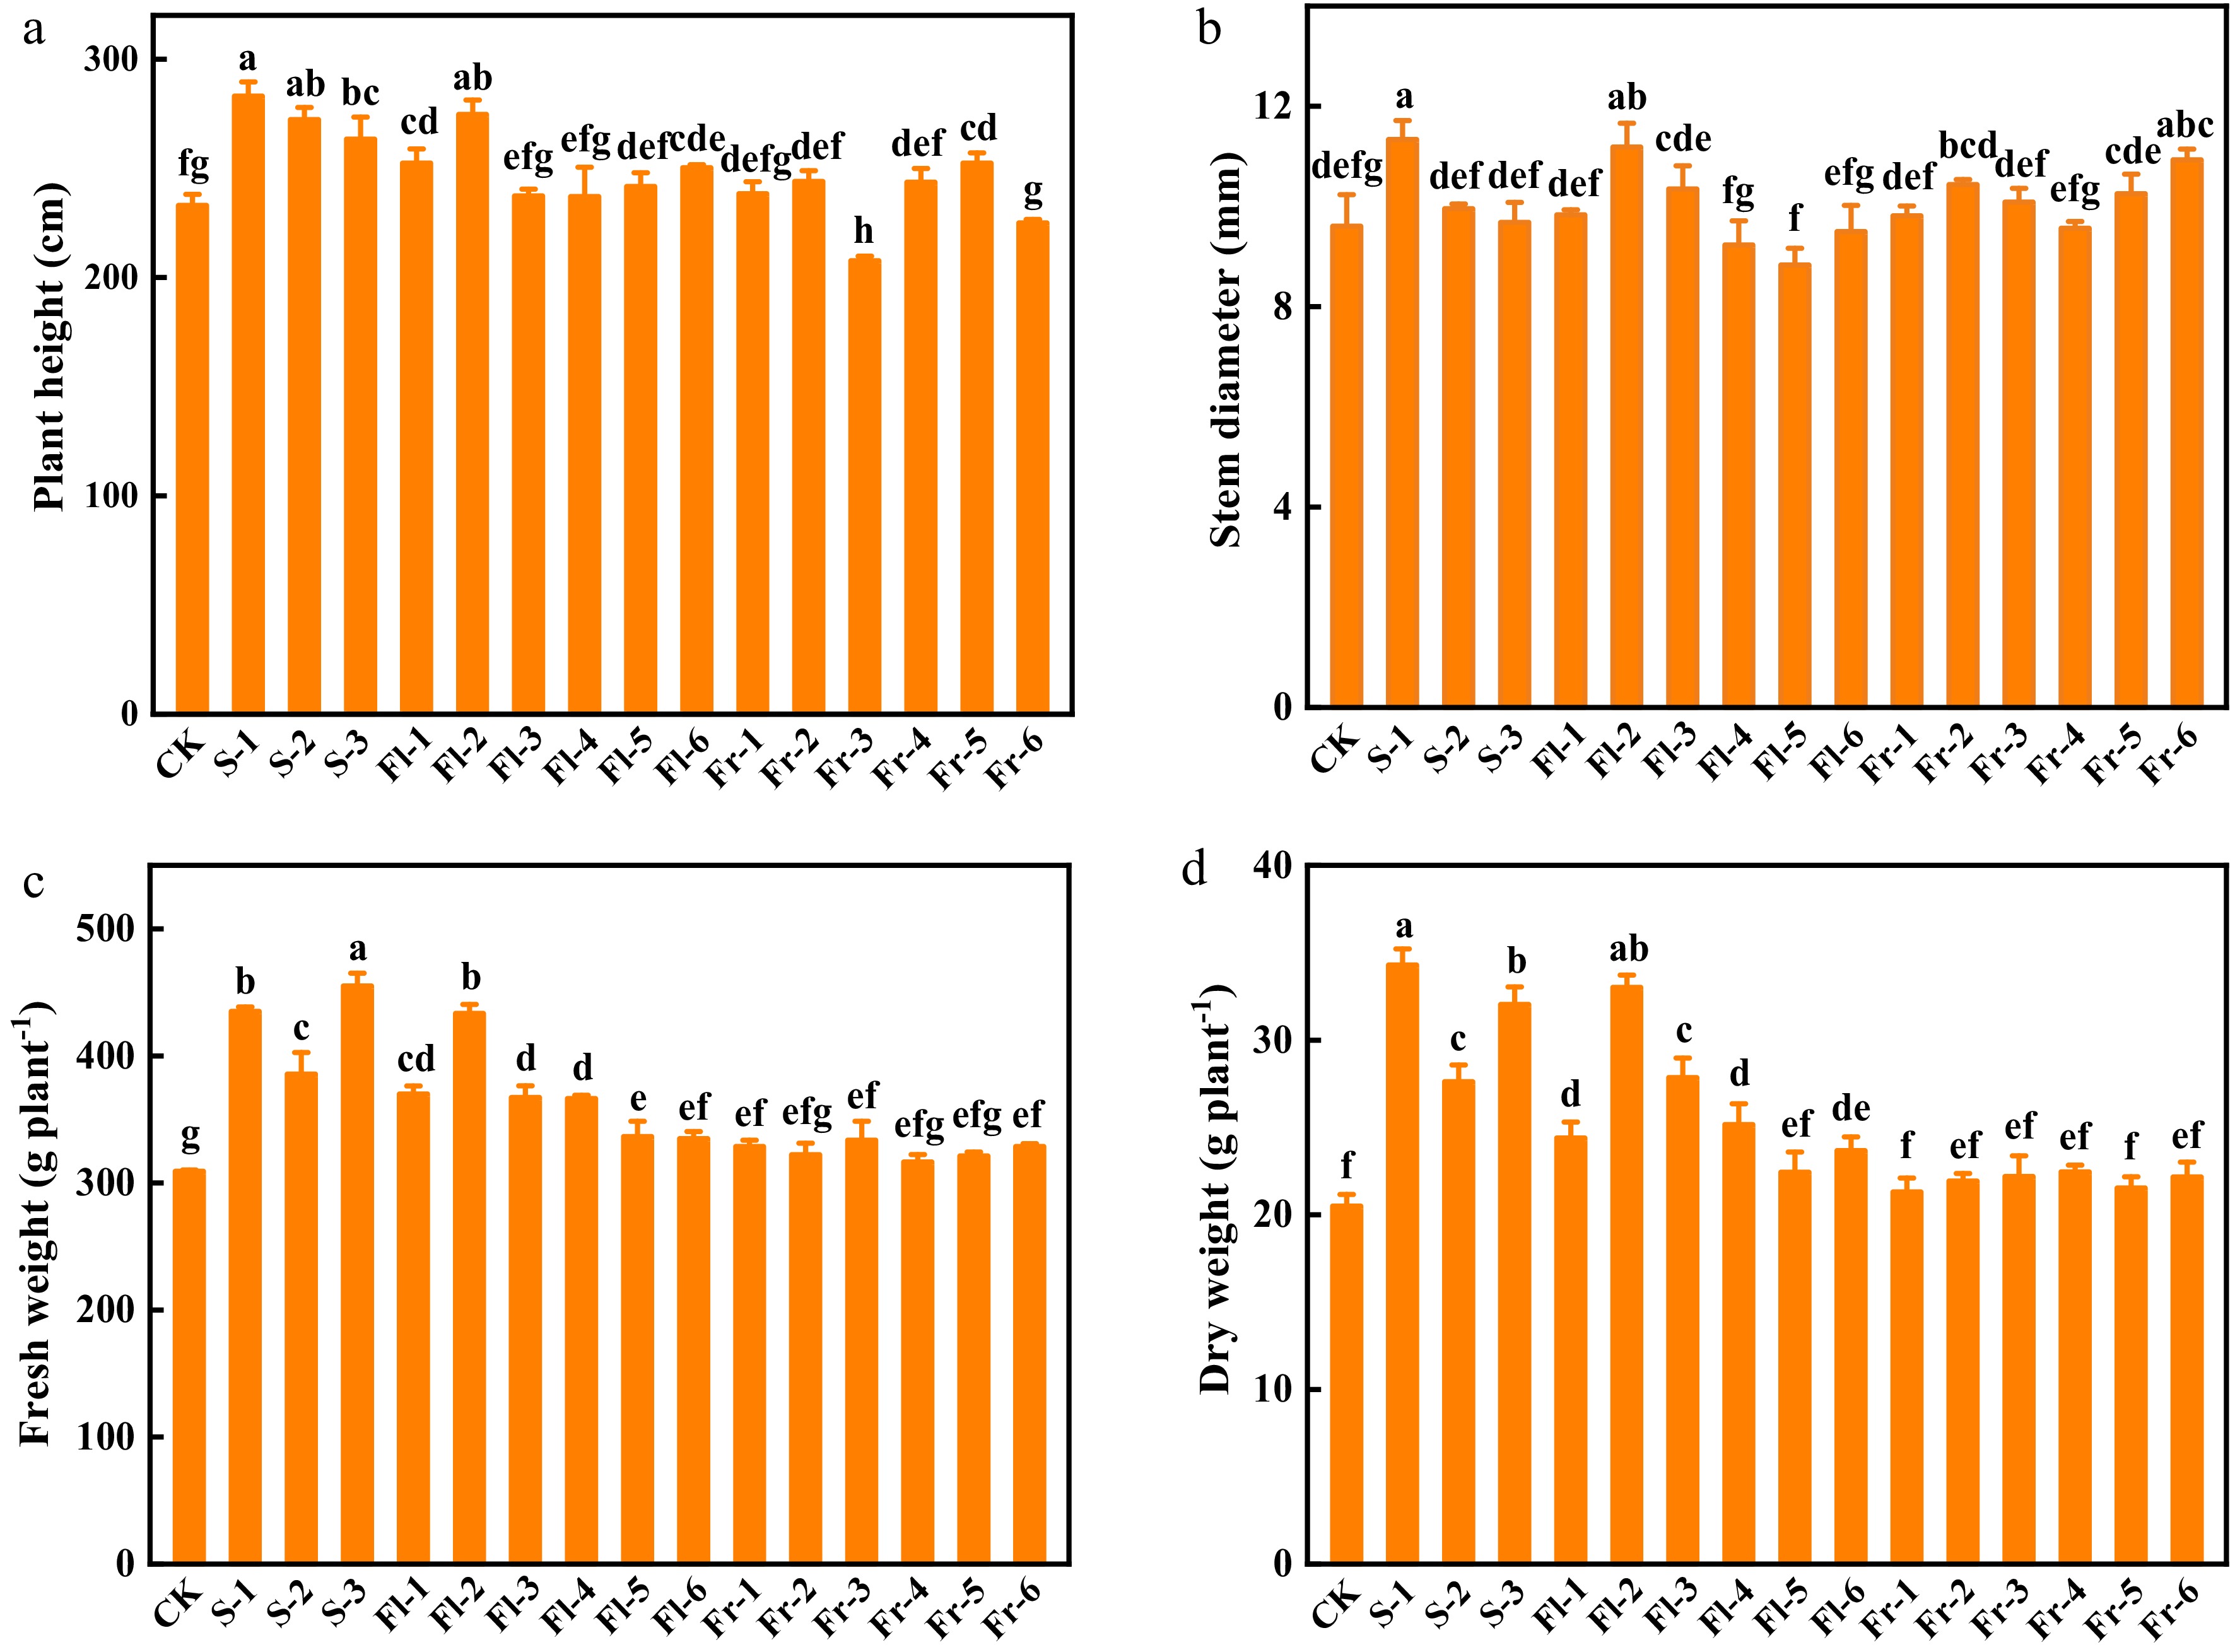
Figure 1.
Effects of the mixture of putrescine (Put), melatonin (MT), proline (Pro), and potassium fulvic acid (MFA) on the growth of cucumber plants under high temperature stress. (a) Plant height. (b) Stem diameter. (c) Fresh weight. (d) Dry weight. CK, cucumber plants without treatment with the mixture of 8 mmol L−1 Put, 50 µmol L−1 MT, 1.5 mmol L−1 Pro, and 0.3 g L−1 MFA (Put mixture, original concentration). S, Fl, and Fr indicated cucumber plants-treated with the Put mixture at seedling stage, flowering stage, and fruiting stage, respectively. 1, 2, and 3 indicated cucumber plants-treated with the original, diluted five times, and diluted ten times concentration of the Put mixture every 7 d, 3 times, respectively. 4, 5, and 6 indicated cucumber plants-treated with the original, diluted five times, and diluted ten times concentration of the Put mixture every 14 d, 3 times, respectively. Data represent as the mean ± SD (n = 3). Different letters indicate significant differences according to Tukey’s test at P ≤ 0.05.
-
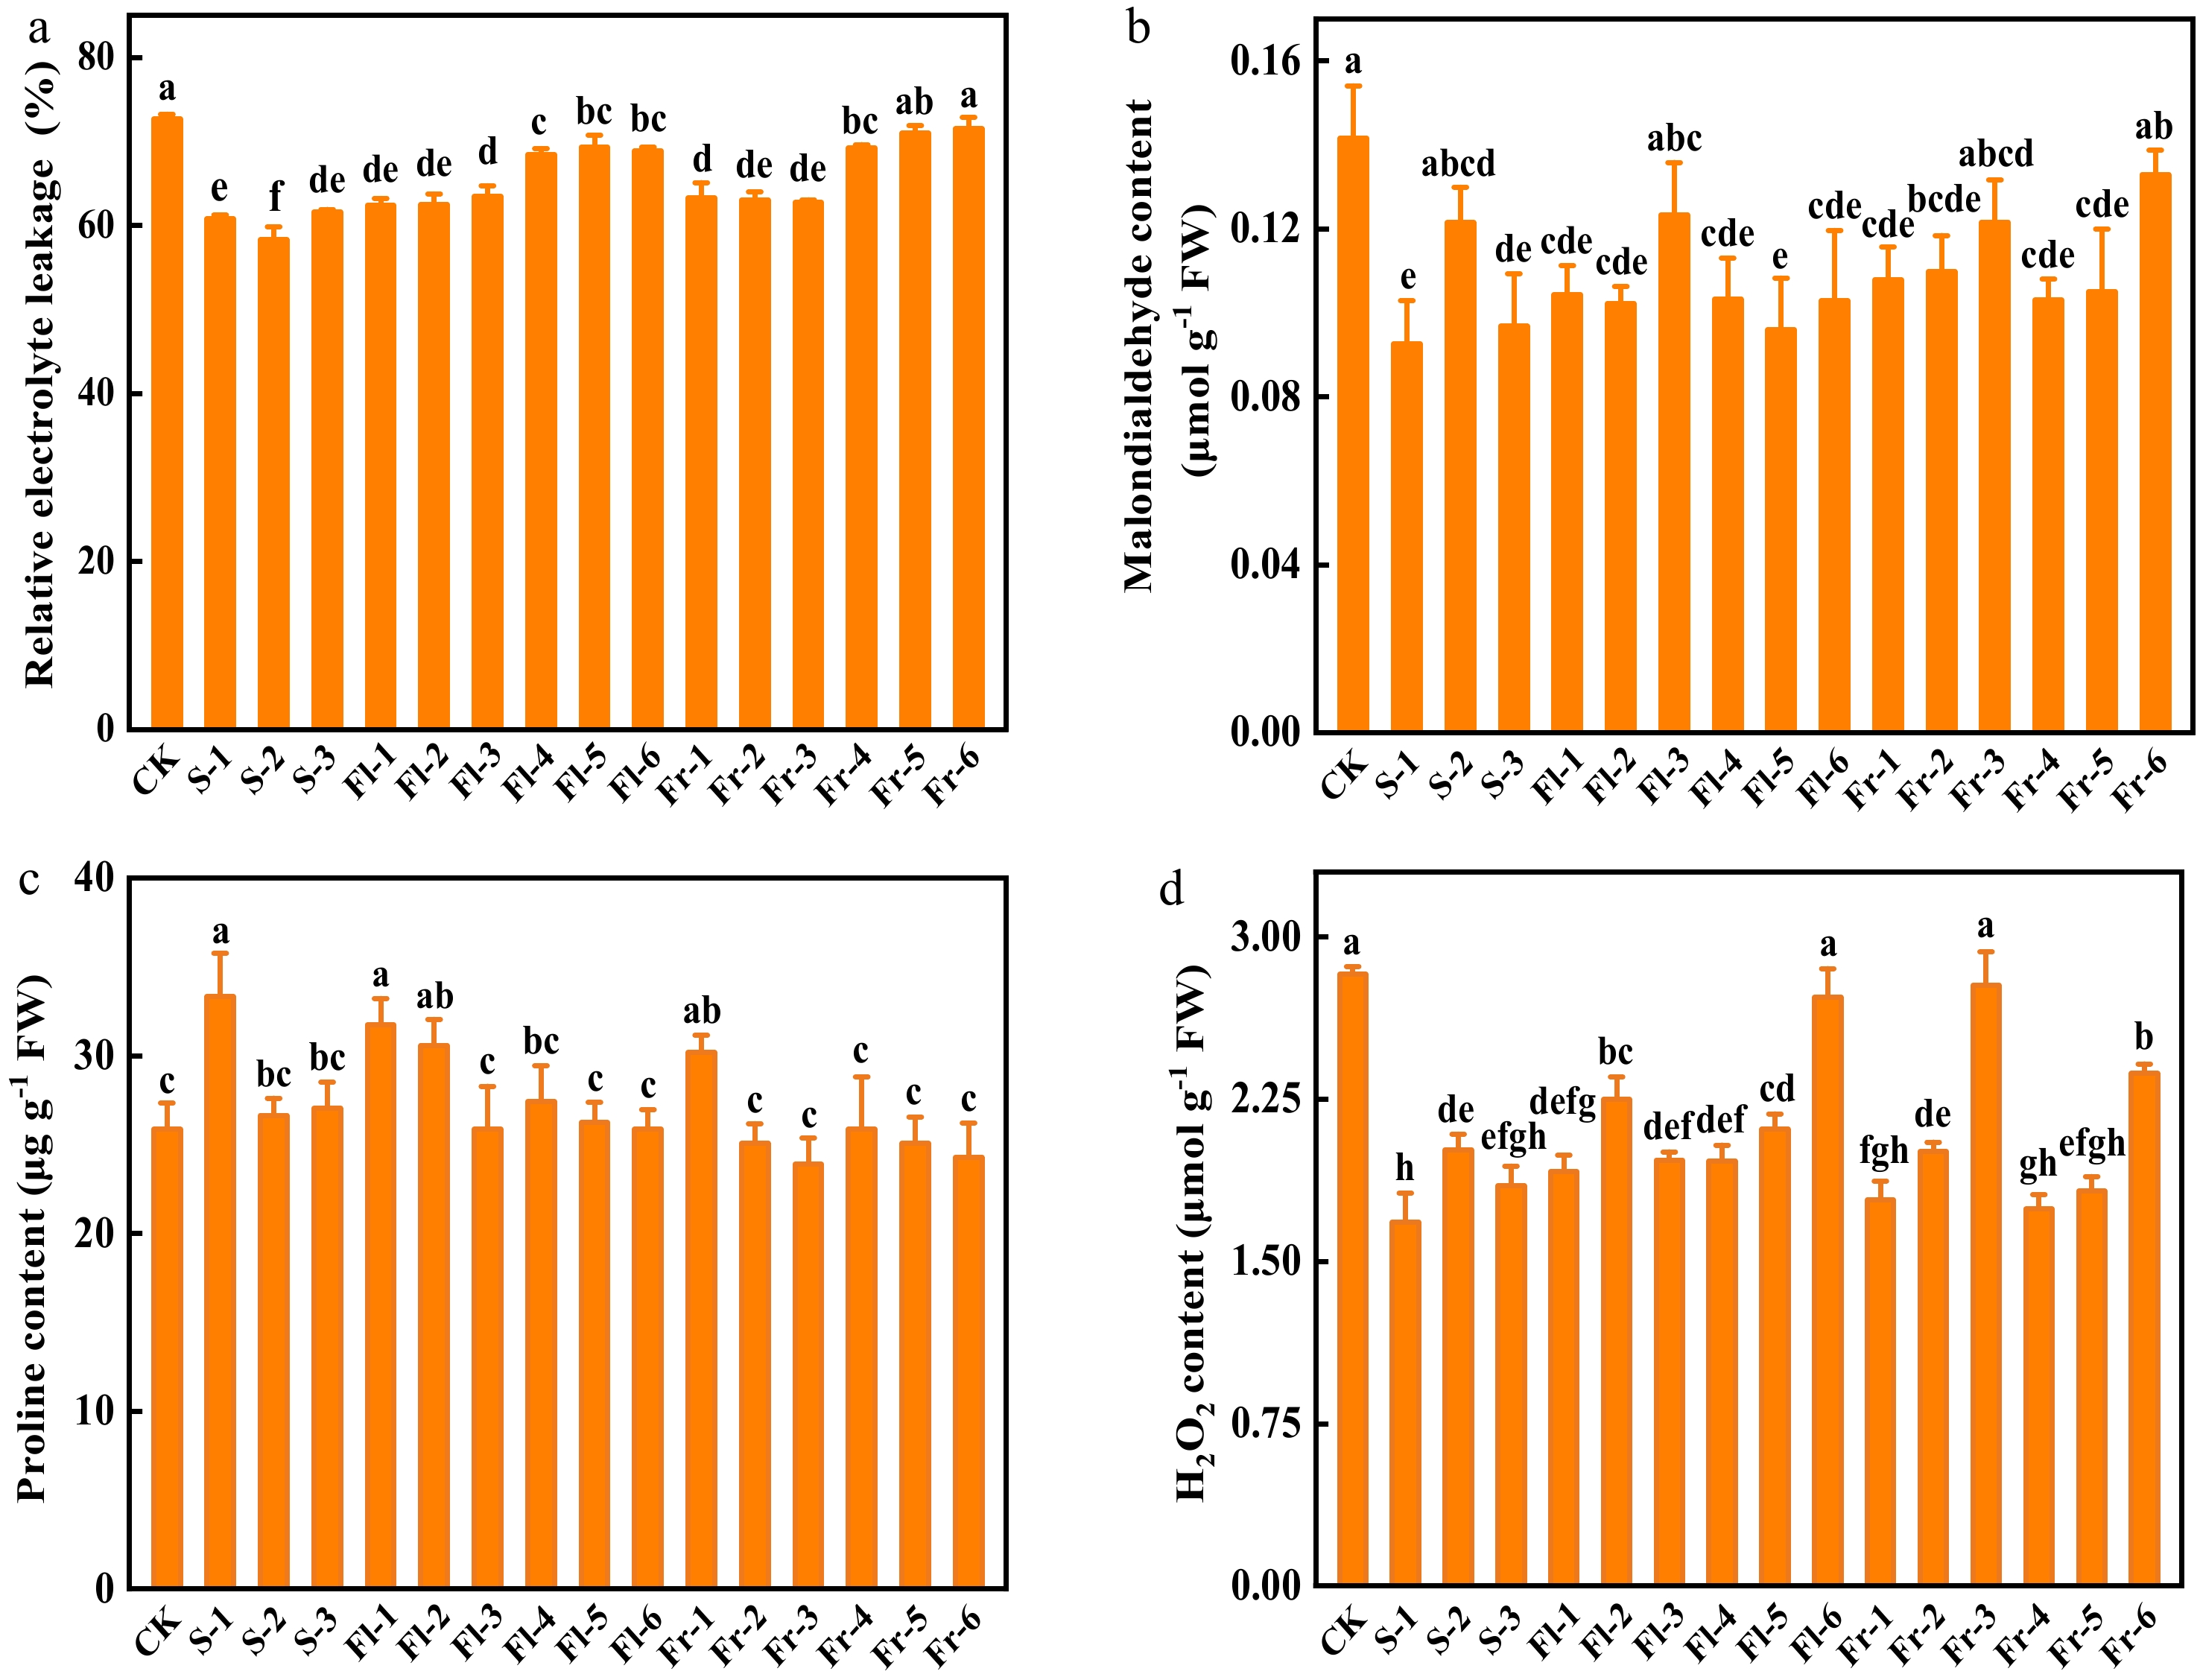
Figure 2.
Effects of the mixture of putrescine (Put), melatonin (MT), proline (Pro), and potassium fulvic acid (MFA) on relative electrolyte leakage, malondialdehyde, Pro, and H2O2 content of cucumber plants under high temperature stress. (a) Relative electrolyte leakage. (b) Malondialdehyde content. (c) Pro content. (d) H2O2 content. CK, cucumber plants without treatment with the mixture of 8 mmol L−1 Put, 50 µmol L−1 MT, 1.5 mmol L−1 Pro, and 0.3 g L−1 MFA (Put mixture, original concentration). S, Fl, and Fr indicated cucumber plants-treated with the Put mixture at seedling stage, flowering stage, and fruiting stage, respectively. 1, 2, and 3 indicated cucumber plants-treated with the original, diluted five times, and diluted ten times concentration of the Put mixture every 7 d, 3 times, respectively. 4, 5, and 6 indicated cucumber plants-treated with the original, diluted five times, and diluted ten times concentration of the Put mixture every 14 d, 3 times, respectively. Data represent as the mean ± SD (n = 3). Different letters indicate significant differences according to Tukey’s test at P ≤ 0.05. FW, fresh weight.
-
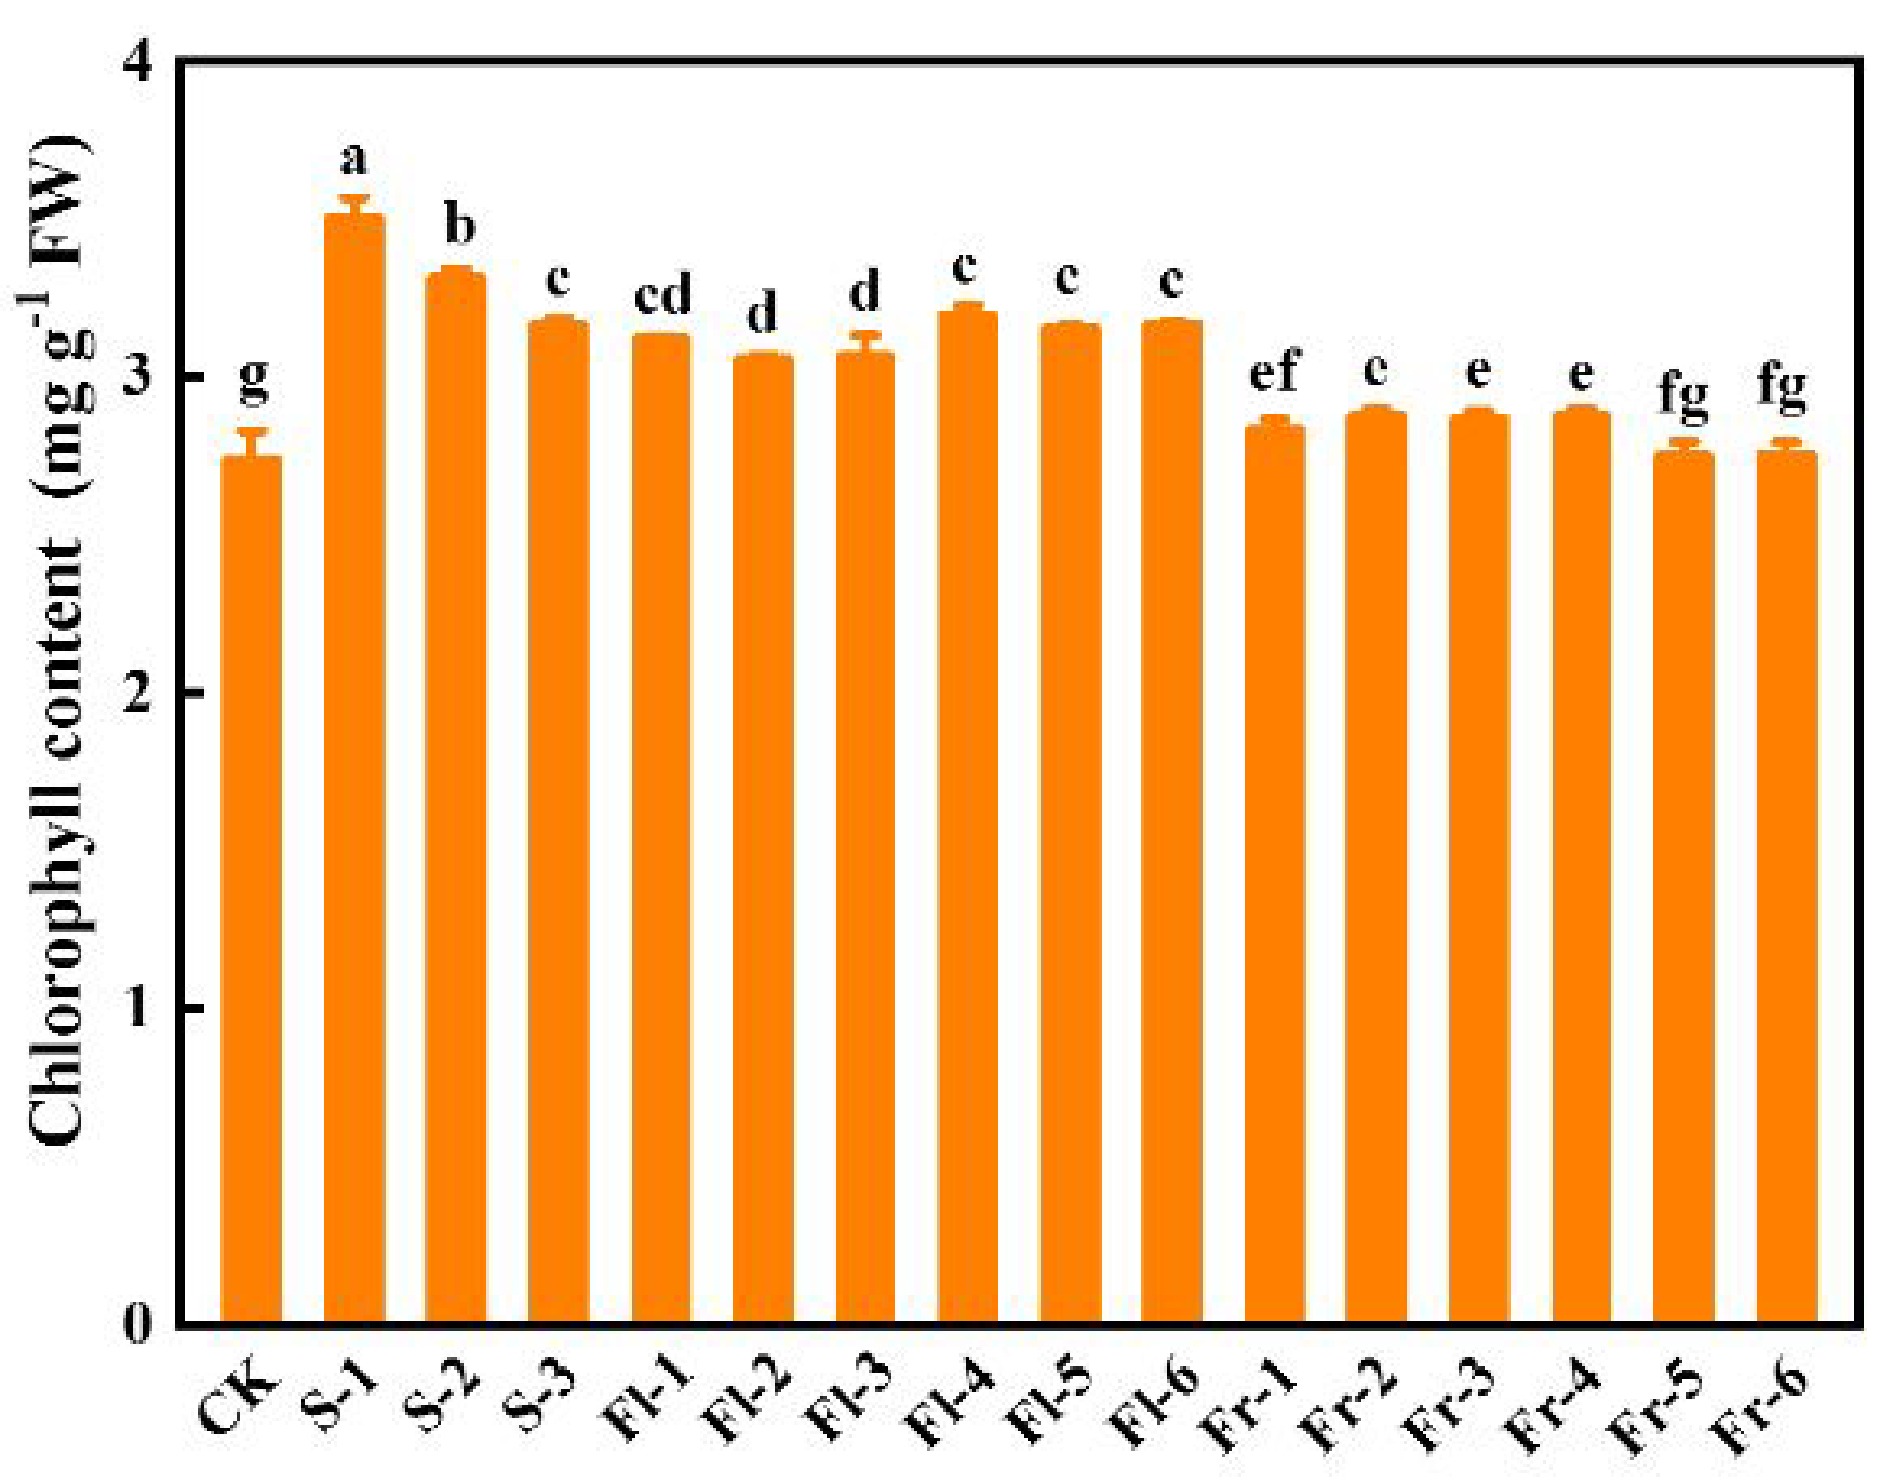
Figure 3.
Effects of the mixture of putrescine (Put), melatonin (MT), proline (Pro), and potassium fulvic acid (MFA) on chlorophyll content of cucumber leaves under high temperature stress. CK, cucumber plants without treatment with the mixture of 8 mmol L−1 Put, 50 µmol L−1 MT, 1.5 mmol L−1 Pro, and 0.3 g L−1 MFA (Put mixture, original concentration). S, Fl, and Fr indicated cucumber plants-treated with the Put mixture at seedling stage, flowering stage, and fruiting stage, respectively. 1, 2, and 3 indicated cucumber plants-treated with the original, diluted five times, and diluted ten times concentration of the Put mixture every 7 d, 3 times, respectively. 4, 5, and 6 indicated cucumber plants-treated with the original, diluted five times, and diluted ten times concentration of the Put mixture every 14 d, 3 times, respectively. Data represent as the mean ± SD (n = 3). Different letters indicate significant differences according to Tukey’s test at P ≤ 0.05. FW, fresh weight.
-
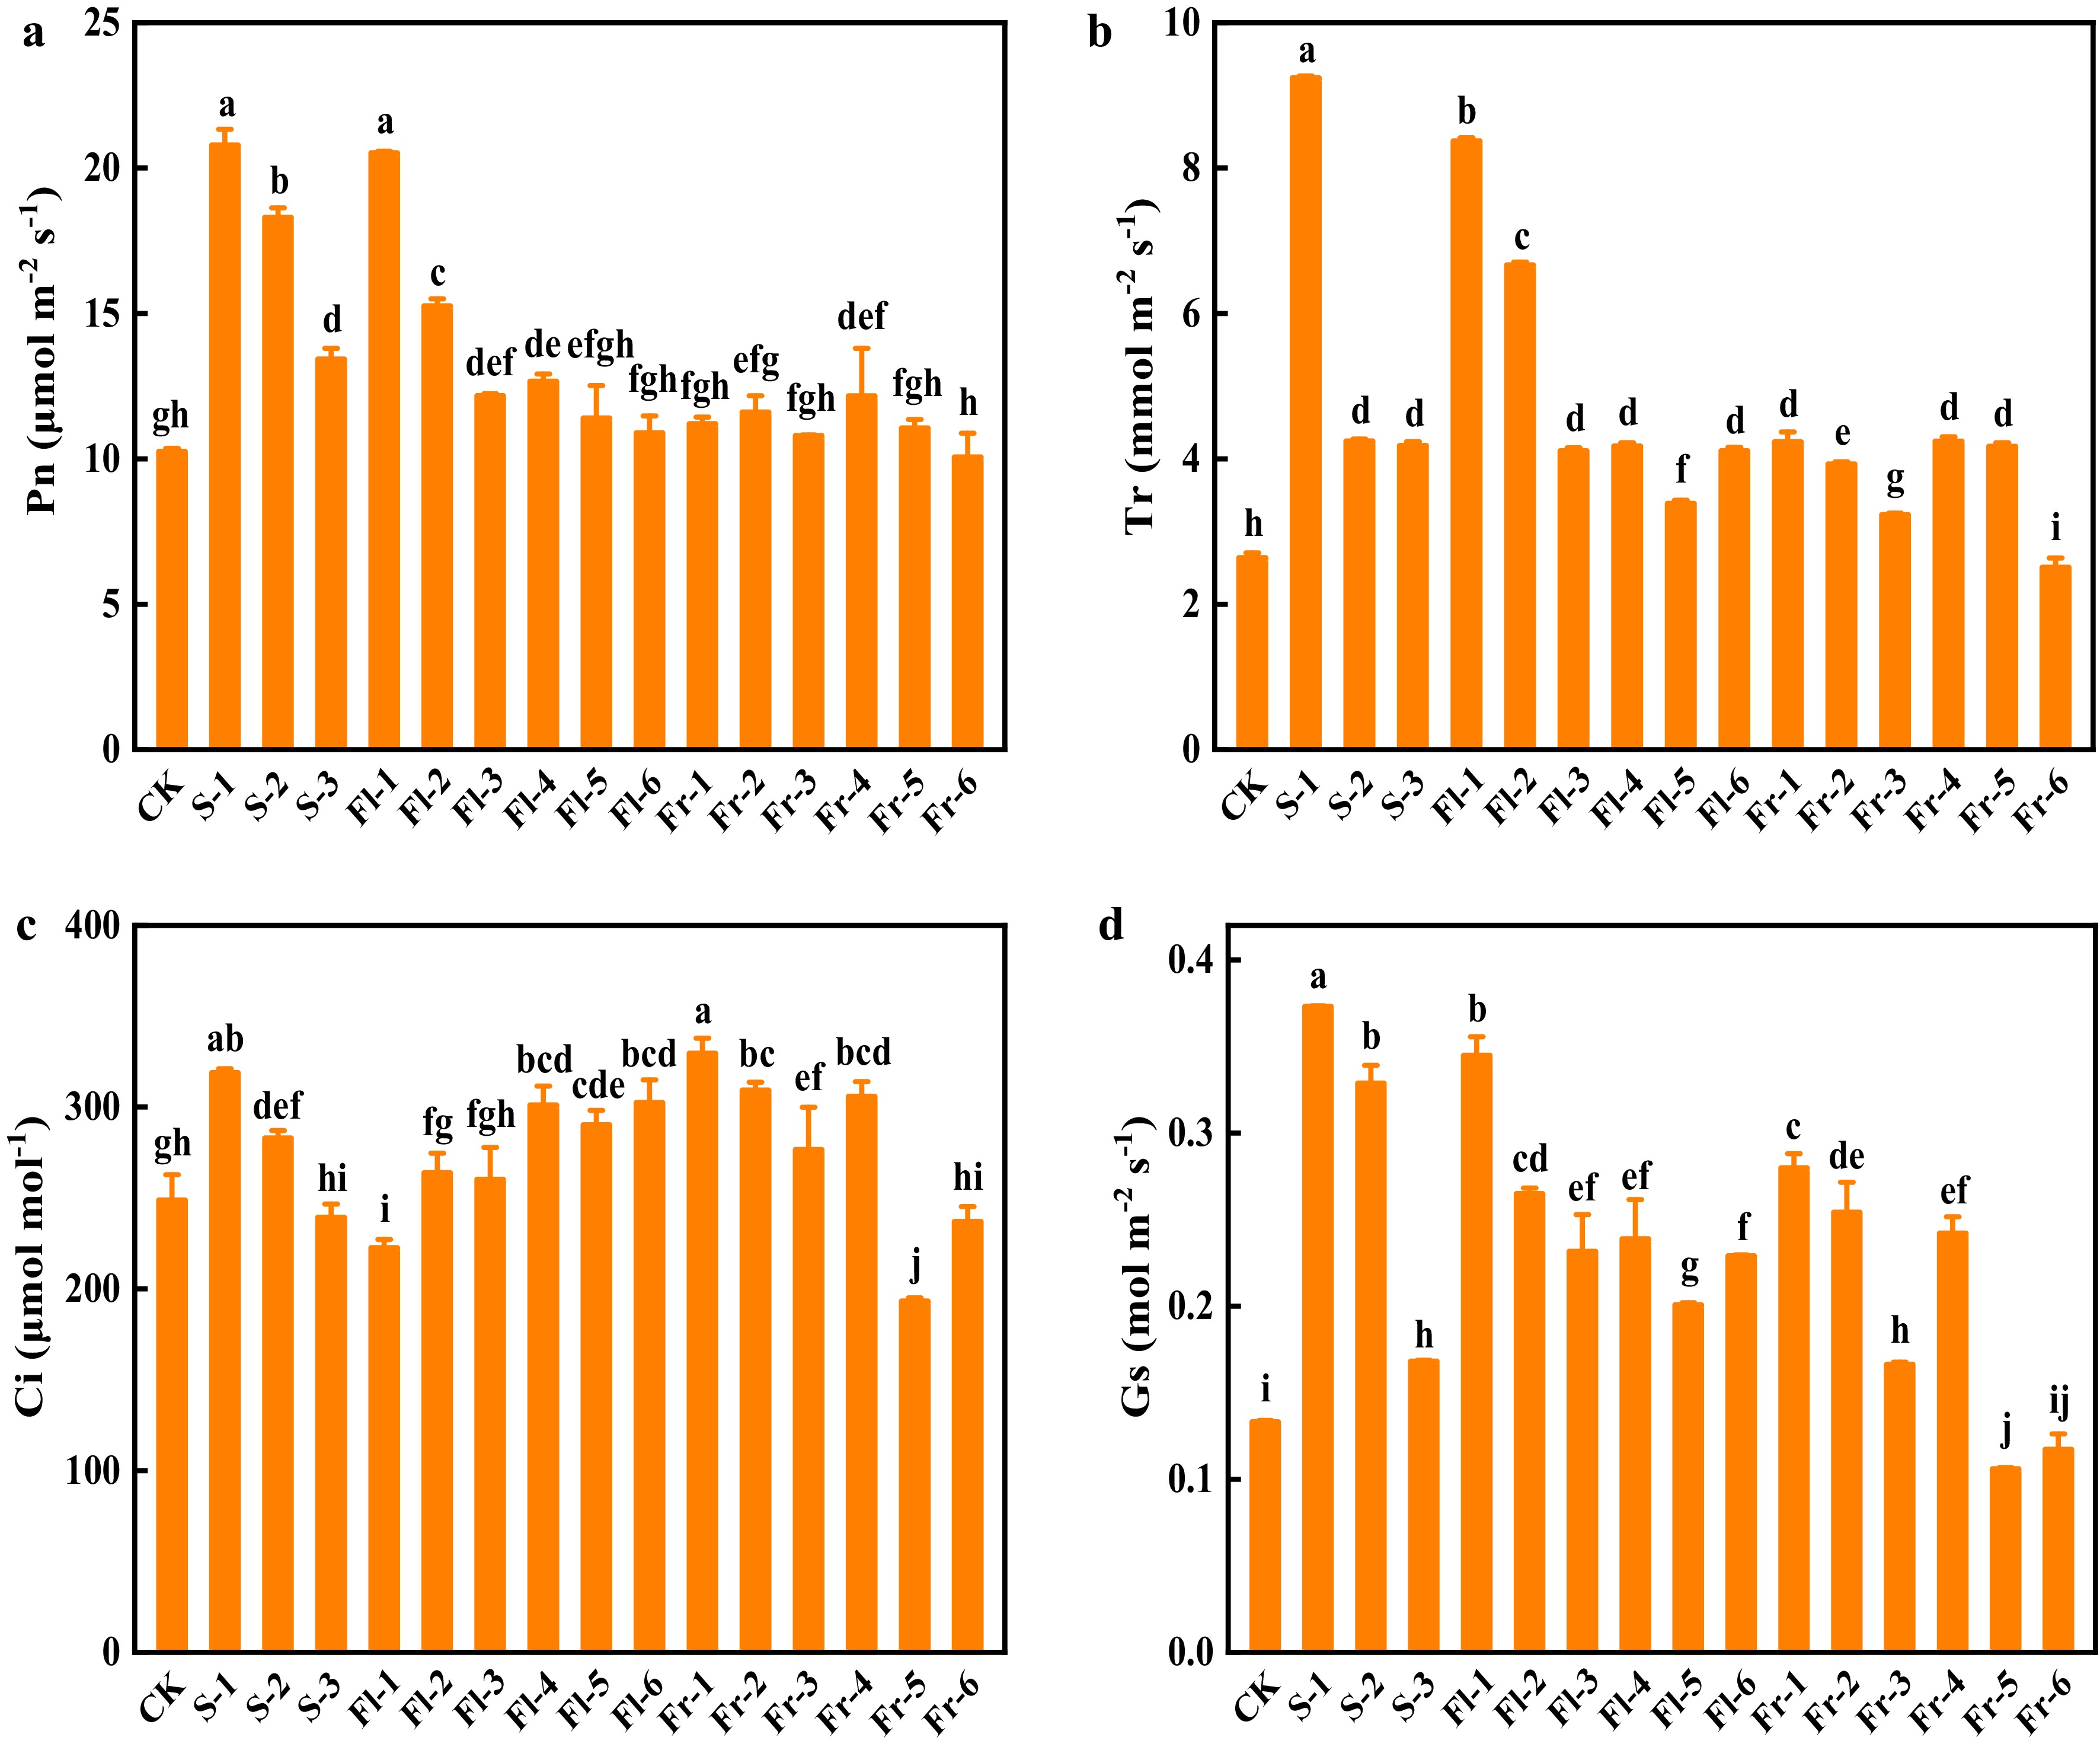
Figure 4.
Effects of the mixture of putrescine (Put), melatonin (MT), proline (Pro), and potassium fulvic acid (MFA) on gas exchange parameters of cucumber under high temperature stress. (a) Net photosynthetic rate (Pn). (b) Transpiration rate (Tr). (c) Intercellular CO2 concentration (Ci). (d) Stomatal conductance (Gs). CK, cucumber plants without treatment with the mixture of 8 mmol L−1 Put, 50 µmol L−1 MT, 1.5 mmol L−1 Pro, and 0.3 g L−1 MFA (Put mixture, original concentration). S, Fl, and Fr indicated cucumber plants-treated with the Put mixture at seedling stage, flowering stage, and fruiting stage, respectively. 1, 2, and 3 indicated cucumber plants-treated with the original, diluted five times, and diluted ten times concentration of the Put mixture every 7 d, 3 times, respectively. 4, 5, and 6 indicated cucumber plants-treated with the original, diluted five times, and diluted ten times concentration of the Put mixture every 14 d, 3 times, respectively. Data represent as the mean ± SD (n = 3). Different letters indicate significant differences according to Tukey’s test at P ≤ 0.05.
-
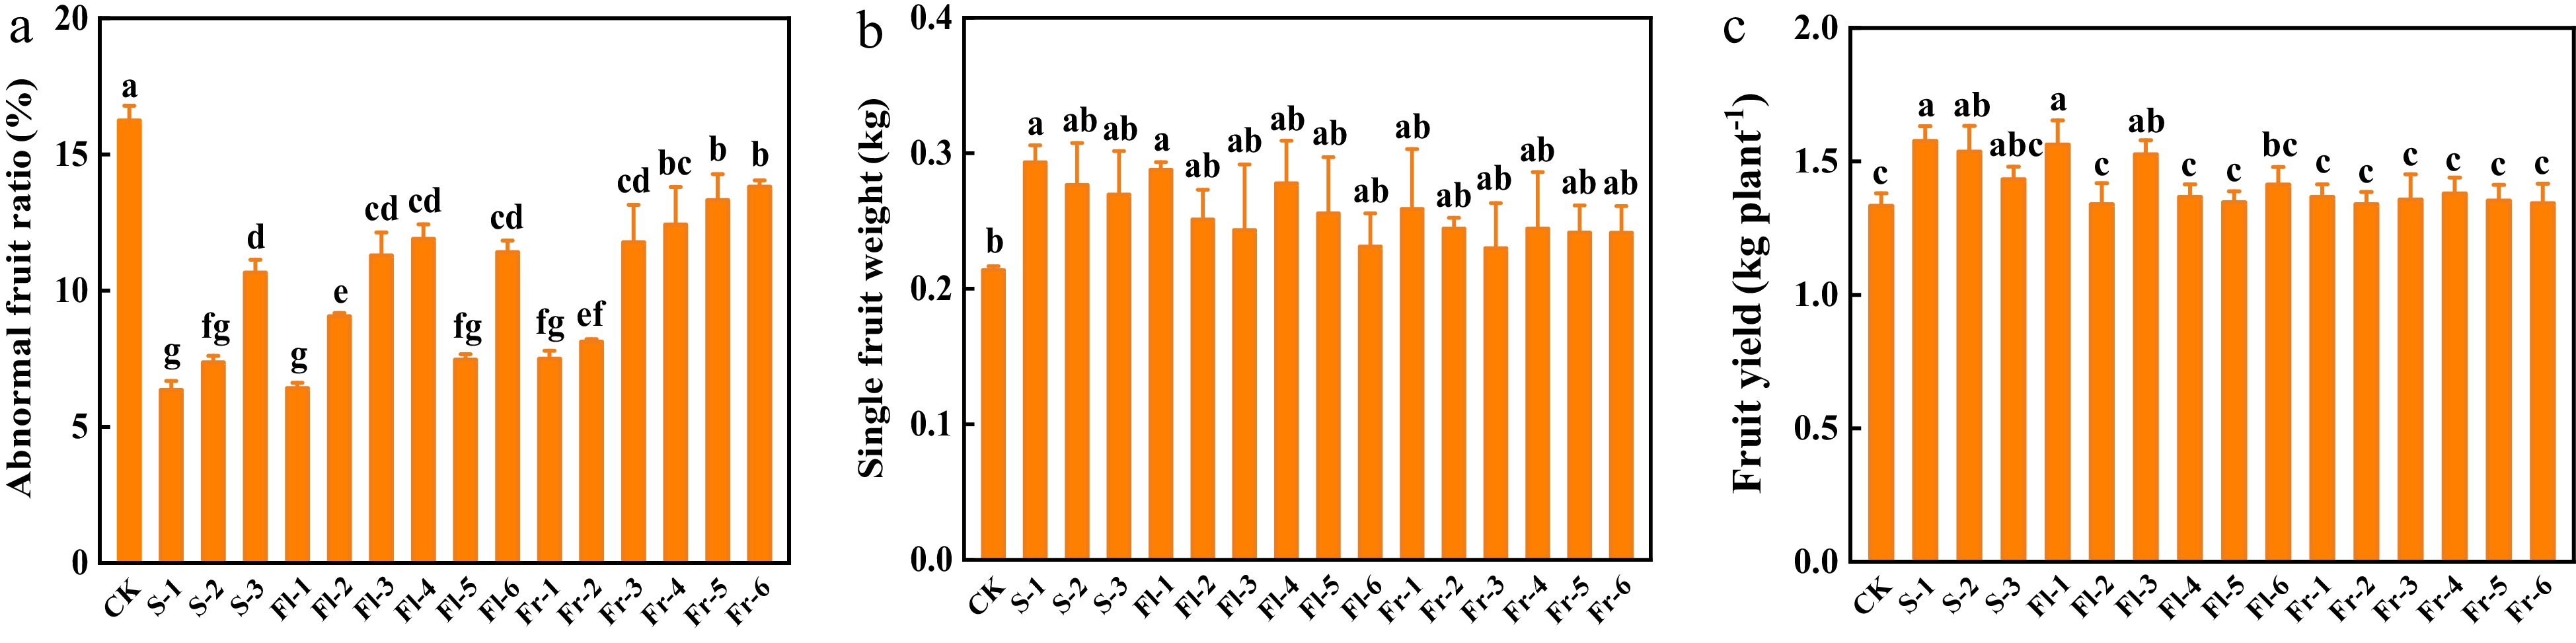
Figure 5.
Effects of the mixture of putrescine (Put), melatonin (MT), proline (Pro), and potassium fulvic acid (MFA) on fruit deformity rate and yield of cucumber. (a) Abnormal fruit ratio. (b) Single fruit weight. (c) Fruit yield per plant. CK, cucumber plants without treatment with the mixture of 8 mmol L−1 Put, 50 µmol L−1 MT, 1.5 mmol L−1 Pro, and 0.3 g L−1 MFA (Put mixture, original concentration). S, Fl, and Fr indicated cucumber plants-treated with the Put mixture at seedling stage, flowering stage, and fruiting stage, respectively. 1, 2, and 3 indicated cucumber plants-treated with the original, diluted five times, and diluted ten times concentration of the Put mixture every 7 d, 3 times, respectively. 4, 5, and 6 indicated cucumber plants-treated with the original, diluted five times, and diluted ten times concentration of the Put mixture every 14 d, 3 times, respectively. Data represent as the mean ± SD (n = 3). Different letters indicate significant differences according to Tukey’s test at P ≤ 0.05.
-
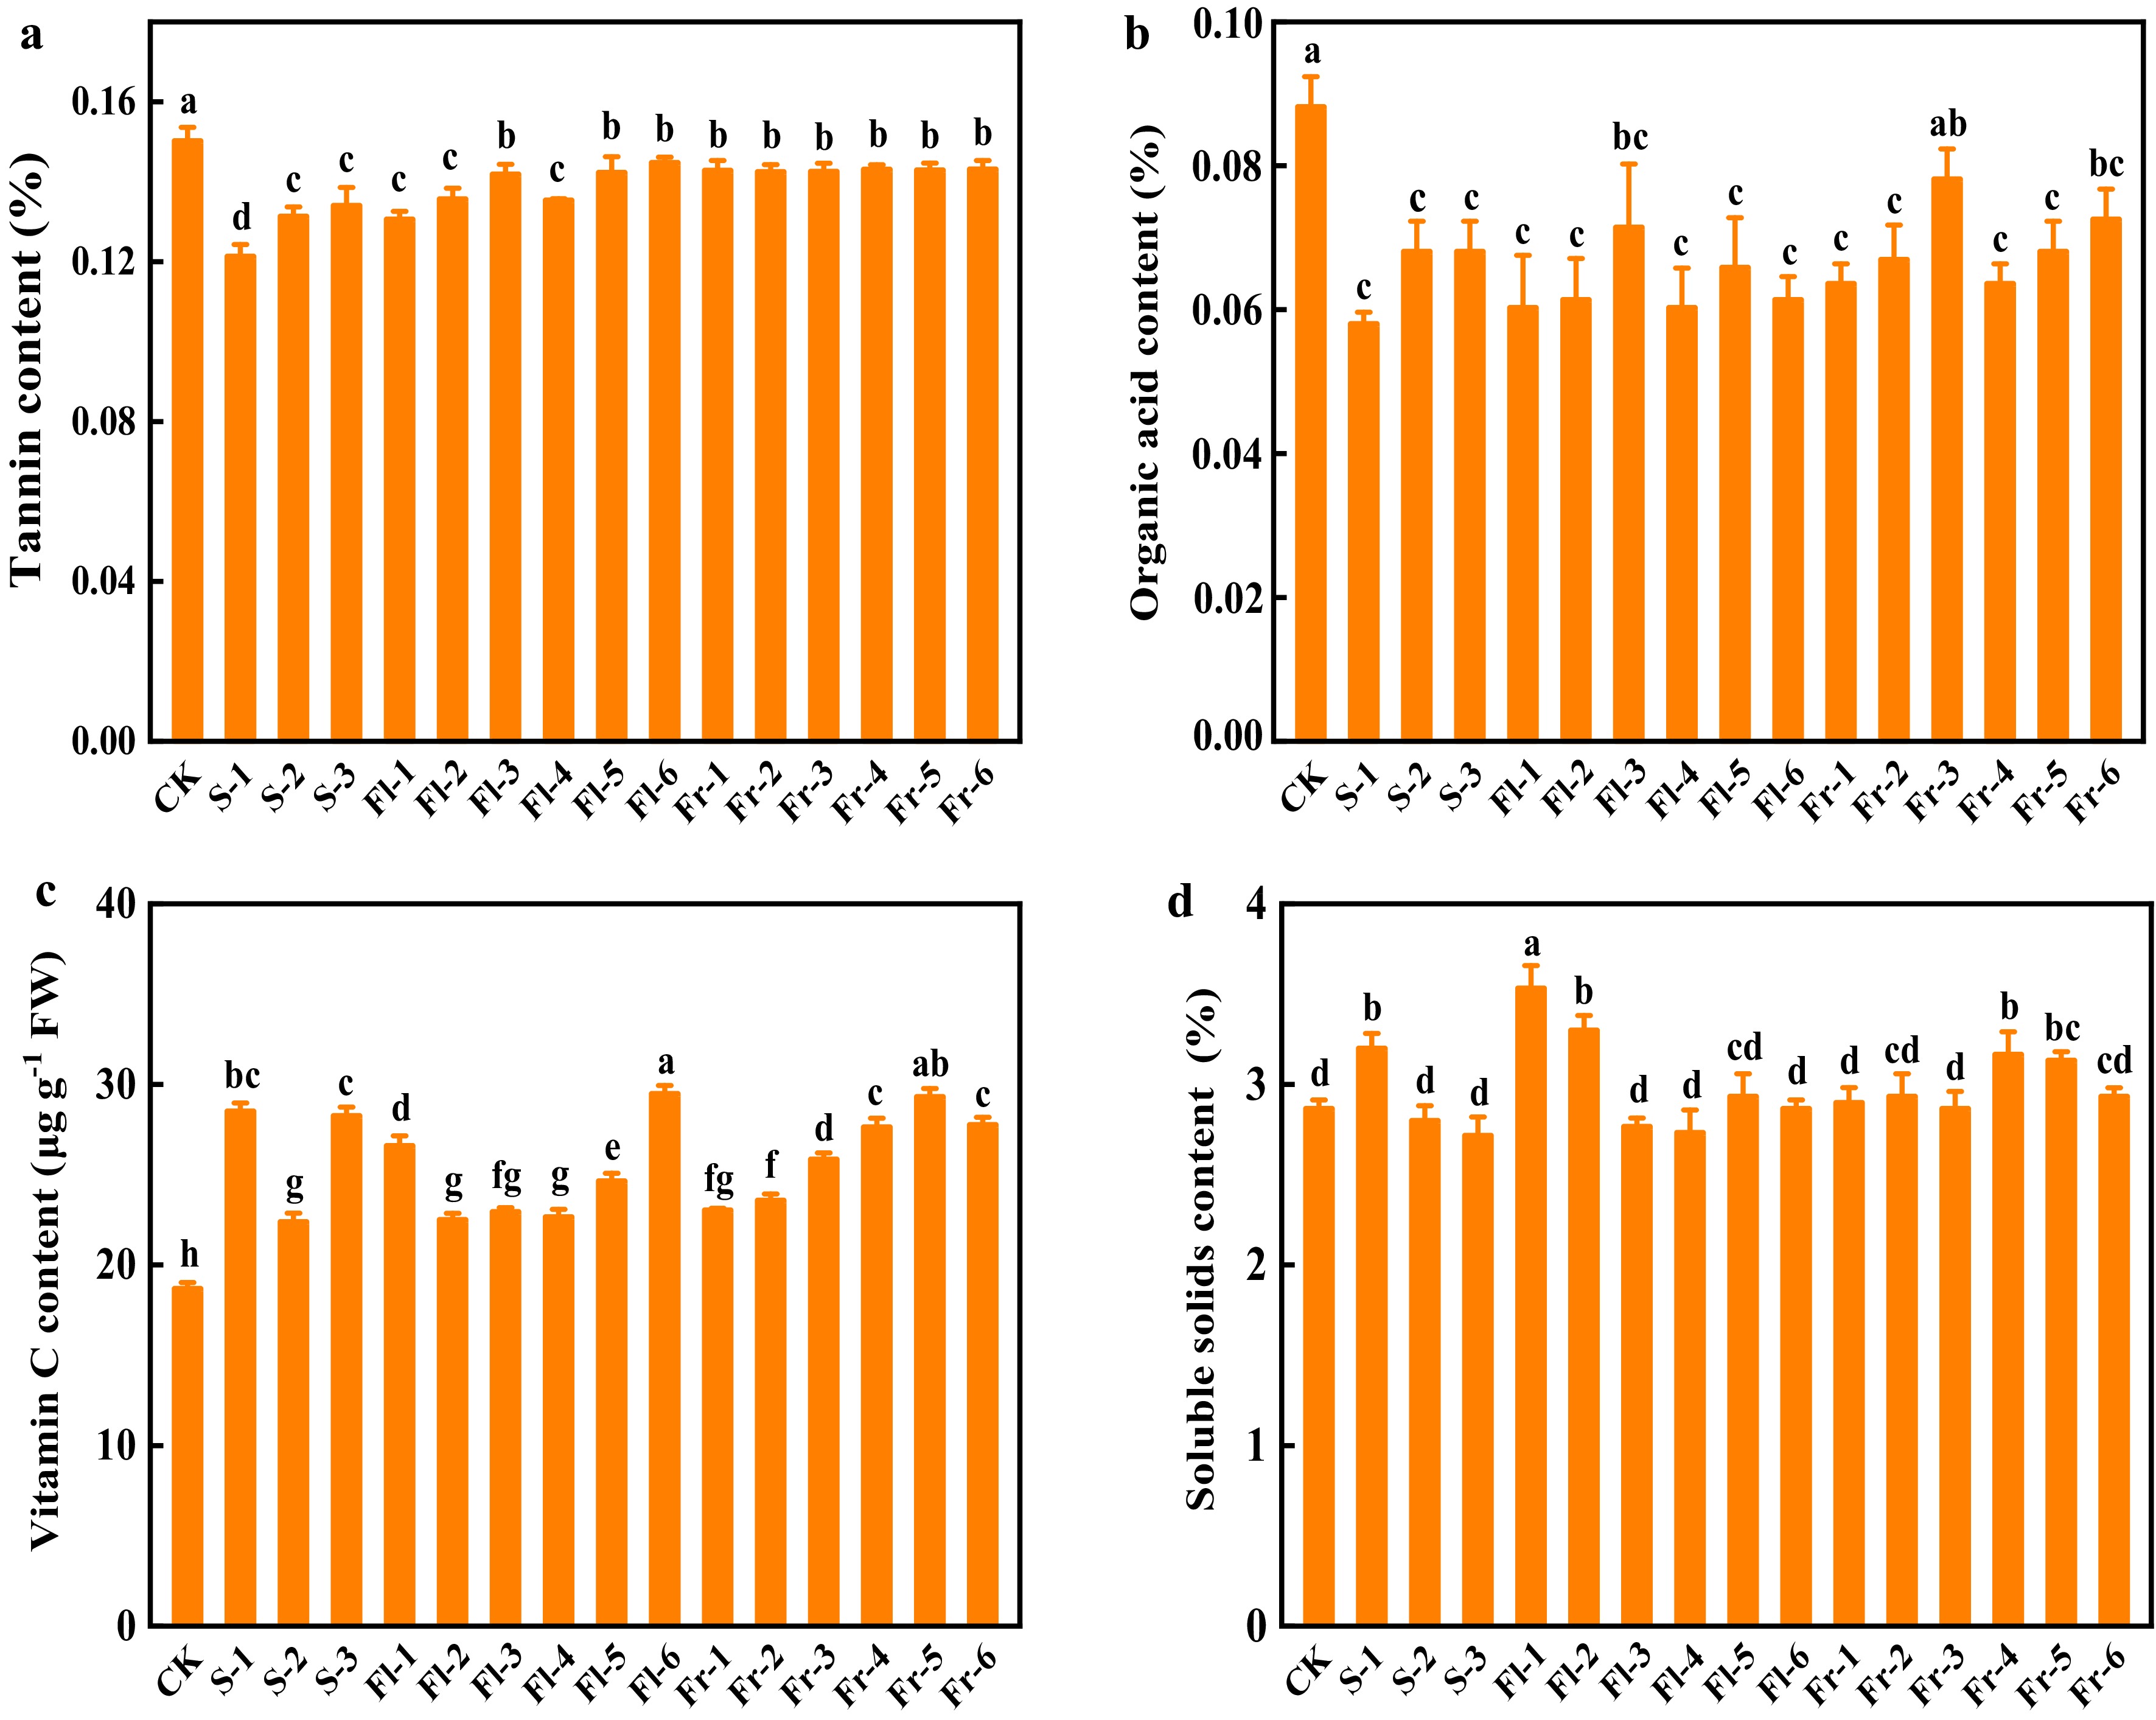
Figure 6.
Effects of the mixture of putrescine (Put), melatonin (MT), proline (Pro), and potassium fulvic acid (MFA) on fruit quality of cucumber. (a) Tannin content. (b) Organic acid content. (c) Vitamin C content. (d) Soluble solids content. CK, cucumber plants without treatment with the mixture of 8 mmol L−1 Put, 50 µmol L−1 MT, 1.5 mmol L−1 Pro, and 0.3 g L−1 MFA (Put mixture, original concentration). S, Fl, and Fr indicated cucumber plants-treated with the Put mixture at seedling stage, flowering stage, and fruiting stage, respectively. 1, 2, and 3 indicated cucumber plants-treated with the original, diluted five times, and diluted ten times concentration of the Put mixture every 7 d, 3 times, respectively. 4, 5, and 6 indicated cucumber plants-treated with the original, diluted five times, and diluted ten times concentration of the Put mixture every 14 d, 3 times, respectively. Data represent as the mean ± SD (n = 3). Different letters indicate significant differences according to Tukey’s test at P ≤ 0.05.
-
Treatment Putrescine
concentration
(mmol L−1)Potassium fulvic acid concentration
(g L−1)Proline
concentration
(mmol L−1)Melatonin
concentration
(µmol L−1)Spraying interval (d) Spraying stage CK − − − − − S-1 8 0.3 1.5 50 7 Seedling stage S-2 1.6 0.06 0.3 10 7 Seedling stage S-3 0.8 0.03 0.15 5 7 Seedling stage Fl-1 8 0.3 1.5 50 7 Flowering stage Fl-2 1.6 0.06 0.3 10 7 Flowering stage Fl-3 0.8 0.03 0.15 5 7 Flowering stage Fl-4 8 0.3 1.5 50 14 Flowering stage Fl-5 1.6 0.06 0.3 10 14 Flowering stage Fl-6 0.8 0.03 0.15 5 14 Flowering stage Fr-1 8 0.3 1.5 50 7 Fruiting stage Fr-2 1.6 0.06 0.3 10 7 Fruiting stage Fr-3 0.8 0.03 0.15 5 7 Fruiting stage Fr-4 8 0.3 1.5 50 14 Fruiting stage Fr-5 1.6 0.06 0.3 10 14 Fruiting stage Fr-6 0.8 0.03 0.15 5 14 Fruiting stage Table 1.
Spraying concentration and stage of cucumber with putrescine mixture.
Figures
(6)
Tables
(1)