-

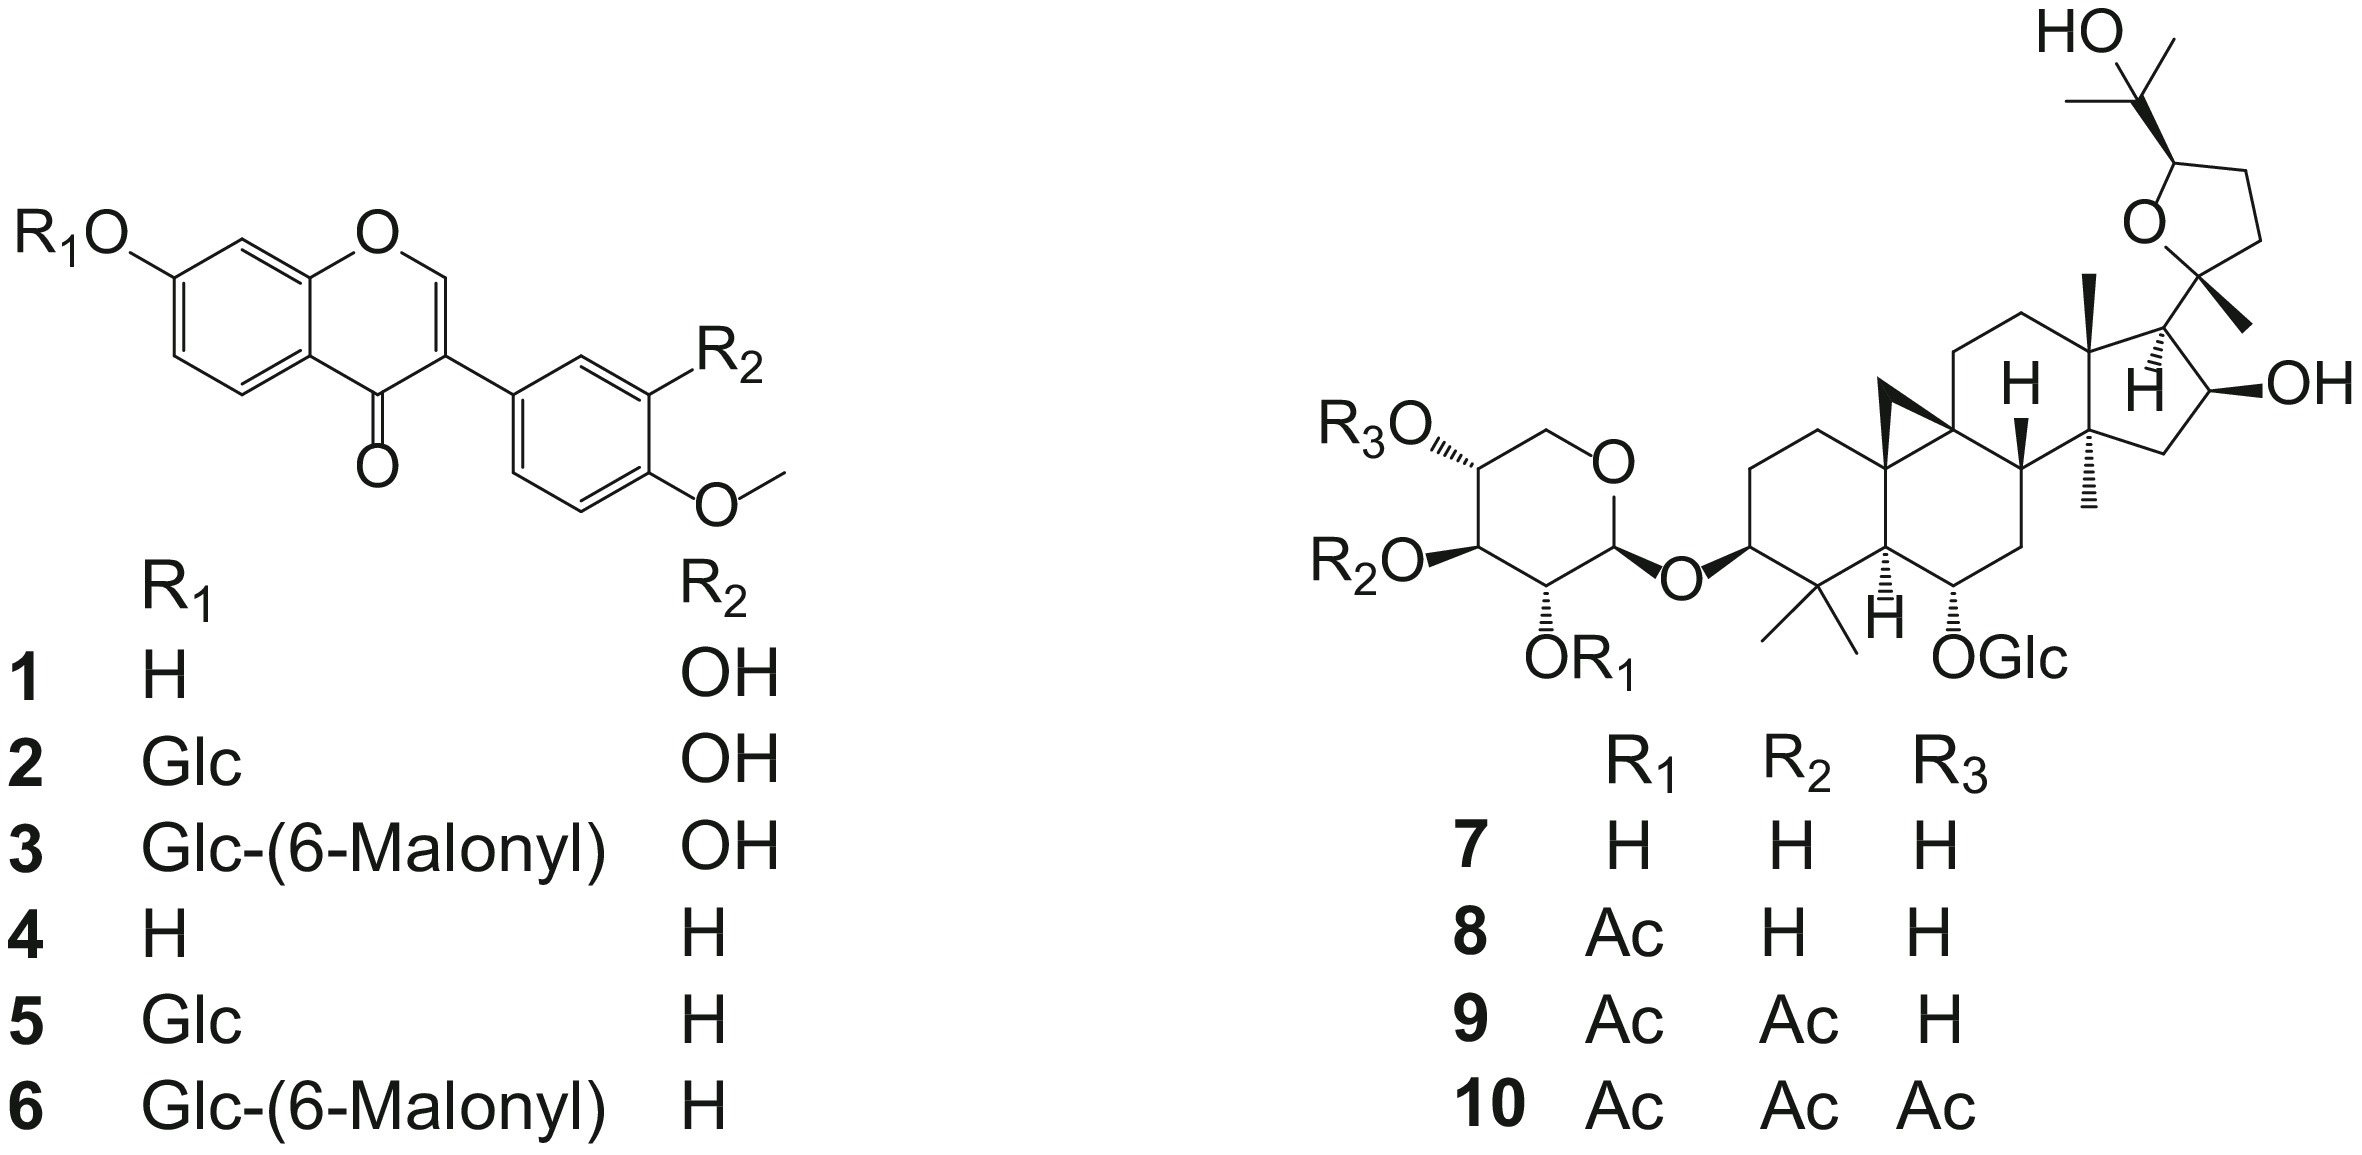
Figure 1.
Structures of 10 marker compounds of Radix Astragali.
-

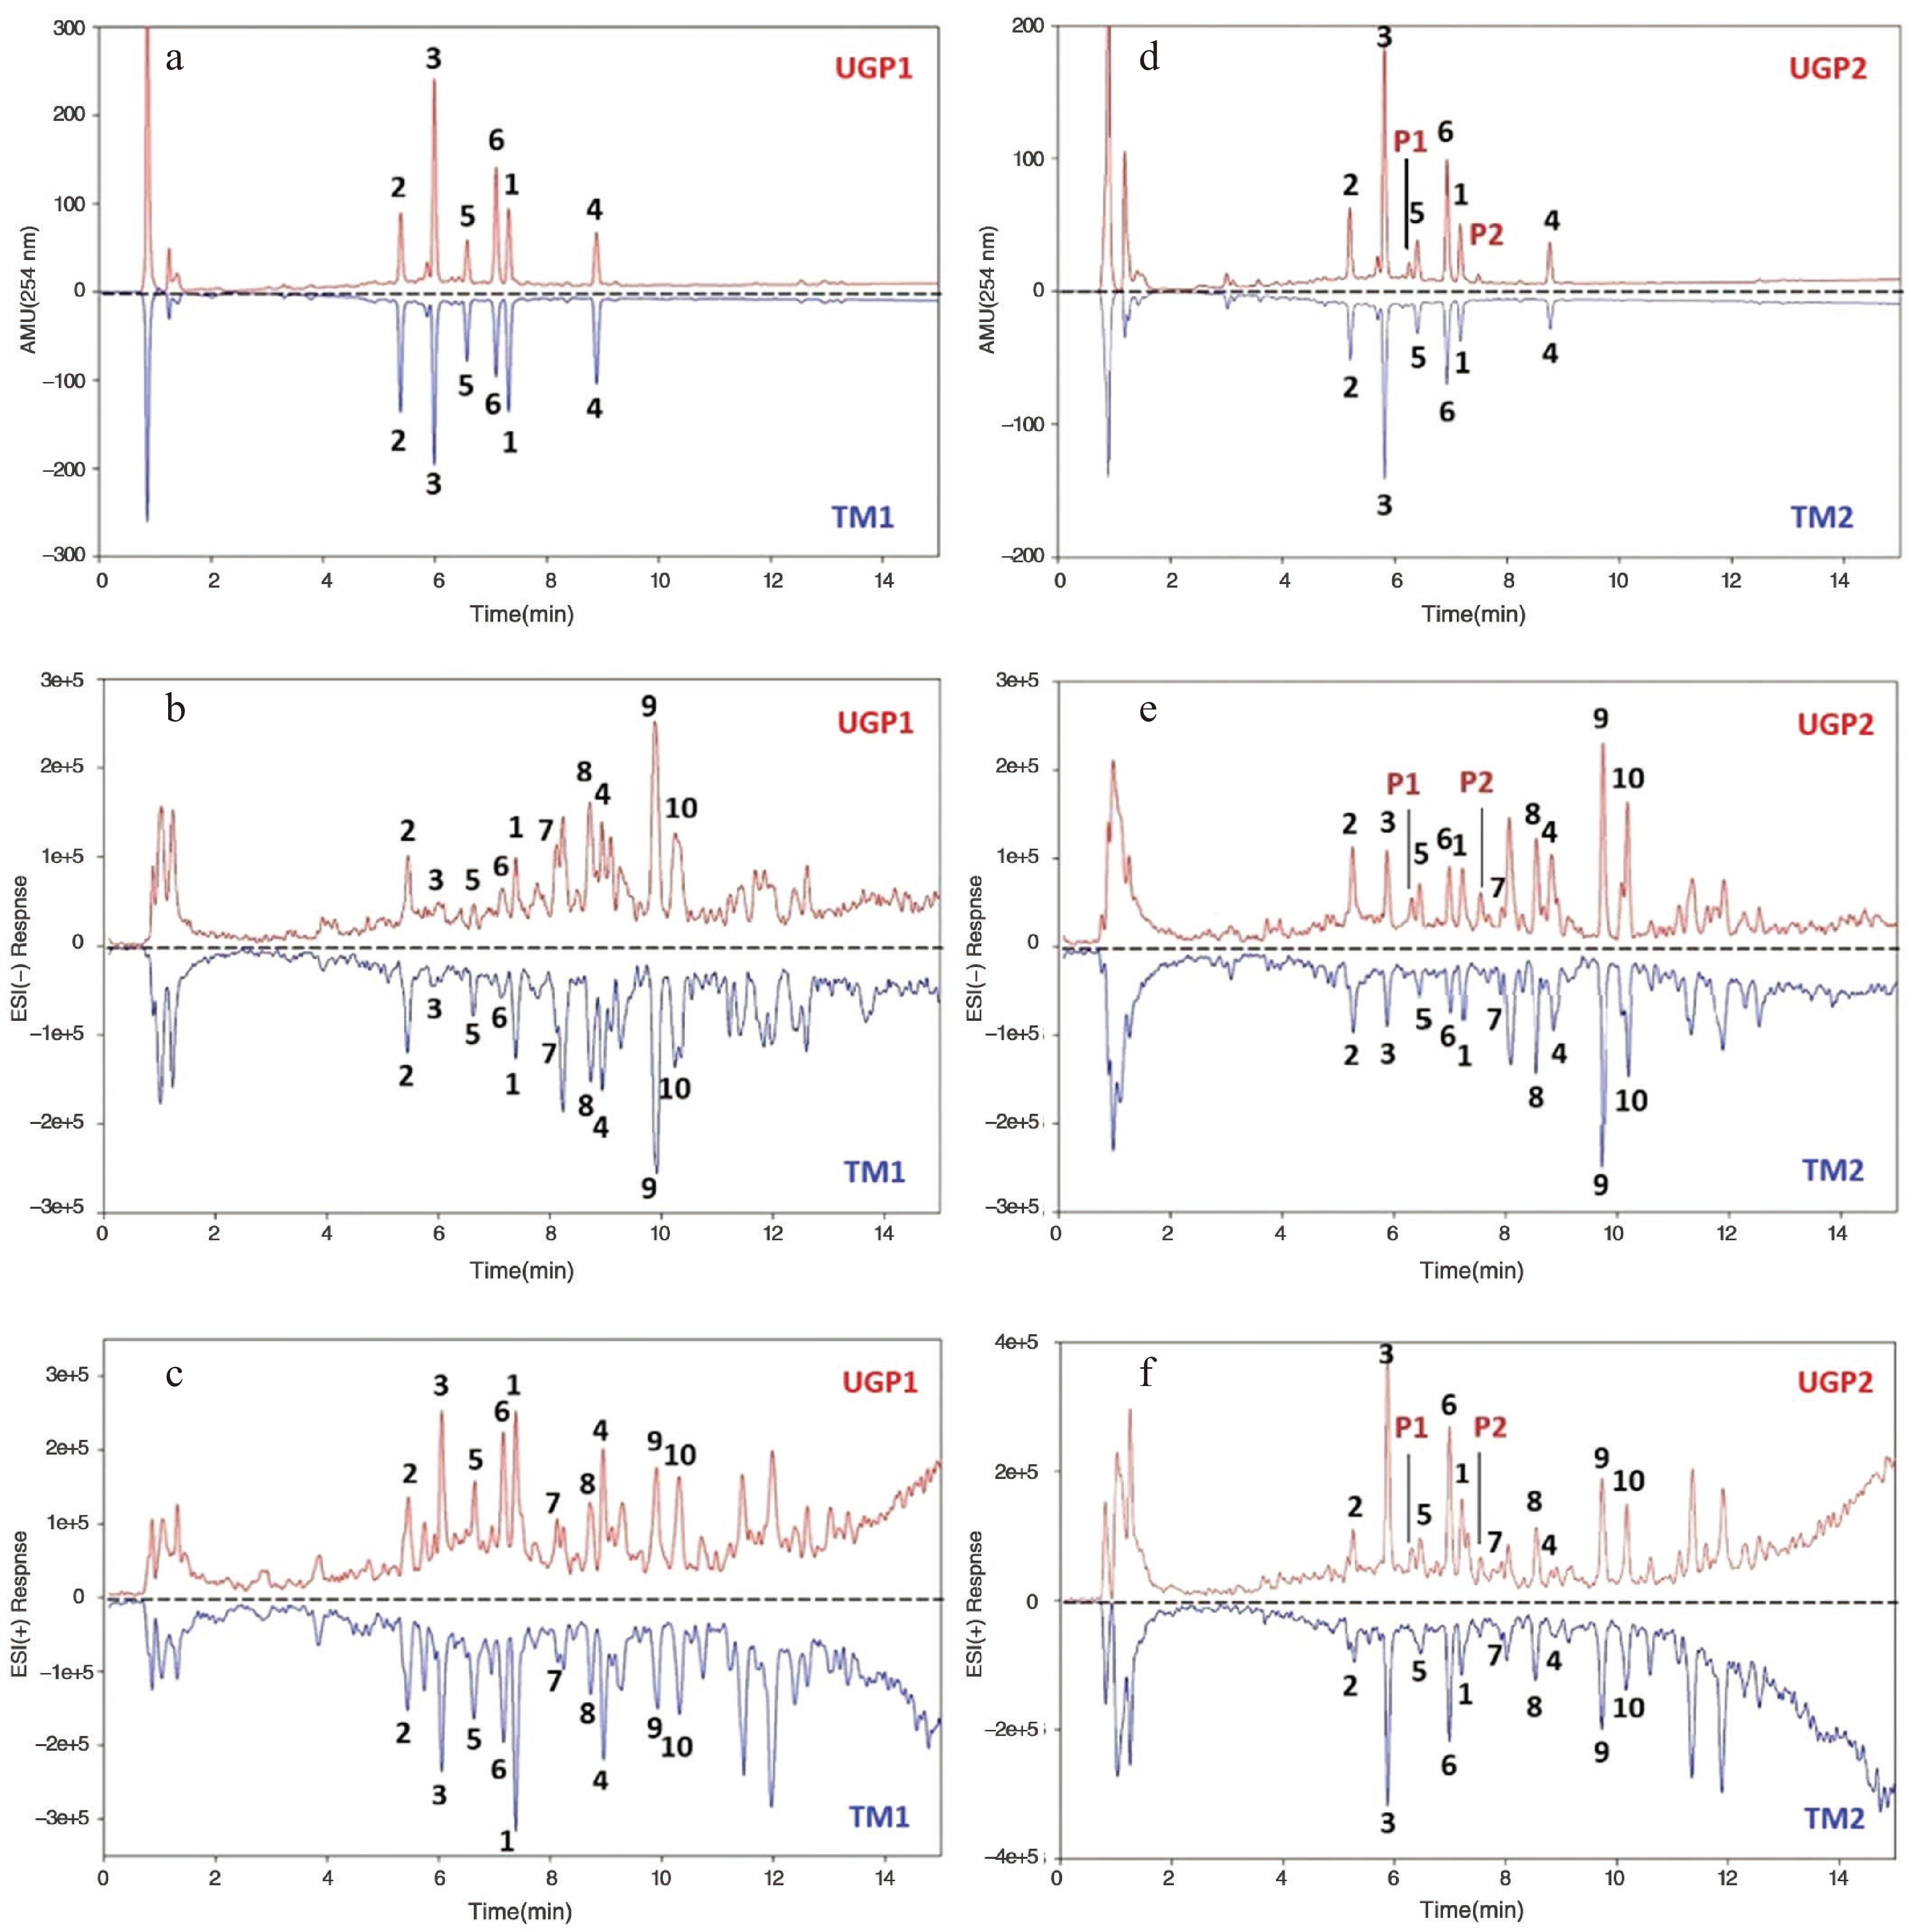
Figure 2.
Comparison of UHPLC/DAD-MS UV254 nm, ESI negative, ESI positive chromatograms between ultrafine granular powder (UGP) and sliced traditional material (TM) of Radix Astragali. UV 254 nm chromatograms (a) UGP1 (top) and TM1 (down), (d) UGP2 (top) and TM (down); ESI negative chromatograms (b) UGP1 (top) and TM1 (down), (e) UGP2 (top) and TM2 (down); ESI positive chromatograms (c) UGP1 (top) and TM1 (down), (f) UGP2 (top) and TM2 (down).
-

Figure 3.
Comparison of content (mg/g dry material) for marker compounds 1, 4, and 8 between ultrafine granular powder (UGP) and sliced traditional material (TM) of Radix Astragali. (a) UGP2 and TM2 accessions (n = 10); (b) UGP3 and TM3 accessions (n = 10).
-

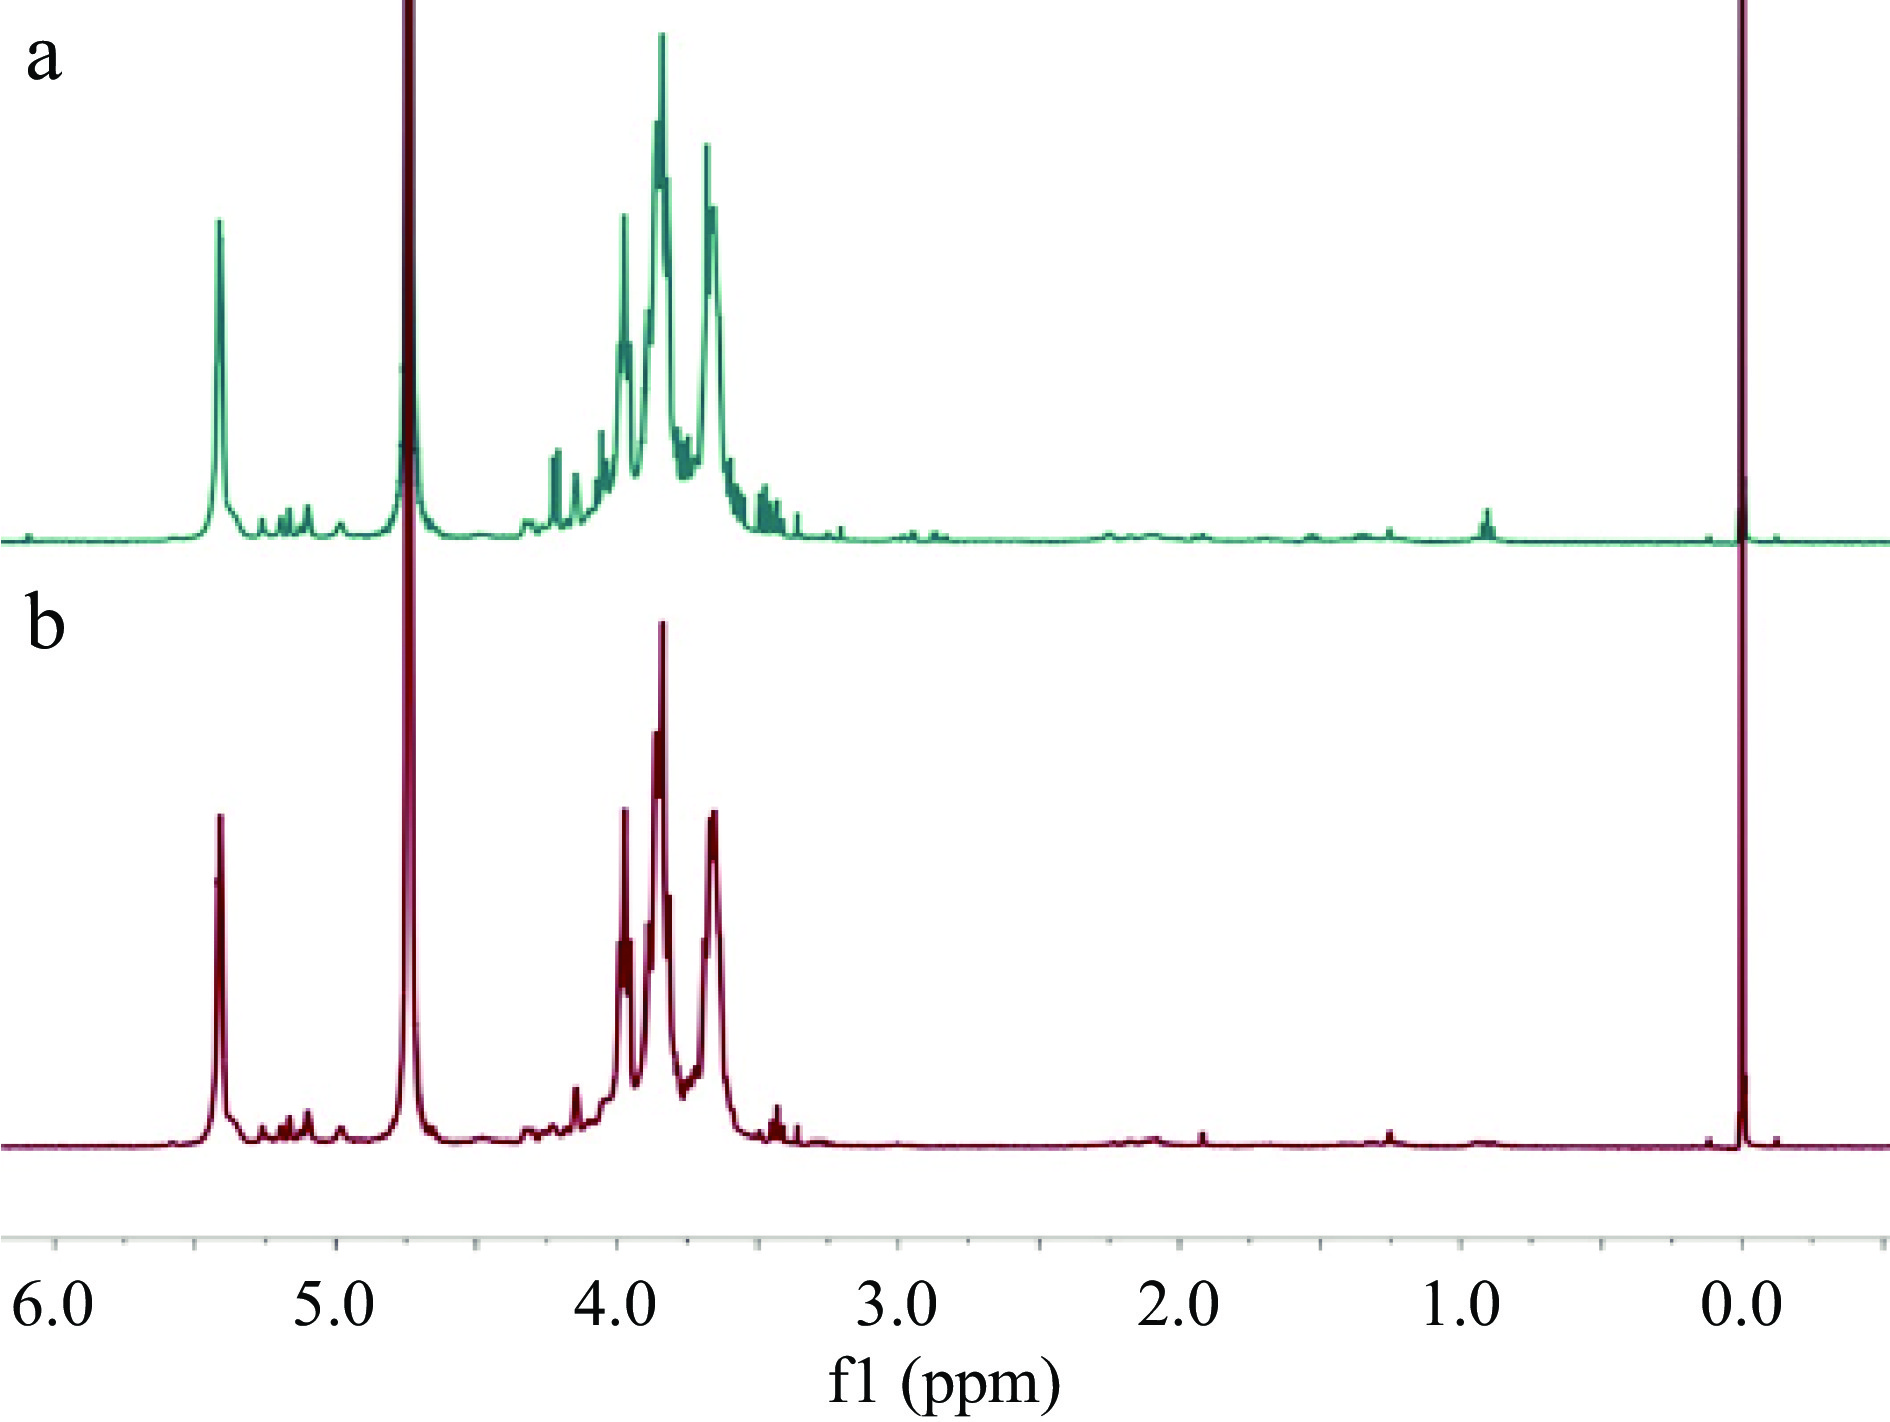
Figure 4.
1H NMR spectra (500 MHz) of RAPS from (a) TM4 and (b) UGP4, recorded at a concentration of 10 mg/mL in D2O.
-
Analyte tR (min) MS (m/z) MW DAD 254 nm MS ESI (+) ESI (–) 1 7.187 285 [M + H]+ 283 [M − H]− 284 2 5.219 447 [M + H]+ 491 [M + HCOO]− 446 3 5.810 533 [M + H]+ 475 [M − Malonyl + HCOO]− 532 4 8.791 269 [M + H]+ 267 [M − H]− 268 5 6.411 431 [M + H]+ 475 [M + HCOO]− 430 6 6.928 517 [M + H]+ 267 [M – Malonyl – Glc -H]− 516 7 7.939 807 [M + Na]+ 829 [M + HCOO]− 784 8 8.571 849 [M + Na]+ 871 [M + HCOO]− 826 9 9.737 891 [M + Na]+ 913 [M + HCOO]− 868 10 10.166 933 [M + Na]+ 955 [M + HCOO]− 910 Table 1.
Retention time (tR) and characteristic MS data of 10 marker compounds.
-
Compound Detector UGP2 (mean ± SD mg/g) RSD (%) TM2 (mean ± SD mg/g) RSD (%) 1 UV 254 0.062 ± 0.002** 3.05 0.038 ± 0.016** 43.80 2 UV 254 0.190 ± 0.010* 5.09 0.239 ± 0.040* 17.94 3 UV 254 0.768 ± 0.015* 1.94 0.909 ± 0.185* 20.31 4 UV 254 0.078 ± 0.002** 1.91 0.064 ± 0.006** 8.55 5 UV 254 0.123 ± 0.004* 3.13 0.148 ± 0.020* 13.65 6 UV 254 0.388 ± 0.007 1.70 0.403 ± 0.082 18.96 Total isoflavonoids 1.609 ± 0.029 1.83 1.827 ± 0.329 18.00 8 ESI- 0.091 ± 0.007 7.68 0.096 ± 0.017 18.30 9 ESI- 0.283 ± 0.021 7.58 0.292 ± 0.028 9.58 10 ESI- 0.113 ± 0.009 8.38 0.115 ± 0.015 12.82 Total astragalosides 0.487 ± 0.019 3.82 0.503 ± 0.046 9.11 Table 2.
Content of marker compounds 1−6 and 8−10 (mg/g dry material) in UGP2 and TM2 from the same source of Radix Astragali (n = 10).
-
Compound Detector UGP3 (mean ± SD mg/g) RSD (%) TM3 (mean ± SD mg/g) RSD (%) 1 UV 254 0.162 ± 0.004 2.21 0.179 ± 0.067 37.74 2 UV 254 0.212 ± 0.008 3.82 0.188 ± 0.044 23.23 3 UV 254 0.656 ± 0.010** 1.47 0.392 ± 0.126** 32.14 4 UV 254 0.139 ± 0.002 1.40 0.136 ± 0.040 29.31 5 UV 254 0.124 ± 0.003** 2.36 0.088 ± 0.012** 13.63 6 UV 254 0.312 ± 0.004** 1.25 0.151 ± 0.029** 18.88 Total isoflavonoids 1.603 ± 0.027 1.67 1.133 ± 0.241 21.29 8 ESI- 0.196 ± 0.012** 5.89 0.082 ± 0.024** 29.20 9 ESI- 0.498 ± 0.026** 5.18 0.228 ± 0.047** 20.71 10 ESI- 0.182 ± 0.020** 10.90 0.072 ± 0.023** 31.66 Total astragalosides 0.876 ± 0.026 2.96 0.382 ± 0.088 22.90 Table 3.
Content of marker compounds 1−6 and 8−10 (mg/g dry material) in UGP3 and TM3 from unknown batch sources of Radix Astragali (n = 10).
Figures
(4)
Tables
(3)