-
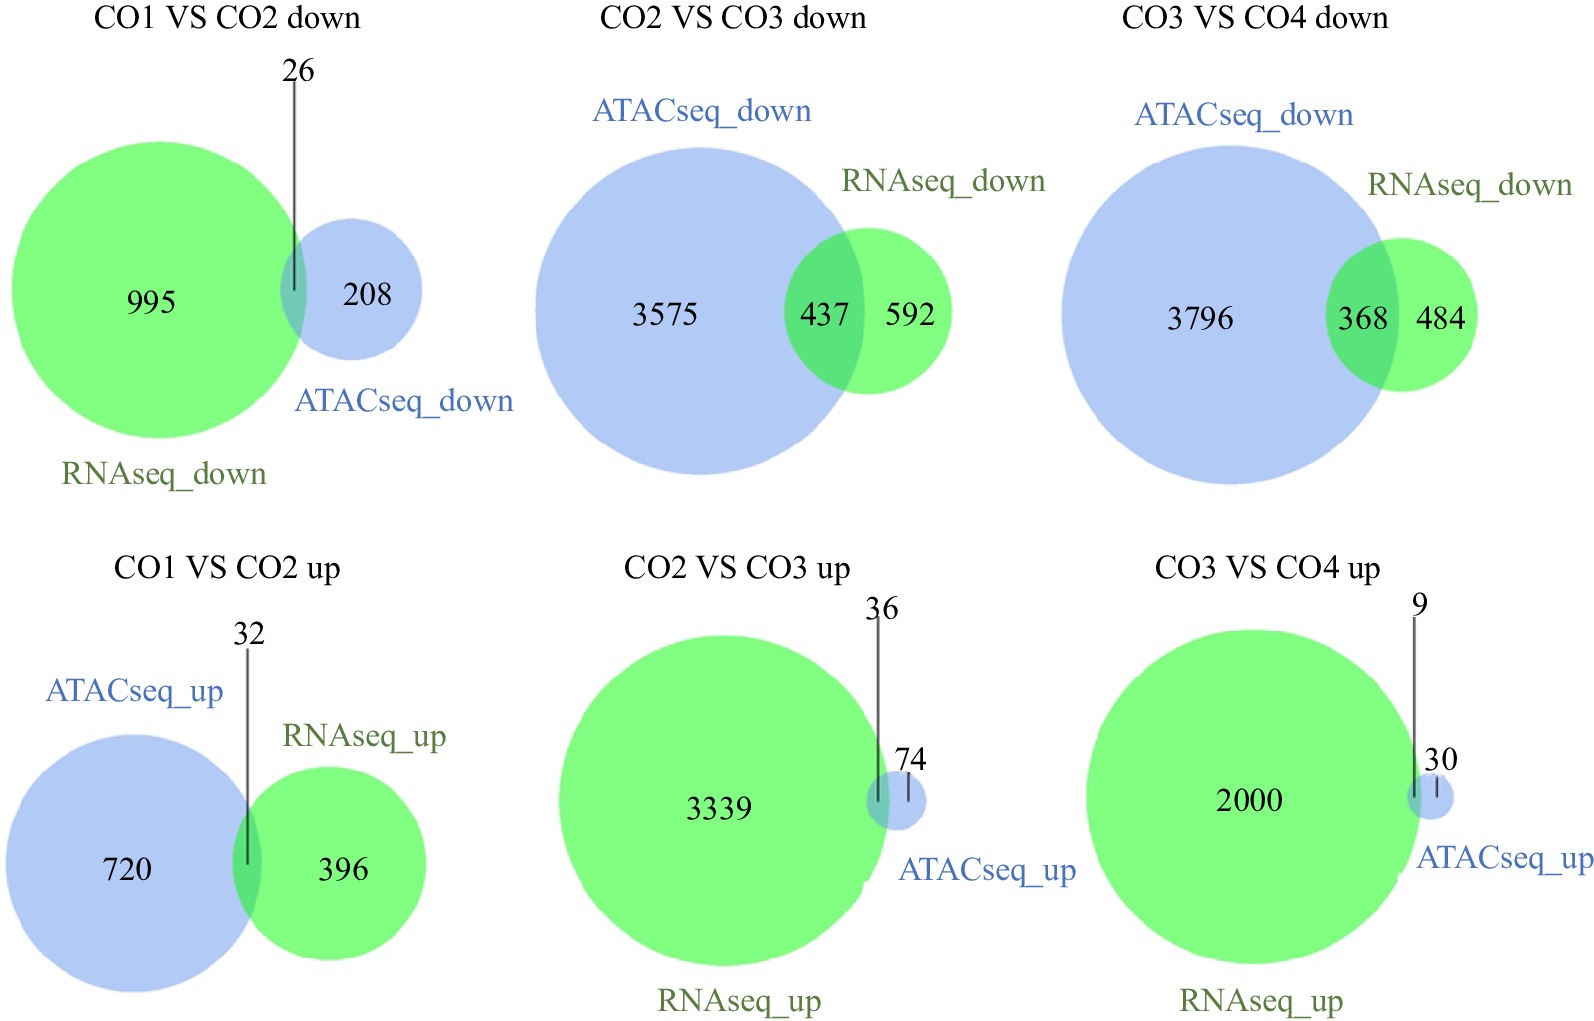
Figure 1.
Overlap of genes that have the same trend in RNA-seq and ATAC-seq. ATACseq Down represents the number set of related genes in the chromatin open region with weakened ATAC-seq signal. RNAseq Down indicates the number set of down regulated differential genes of RNA-seq. ATACseq Up represents the number set of related genes in the chromatin open region enhanced by ATAC-seq signal. RNAseq Up represents the number set of up-regulated differential genes of RNA-seq. CO1 vs CO2 down/up: Compared with the CO2, the expression of genes in the CO1 is significantly down/up regulated.
-
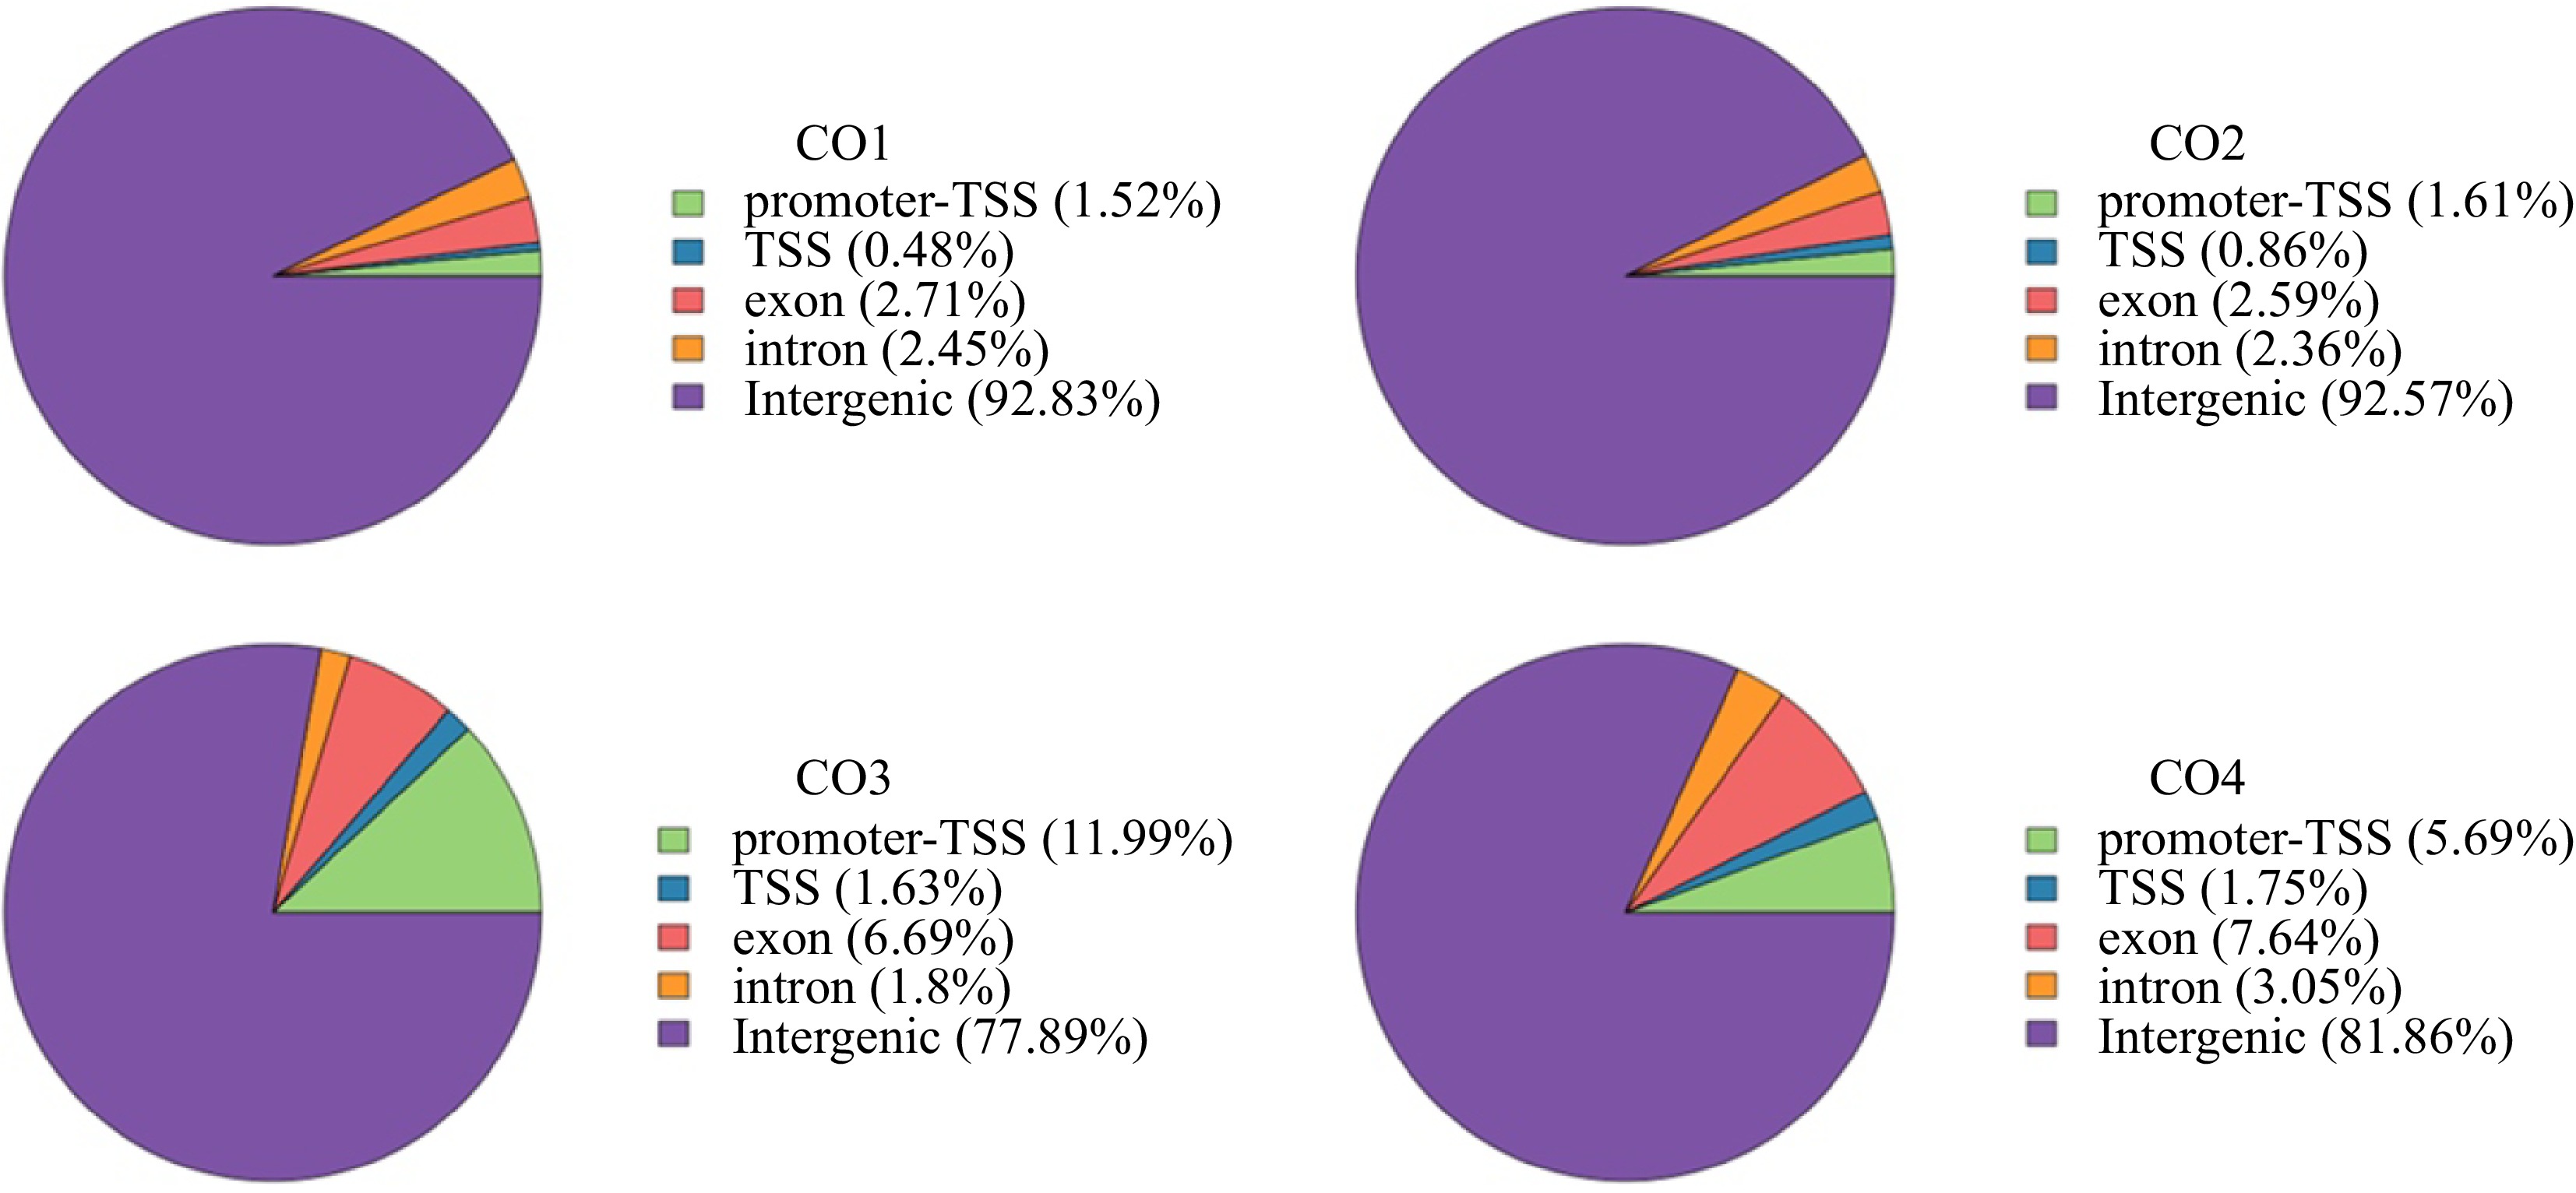
Figure 2.
Distribution of Peak in functional regions. Proportion of peaks regions matched to elements in the coconut genome at CO1, CO2, CO3, and CO4 stages, respectively. Promoter-TSS: The region from the promoter to the transcription start site ranges from 1 kp upstream of the gene start point to 100 bp downstream of the gene start point. TTS: Transcription termination sites, ranged from 100 bp upstream of the gene endpoint to 1 kp downstream of the gene endpoint.
-

Figure 3.
Categorization of motif in Promoter-TSS region. Proportion of transcription factors corresponding to motif in Promoter-TSS region of coconut genome at CO1, CO2, CO3 and CO4 stages, respectively.
-
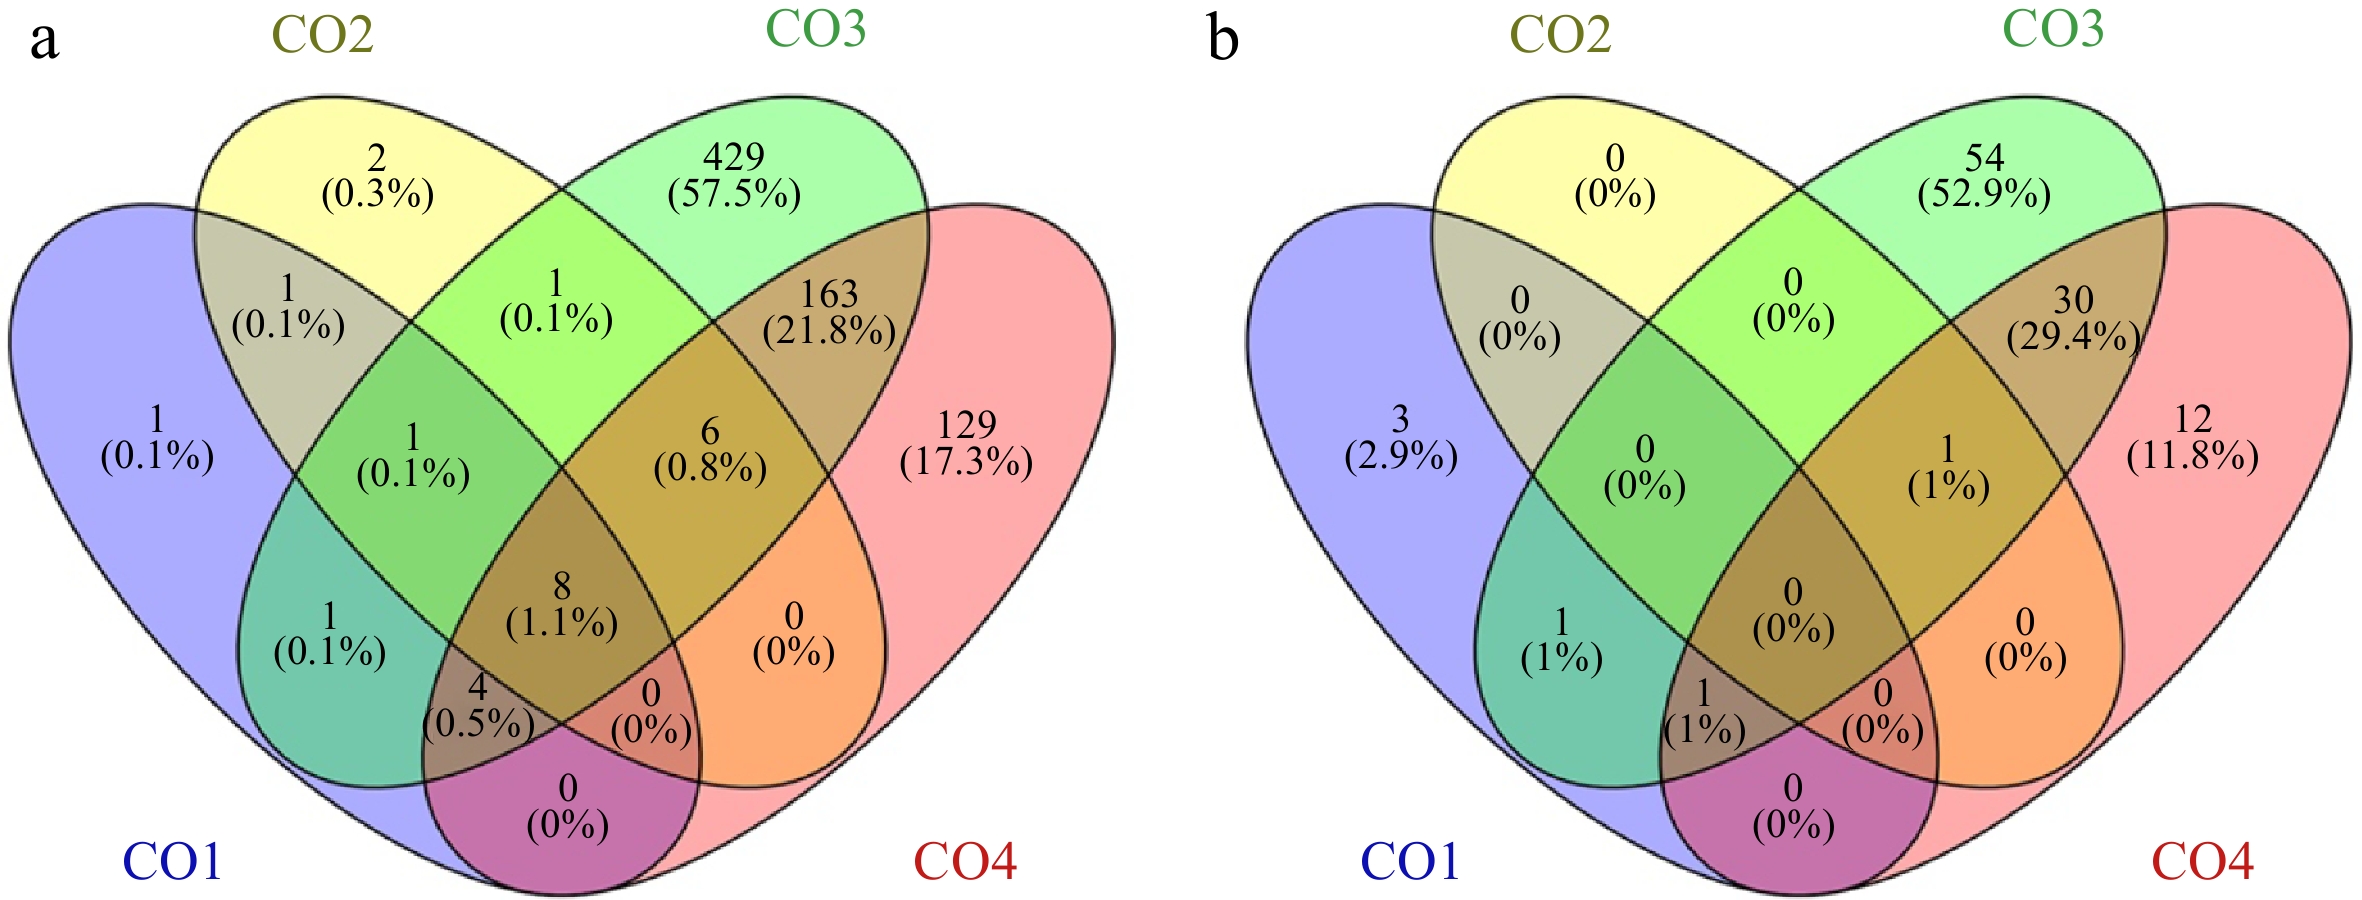
Figure 4.
Venn diagrams of Peak nearest genes and transcription factors in Promoter-TSS region. (a) Distribution of Peaks nearest genes in Promoter-TSS region of coconut genome, Venn diagrams shows the overlap between CO1, CO2, CO3 and CO4 stages , respectively. (b) Distribution of Peaks nearest transcription factors in Promoter-TSS region of coconut genome, Venn diagrams show the overlap between CO1, CO2, CO3 and CO4 stages, respectively.
-

Figure 5.
(a) The motif score of CnGATA20 at transcription initiation sites of different genes. (b) The IGV view shows chromatin accessibility of CnOLE18 in Promoter-TSS region at CO1, CO2, CO3 and CO4 stages.
-
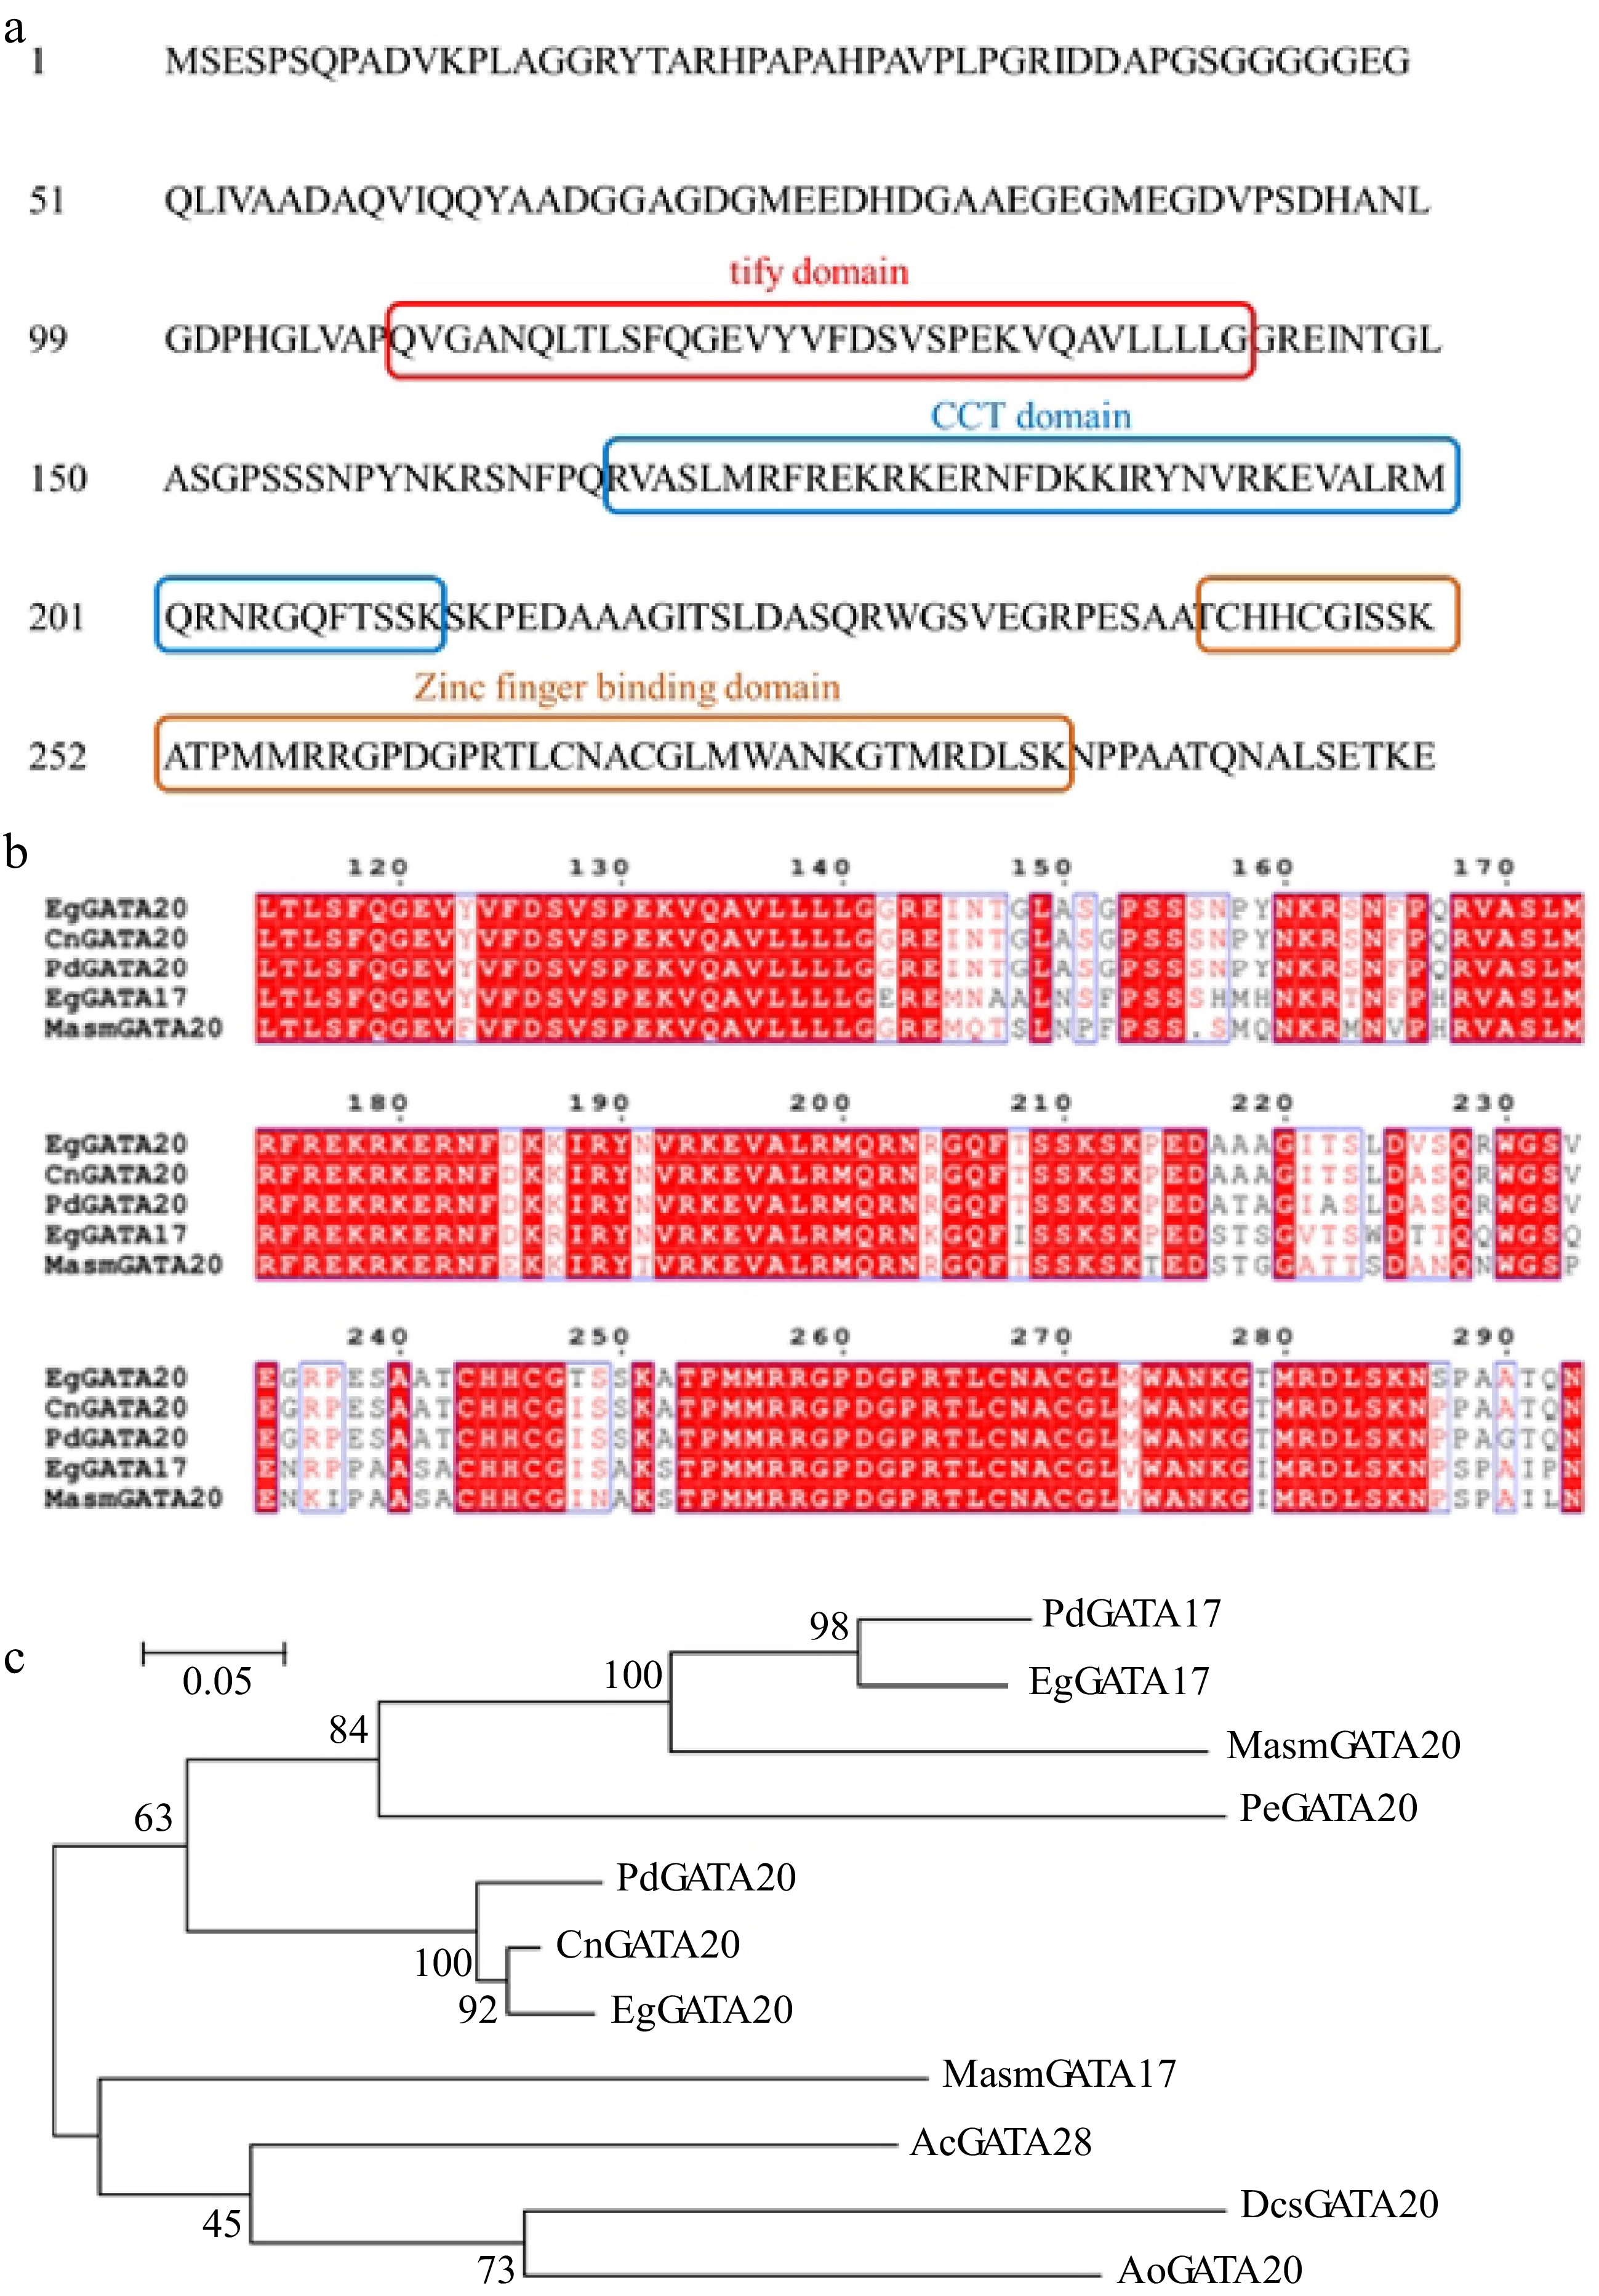
Figure 6.
(a) Three typical conserved domains in CnGATA20. (b) Comparison of deduced amino acid sequences of CnGATA20 with GATA genes from Elaeis guineensis, Phoenix dactylifera and Musa acuminata subsp. Malaccensis by Clustal X 2.0. (c) Phylogenetic analysis of CnGATA20 and related proteins from other plant species. Phylogenetic analysis of CnGATA20 and 10 other plants GATA protein sequences obtained from the NCBI database. PdGATA17: Phoenix dactylifera, XP_008789602.2; PdGATA20: Phoenix dactylifera, XP_008811434.1; EgGATA17: Elaeis guineensis, XP_010913727.1; EgGATA20: Elaeis guineensis, XP_010929337.1; MasmGATA17: Musa acuminata subsp. Malaccensis, XP_009417492.1; MasmGATA20: Musa acuminata subsp. Malaccensis, XP_009384454.1; PeGATA20: Phalaenopsis equestris, XP_020572684.1; AcGATA28: Ananas comosus, OAY66115.1; DcsGATA20: Dioscorea cayenensis subsp. rotundata, XP_039144785.1; AoGATA20: Asparagus officinalis, XP_020275468.1.
-
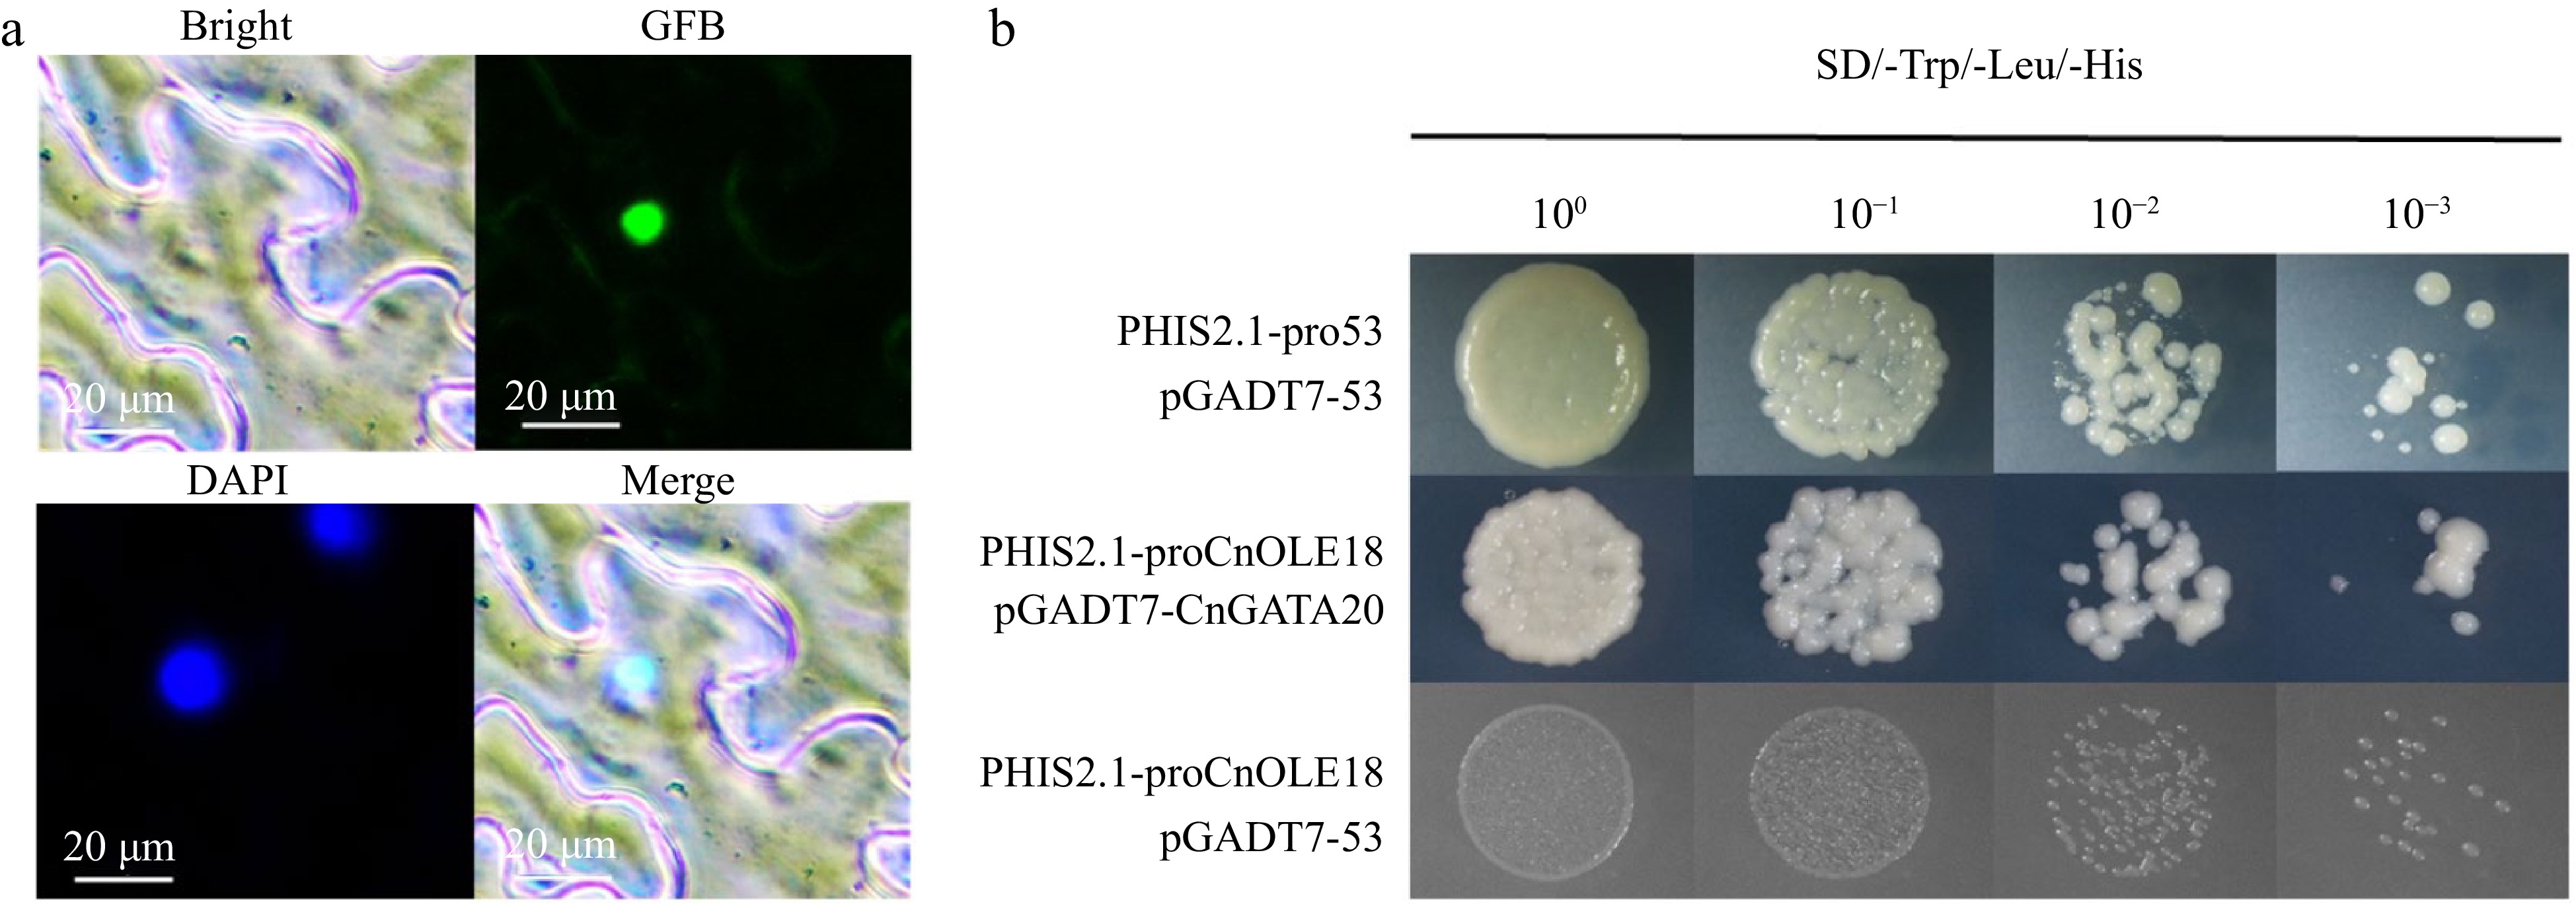
Figure 7.
Subcellular localization and yeast one-hybrid of CnGATA20. (a) Bright-feld, GFP, DAPI and merged images of the CnGATA20 protein fused with GFP in N. benthamiana leaves, Scale bar, 20 μm. (b) PHIS2.1-pro53+pGADT7-53 was used as positive control, the PHIS2.1-proCnOLE18+pGADT7-53 was served as the negative control. SD-Trp/Leu/His, SD medium without Trp, Leu, His, or Leu supplemented with 3-AT at a concentration of 2 mM.
-
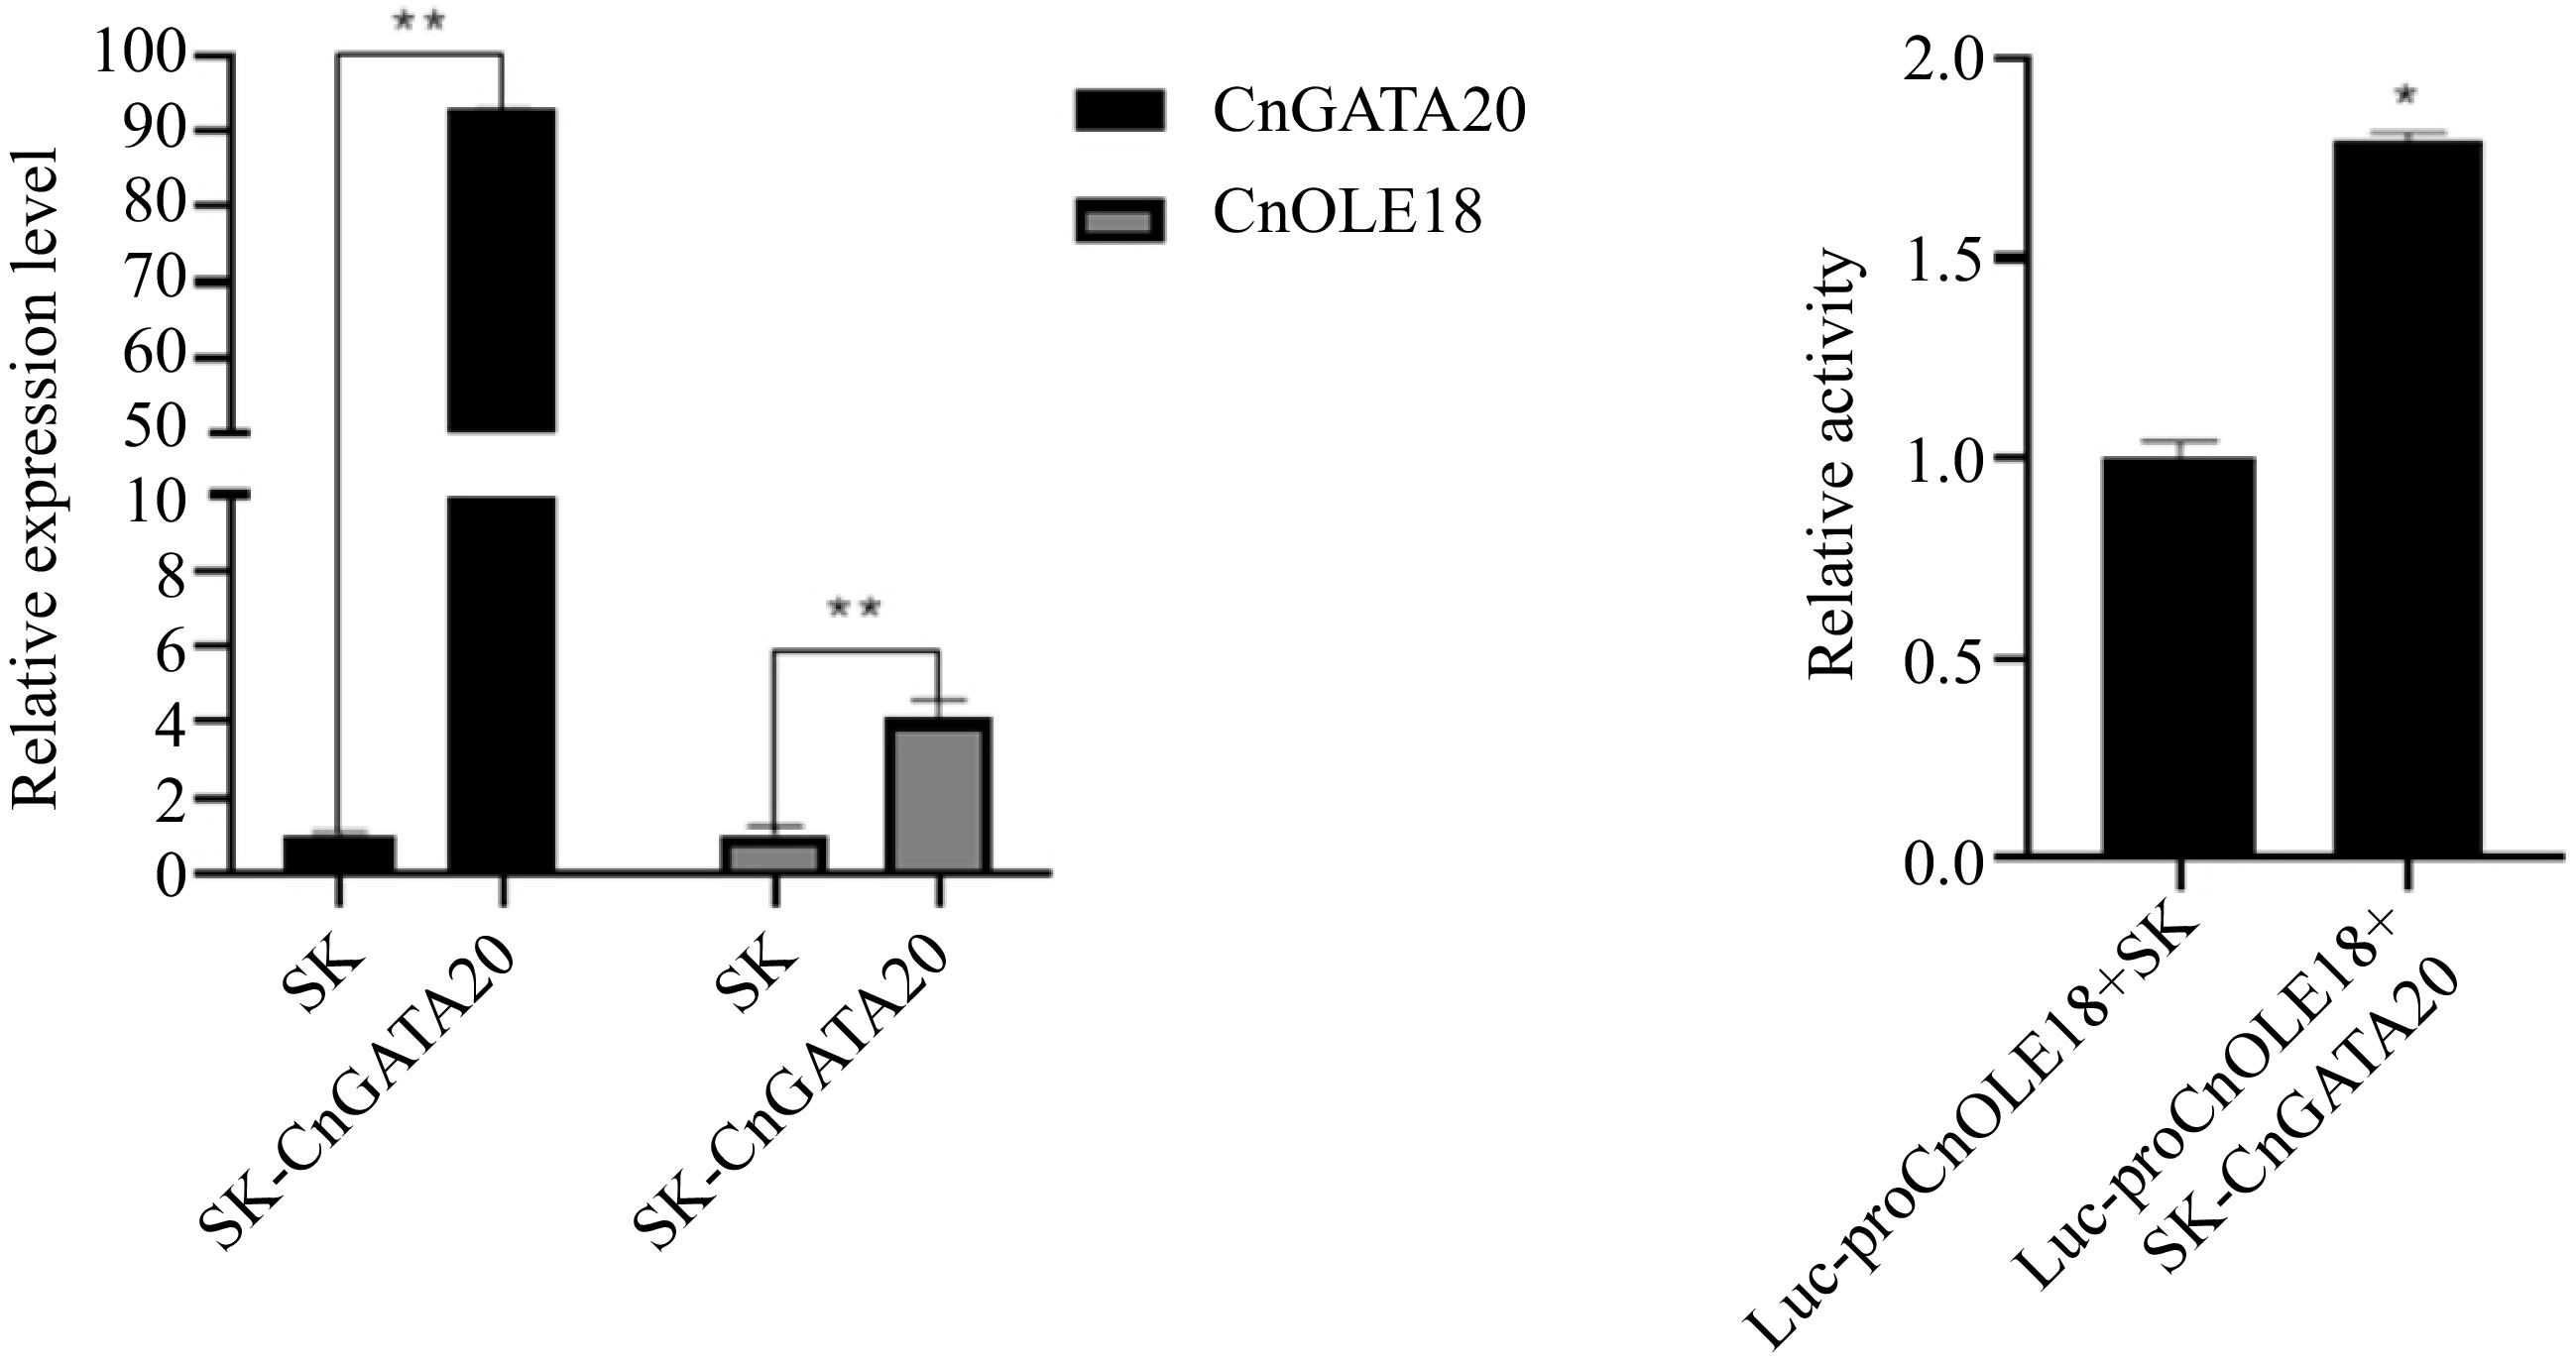
Figure 8.
Transient and dual-luciferase reporter assay. (a) Transient overexpression of GnGATA20 in the protoplasts of coconut, SK: Empty vector (control). (b) Dual-luciferase reporter assay of CnGATA20 in Cocos nucifera L. protoplast. Quantification of the fluorescence intensity of Luc-proCnOLE18+SK and Luc-proCnOLE18+SK-CnGATA20 . Three biological triplicates were used for every sample. The values are means ± SD. ** represents a highly significant difference (P < 0.01) using Student's t-test.
-
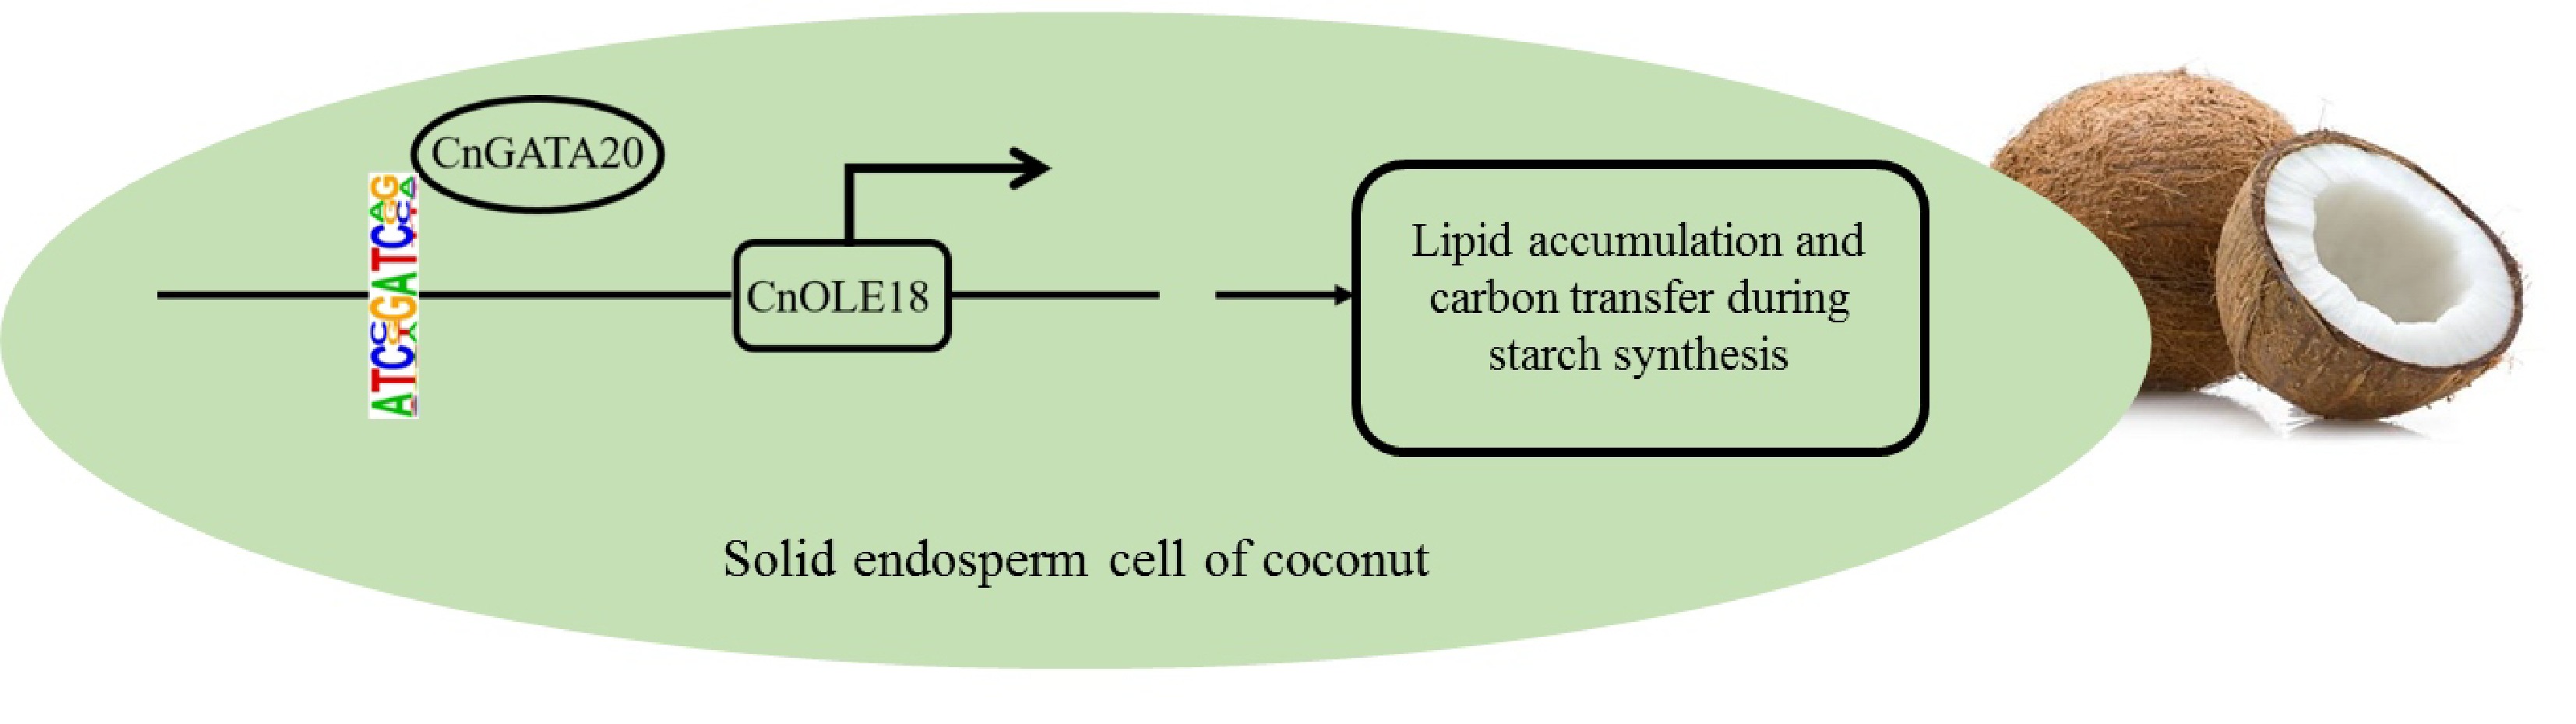
Figure 9.
A simplified model shows that CnGATA20 regulates the expression of the CnOLE18 gene, which controls the accumulation of lipid in endosperm of coconut.
-
Statistics CO1 CO2 CO3 CO4 All 121020906 118840434 115711432 115008357 UnMapped 507153 497831 2057646 4584387 Mapped 120513753 118342603 113653786 110423970 MappedRate 0.996 0.996 0.982 0.96 UniqueMapped 86960478 86007908 81107124 86868484 UniqueMappedRate 0.719 0.724 0.701 0.755 MultiMapped 33553275 32334695 32546662 23555486 The CO1, CO2, CO3 and CO4 represent four different stages of coconut endosperm development: 7, 8, 9, and 10 months, respectively; All: The number of all reads involved in the comparison, that is, the number of filtered reads (clean data); UnMapped: Number of reads not matched to the genome; Mapped: Number of reads matched to the genome; MappedRate: Mapped Reads/All; UniqueMapped: Number of reads uniquely matched to the genome; UniqueMappedRate: Unique Mapping/Mapped Reads; MultiMapped: Number of reads multiple matched to the genome. Table 1.
Statistics of ATAC-seq sequencing results.
-
Statistics CO1 CO2 CO3 CO4 All 57678112 54506264 50073176 48519010 UnMapped 2087496 1596700 1389366 1368720 Mapped 55590616 52909564 48683810 47150290 MappedRate 0.964 0.971 0.972 0.972 UniqueMapped 53064910 50372992 46682864 45236198 UniqueMappedRate 0.92 0.924 0.932 0.932 MultiMapped 2525706 2536572 2000946 1914092 The CO1, CO2, CO3 and CO4 represent four different stages of coconut endosperm development: 7, 8, 9, and 10 months, respectively; All: The number of all reads involved in the comparison, that is, the number of filtered reads (clean data); UnMapped: Number of reads not matched to the genome; Mapped: Number of reads matched to the genome; MappedRate: Mapped Reads/All; UniqueMapped: Number of reads uniquely matched to the genome; UniqueMappedRate: Unique Mapping/Mapped Reads; MultiMapped: Number of reads multiple matched to the genome. Table 2.
Statistics of RNA-seq sequencing results.
Figures
(9)
Tables
(2)