-
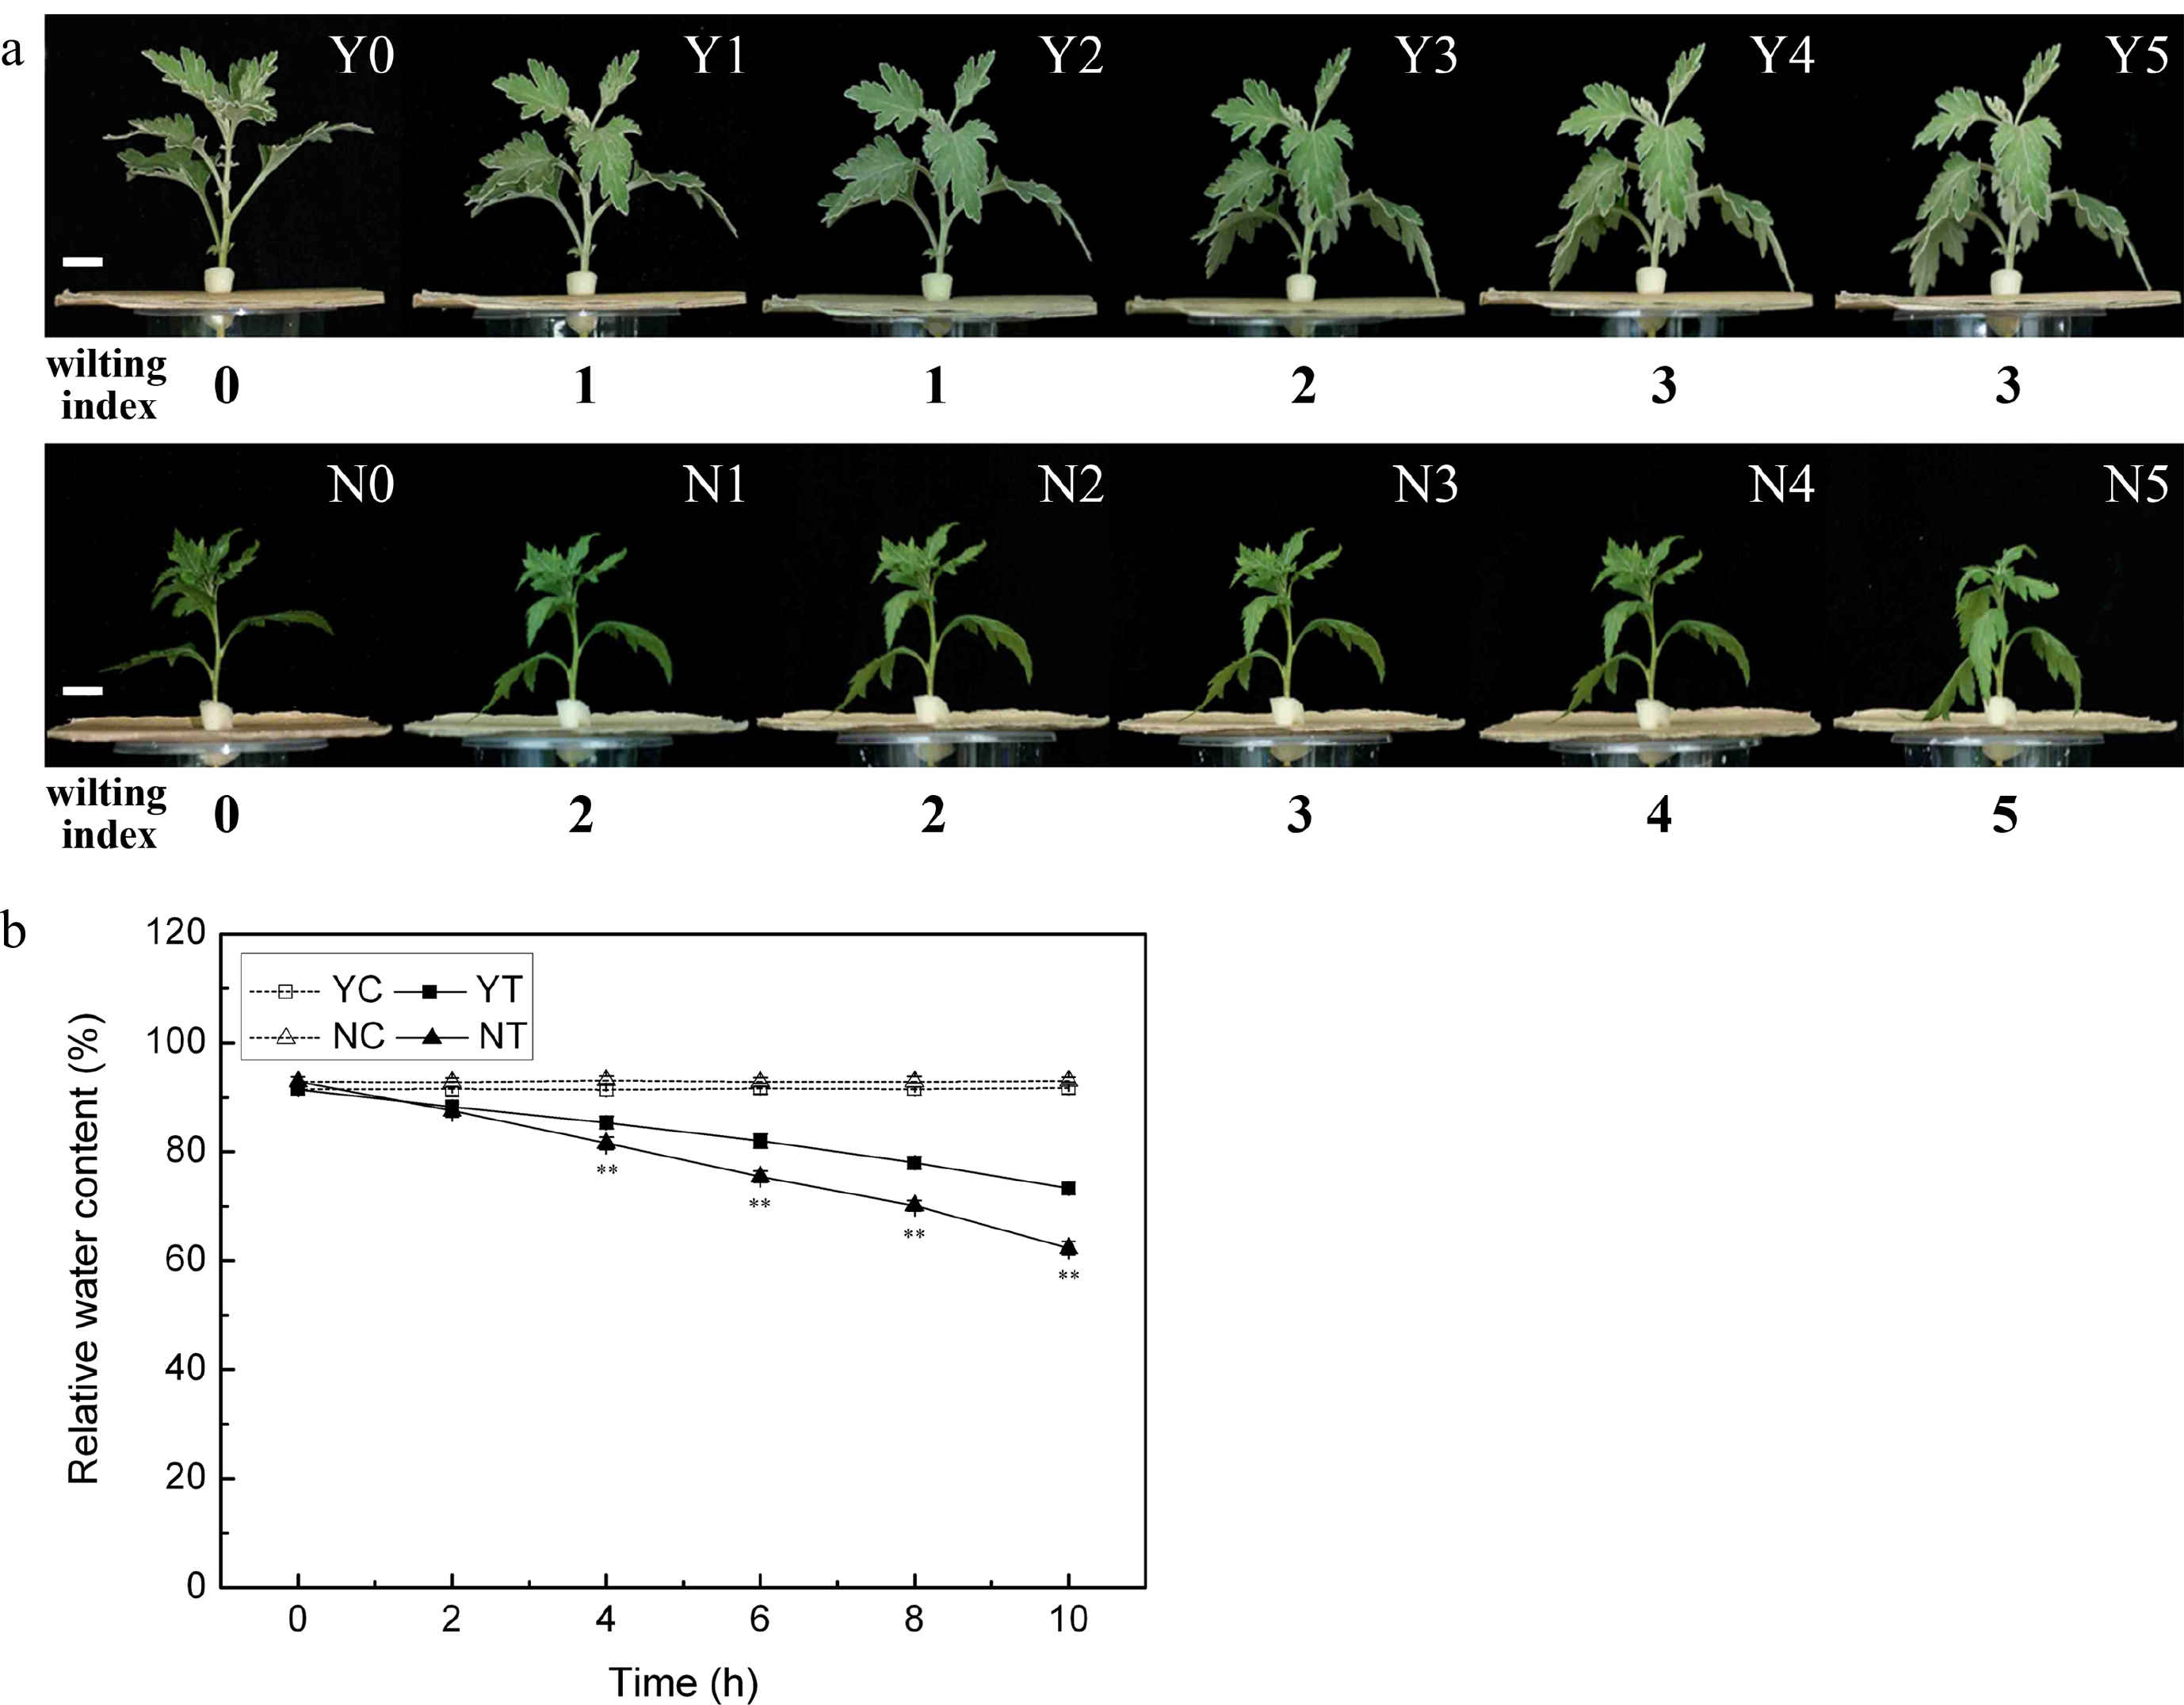
Figure 1.
The response of C. japonense and C. nankingense to PEG-induced drought stress. (a) The morphological response of C. japonense and C. nankingense to PEG-induced drought stress. Y0-Y5, N0-N5: C. japonense (Y) and C. nankingense (N) plants subjected to, respectively, 0, 2, 4, 6, 8 and 10 h of stress. The wilting index ranges from 0 (no observable wilting) to 5 (severely wilted). Scale bars = 1 cm. (b) The response of leaf RWC to PEG-induced drought stress. Y: C. japonense, N: C. nankingense, C: Control (no PEG), T: PEG treatment. ** Value significant at P ≤ 0.01. Values given as mean ± SD (n = 3).
-
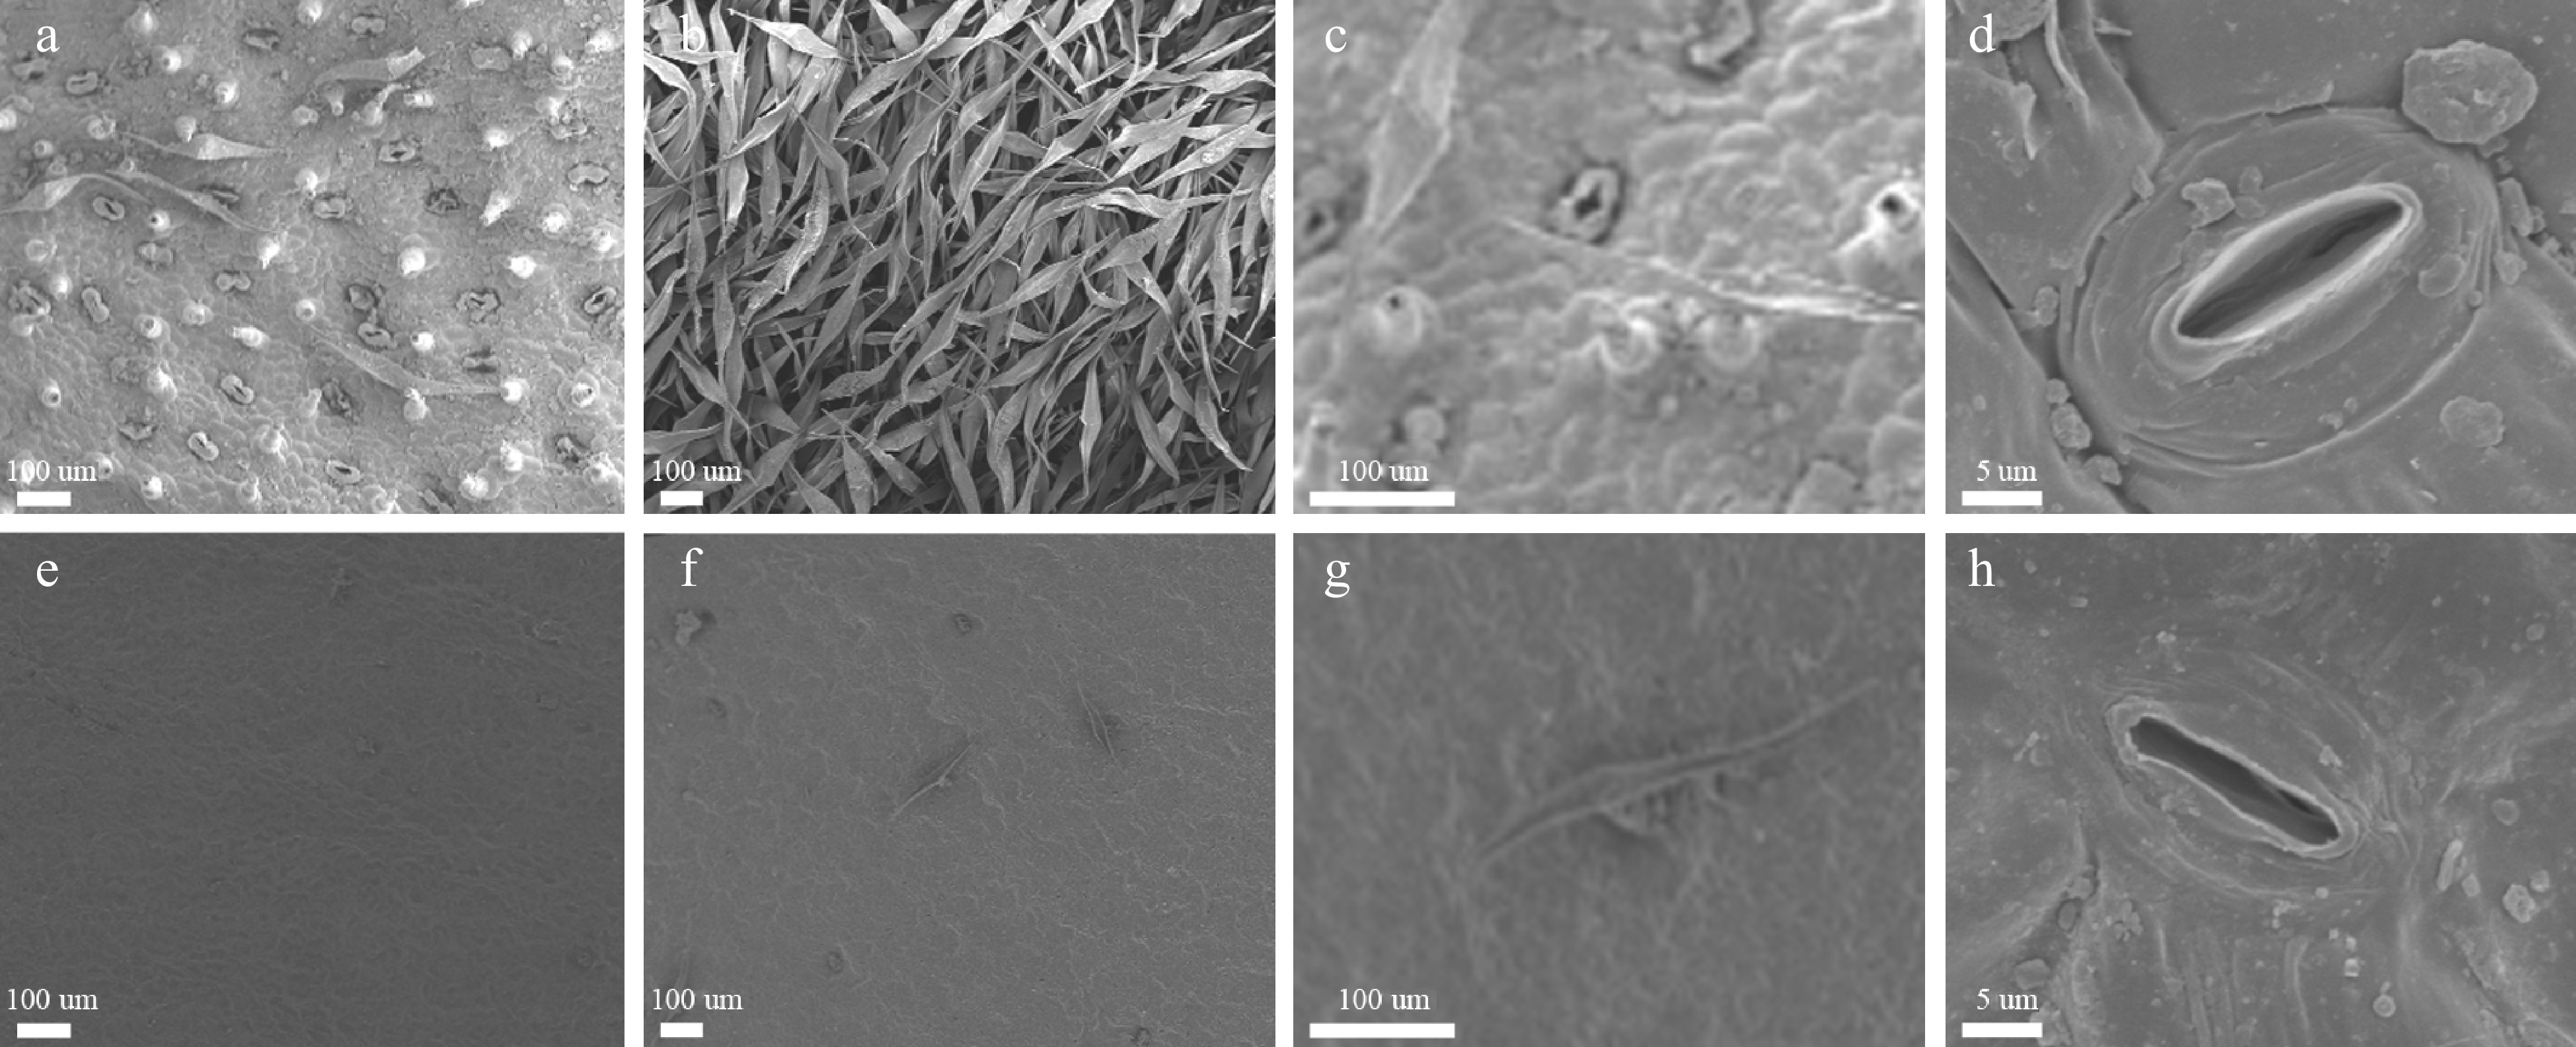
Figure 2.
Scanning electron microscopic images of the leaf surface of C. japonense (a-d) and C. nankingense (e-h). (a) and (e): upper leaf surface, (b) and (f): lower leaf surface, (c) and (g): a single trichome, (d) and (h): a single stomate.
-
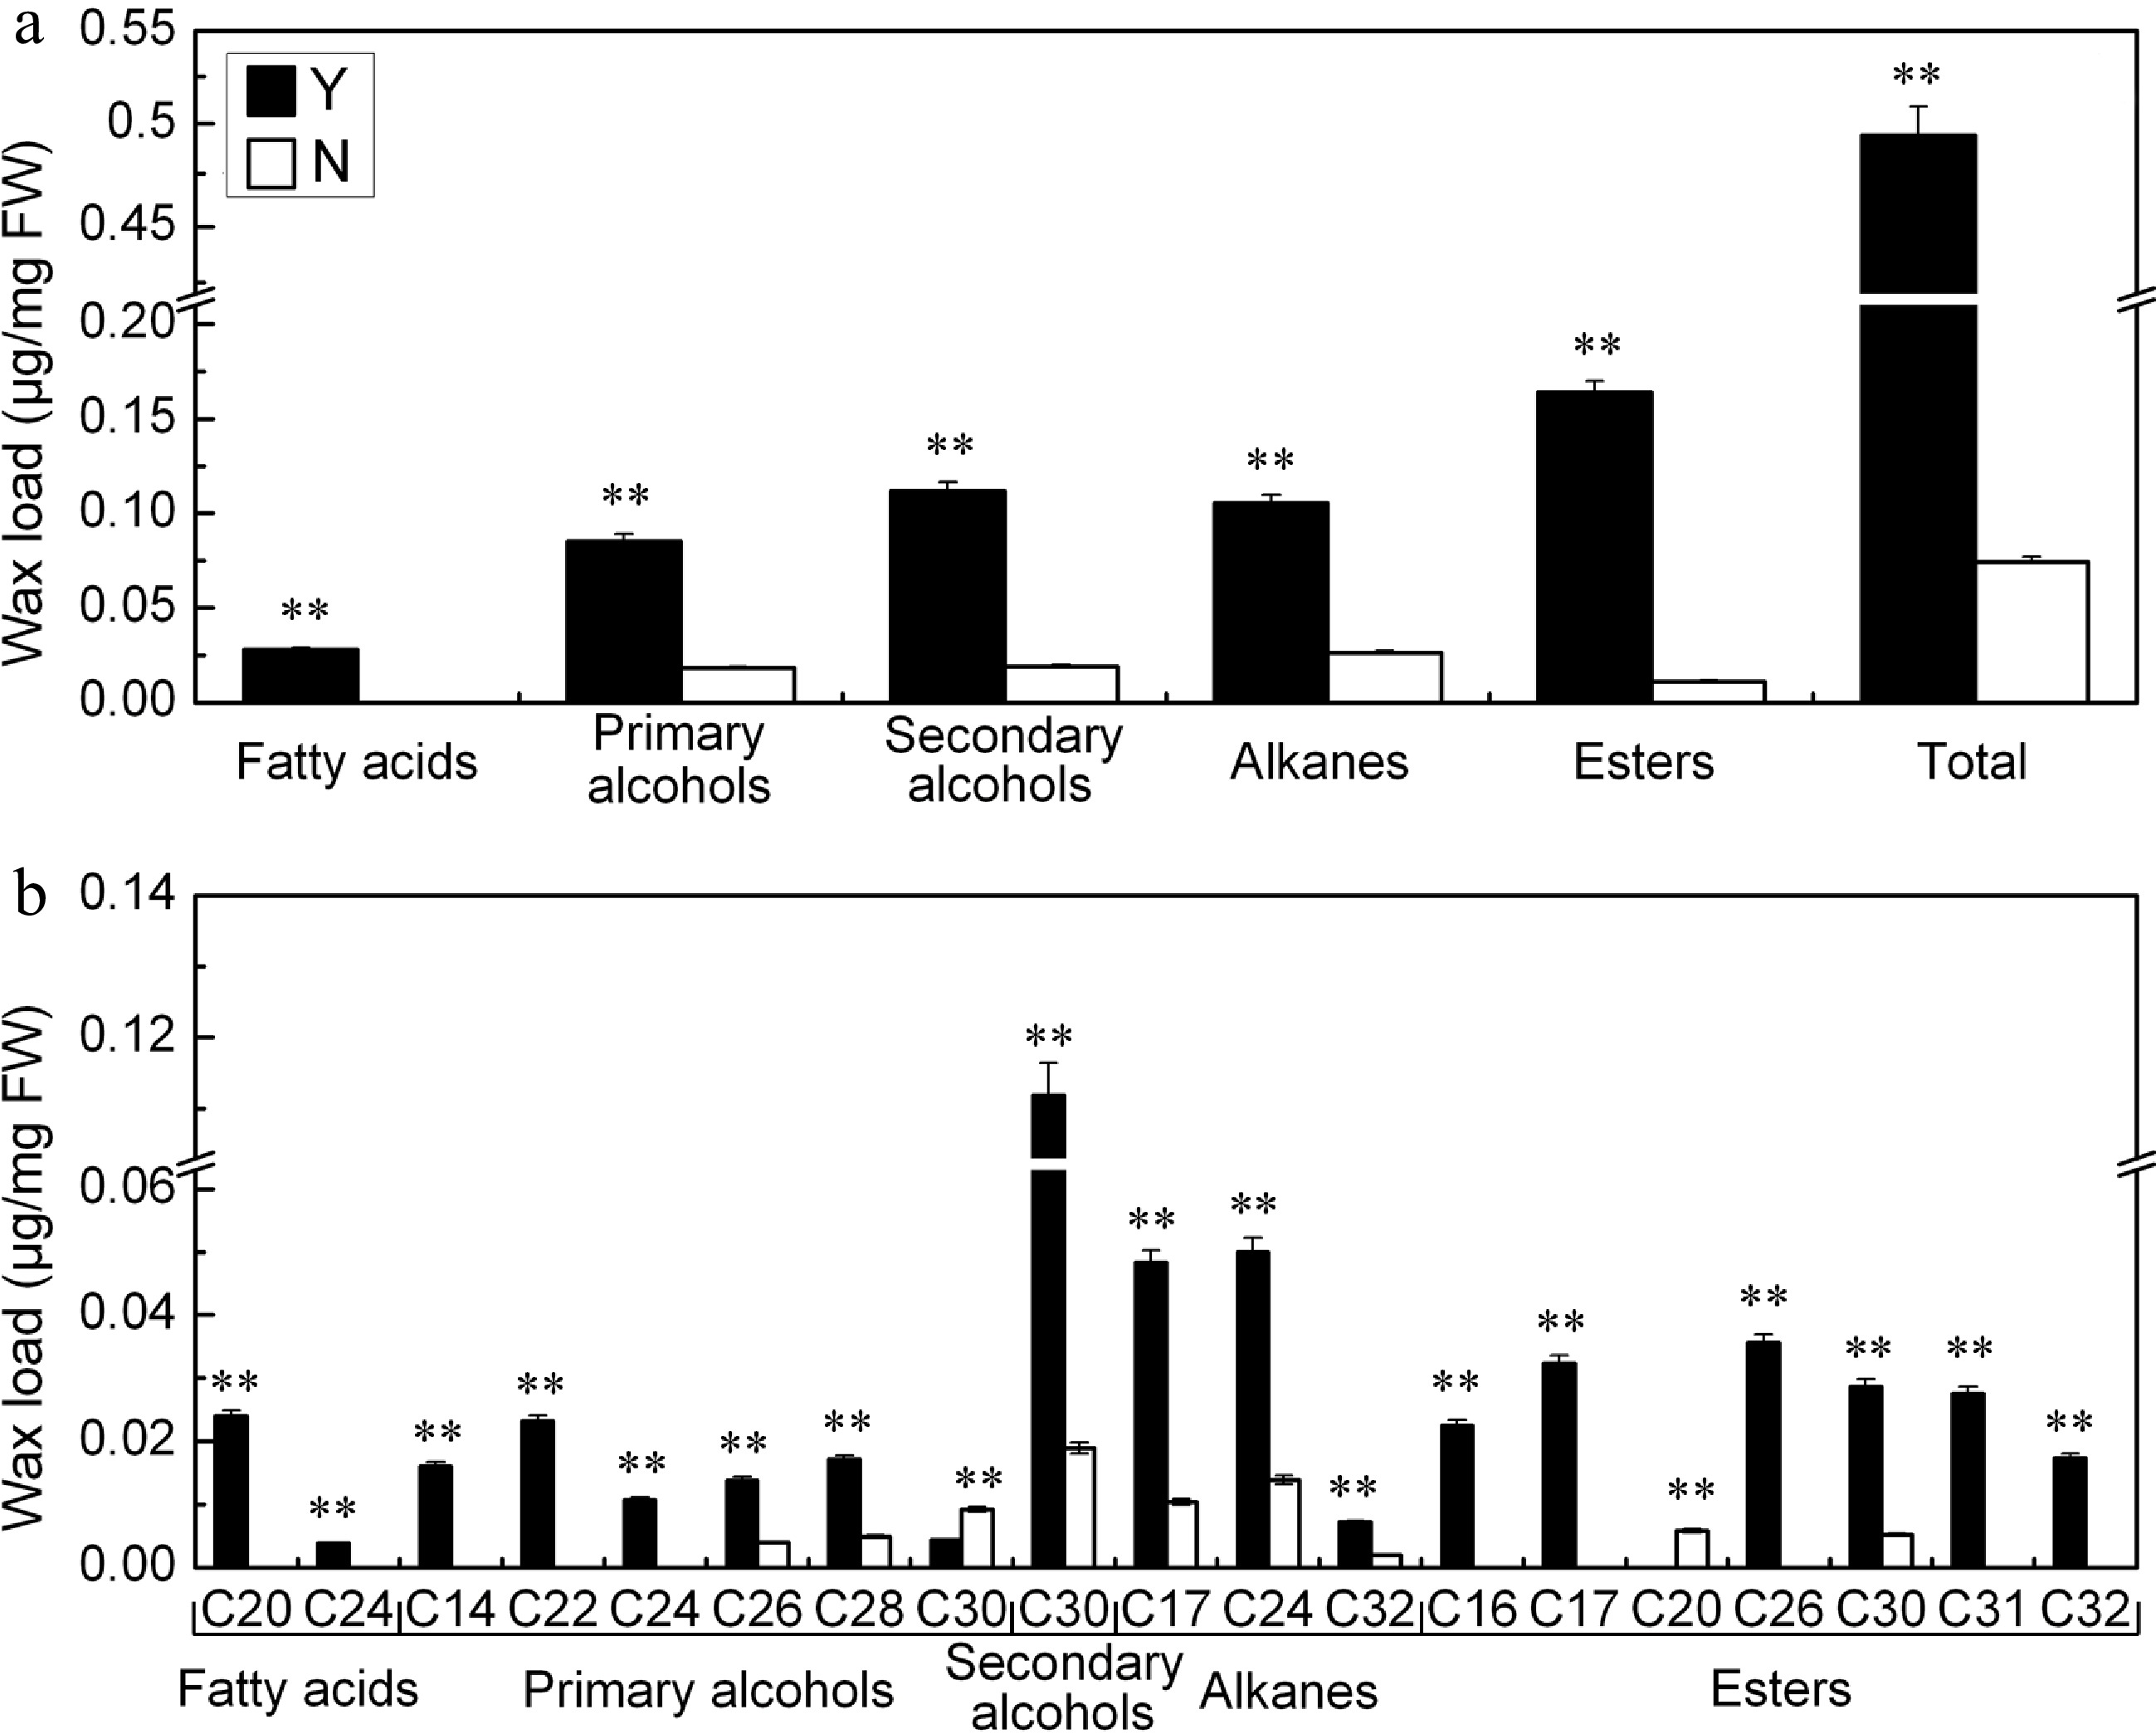
Figure 3.
(a) Quantity and (b) composition of cuticular wax on the C. japonense (Y) and C. nankingense (N) leaf. ** Value significant at P ≤ 0.01. Bars indicate the SD of the mean (n = 3).
-
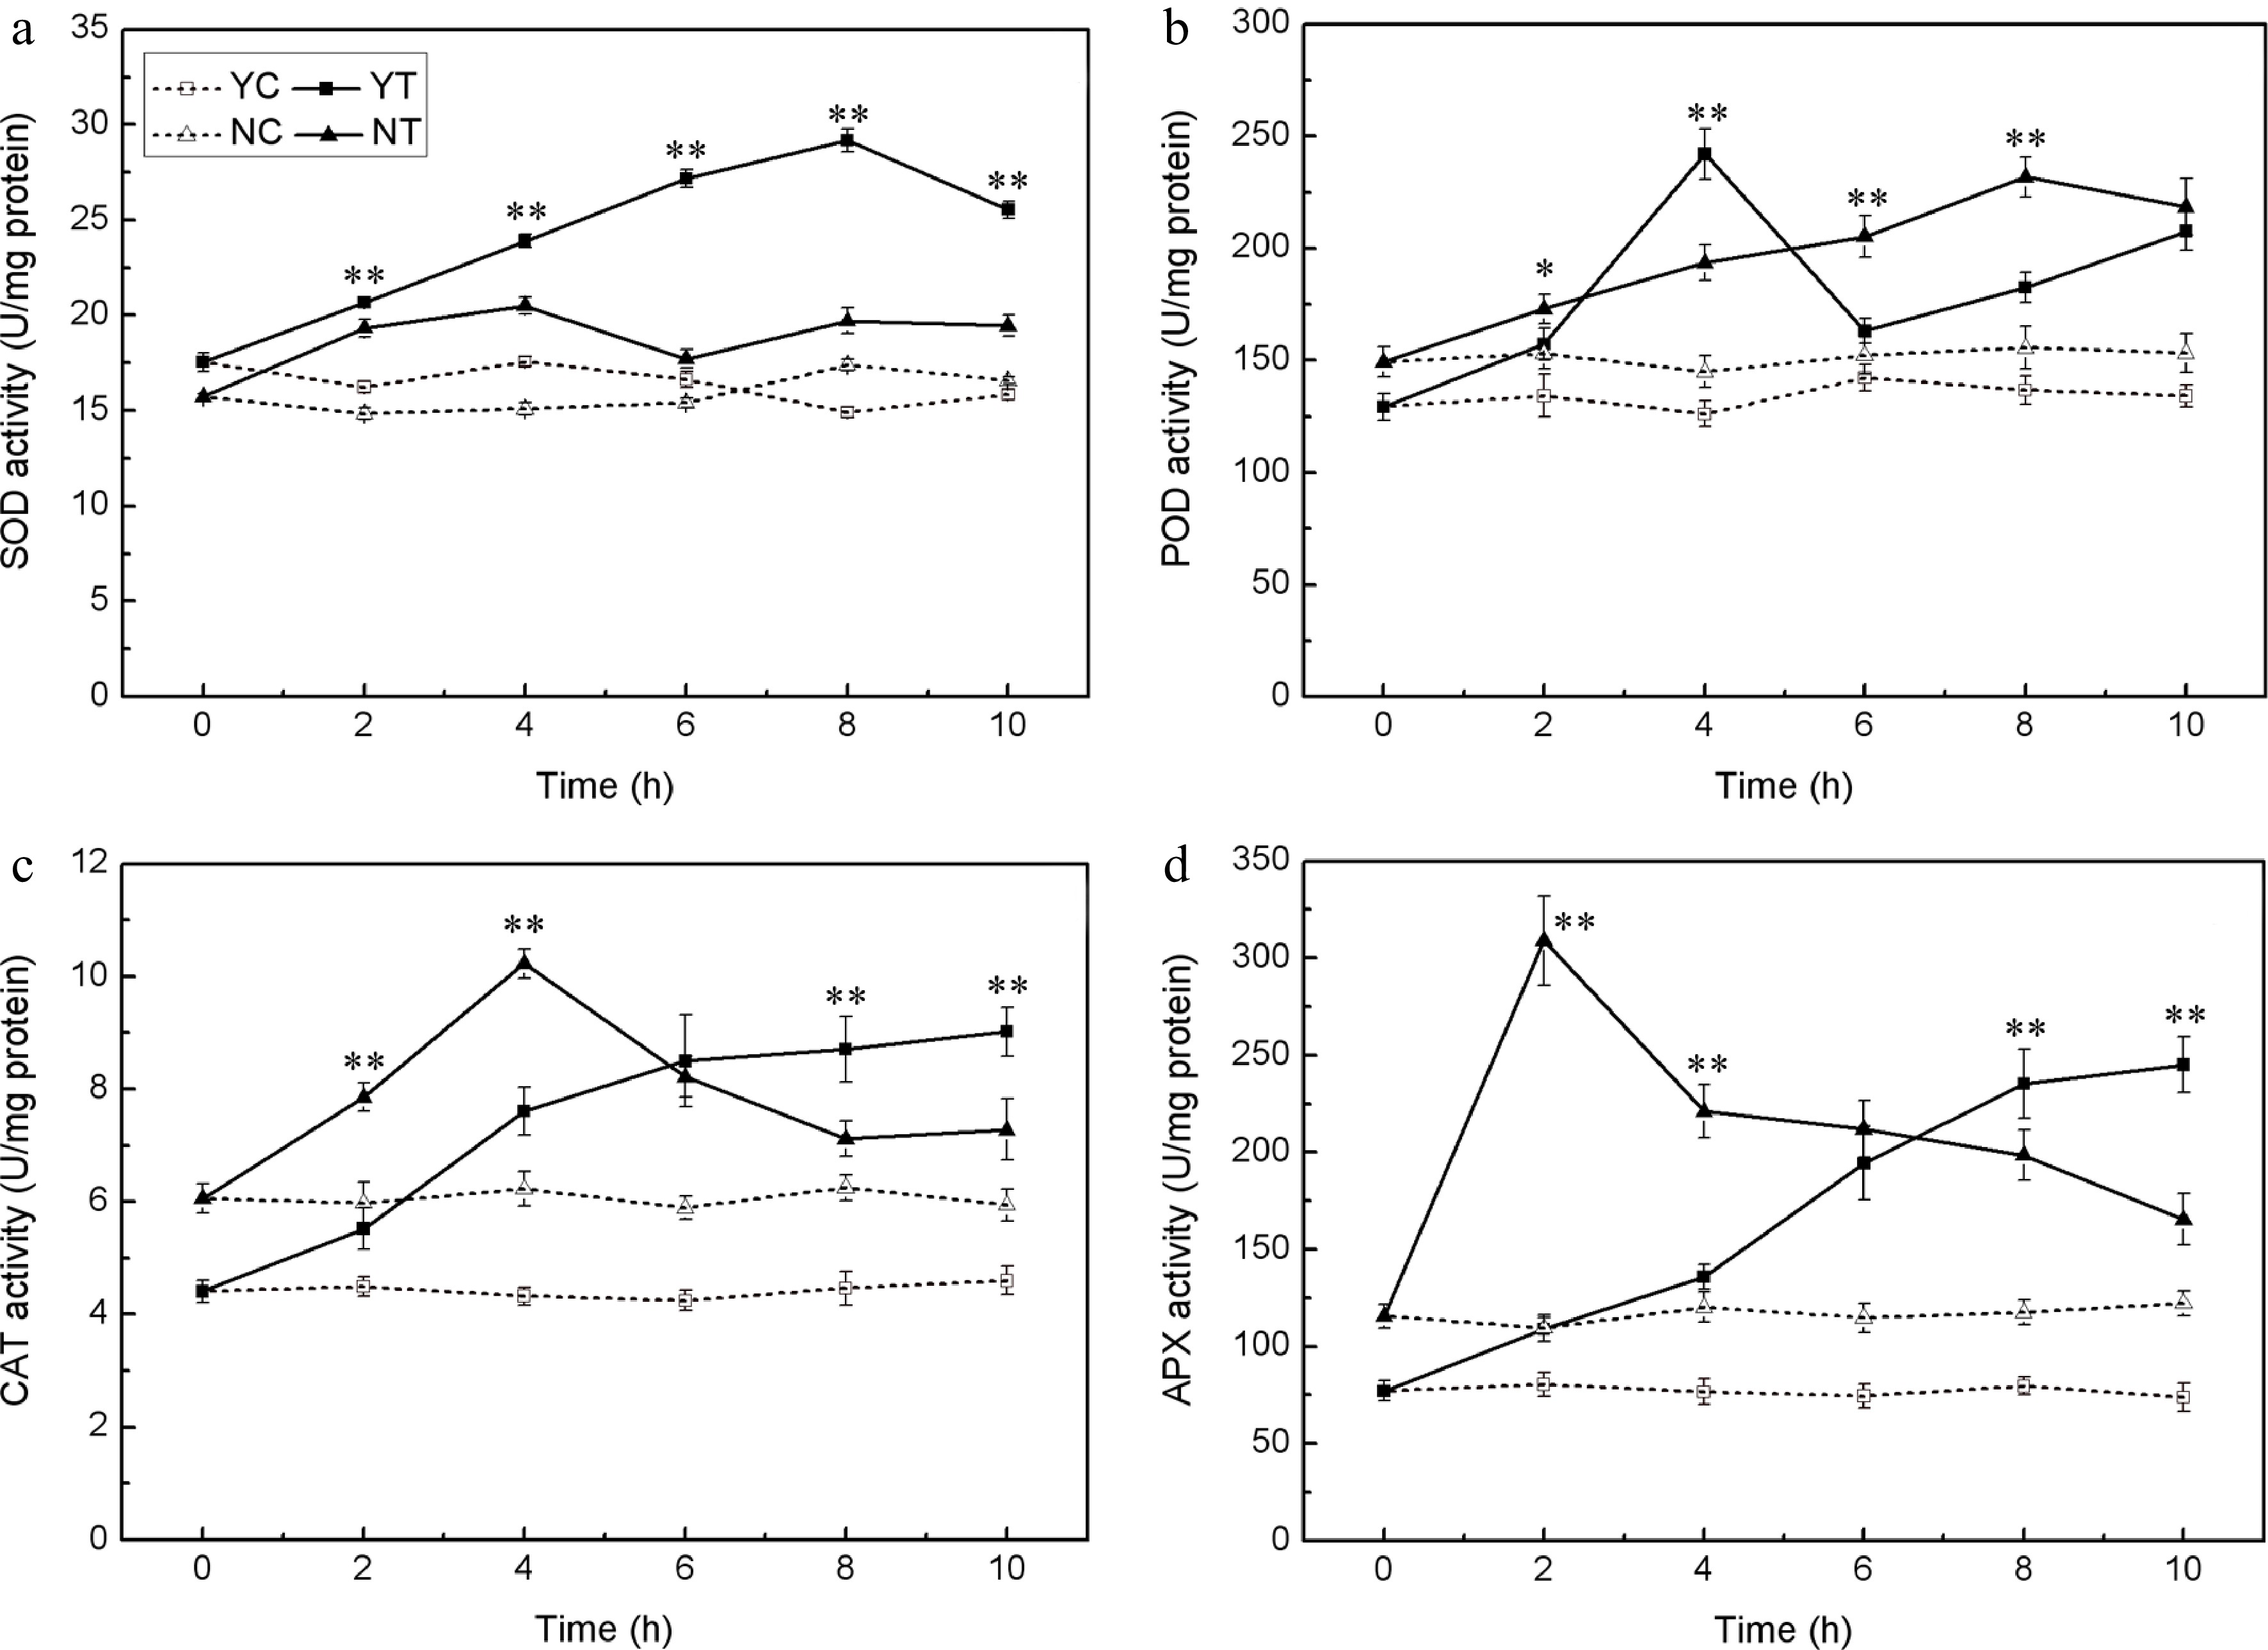
Figure 4.
Enzymatic activity (SOD (a), POD (b), CAT (c), and APX (d)) in the leaf of droughted C. japonense (Y) and C. nankingense (N) plants. C: Control (no PEG), T: PEG treatment. *, ** Value significant at P ≤ 0.05 or 0.01. Values given as mean ± SD (n = 3). SD’s indicated by a bar.
-
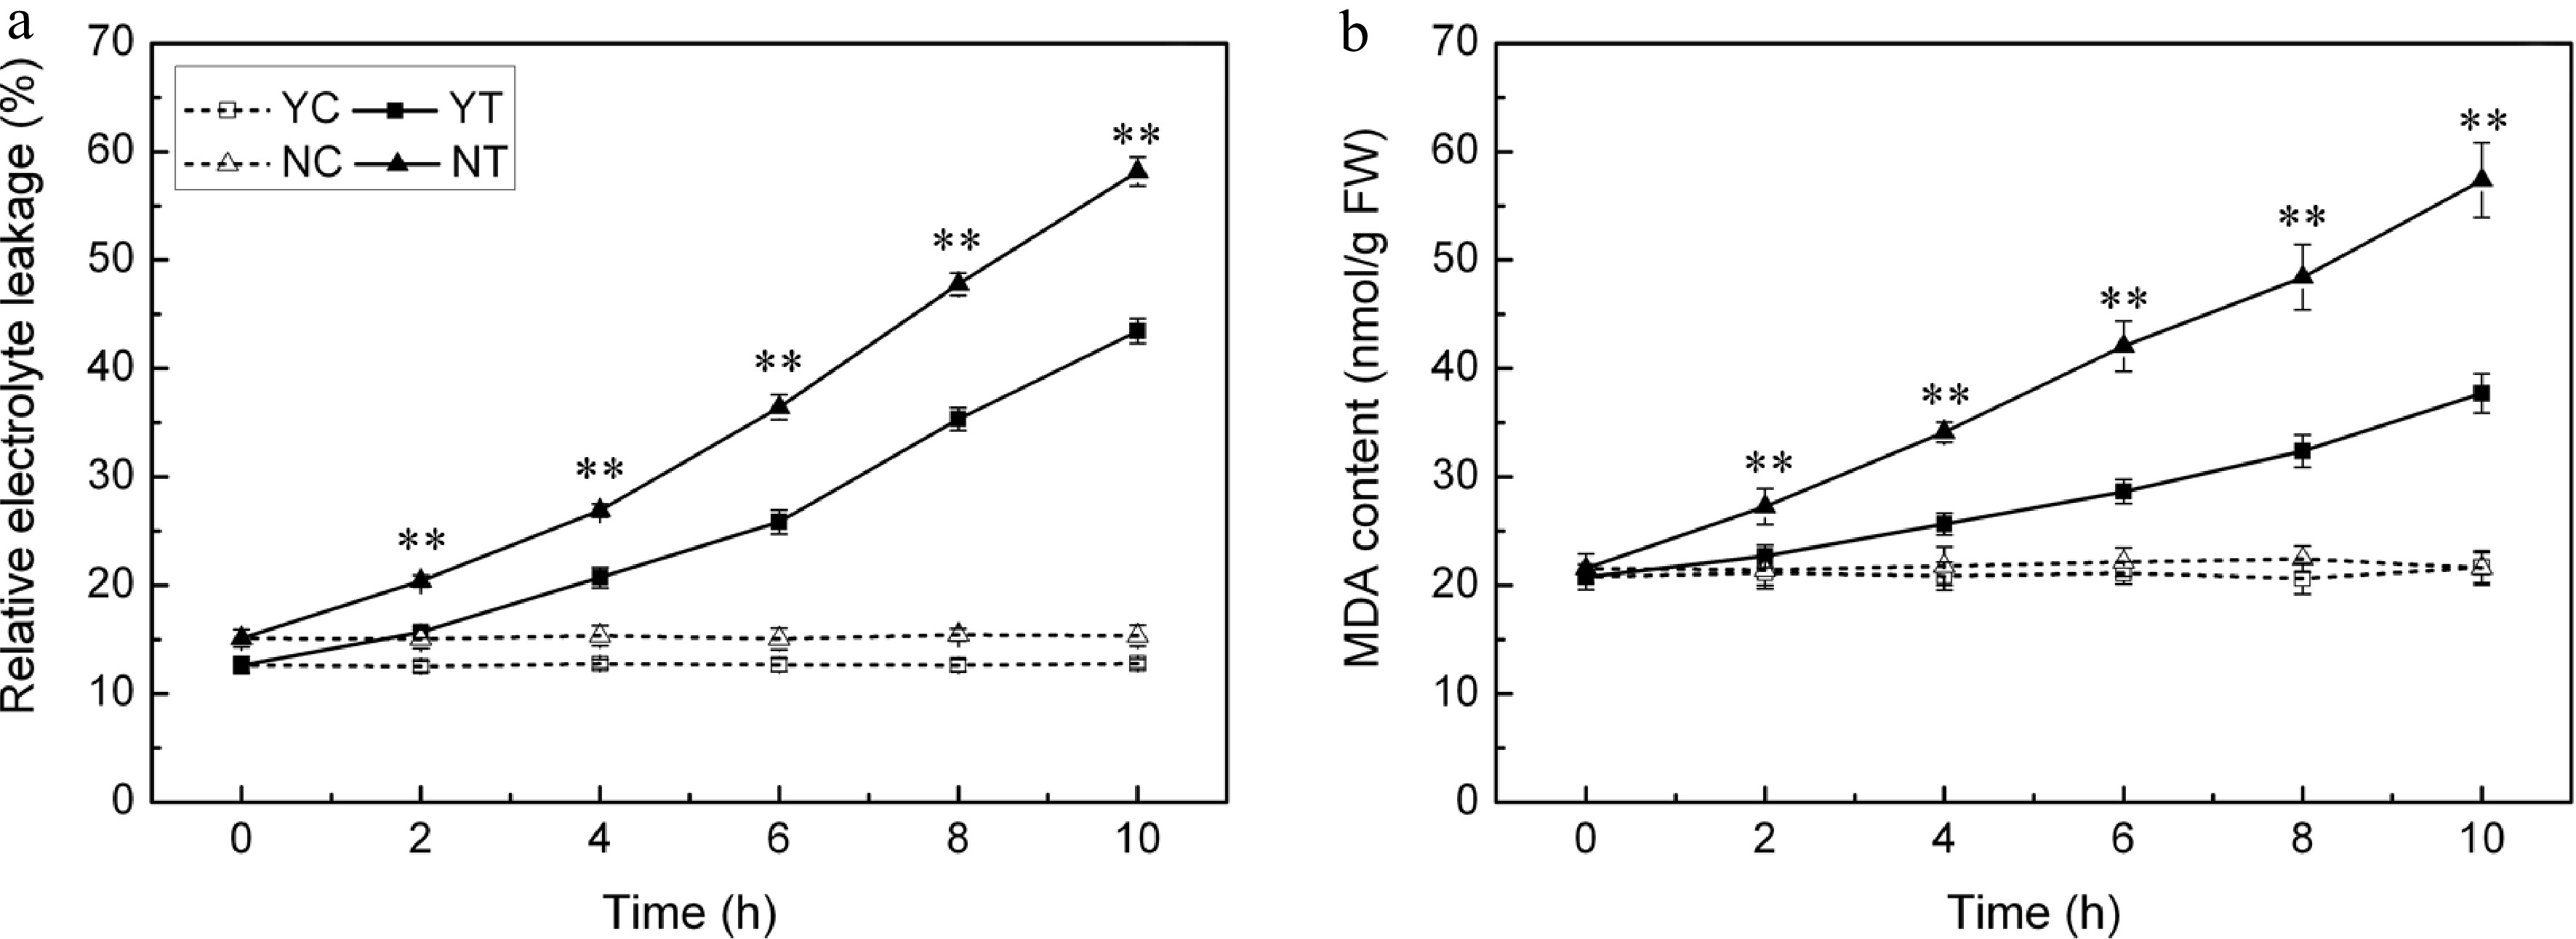
Figure 5.
(a) Electrolyte leakage and (b) MDA content in droughted leaves of C. japonense (Y) and C. nankingense (N). C: Control (no PEG), T: PEG treatment. ** Value significant at P ≤ 0.01. Values given as mean ± SD (n = 3).
-
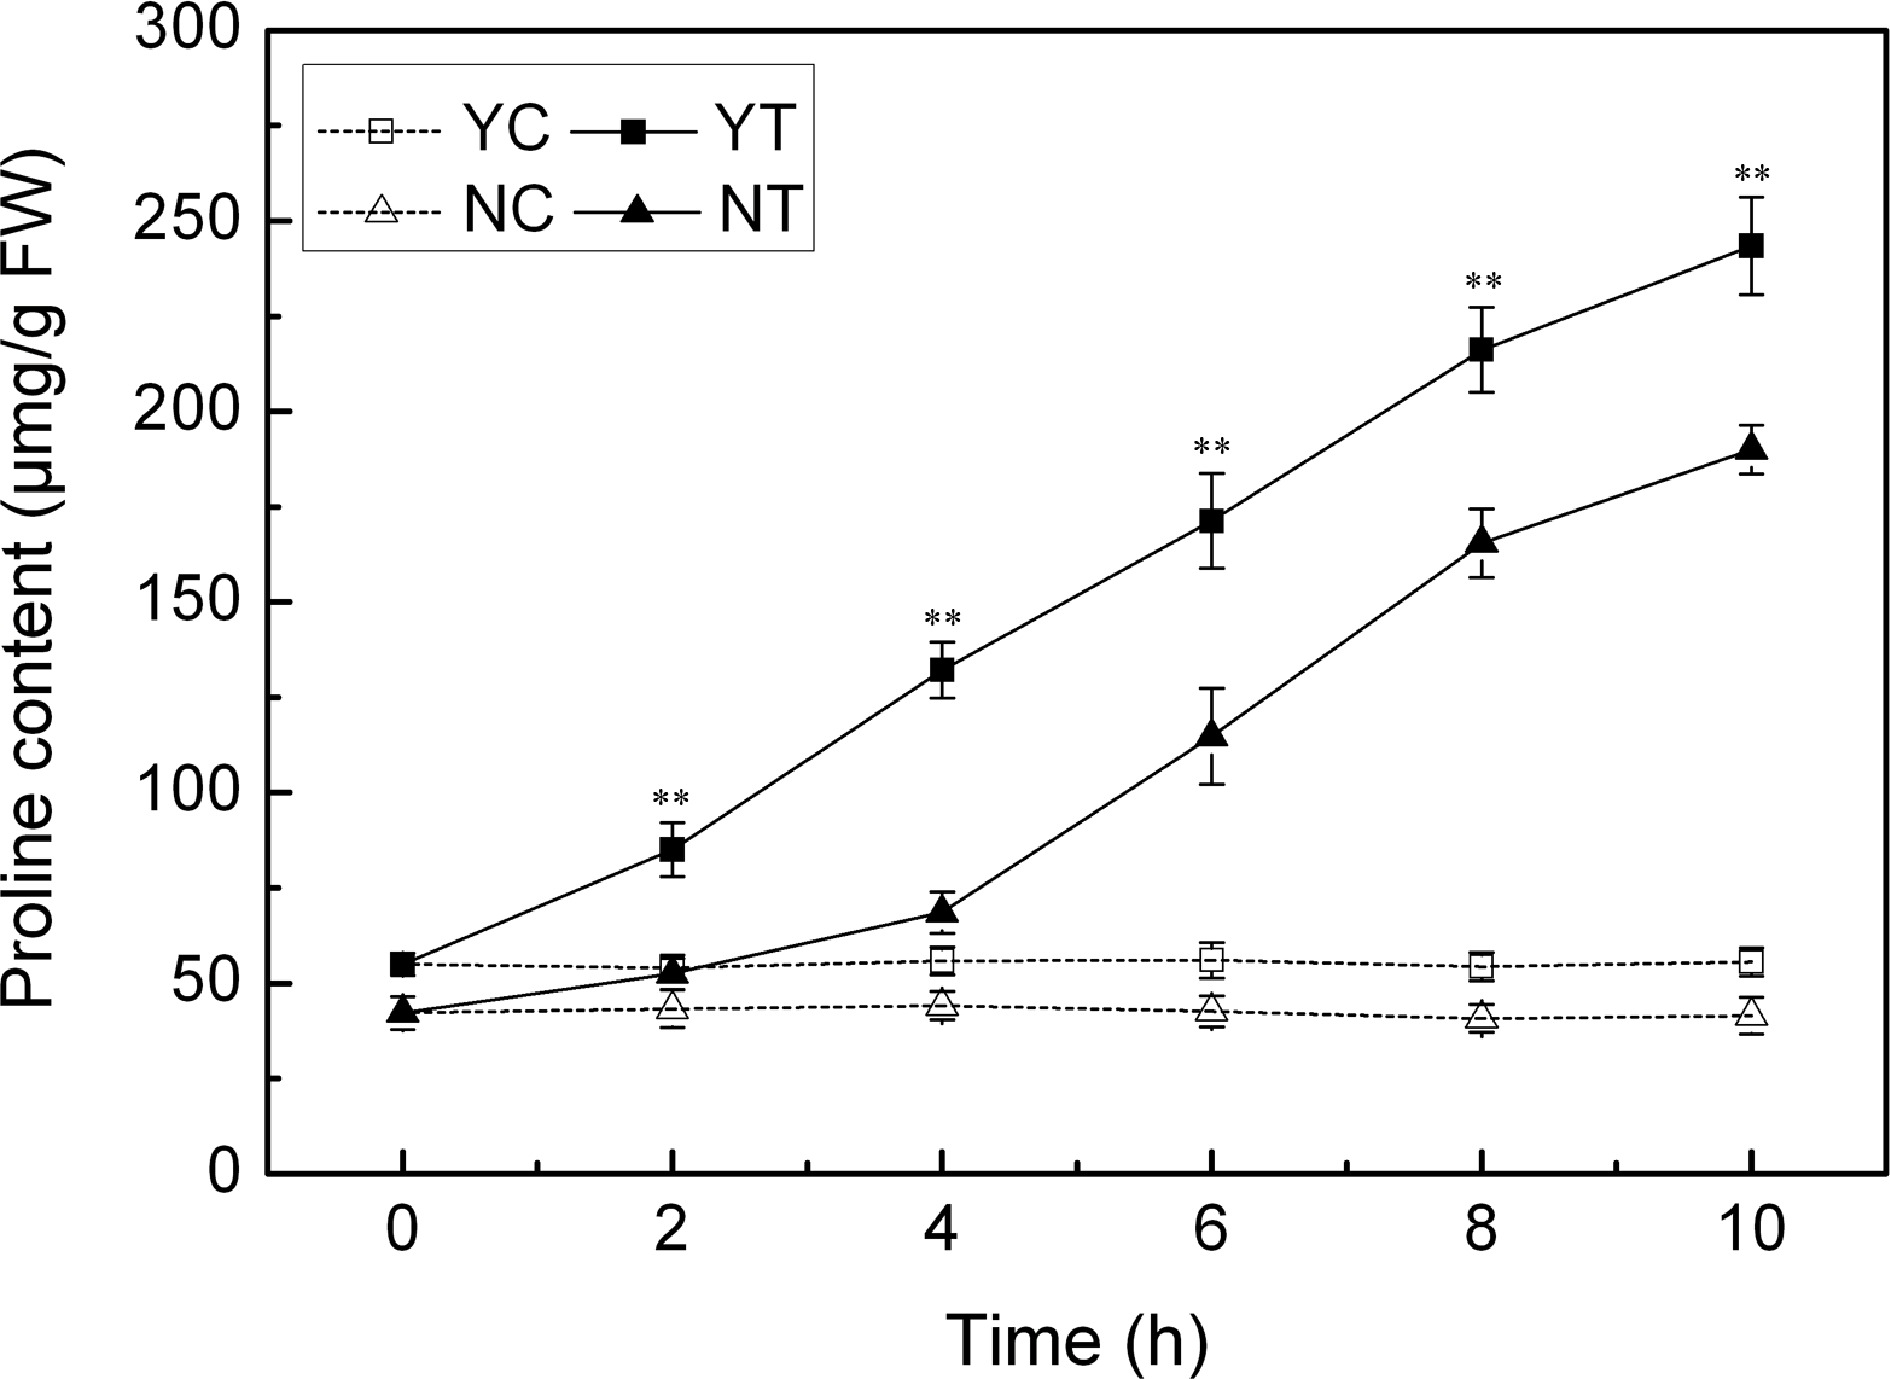
Figure 6.
Free proline content in droughted leaves of C. japonense (Y) and C. nankingense (N). C: Control (no PEG), T: PEG treatment. ** Value significant at P ≤ 0.01. Values given as mean ± SD (n = 3). SD's indicated by a bar.
-
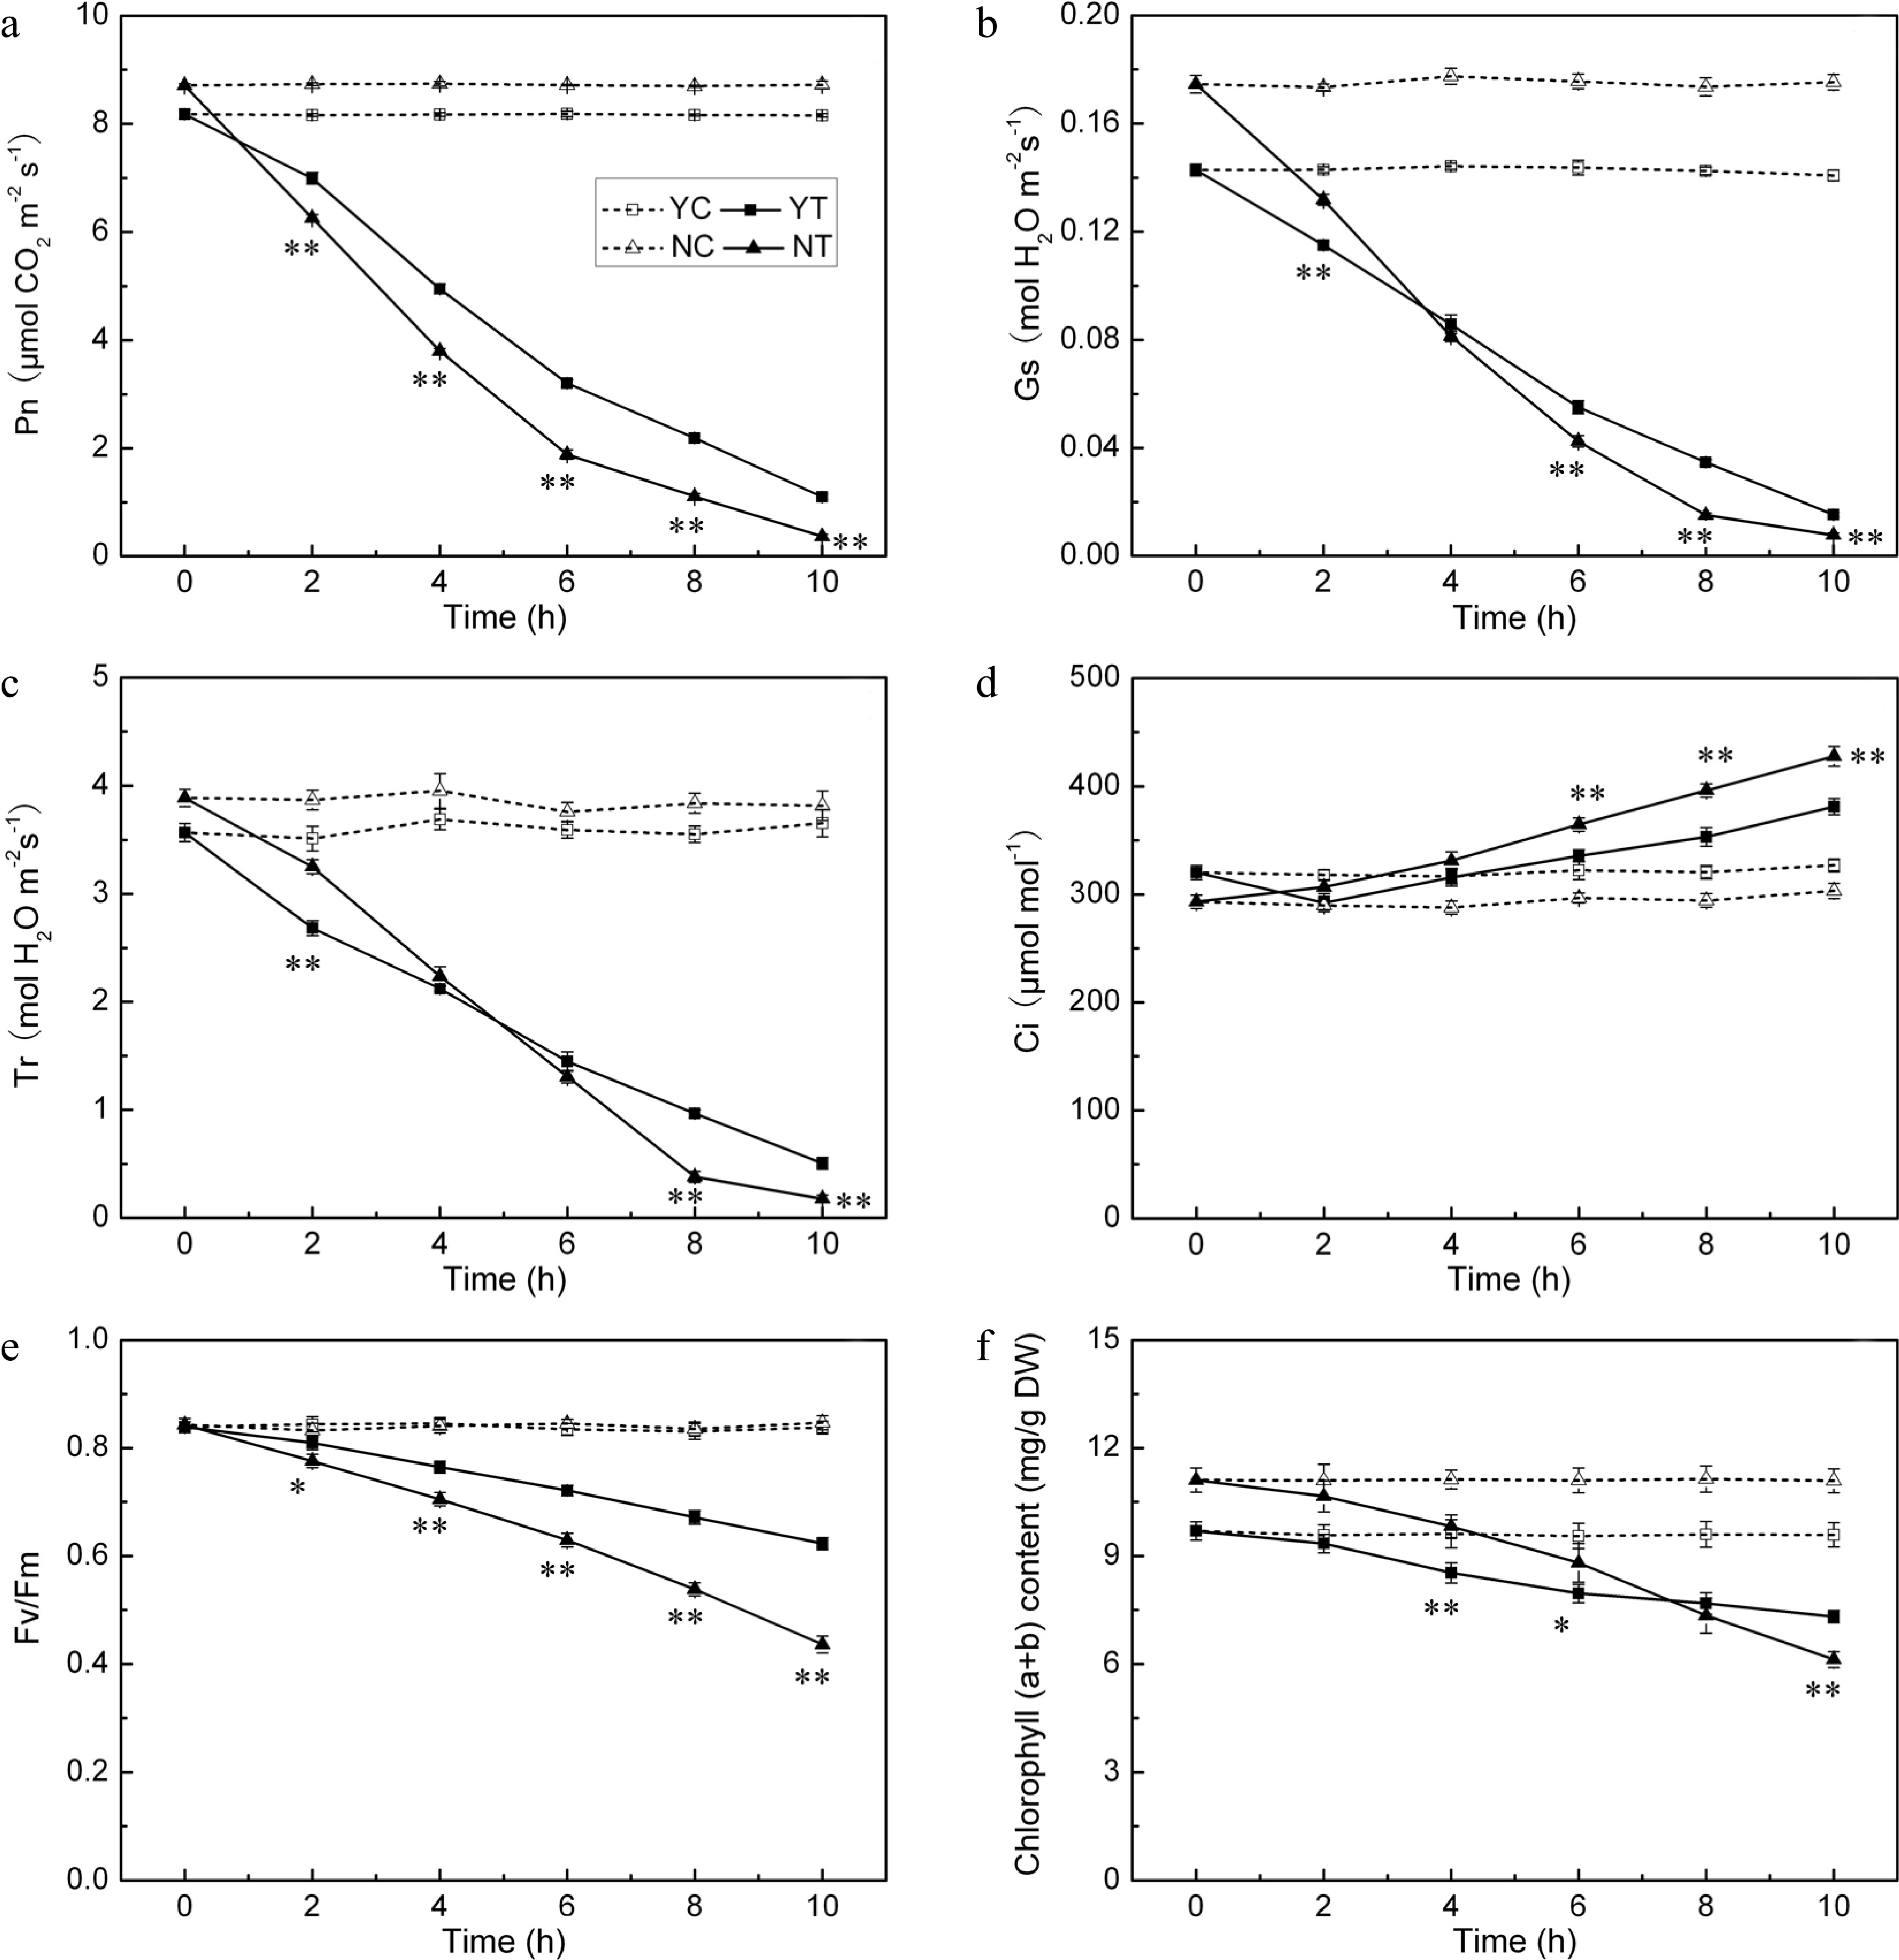
Figure 7.
Photosynthetic parameters (Pn (a), Gs (b), Tr (c), Ci (d), Fv/Fm (e) and chlorophyll (a + b) content (f)) in the droughted leaves of C. japonense (Y) and C. nankingense (N). C: Control (no PEG), T: PEG treatment. *, ** Value significant at P ≤ 0.05 or 0.01. Values given as mean ± SD (n = 5). SD’s indicated by a bar.
-
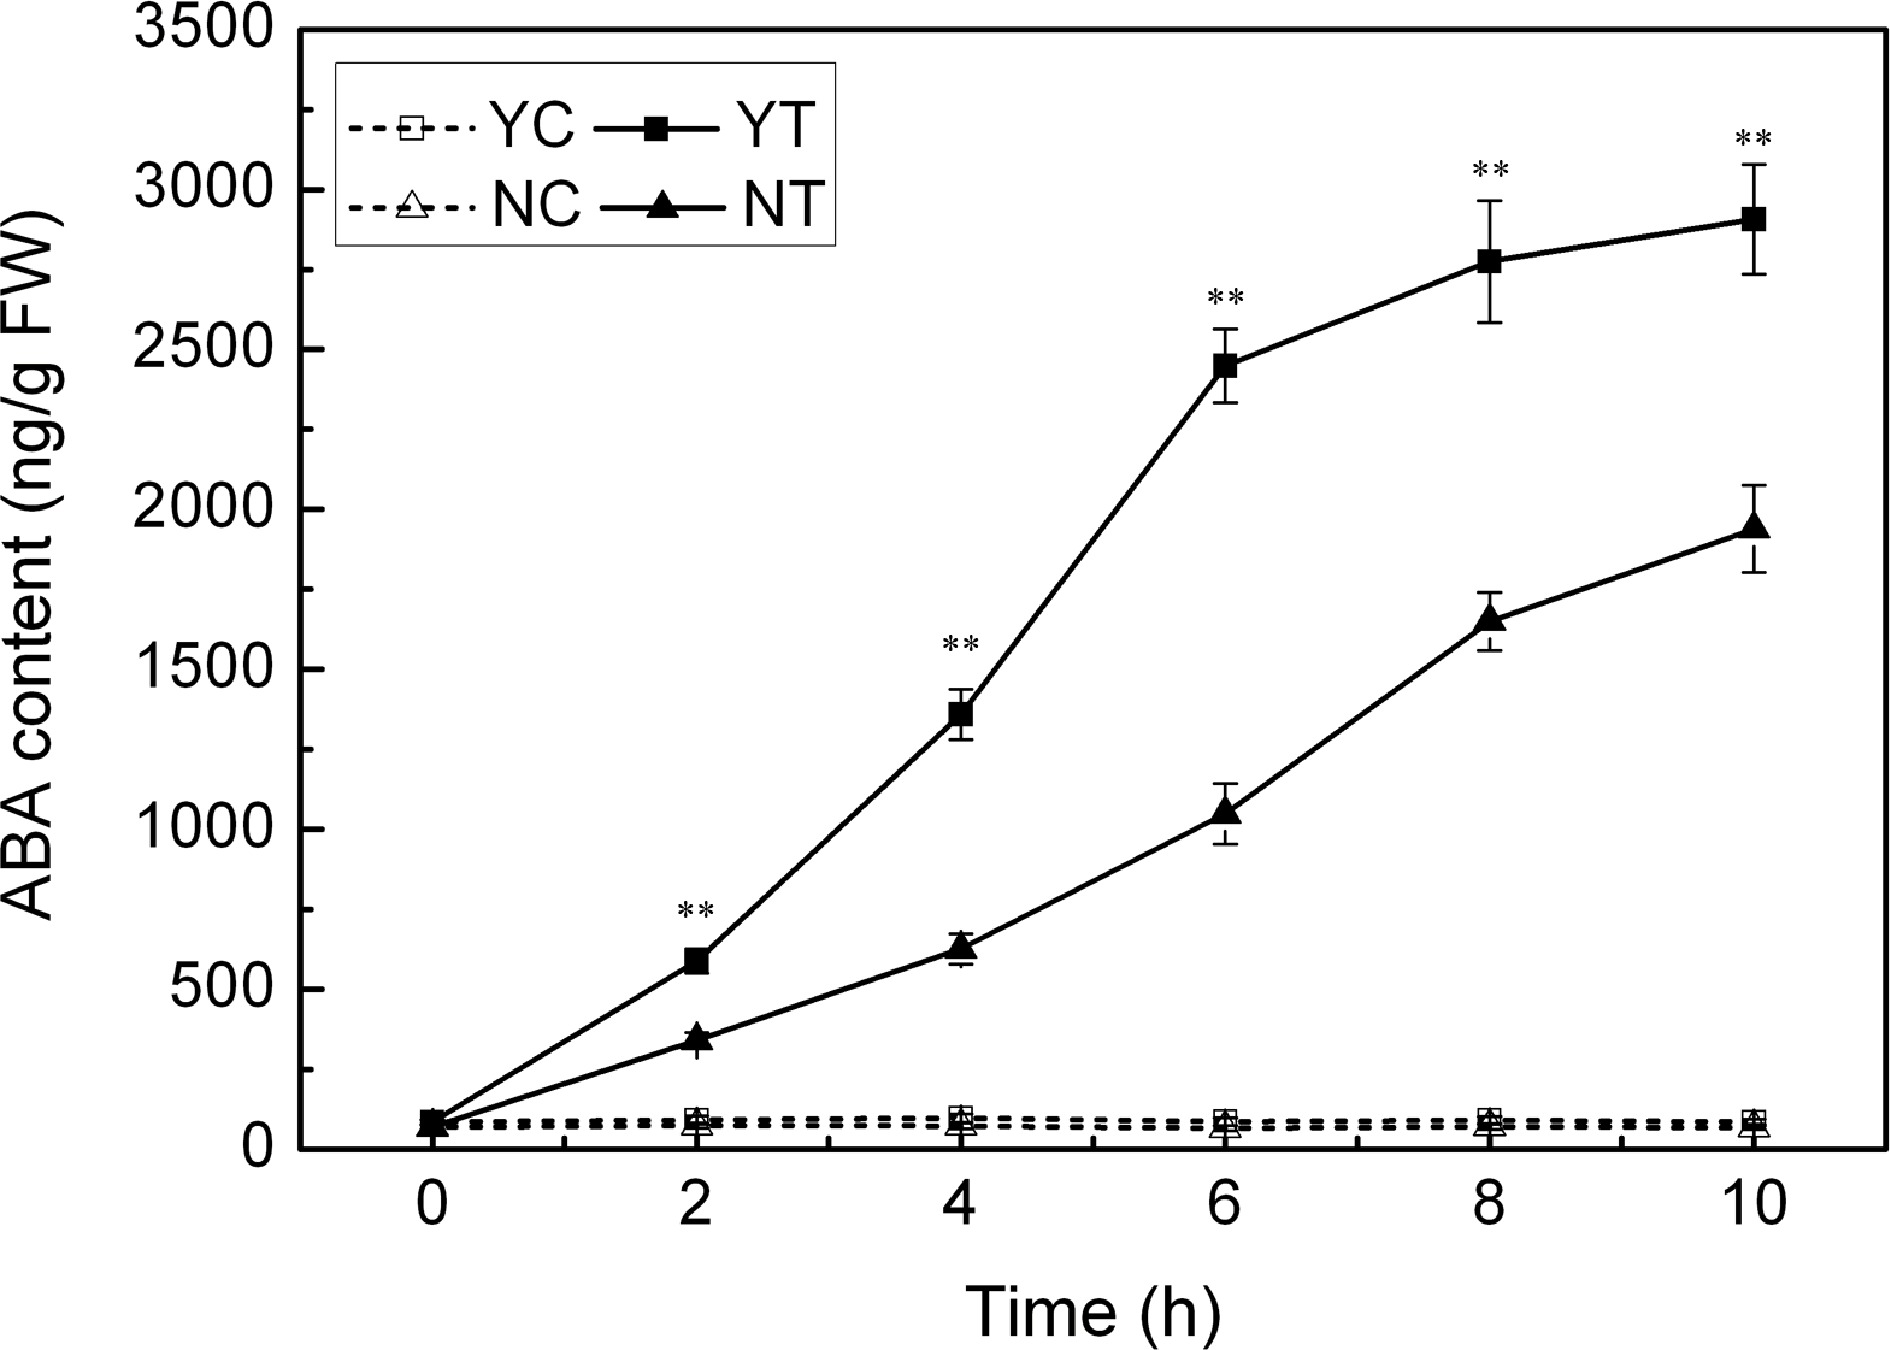
Figure 8.
ABA content in droughted leaves of C. japonense (Y) and C. nankingense (N). C: Control (no PEG), T: PEG treatment. ** Value significant at P ≤ 0.01. Values given as mean ± SD (n = 3). SD's indicated by a bar.
-
Species Upper epidermis of leaf Lower epidermis of leaf Trichome density (mm−2) Stoma density (mm−2) Trichome density (mm−2) Stoma density (mm−2) C. japonense 33.45 ± 1.46A 76.57 ± 11.72 A ∞ N C. nankingense 0.11 ± 0.12B 11.96 ± 10.81B 1.79 ± 0.47 346.94 ± 24.73 Values (given as mean ± SD) labeled with a different letters differed significantly (P ≤ 0.01) (n = 6). ∞ means too much to calculate. N means unable to observe because of the well-developed trichome layer covering lower epidermis of leaf. Table 1.
Variation in leaf surface morphology in C. japonense and C. nankingense.
Figures
(8)
Tables
(1)