-
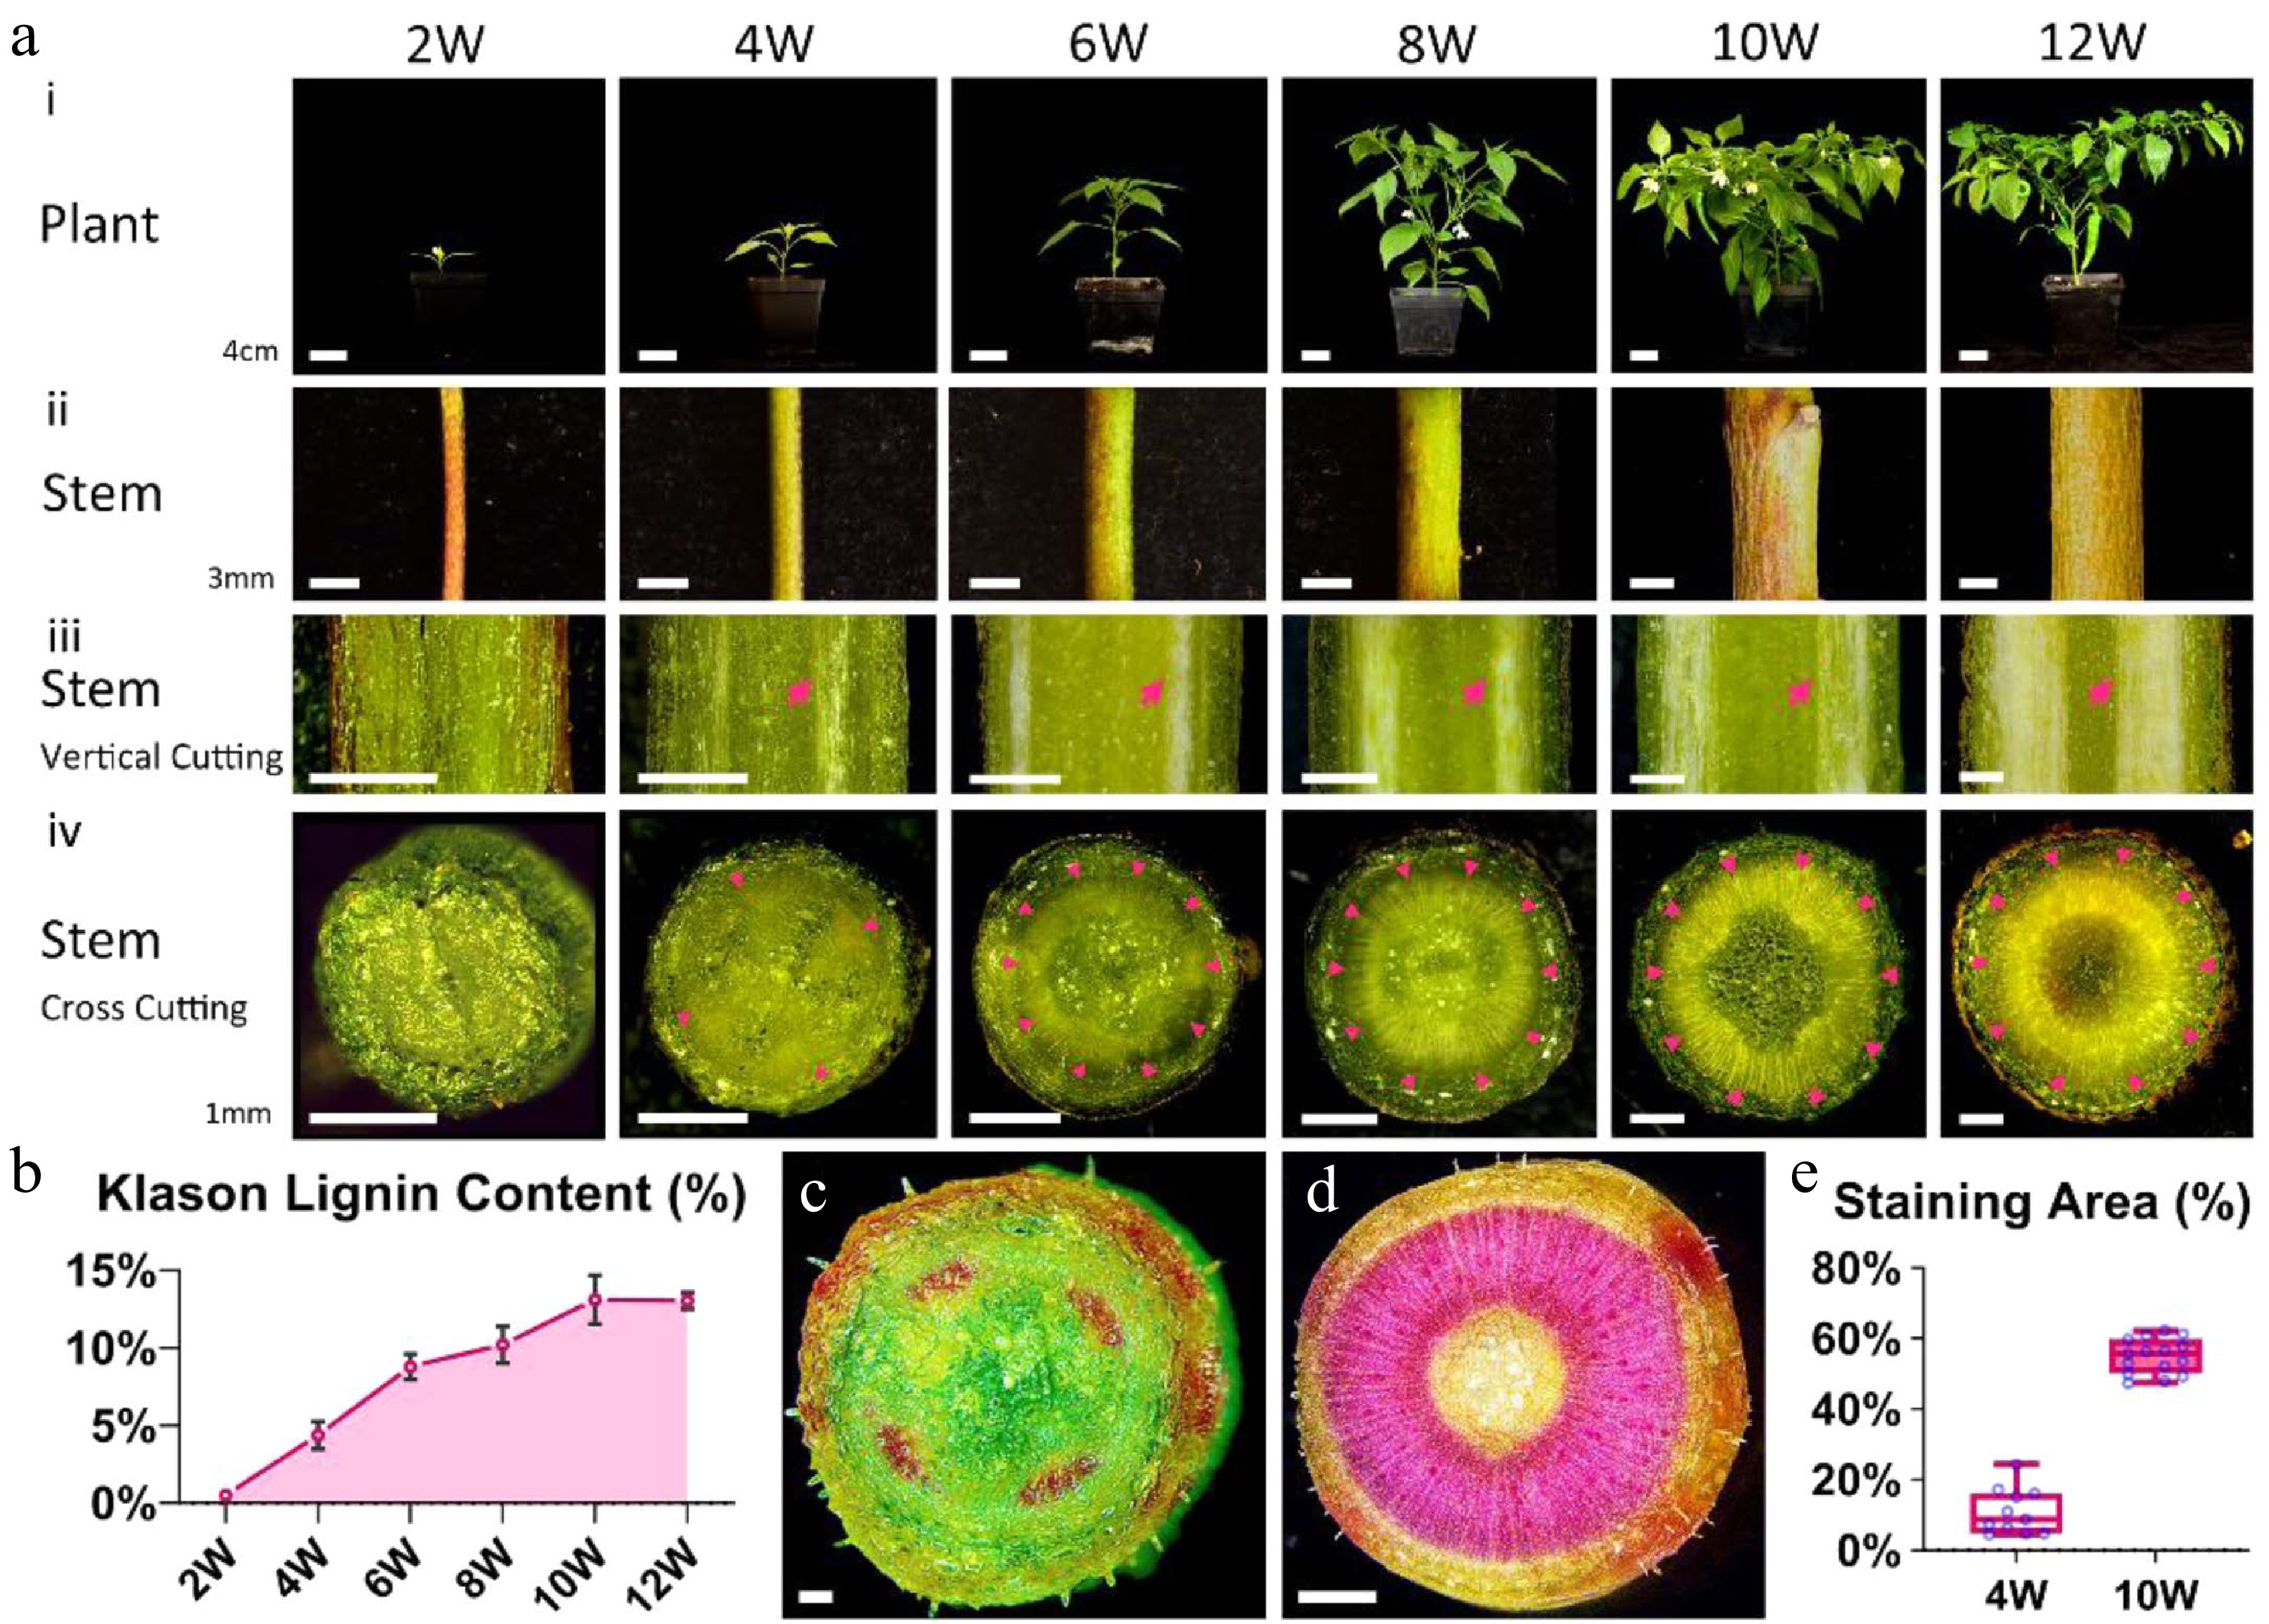
Figure 1.
The contents of lignin increase during pepper stem development. (a) Pepper plant and stem from 2 weeks after germination 2W to 12W: (i) the whole plant morphology of pepper. Bars = 4 cm. (ii) Magnified images of pepper stems. Bars = 3 mm. (iii) Vertical Cutting of pepper stems under stereomicroscope. Red arrows indicate the position of the xylem. Bars = 1 mm. (iv) Cross Cutting of pepper stems under stereomicroscope. Red arrowheads indicate the position of the xylem. Bars = 1 mm. (b) Klason lignin contents in pepper stems from 2W to 12W. (c), (d) Cross section of pepper stem stained with phloroglucinol hydrochloric acid staining solution at 4W (c, bar = 0.2 mm) and 10W (d, bar = 1 mm) under stereomicroscope. (e) The ratio of the area stained by the phloroglucinol hydrochloric acid staining solution to the entire cross-section at 4W and 10W.
-
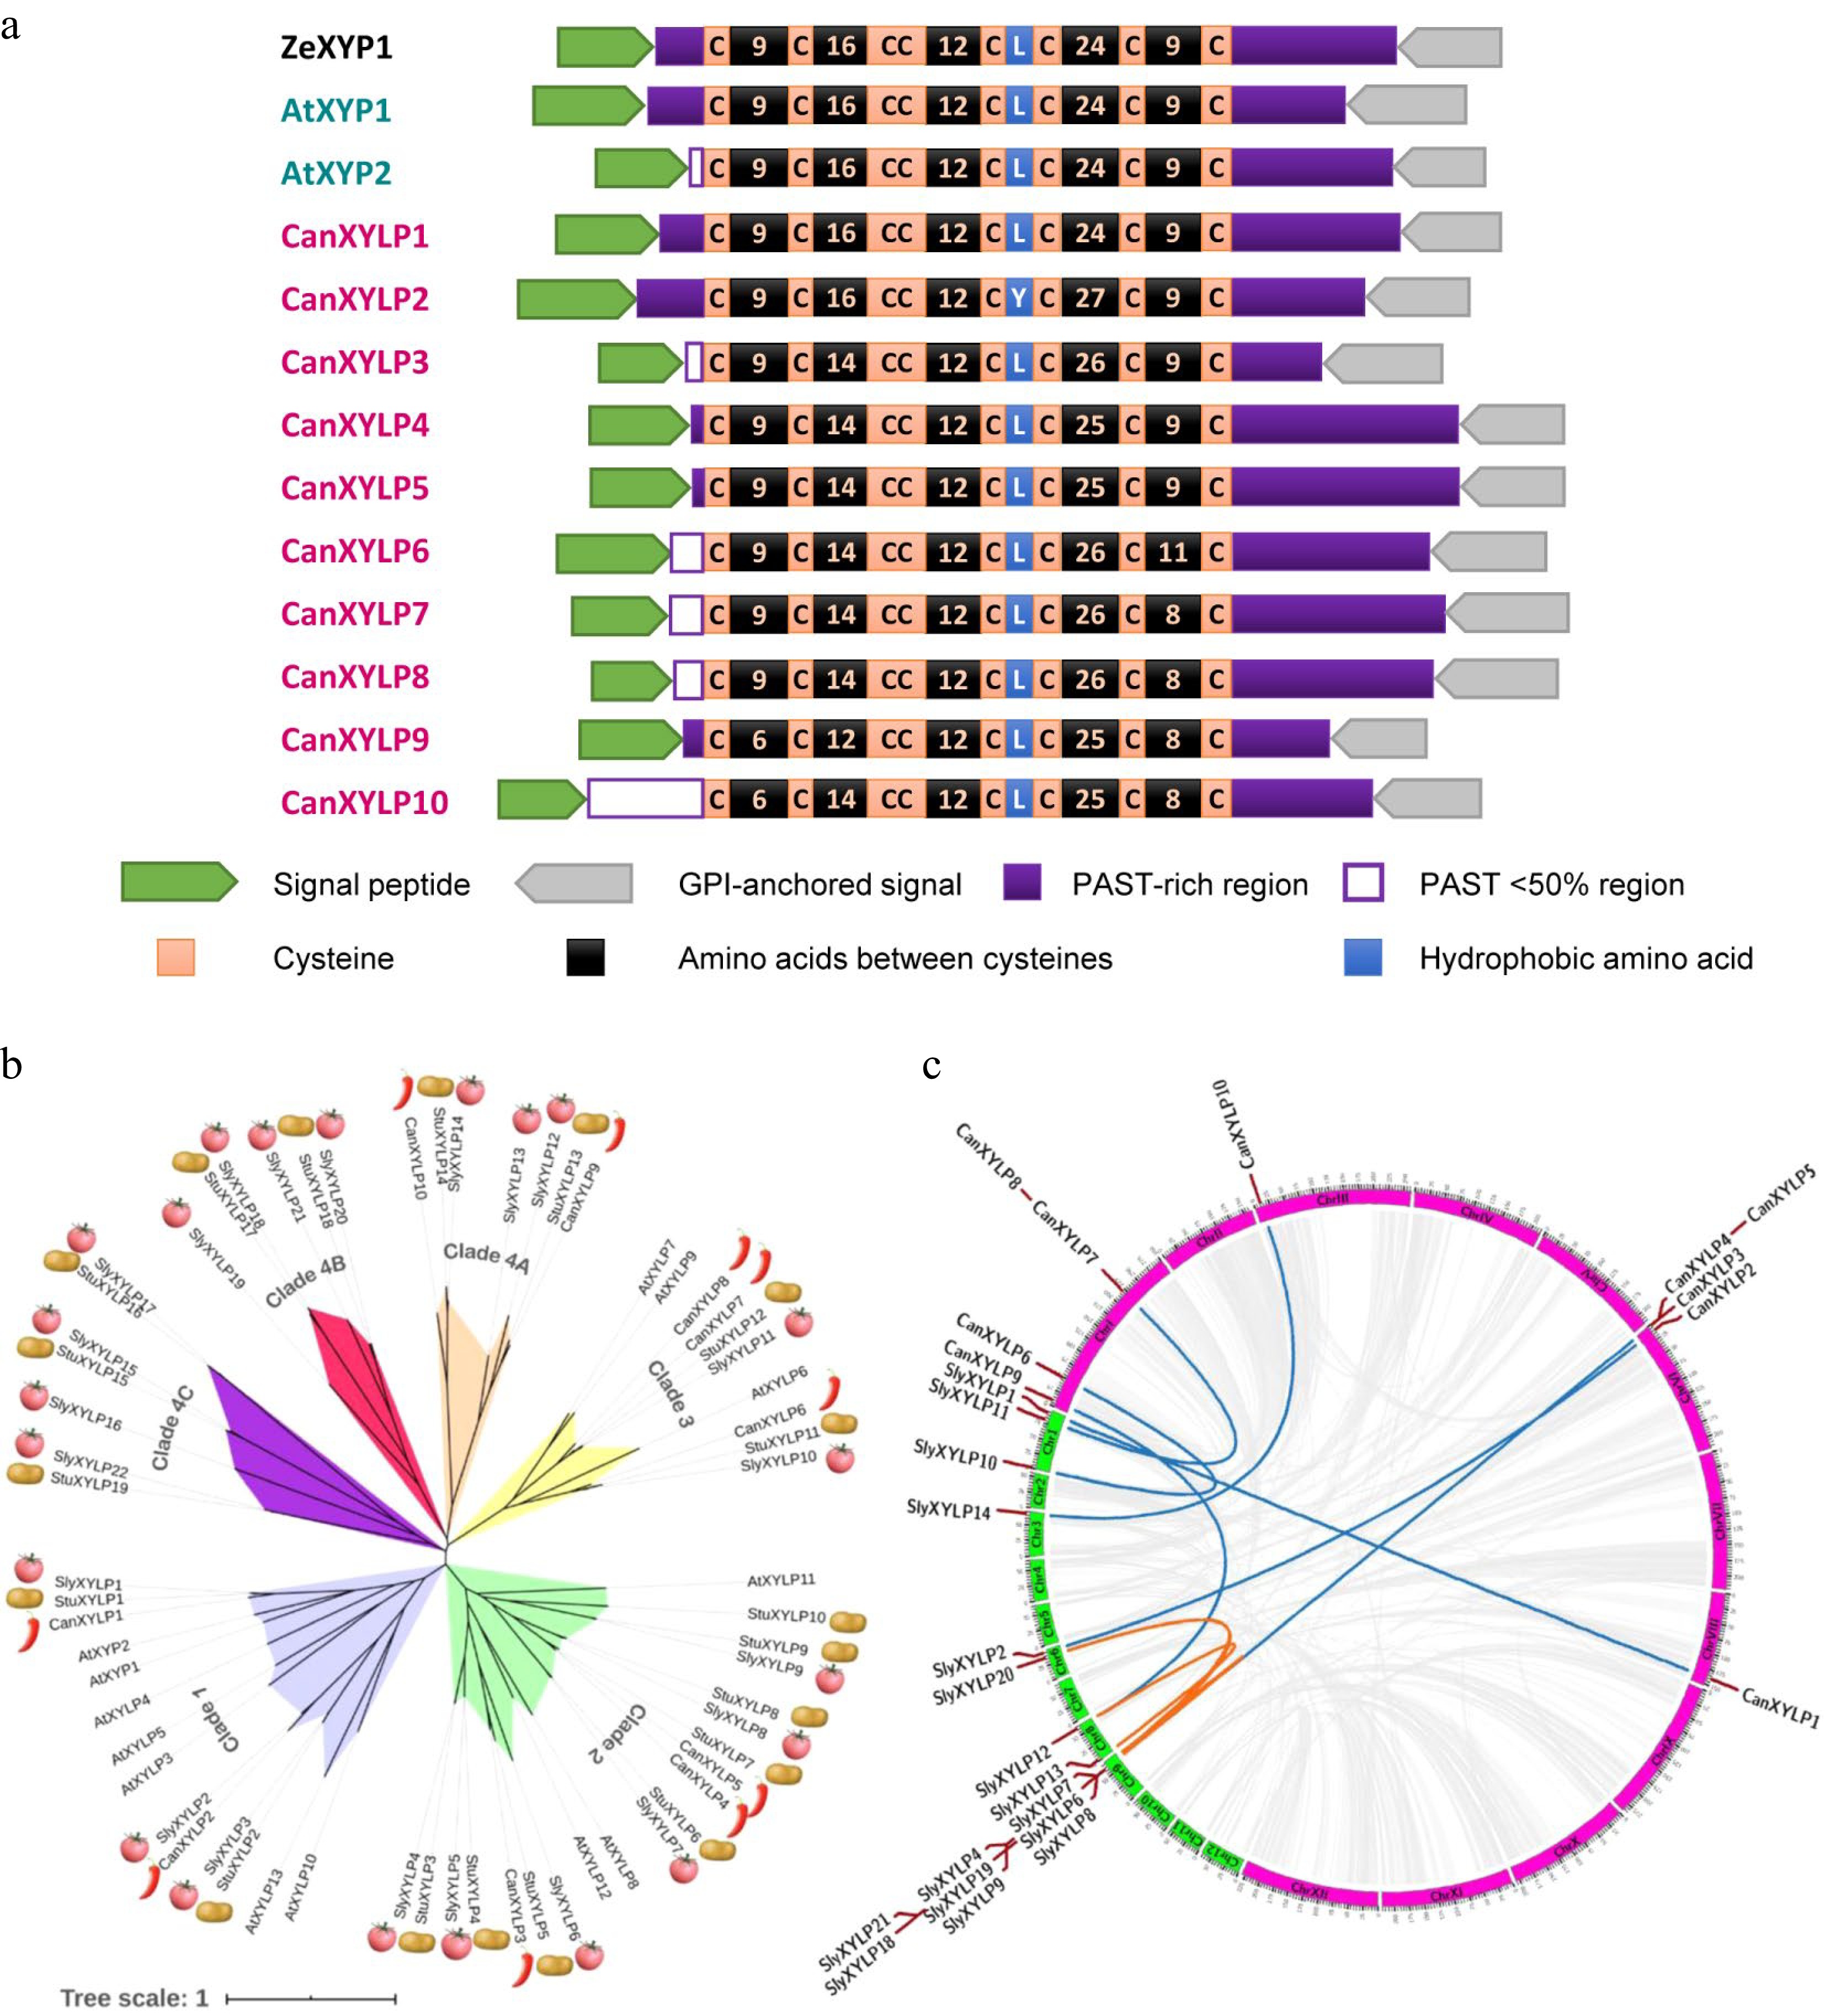
Figure 2.
Protein structure, Phylogenetic and syntenic relationship of XYLPs in Solanaceae. (a) Conserved motifs and structure domain of ZeXYP1, AtXYP1, 2 and 10 CanXYLP proteins. (b) Phylogenetic tree of 12 AtXYLPs, 22 SlyXYLPs, 19 StuXYLPs and 10 CanXYLPs. (c) Comparative synteny of the XYLP gene family between pepper and tomato. Blue lines show interspecific collinearity relationship, orange lines show intraspecific collinearity relationship and gray lines show collinearity relationship of all genes.
-
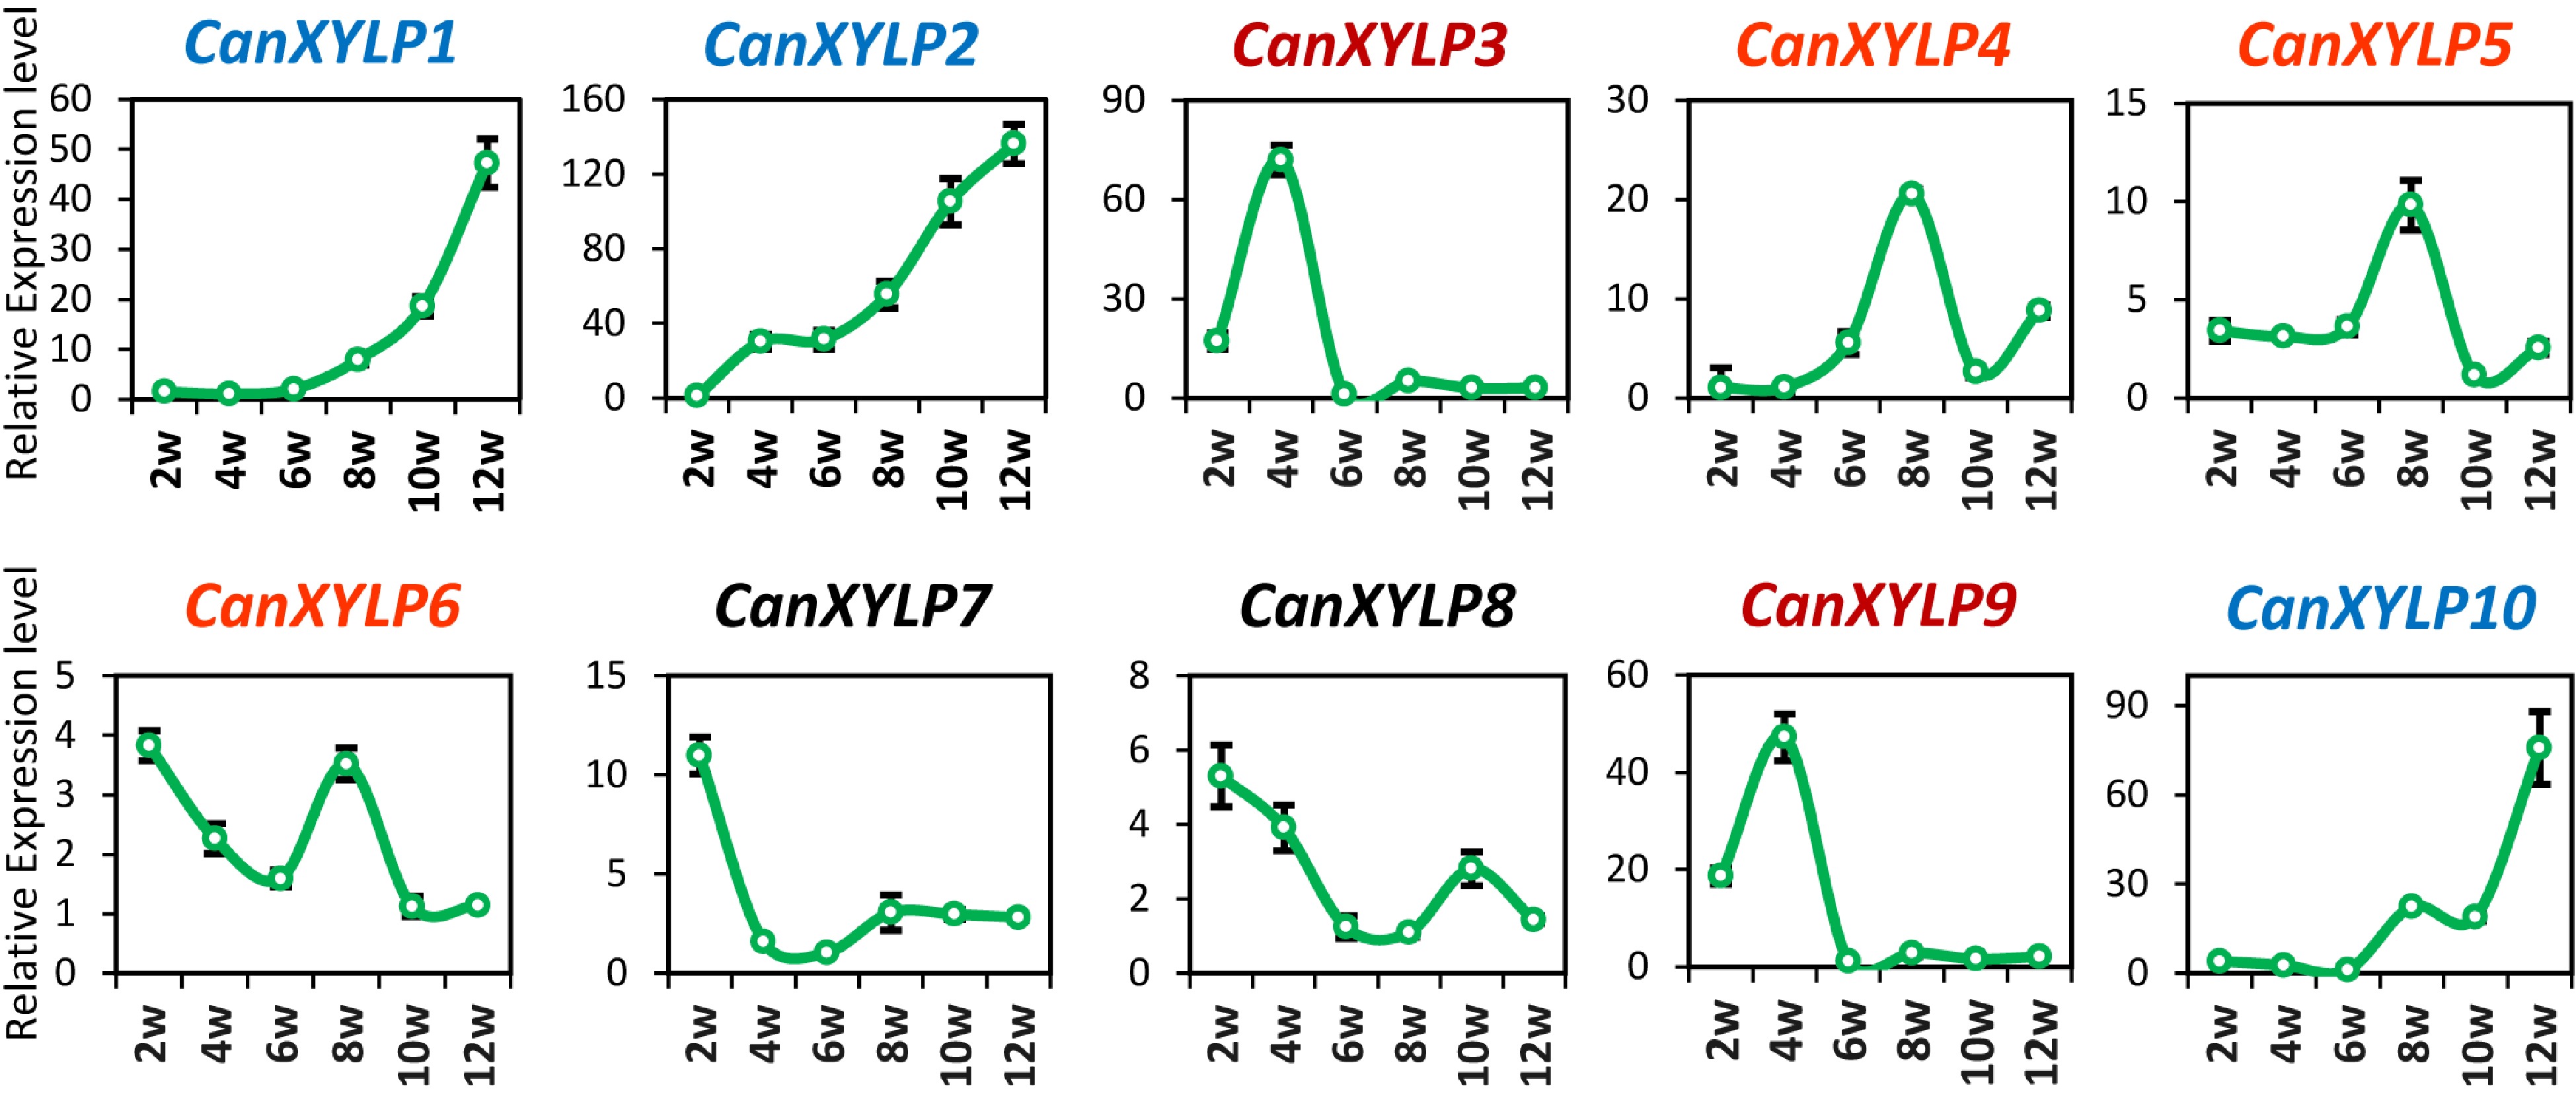
Figure 3.
Expression analysis of CanXYLP genes during pepper stem growth. Relative expression level of 10 CanXYLPs in the stems of pepper at 6 developmental stages from 2W to 12W.
-
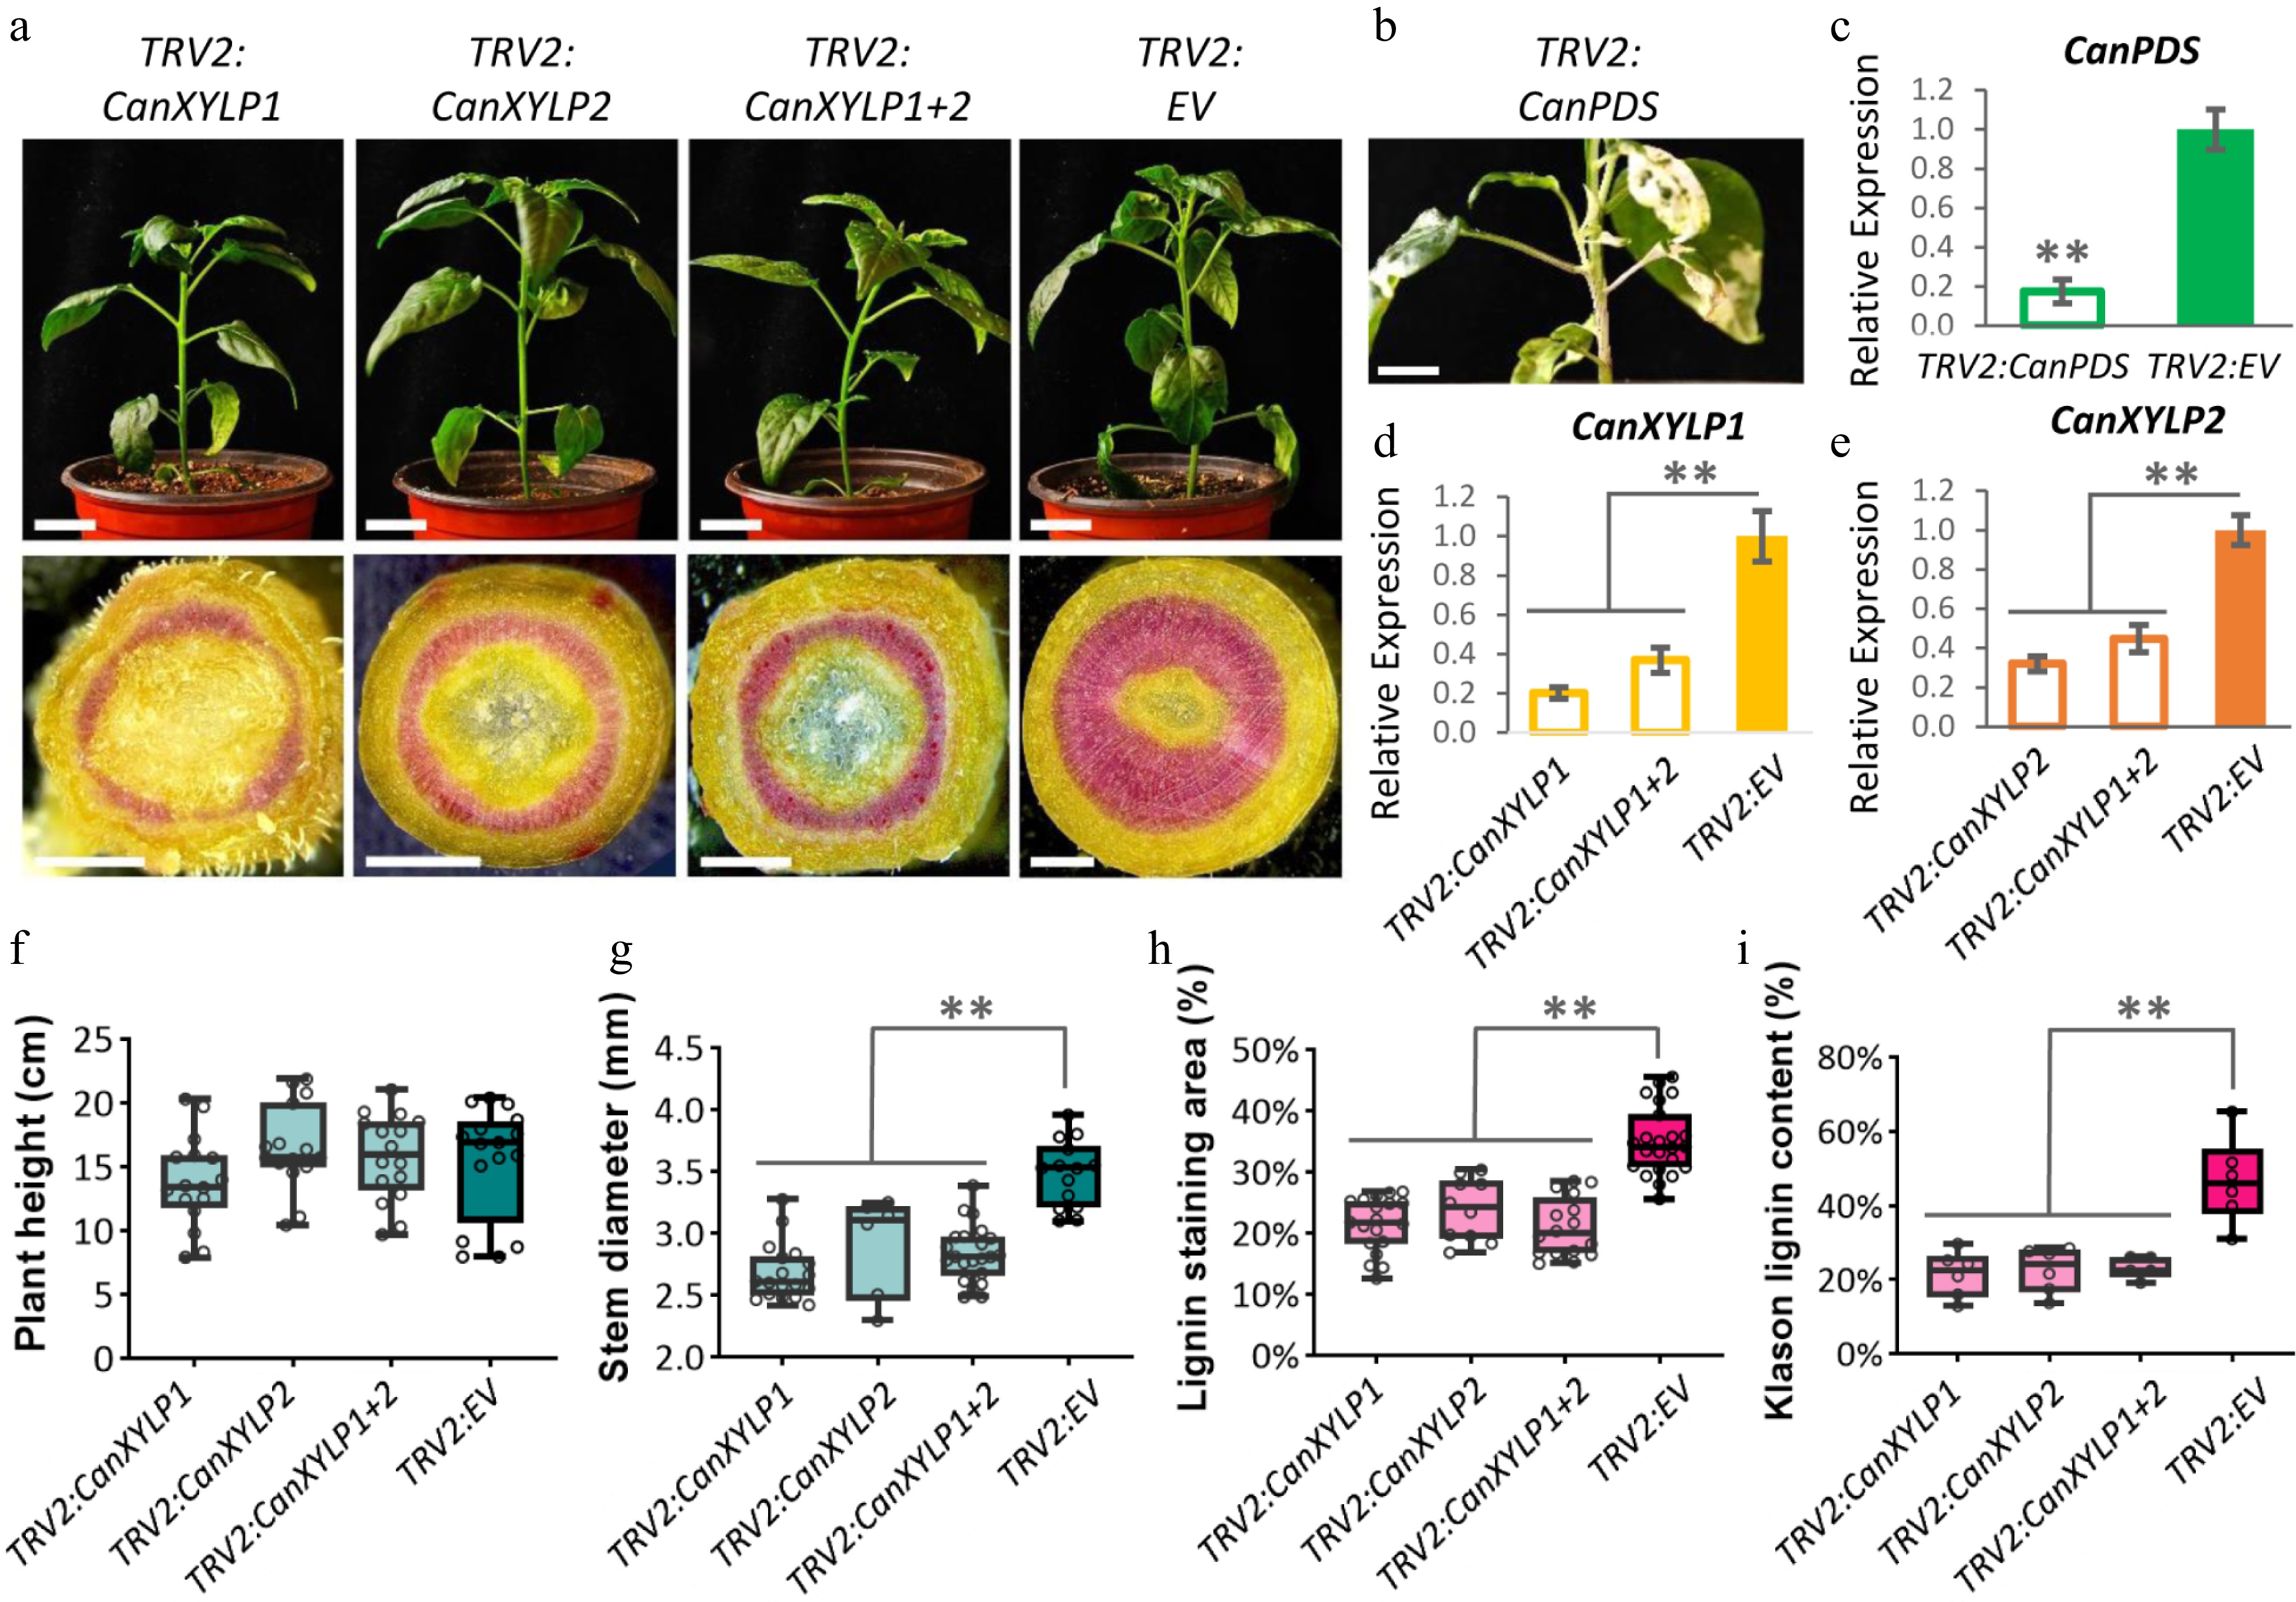
Figure 4.
CanXYLP1 and 2 silencing significantly reduced the lignin contents in pepper stem. (a) Phenotypes of TRV2:CanXYLP1/TRV2:CanXYLP2/TRV2:CanXYLP1+2/TRV2:EV + TRV1 expressed pepper plants (Bars = 2 cm) and the cross sections of their stems (Bars = 1 mm) at 10W stage. (b) Bleached stem of pepper plant expressed TRV2:CaPDS. Bar = 2 cm. (c) Relative expression of CanPDS gene after TRV2:CanPDS/TRV2:EV + TRV1 infiltrated stems at 10W stage. (d) Relative expression of CanXYLP1 in TRV2:CanXYLP1/TRV2:CanXYLP1+2/TRV2:EV + TRV1 infiltrated stems at 10W stage. (e) The relative expression of CanXYLP2 in TRV2:CanXYLP2/TRV2:CanXYLP1+2/TRV2:EV + TRV1 infiltrated stems. (f)-(i) Comparation of plant height (f), stem diameter (g), ratio of area stained by phloroglucinol hydrochloric acid to the entire cross section (h) and Klason lignin content (i) among TRV2:CanXYLP1+TRV1, TRV2:CanXYLP2 + TRV1, TRV2:CanXYLP1+2 + TRV1 and TRV2:EV + TRV1 infiltrated stems at 10W stage (**, P < 0.01).
-
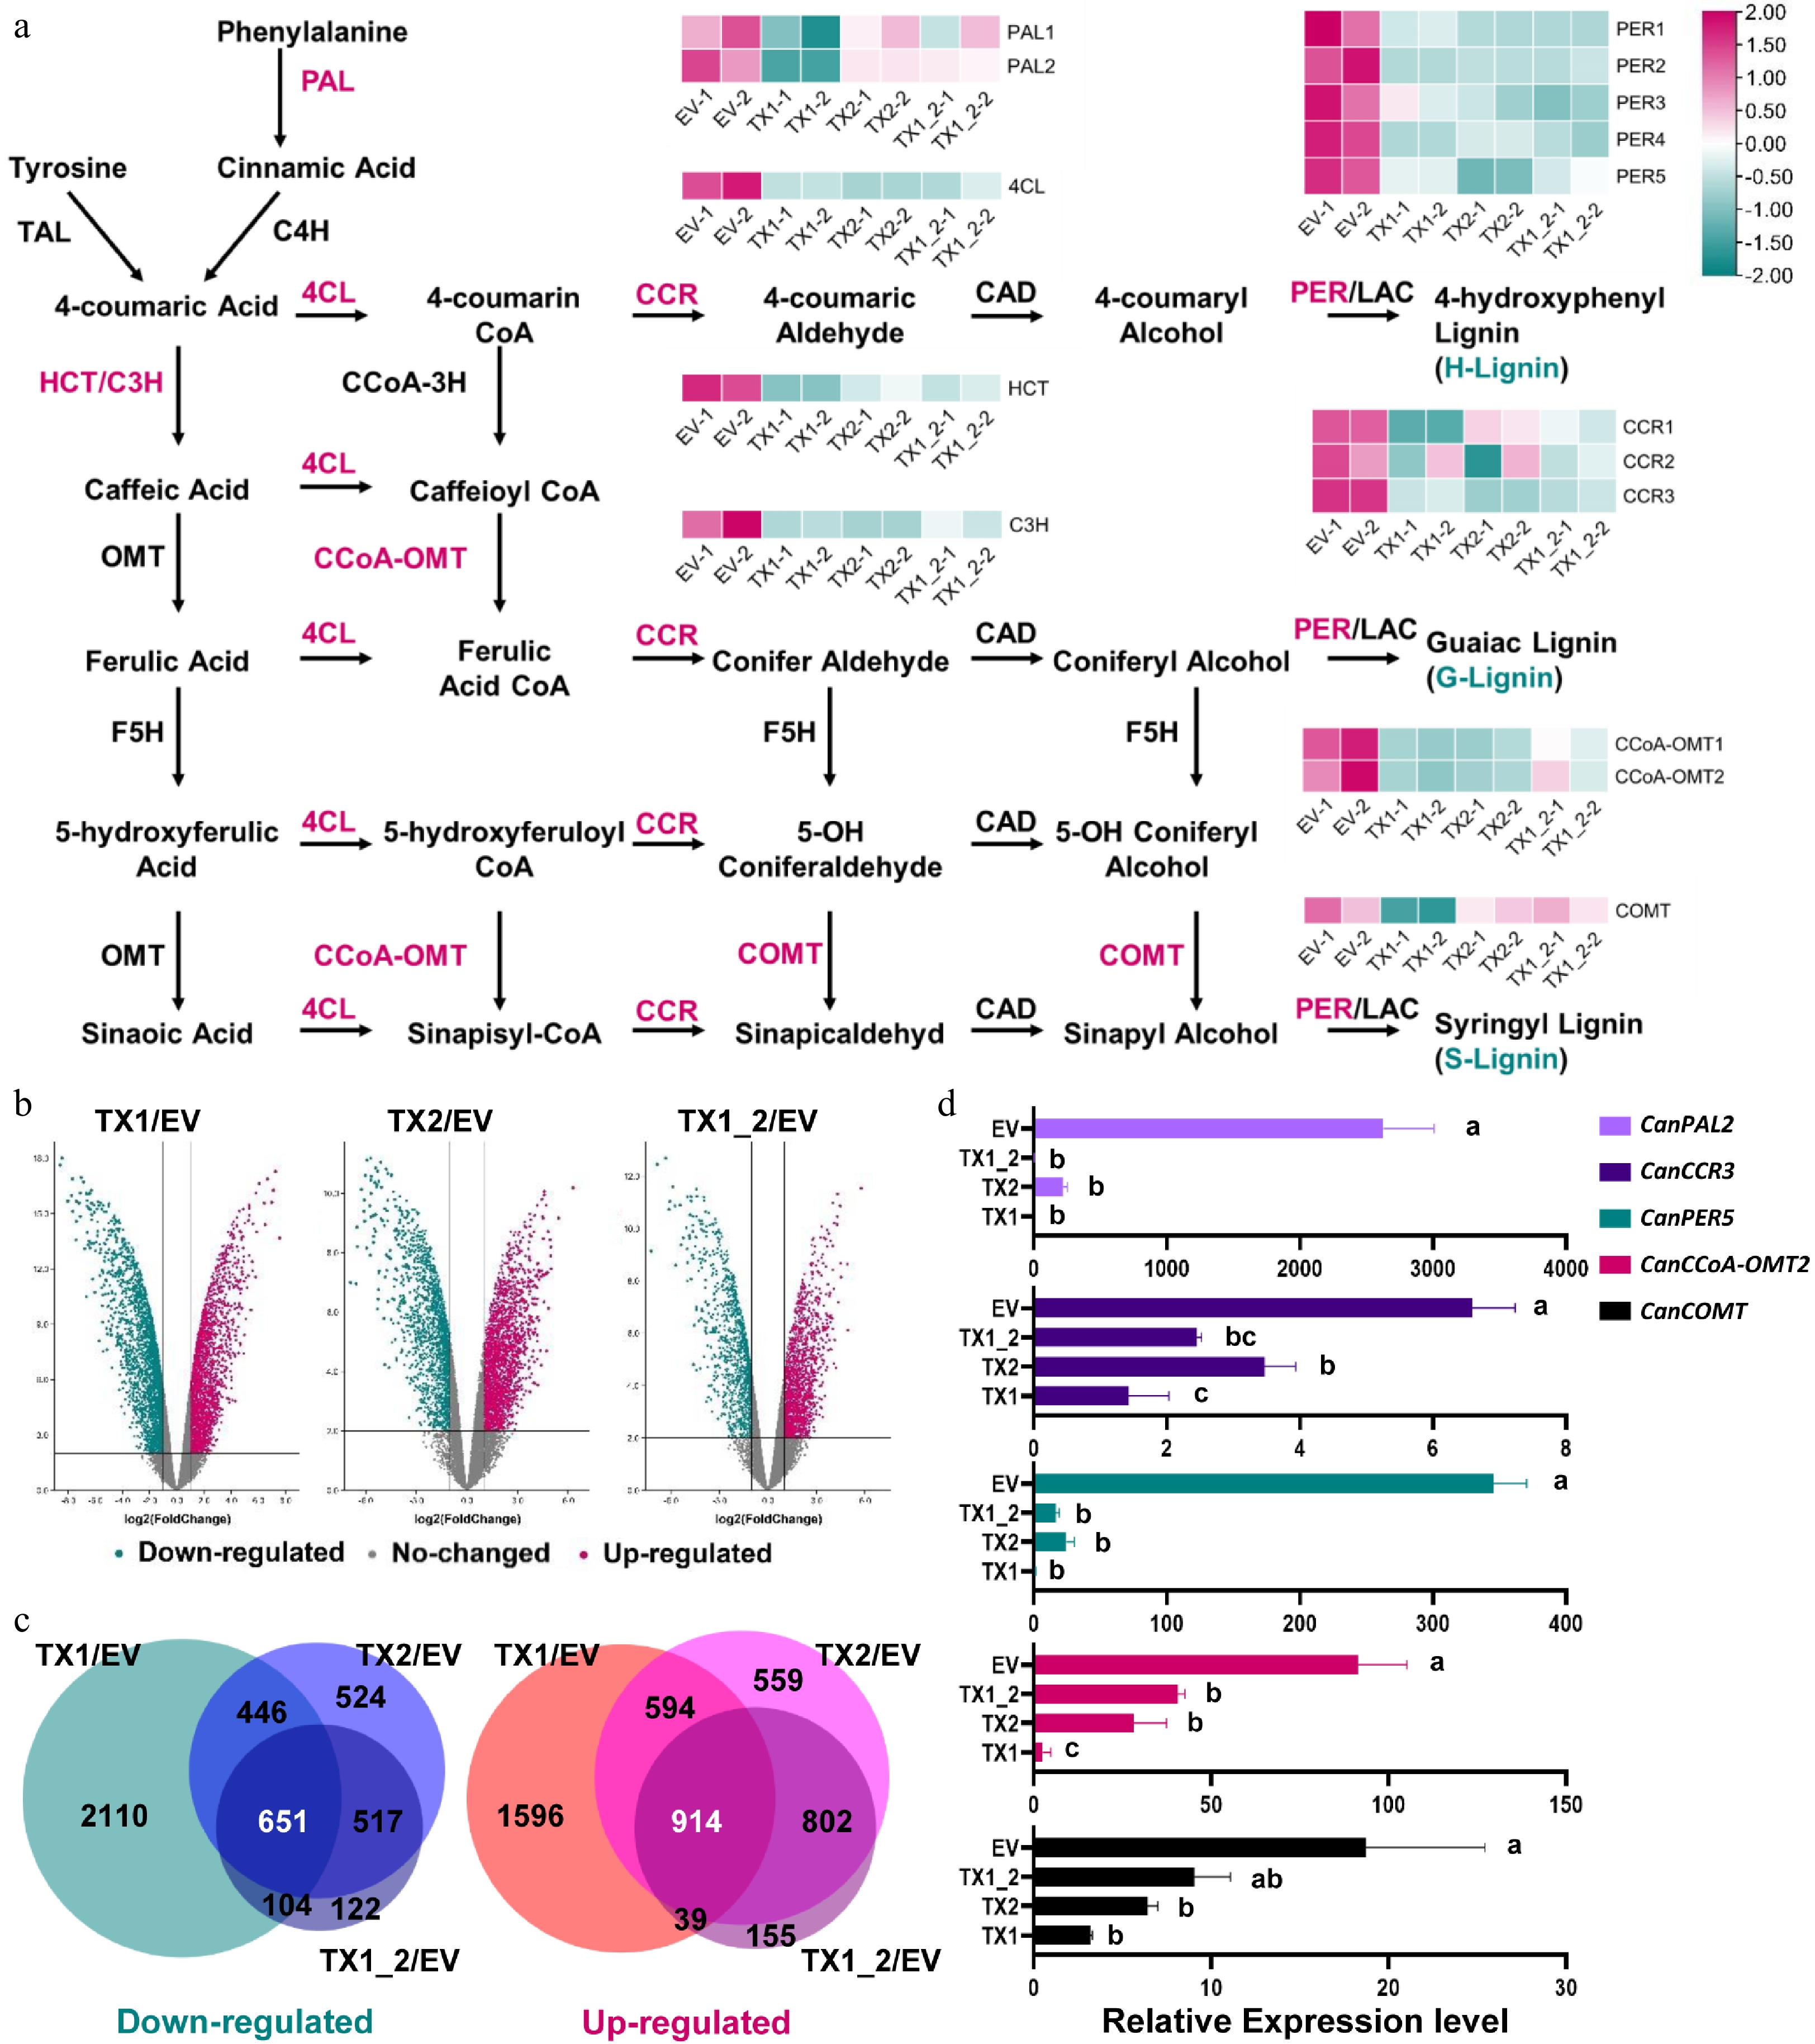
Figure 5.
CanXYLP1 and 2 function on lignin synthesis pathway in pepper. (a) Heatmap of transcript levels in FPKM for genes that are involved in the lignin biosynthetic pathway and are distinctly expressed among TX1, TX2, TX1_2 and EV. (b) Volcano plot of DEGs. Red dots indicate up-regulation, blue dots indicate down-regulation, gray dots indicate unchanged. (c) Venn diagram analysis of lower (left) and higher (right) expressed genes in TX1/EV, TX2/EV and TX1_2/EV. (d) qRT-PCR analysis verified the down-regulated relative expression levels of CanPAL2, CanCCR3, CanPER5, CanCCoA-OMT2 and CanCOMT in TX1, TX2, TX1_2 compared with EV (P < 0.05).
-
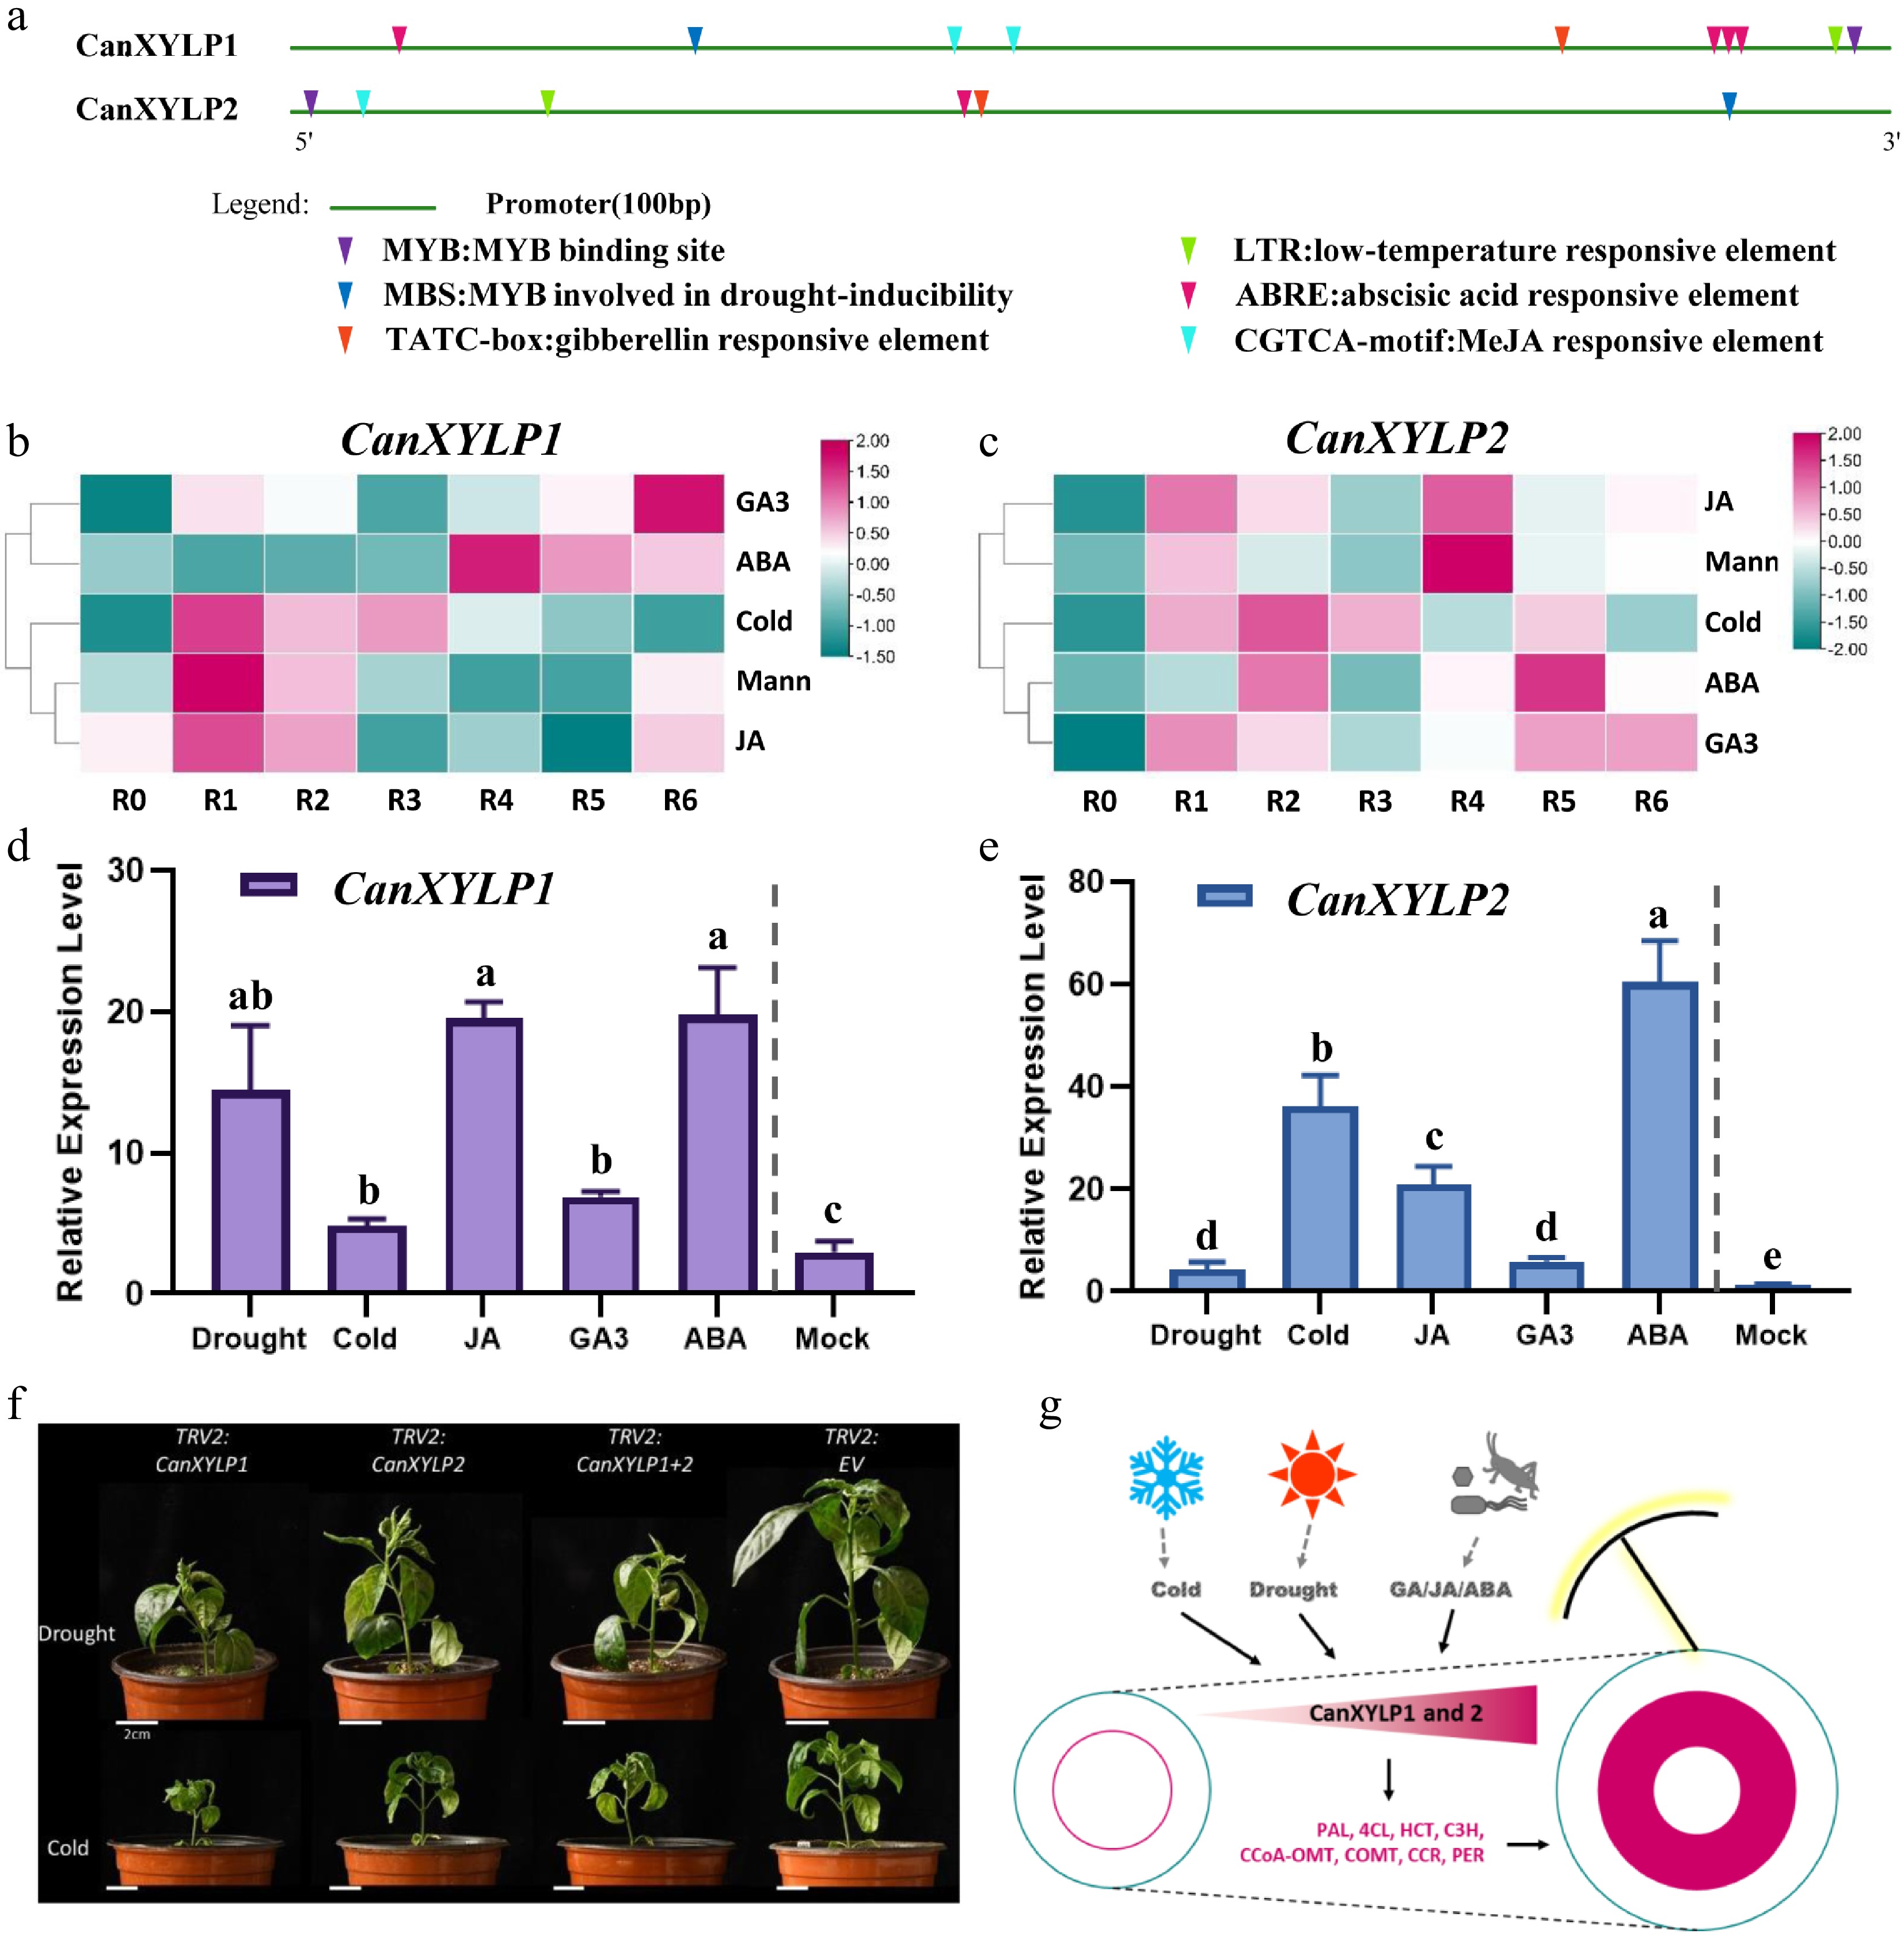
Figure 6.
CanXYLP1 and 2 have positive responses to biotic and abiotic stresses. (a) Promoter cis-regulatory elements analysis of CanXYLP1 and CanXYLP2 promoter sequences. (b), (c) Heatmap showing the expressing level of CanXYLP1(b) and CanXYLP2 (c) gene after biotic (GA3, ABA, JA) and abiotic (Cold, Mannitol) treatment for 1-6 hours. (d, e) qRT-PCR analysis of the relative expression levels of CanXYLP1 (d) and CanXYLP2 (e) under above biotic and abiotic treatment (equally mixed R1-R6) compared with Mock (R0) (P < 0.05). (f) Phenotypes of TRV2:CanXYLP1/TRV2:CanXYLP2/TRV2:CanXYLP1+2/TRV2:EV + TRV1 expressed pepper plants under drought and cold stress. Bars = 2 cm. (g) Proposed model for CanXYLP1 and CanXYLP2 regulation of lignin biosynthesis during pepper stem development.
Figures
(6)
Tables
(0)