-
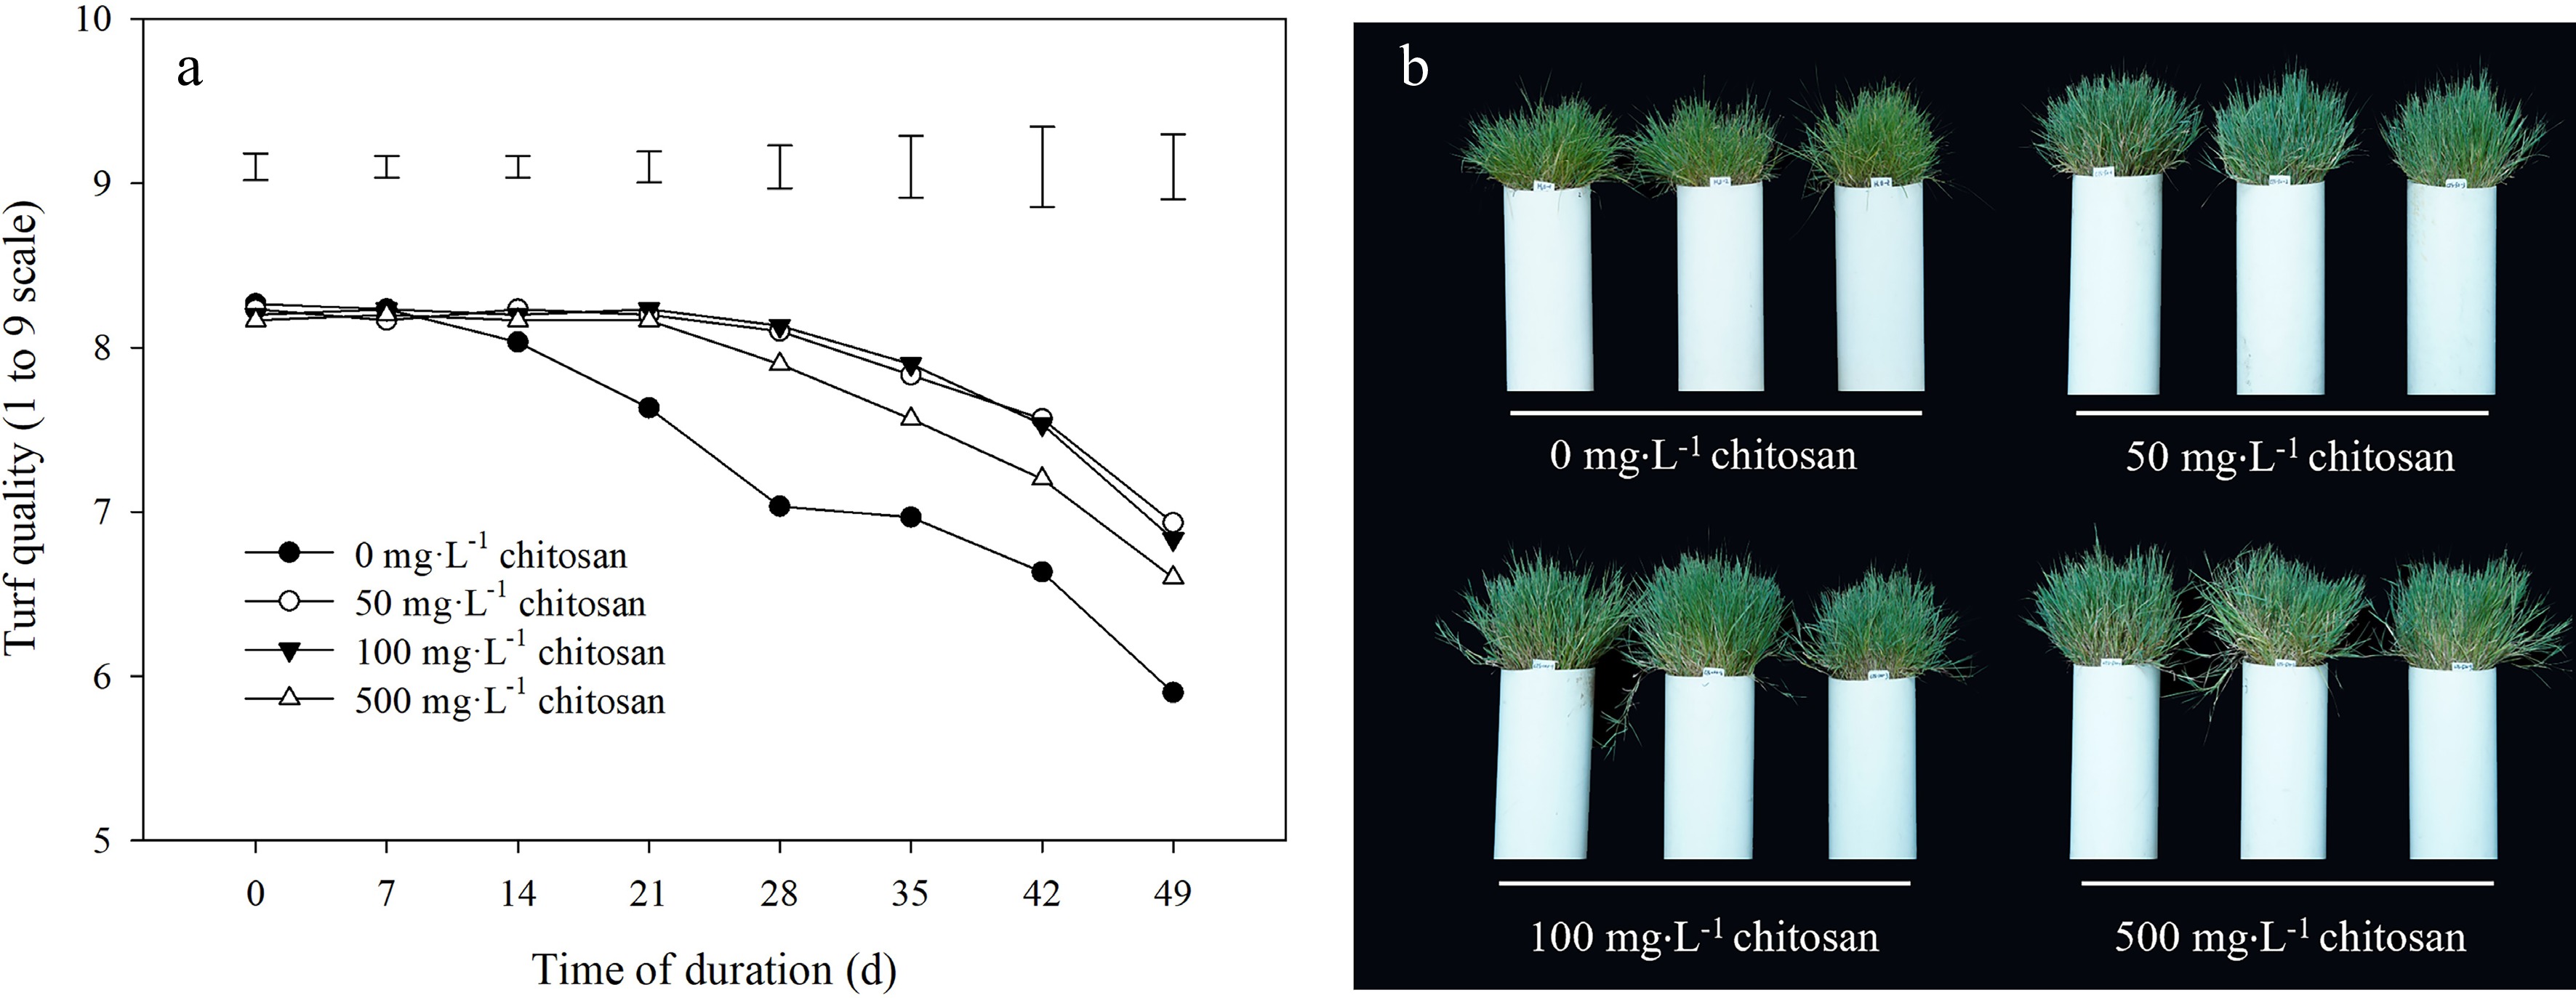
Figure 1.
Effects of different chitosan concentrations on (a) turf quality and (b) shoot phenotypes in creeping bentgrass under heat stress. Vertical bars indicate significant difference based on LSD values at 0.05 level for the comparison among treatments.
-
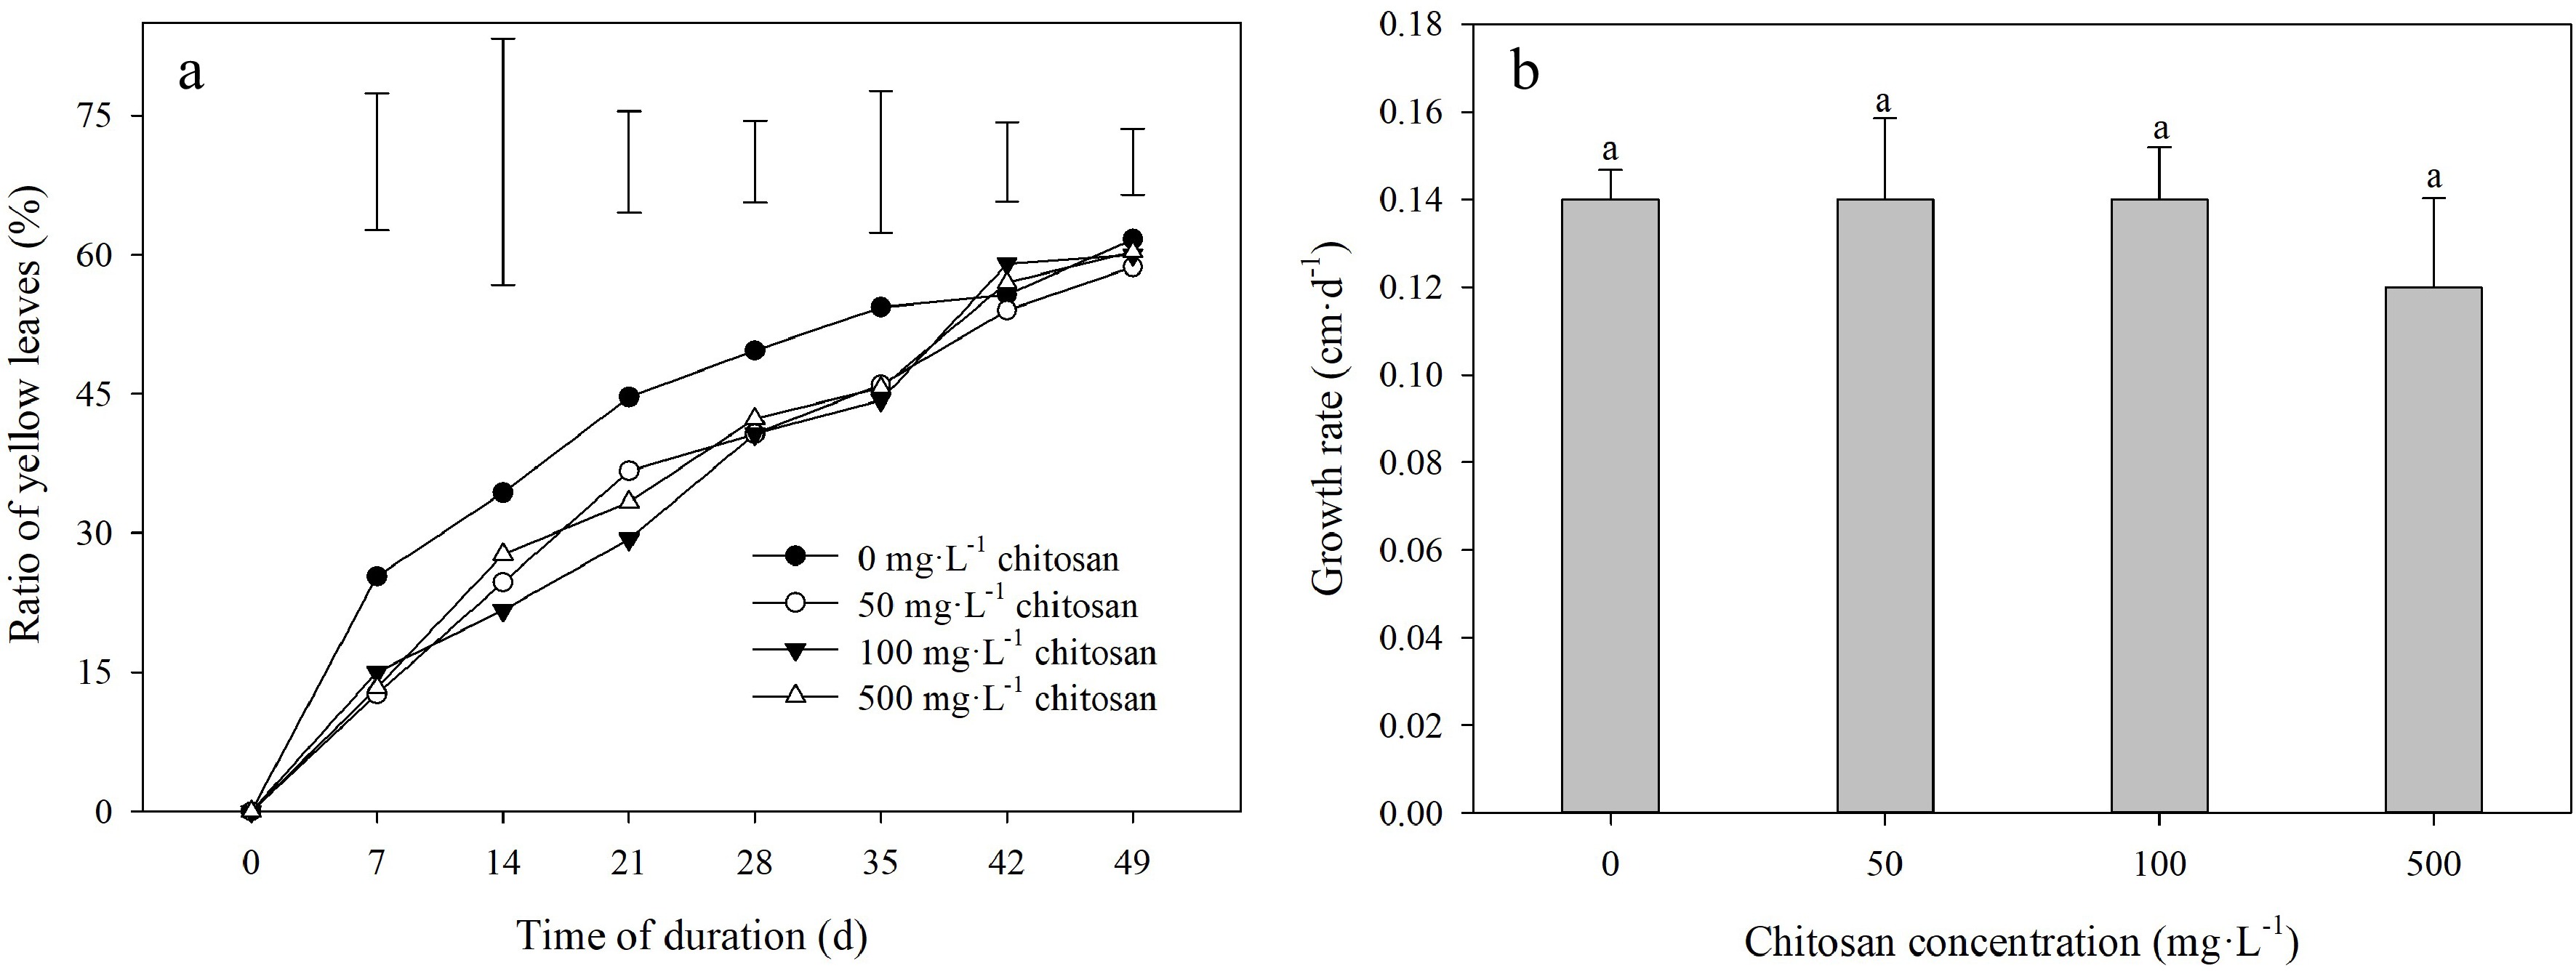
Figure 2.
Effects of different chitosan concentrations on (a) ratio of yellow leaves and (b) growth rate in creeping bentgrass under heat stress. Vertical bars indicate significant difference based on LSD values at 0.05 level for the comparison among treatments. Different lowercase letters represent significant difference between different treatments during the experimental period (P < 0.05). Error bars represent standard error (SE).
-
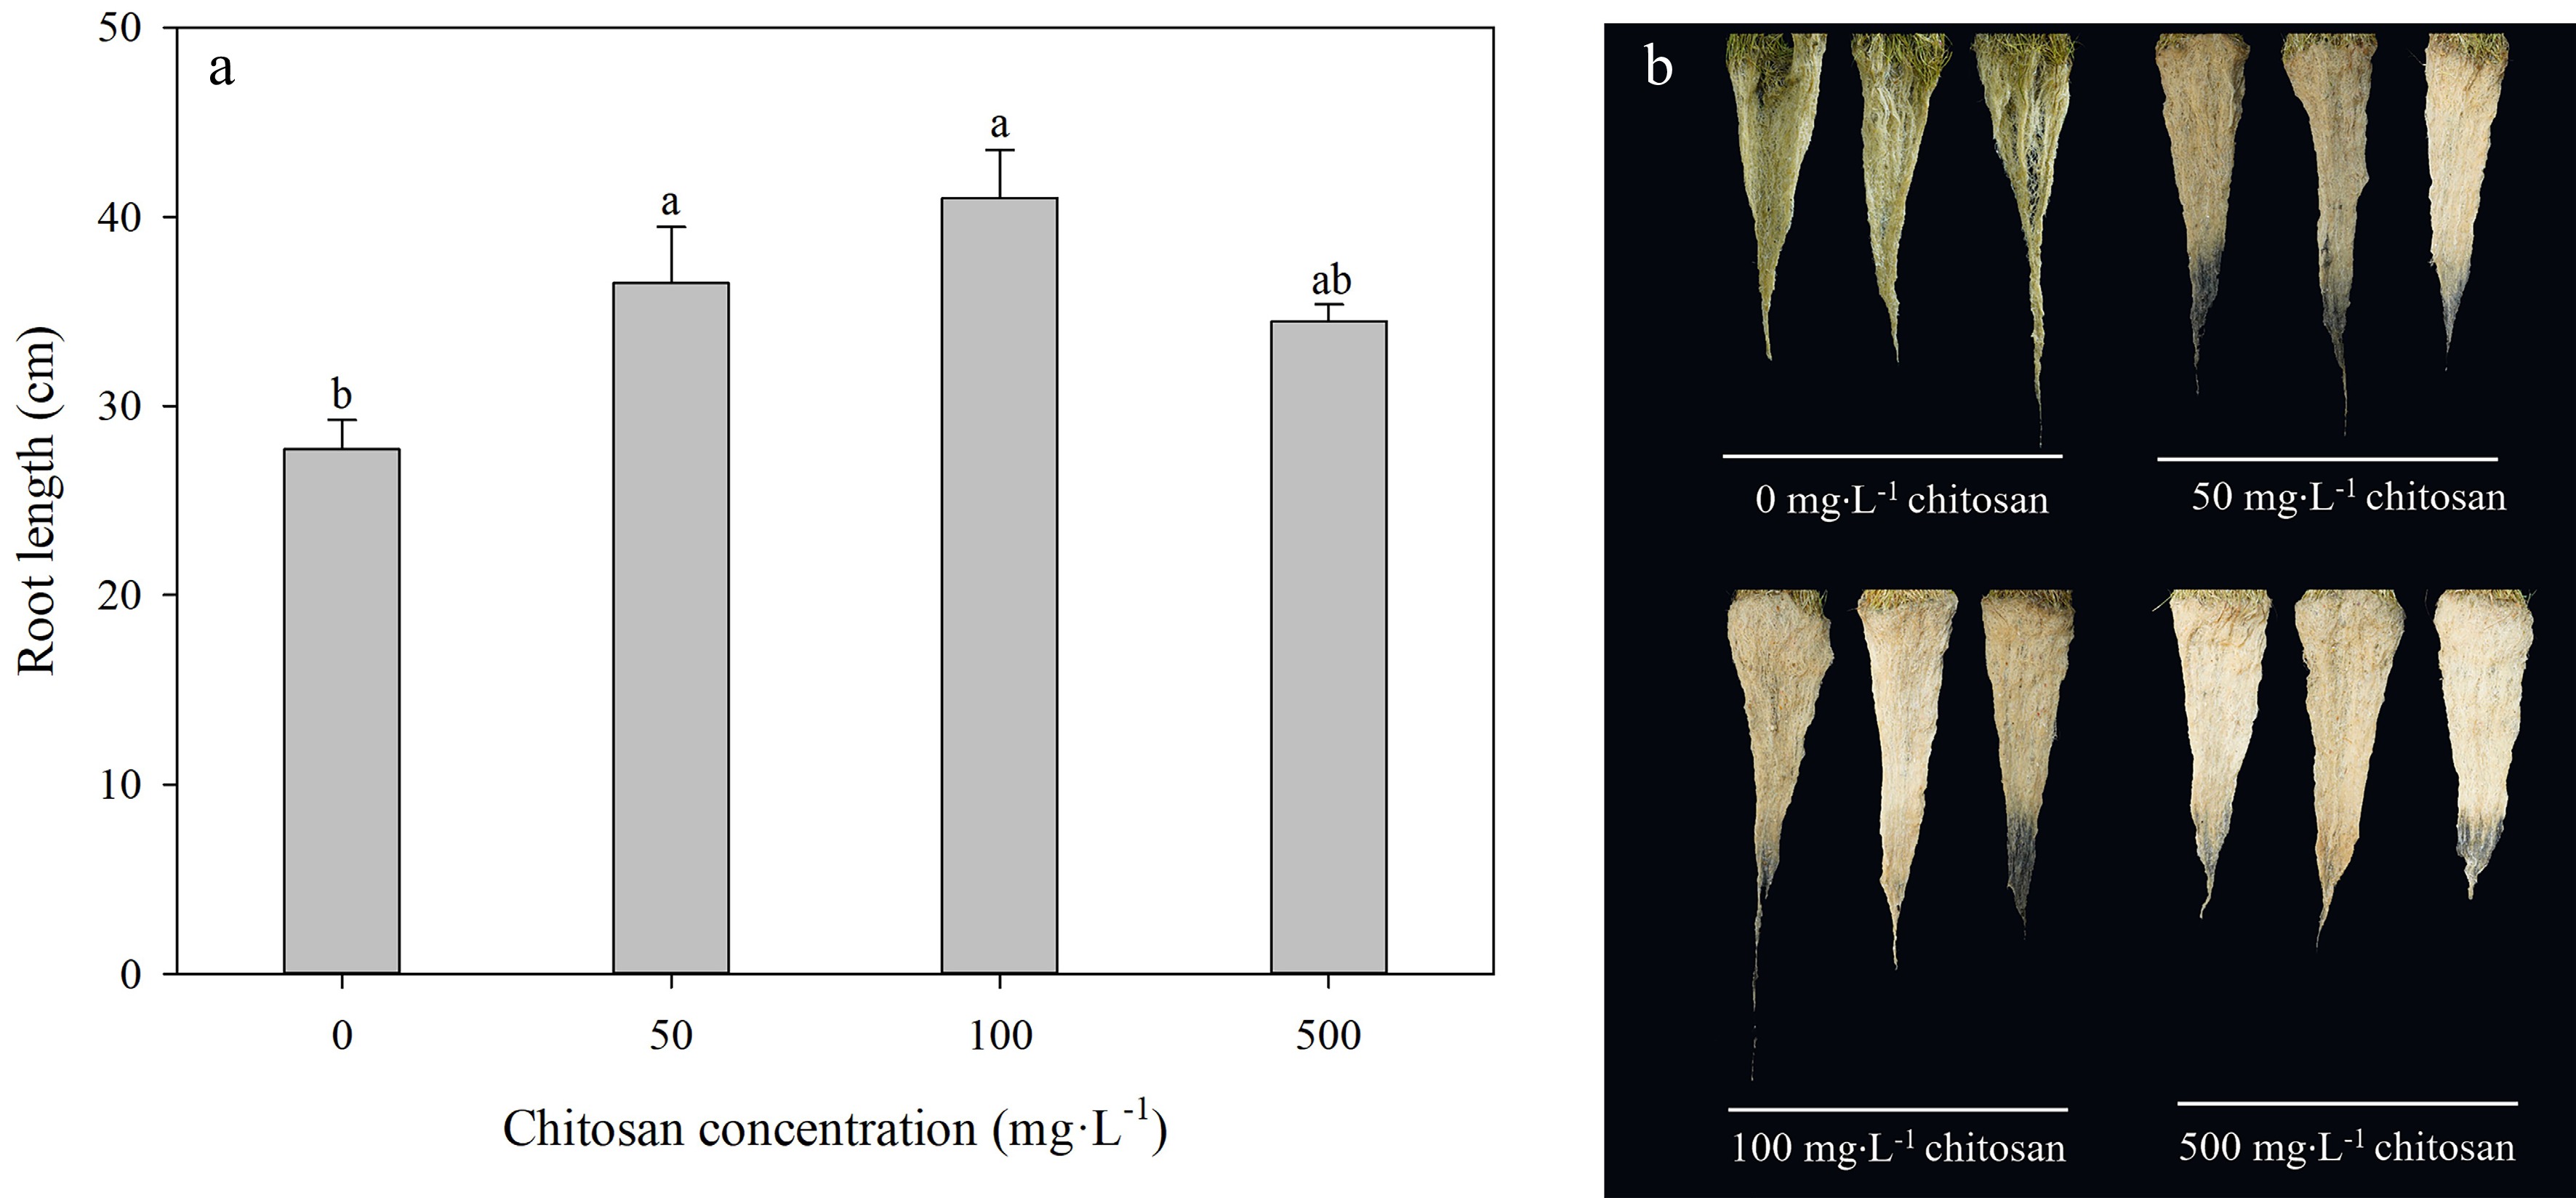
Figure 3.
Effects of different chitosan concentrations on (a) root length and (b) root phenotypes in creeping bentgrass under heat stress. Different lowercase letters represent significant difference between different treatments during the experimental period (P < 0.05). Error bars represent standard error (SE).
-
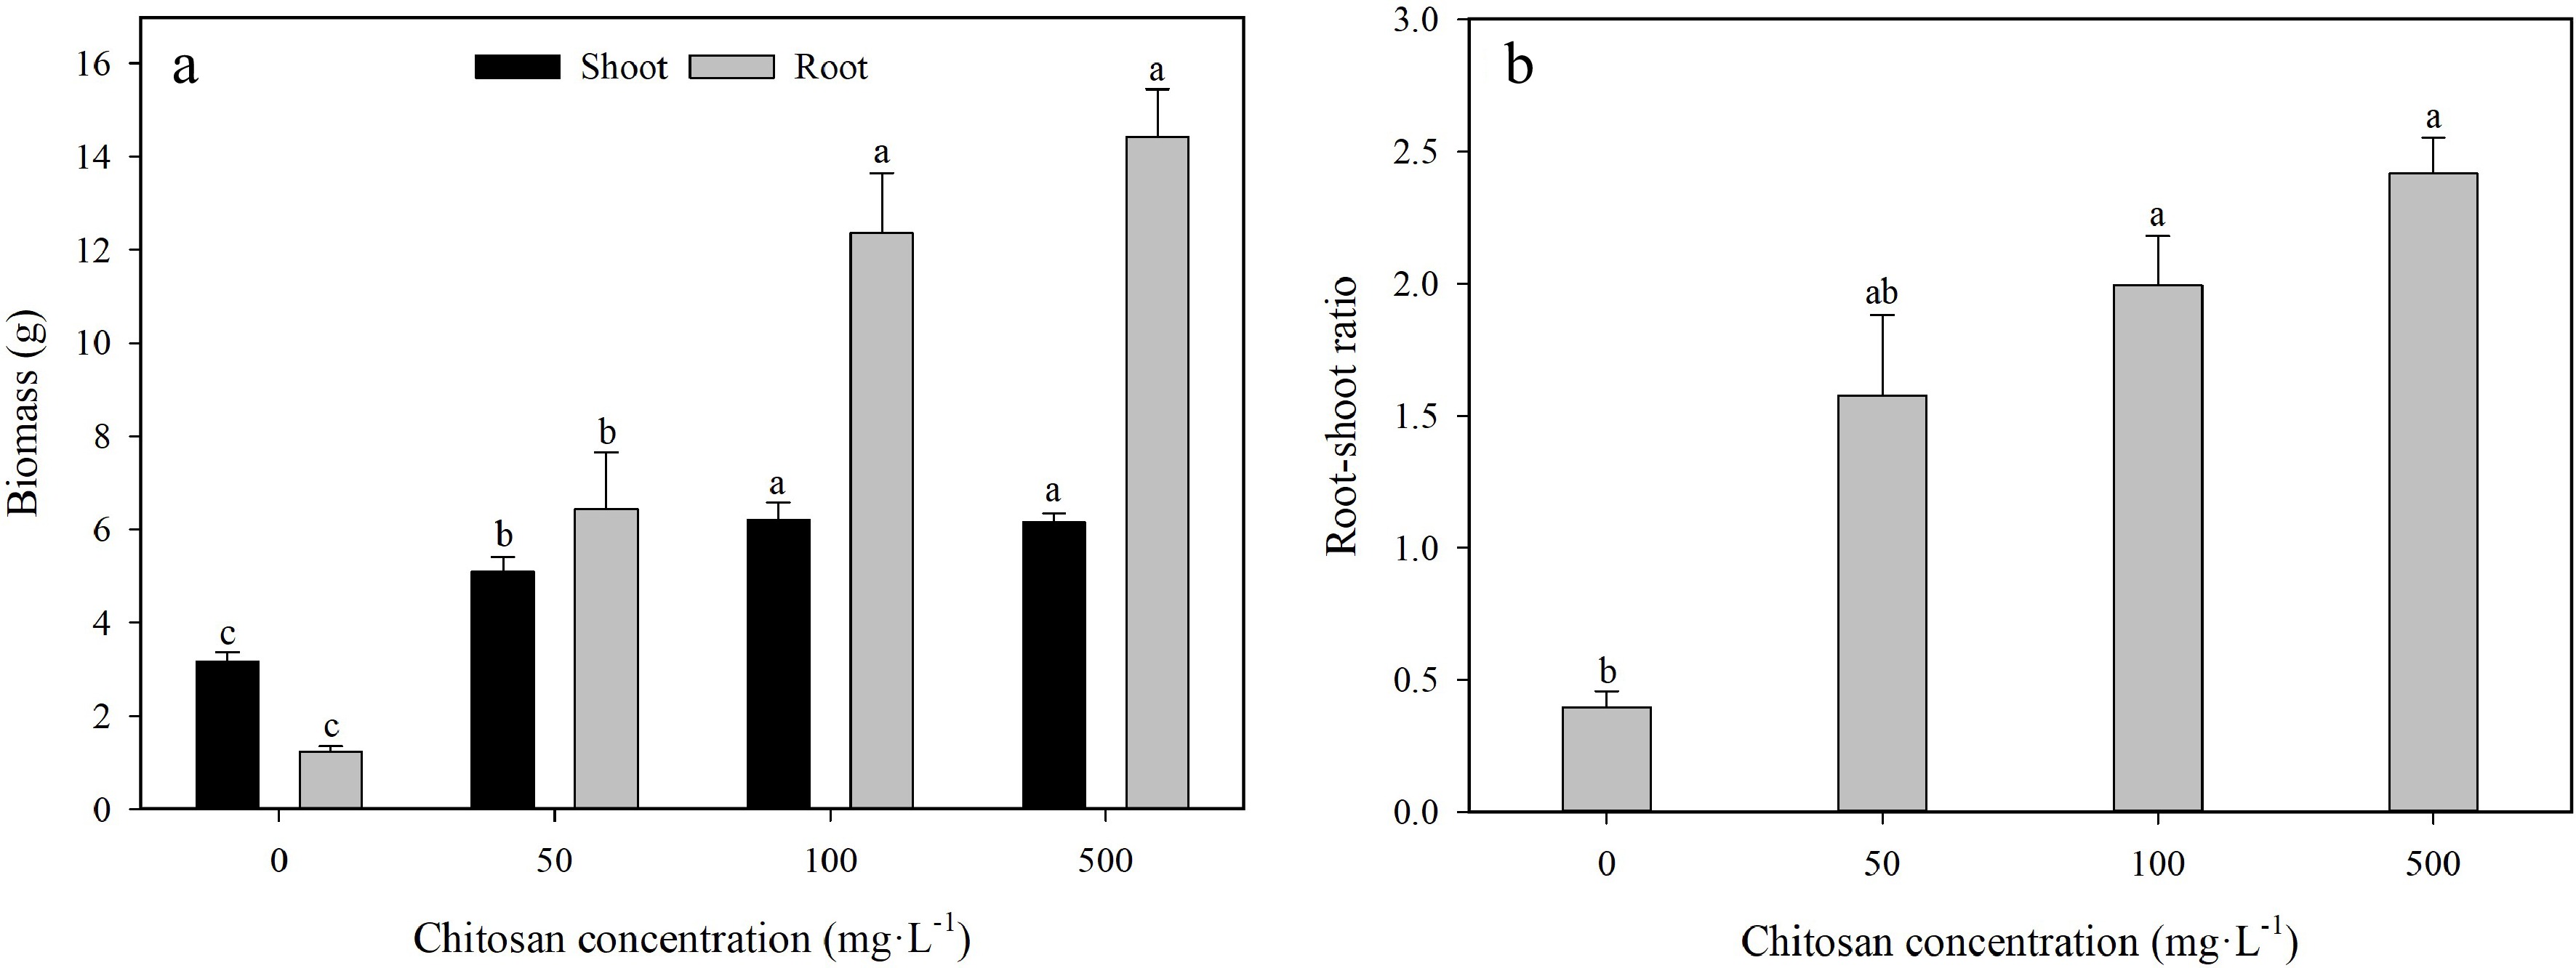
Figure 4.
Effects of different chitosan concentrations on (a) biomass and (b) root-shoot ratio in creeping bentgrass under heat stress. Different lowercase letters represent significant difference between different treatments during the experimental period (P < 0.05). Error bars represent standard error (SE).
-
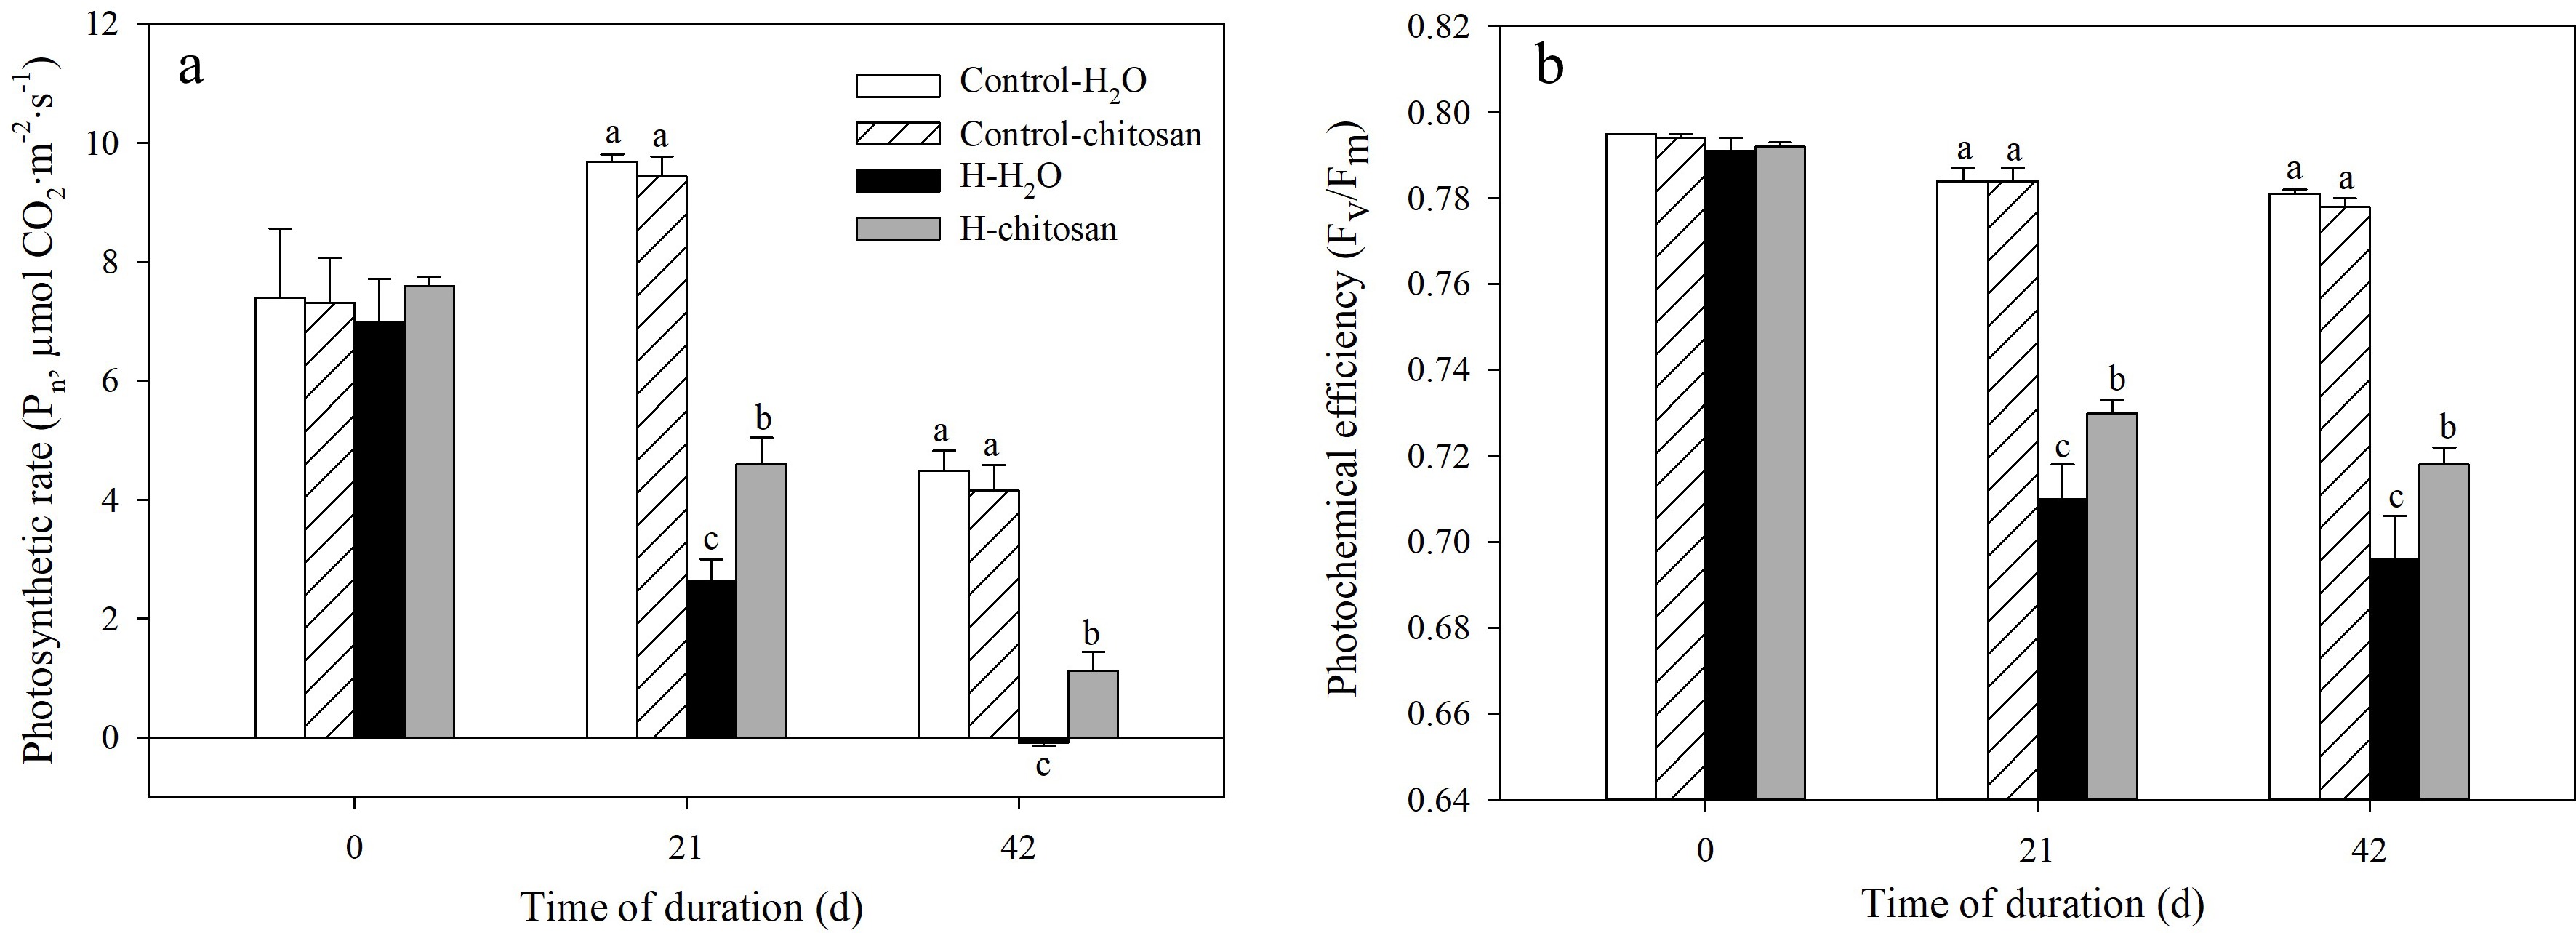
Figure 5.
Effects of chitosan on (a) photosynthetic rate and (b) photochemical efficiency in creeping bentgrass. Control + H2O, plants were sprayed with 10 mL deionized water under 25/20 °C (day/night); Control + CTS, plants were treated foliar application with 10 mL 100 mg·L−1 chitosan under non-stressed condition (25/20 °C, day/night); H + H2O, plants were sprayed with 10 mL deionized water without chitosan under heat stress (38/28 °C, day/night); H + CTS, plants were applied with exogenous chitosan (10 mL, 100 mg·L−1) under heat stress (38/28 °C, day/night). Different lowercase letters represent significant difference between different treatments during the experimental period (P < 0.05). Error bars represent standard error (SE).
-
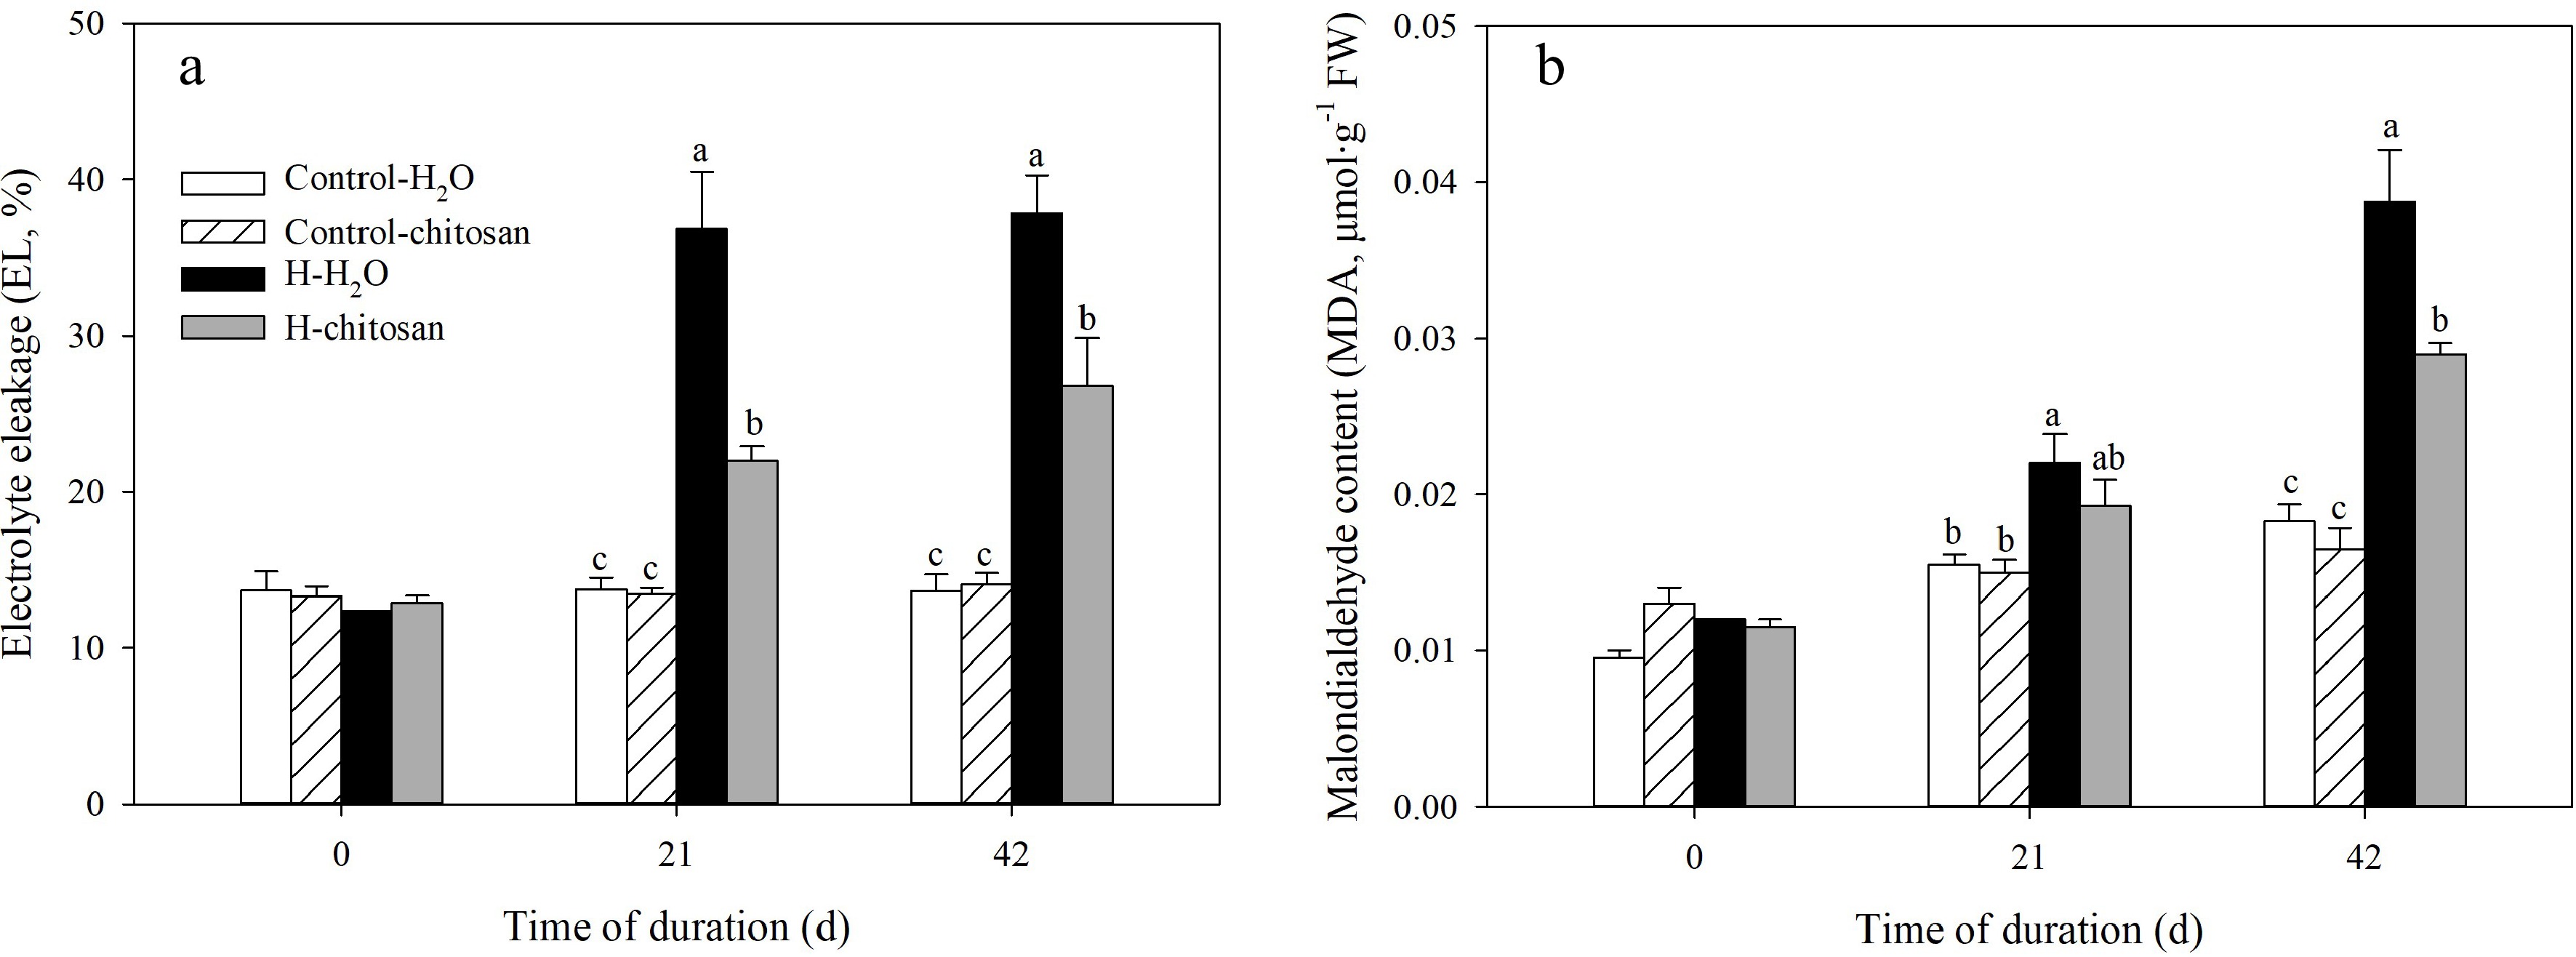
Figure 6.
Effects of chitosan on (a) electrolyte leakage and (b) malondialdehyde content in creeping bentgrass. Control + H2O, plants were sprayed with 10 mL deionized water under 25/20 °C (day/night); Control + CTS, plants were treated foliar application with 10 mL 100 mg·L−1 chitosan under non-stressed condition (25/20 °C, day/night); H + H2O, plants were sprayed with 10 mL deionized water without chitosan under heat stress (38/28 °C, day/night); H + CTS, plants were applied with exogenous chitosan (10 mL, 100 mg·L−1) under heat stress (38/28 °C, day/night). Different lowercase letters represent significant difference between different treatments during the experimental period (P < 0.05). Error bars represent standard error (SE).
Figures
(6)
Tables
(0)