-
-
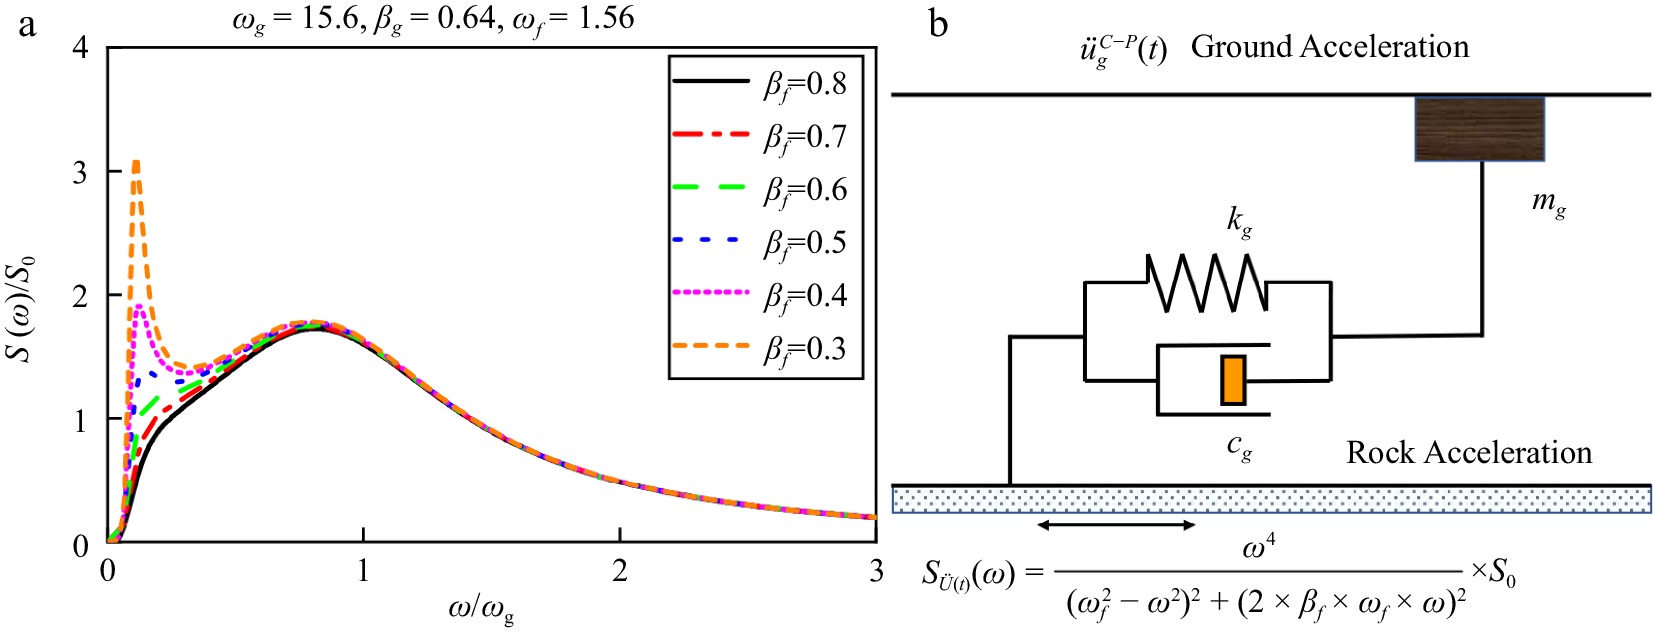
Figure 2.
Introduction of the C-P model. (a) The shape of PSD under different model parameters. (b) Interpretation of the physical mechanism.
-
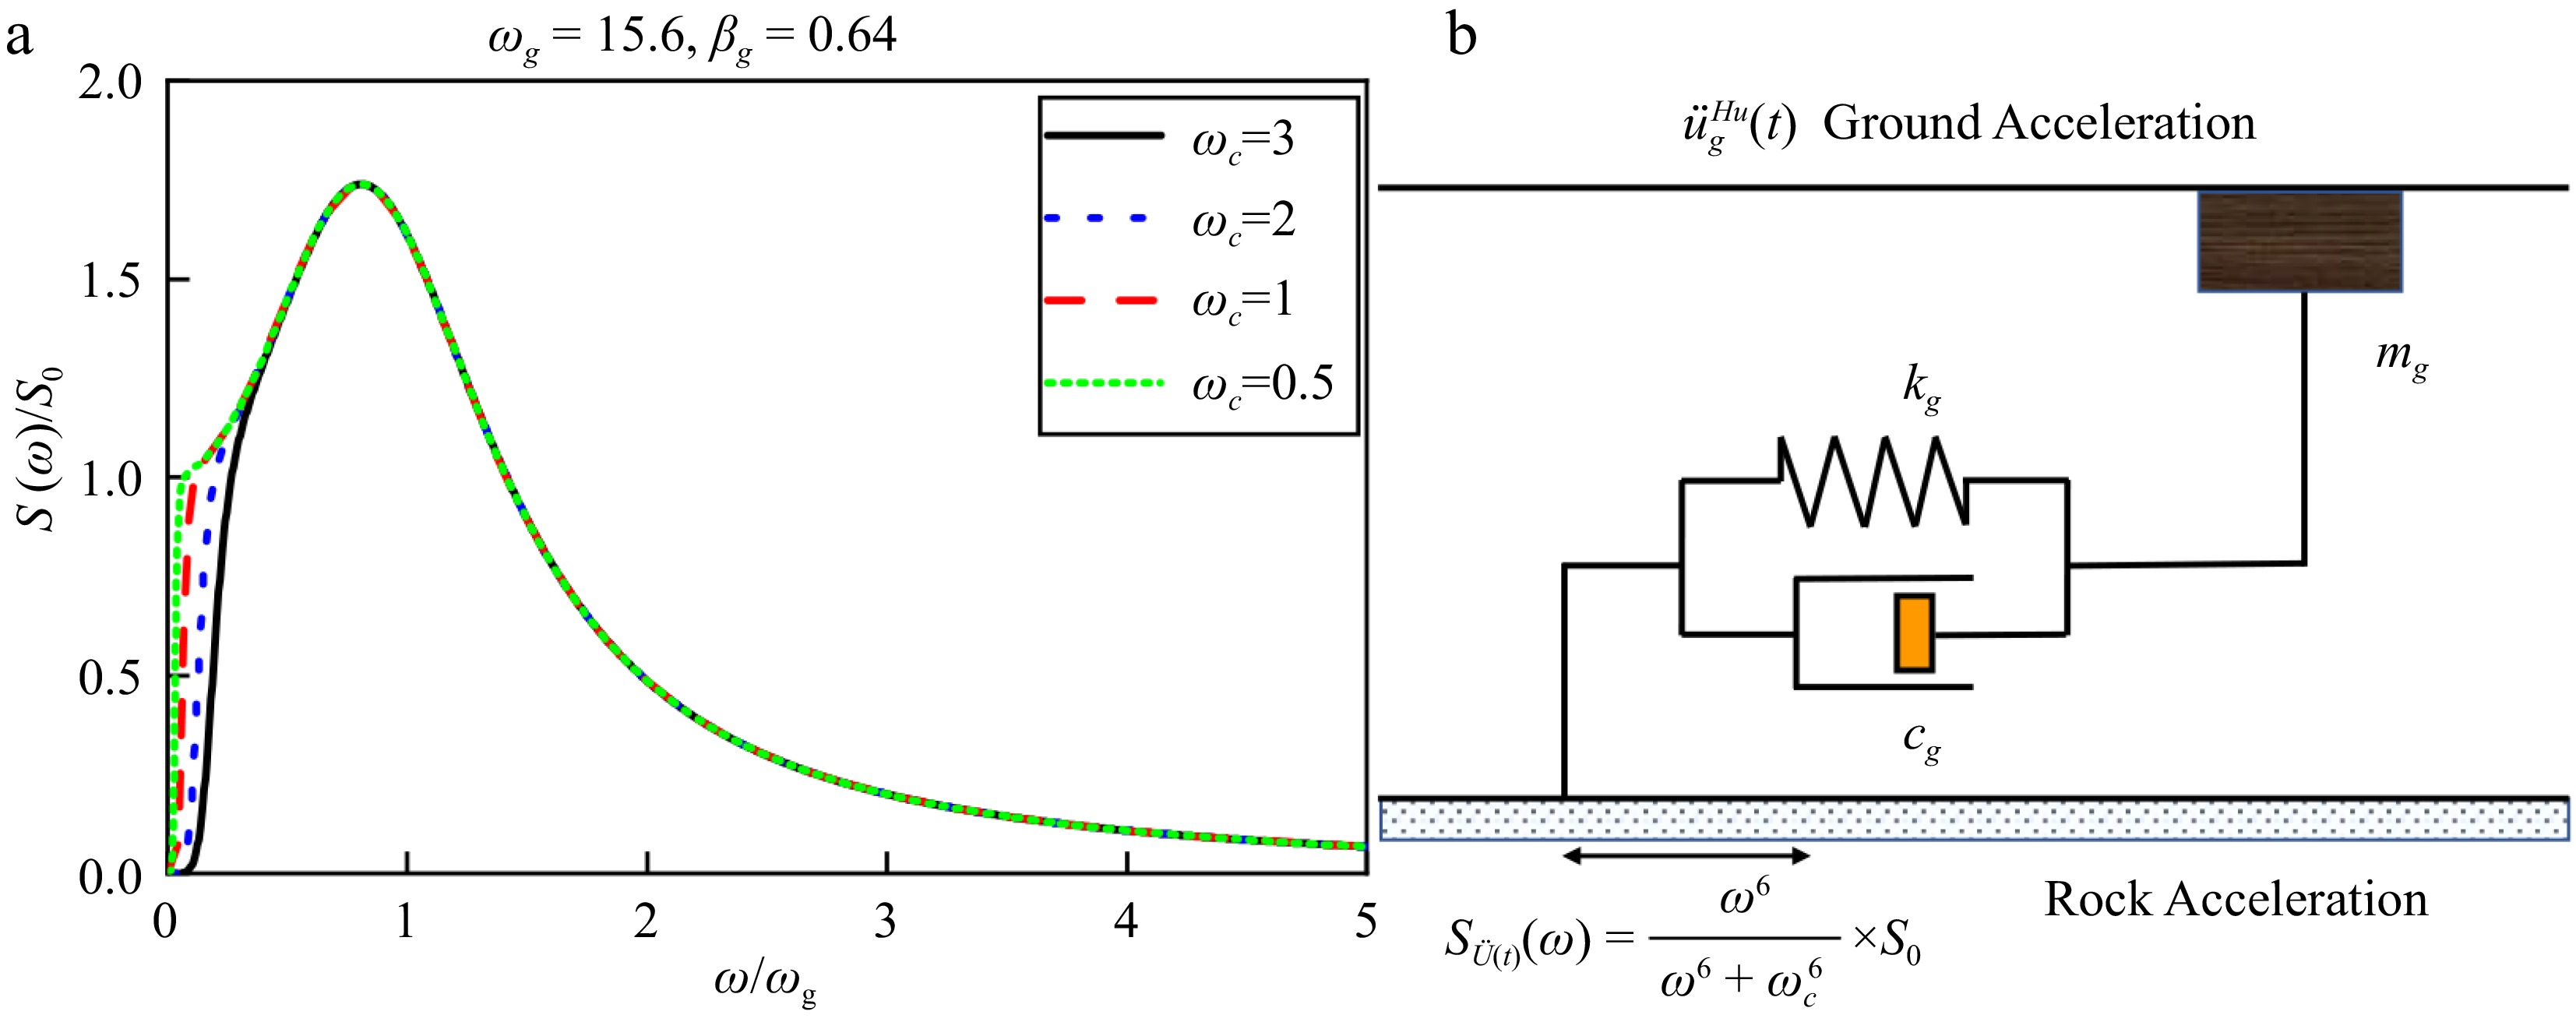
Figure 3.
Introduction of the Hu model. (a) The shape of PSD under different factors of low frequency control. (b) Physical mechanism interpretation.
-
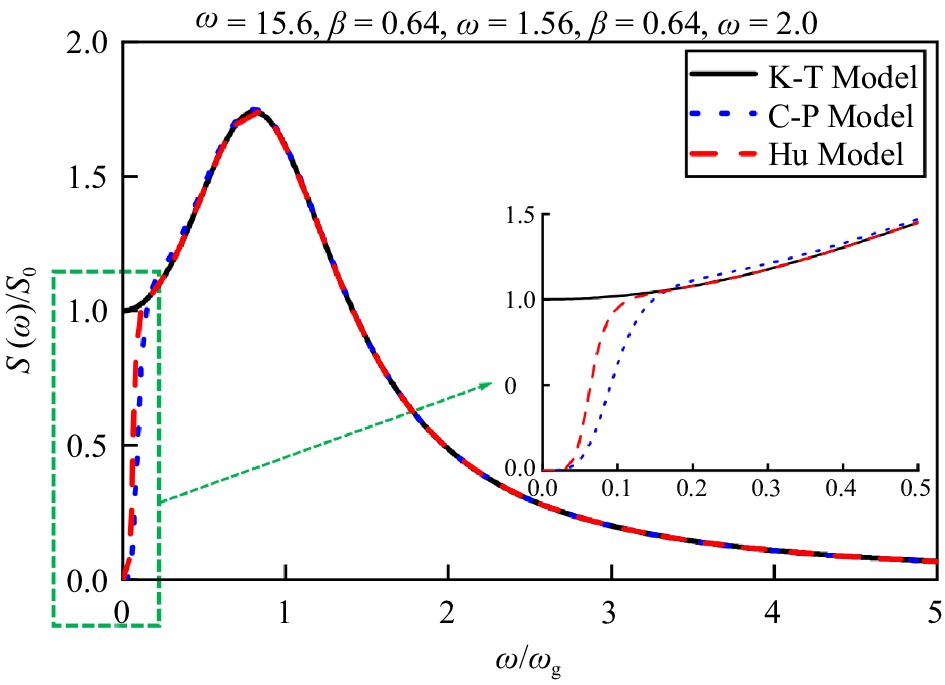
Figure 4.
Comparison of the K-T model, the C-P model and the Hu model.
-
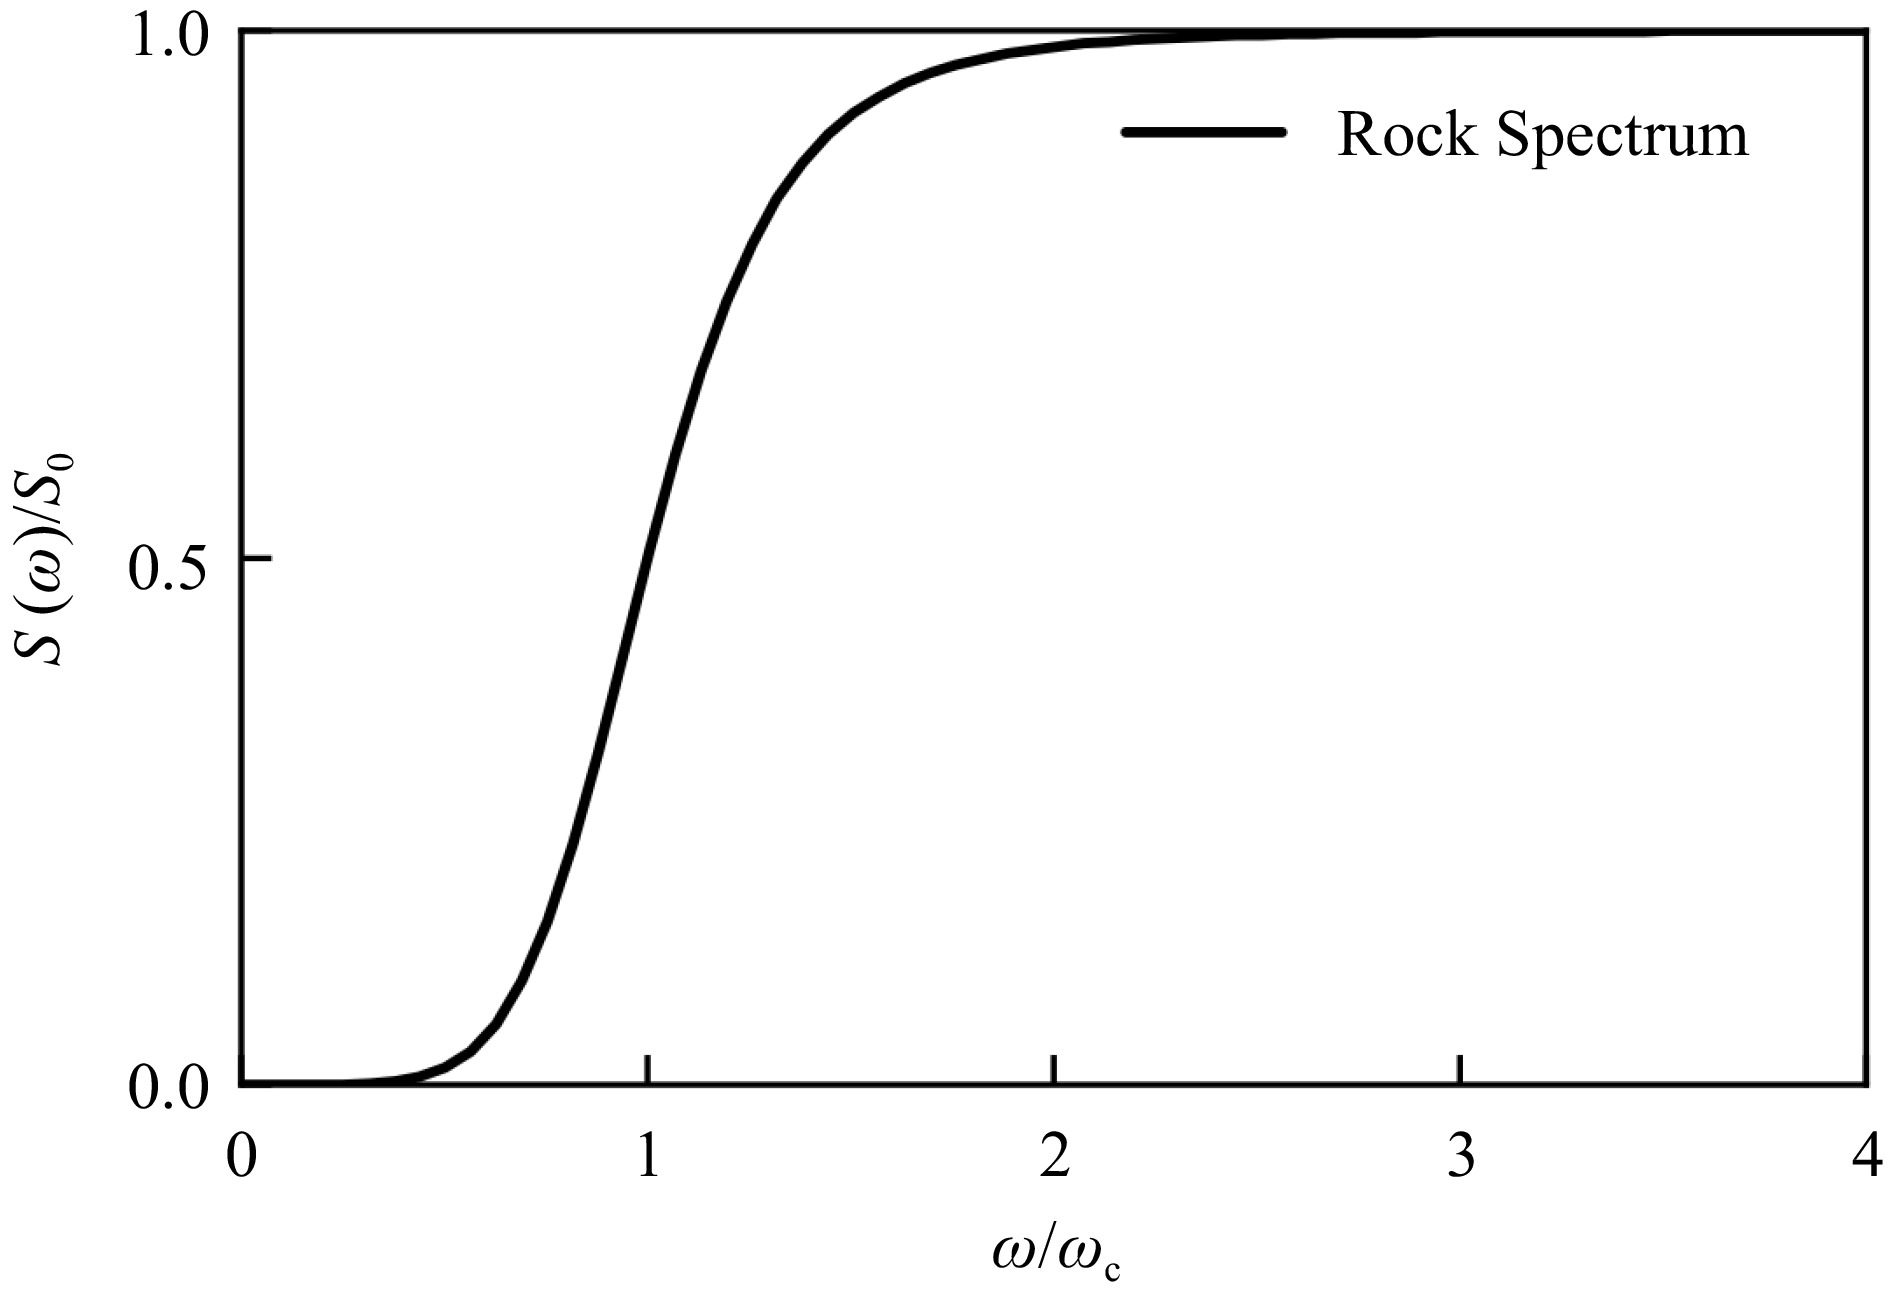
Figure 5.
The filtered white noise process on rock.
-
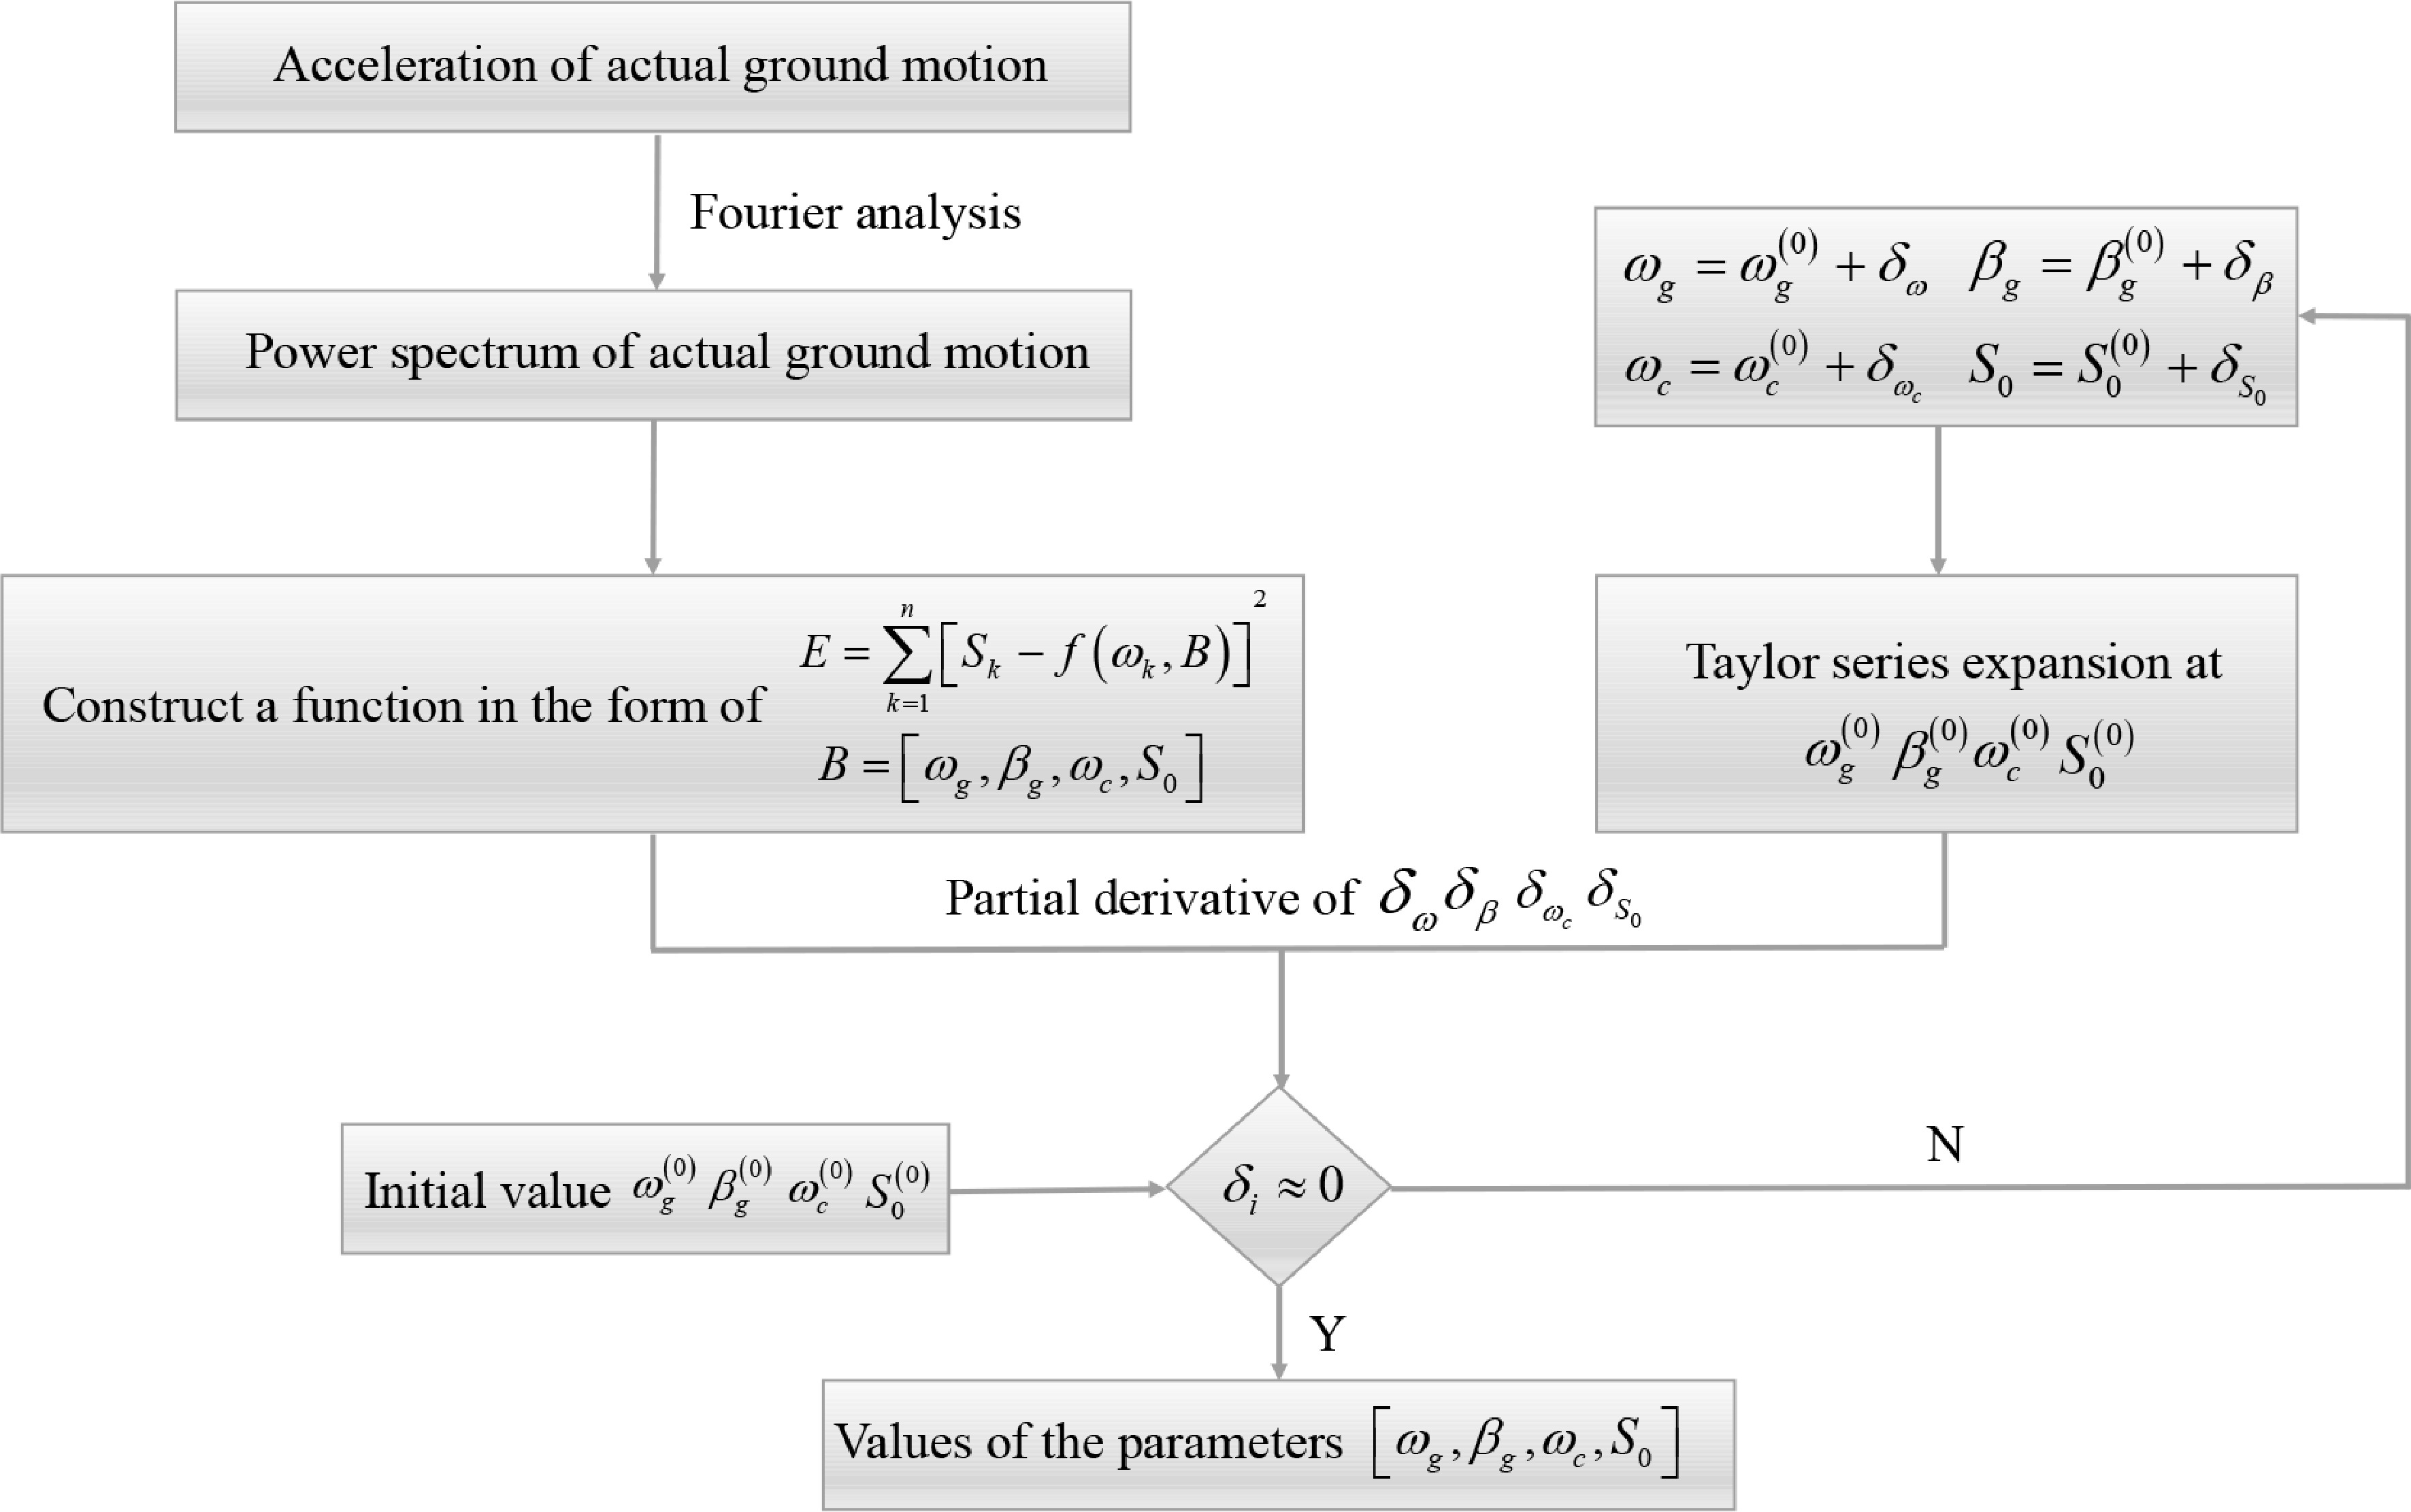
Figure 6.
The determination process of the power spectrum model parameters by the least square method.
-
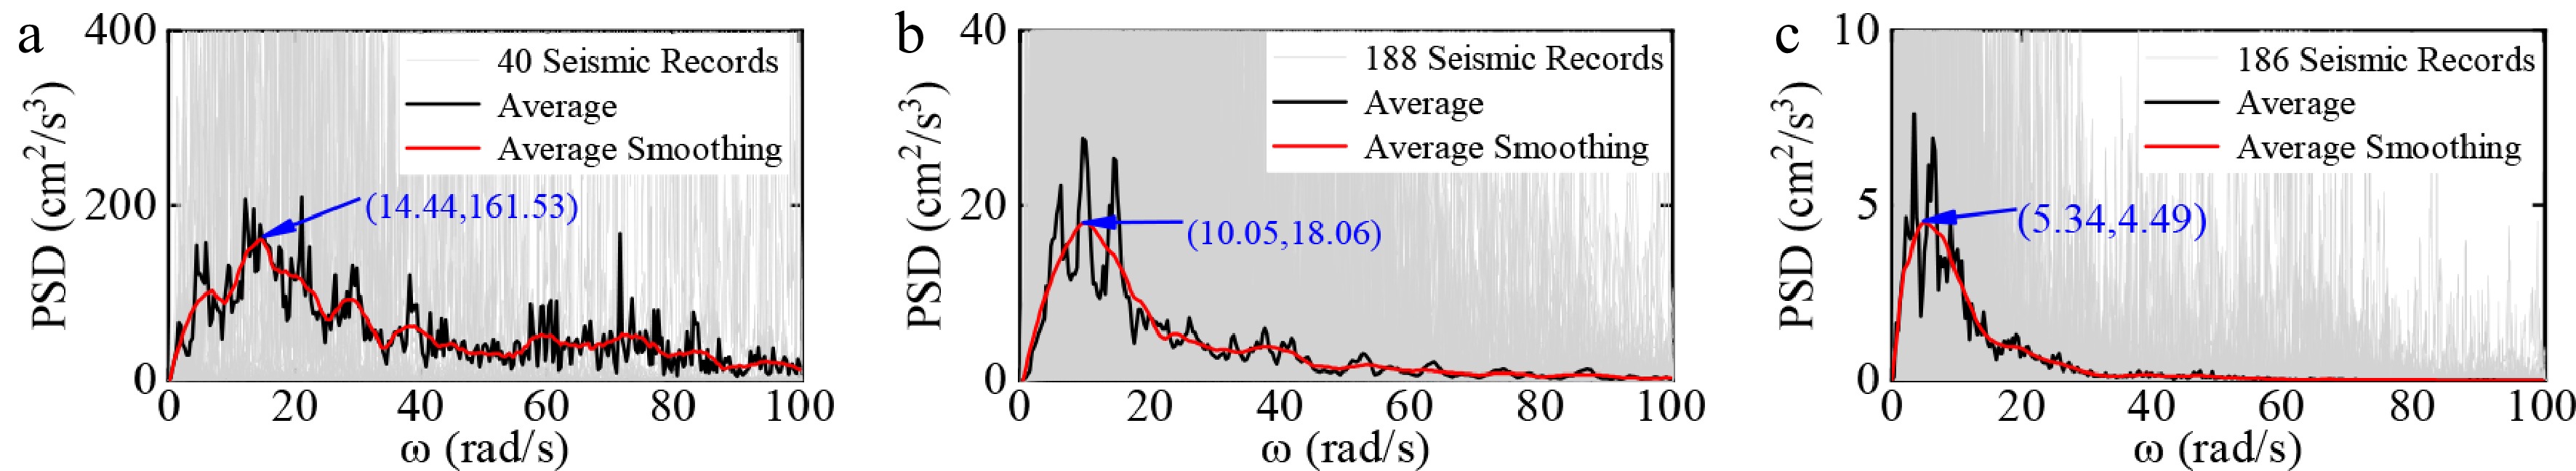
Figure 7.
PSD curves and average value of seismic records of I site, (a) NF; (b) MFF; (c) FF.
-
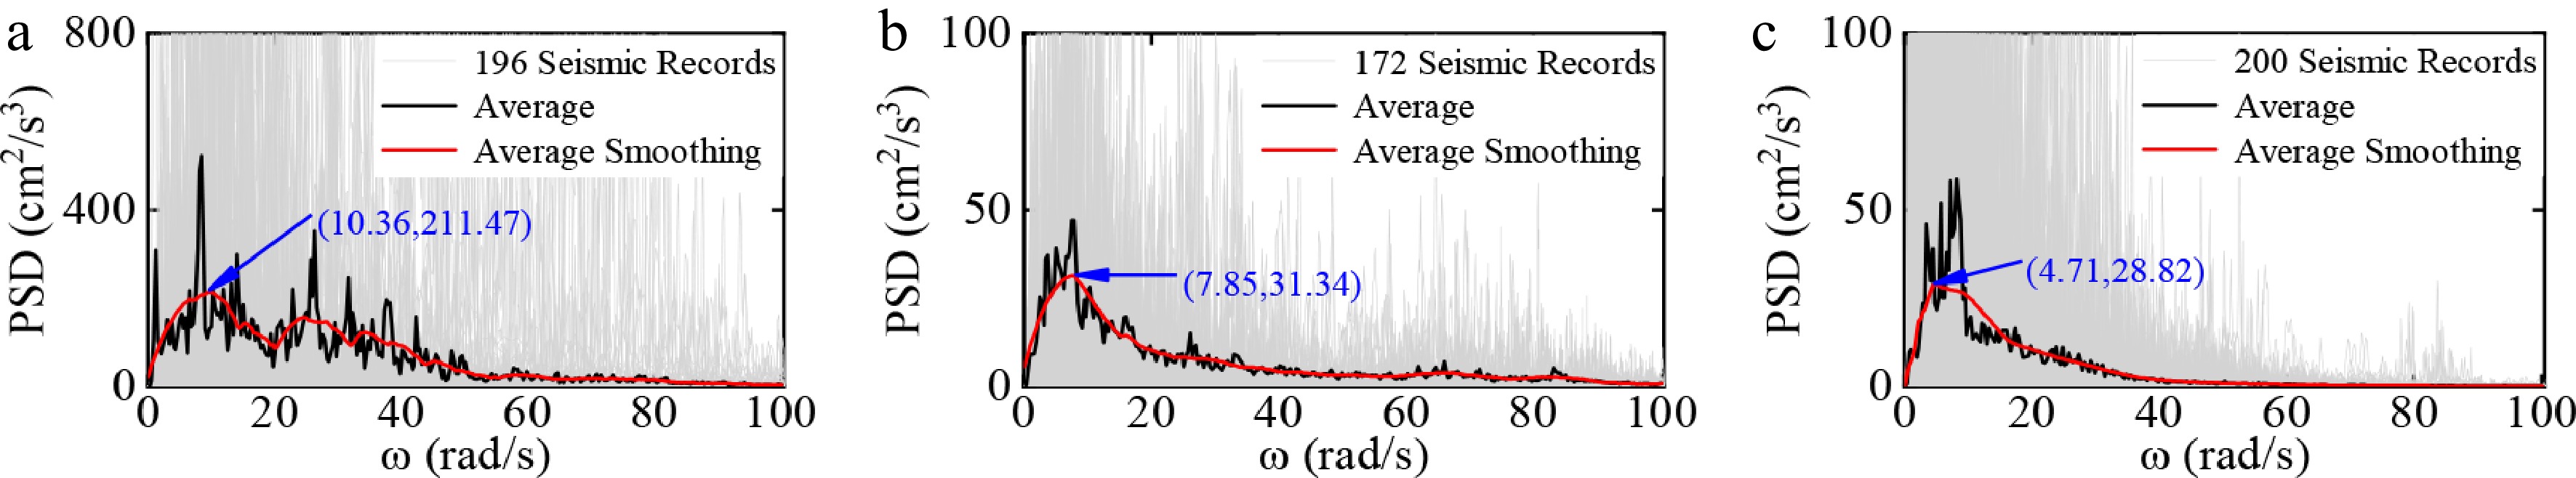
Figure 8.
PSD curves and average value of seismic records of II site, (a) NF; (b) MFF; (c) FF.
-
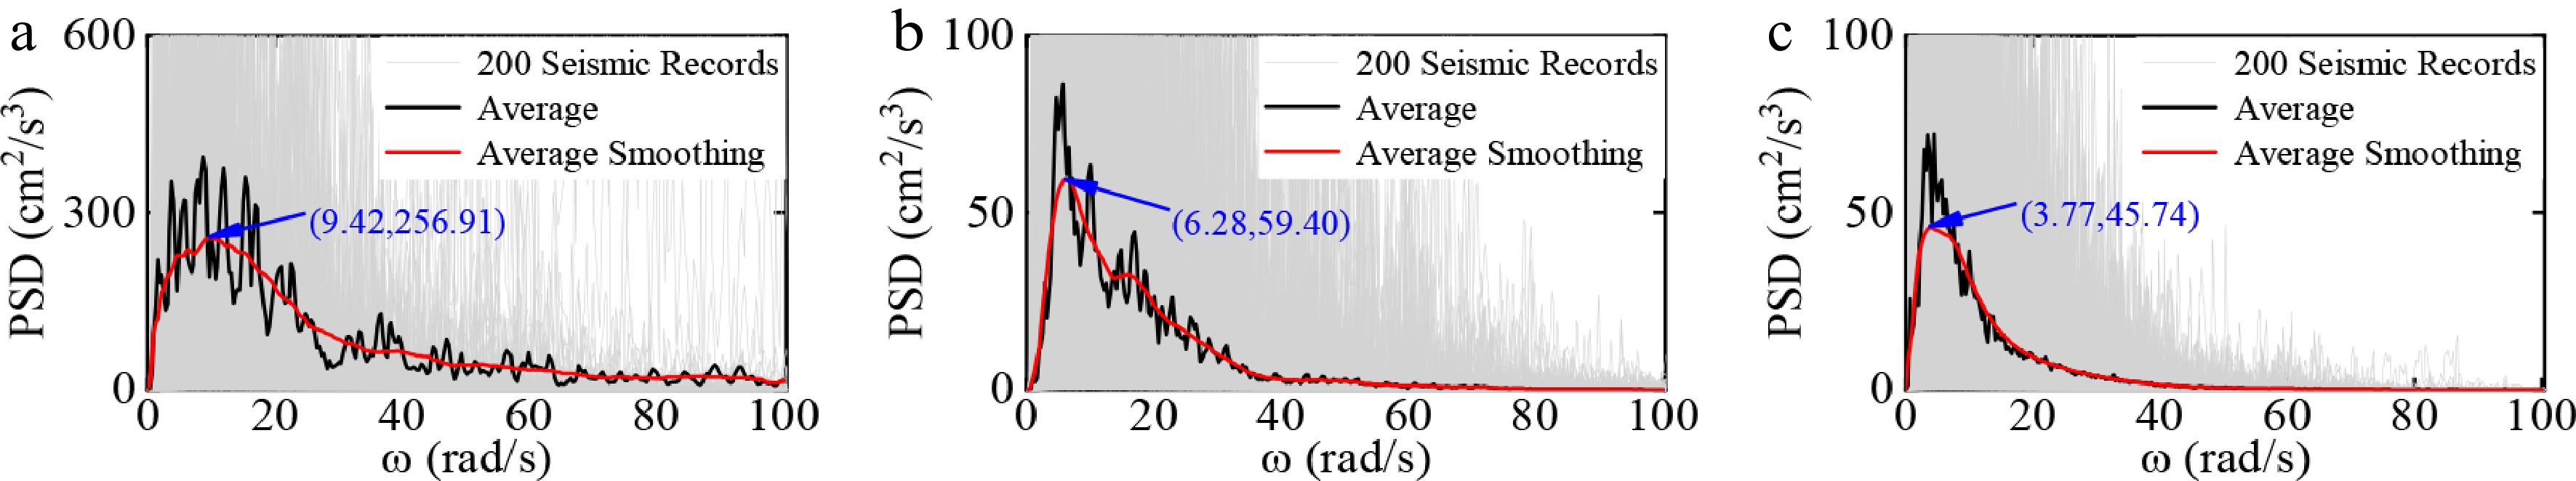
Figure 9.
PSD curves and average value of seismic records of III site, (a) NF; (b) MFF; (c) FF.
-
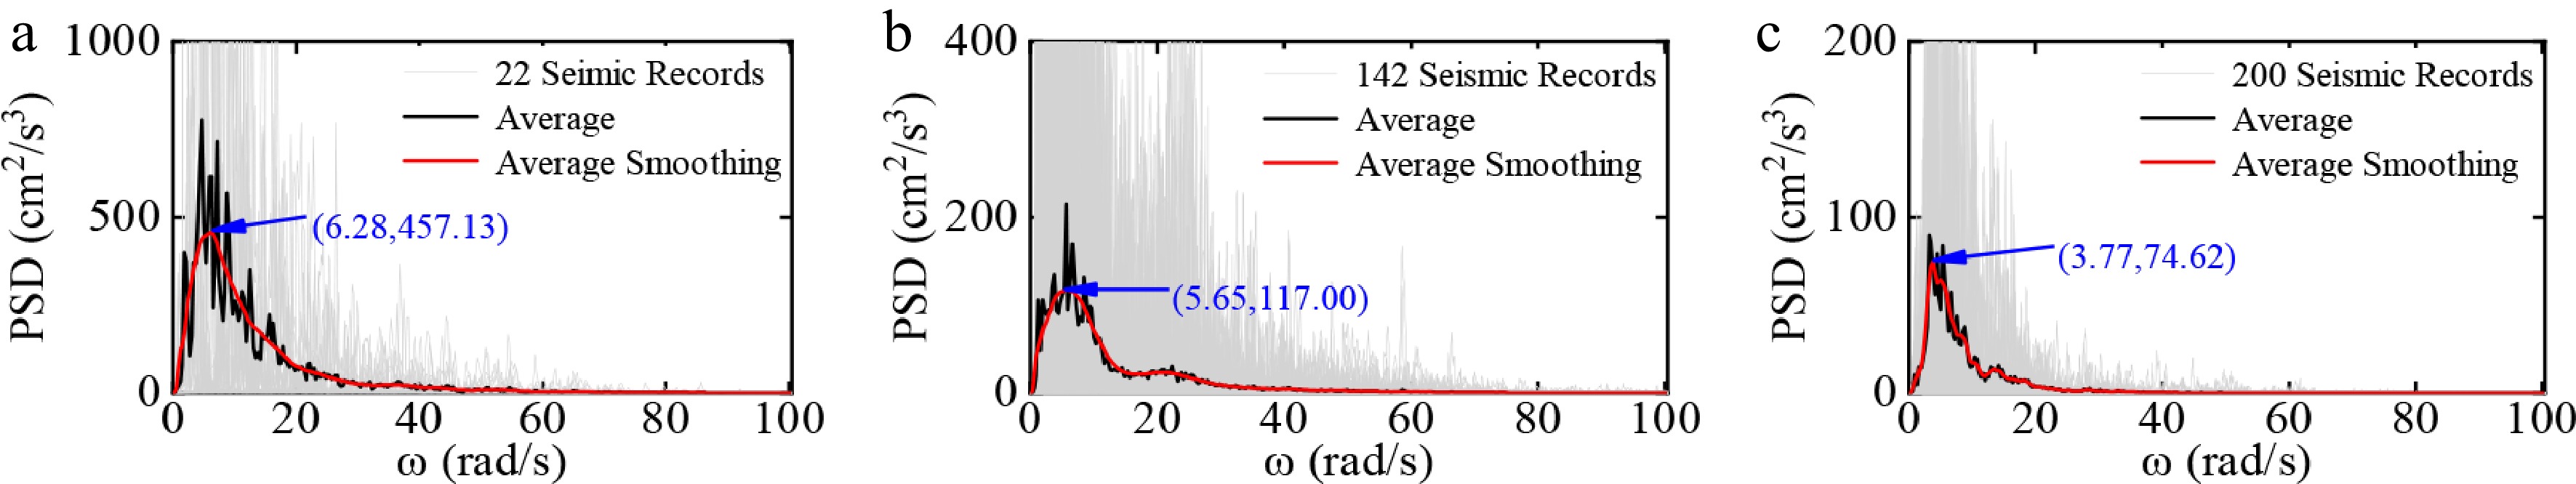
Figure 10.
PSD curves and average value of seismic records of IV site, (a) NF; (b) MFF; (c) FF.
-
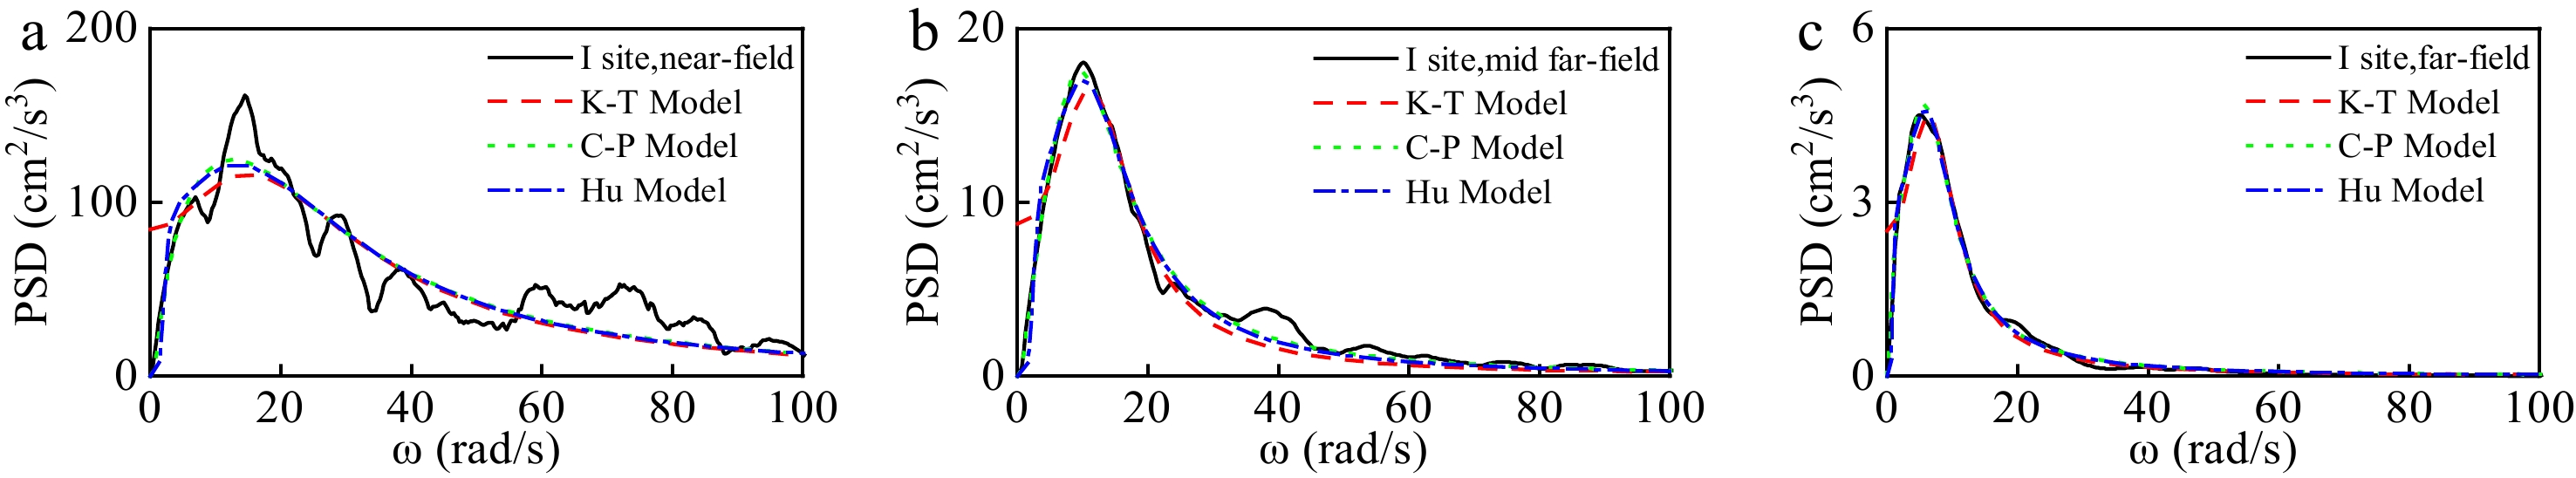
Figure 11.
Fitting results of three PSD models for I sites, (a) NF; (b) MFF; (c) FF.
-
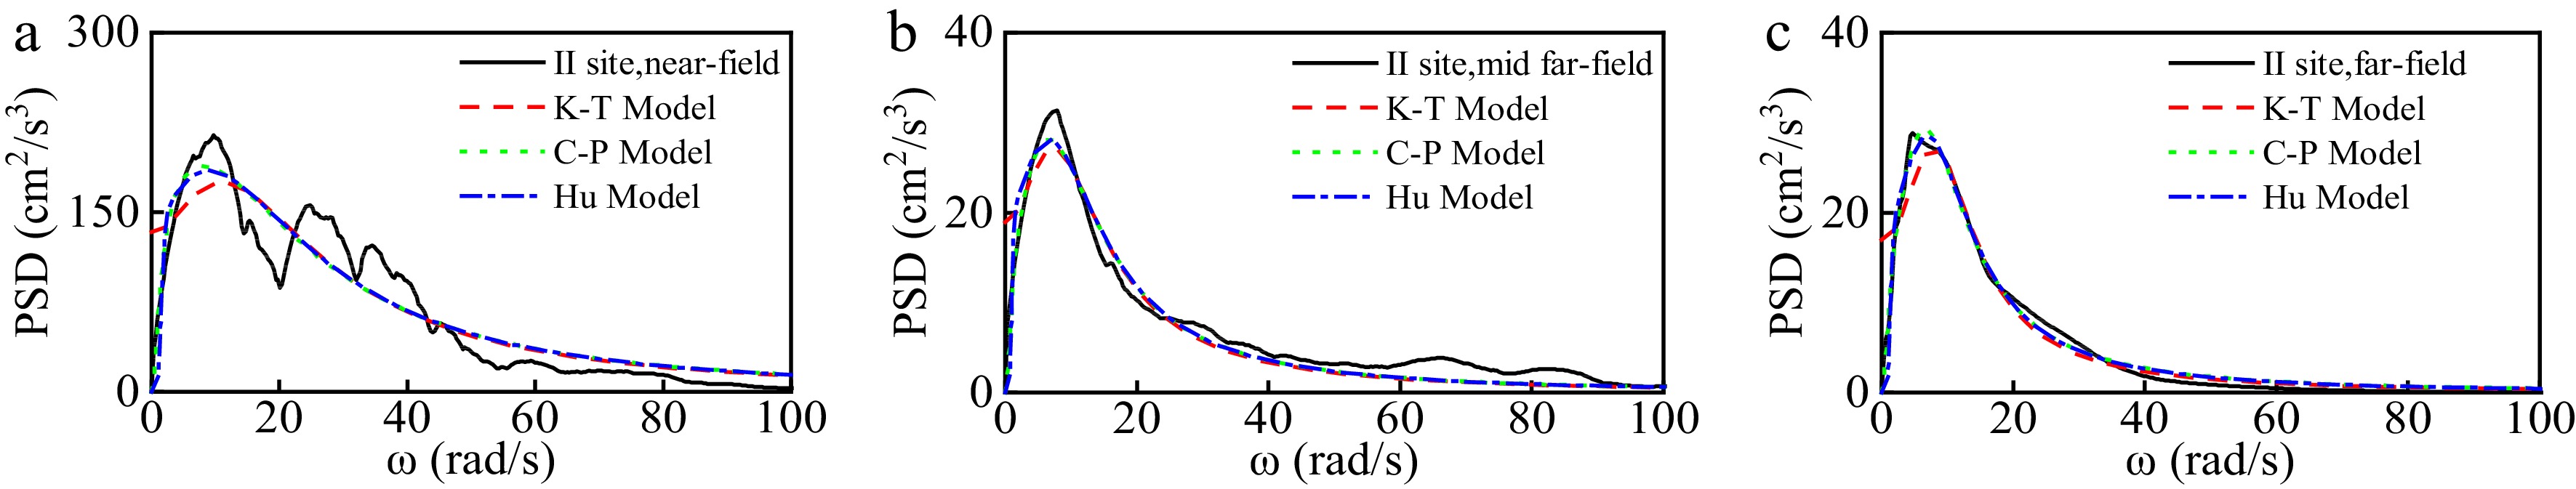
Figure 12.
Fitting results of three PSD models for II sites, (a) NF; (b) MFF; (c) FF.
-
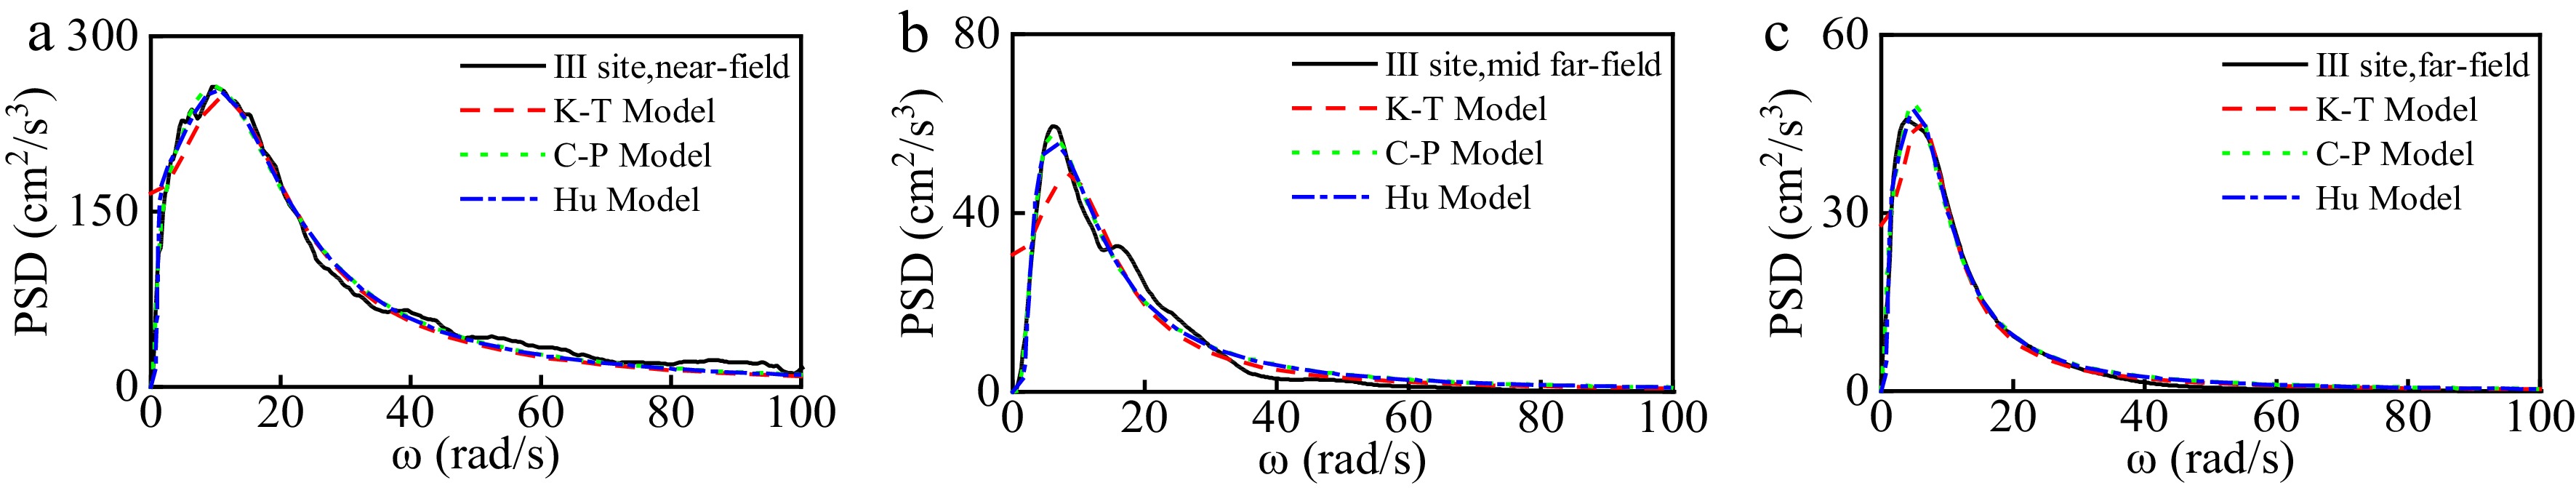
Figure 13.
Fitting results of three PSD models for III sites, (a) NF; (b) MFF; (c) FF.
-
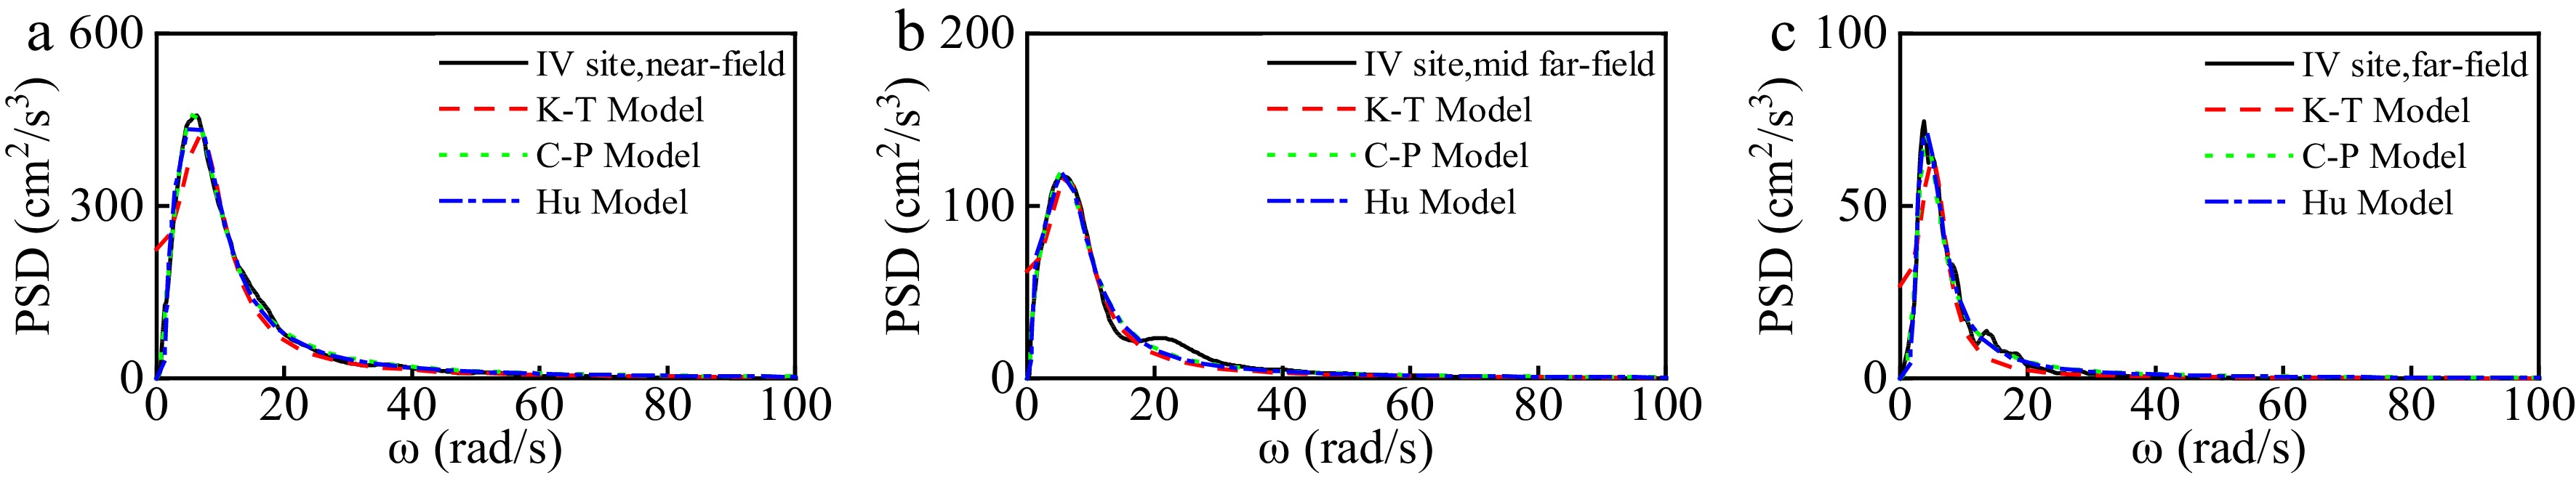
Figure 14.
Fitting results of three PSD models for IV sites, (a) NF; (b) MFF; (c) FF.
-
Site category Description VS30 (m/s) I Rock VS30 > 800 II Dense sand, gravel and very
dense soil800 ≥ VS30 > 360 III Medium dense sand, gravel
and dense soil360 ≥ VS30 > 180 IV Soft soil VS30 ≤ 180 VS30 represents the equivalent shear wave velocity within 30 m underground. Table 1.
The site classification methods used in this paper.
-
Seismic records I II III IV NF 40 196 200 22 MFF 188 172 200 142 FF 186 200 200 200 Table 2.
Number of seismic records at different sites and fault distances.
-
Seismic
recordsI II III IV NF (14.44, 161.53) (10.36, 211.47) (9.42, 256.91) (6.28, 457.13) MFF (10.05, 18.06) (7.85, 31.34) (6.28, 59.40) (5.65, 117.00) FF (5.34, 4.49) (4.71 ,28.82) (3.77, 45.74) (3.77, 74.62) The unit of ɷ is rad/s; and the unit of PSD is cm2/s3. Table 3.
Peak statistics of smoothed PSD curve at different sites and fault distances.
-
I K-T model C-P model Hu model ɷg βg S0 ɷg βg S0 ɷf βf ɷg βg S0 ɷc NF 20.65 0.94 84.49 16.87 1.11 101.30 0.18 6.72 18.92 1.02 91.84 2.14 MFF 13.44 0.58 8.76 11.52 0.72 11.90 0.22 6.34 12.64 0.67 10.09 2.43 FF 7.72 0.62 2.51 7.06 0.70 2.91 0.03 11.52 7.32 0.68 2.76 0.88 Table 4.
Parameter values of three power spectrum models for I site.
-
II K-T model C-P model Hu model ɷg βg S0 ɷg βg S0 ɷf βf ɷg βg S0 ɷc NF 15.73 1.04 133.30 11.30 1.36 162.70 0.03 22.14 13.42 1.19 148.3 1.56 MFF 9.88 0.87 18.94 8.85 0.96 21.23 0.02 27.16 9.19 0.94 20.44 0.99 FF 10.17 0.72 16.94 8.43 0.86 21.20 0.06 10.97 9.22 0.81 19.15 1.41 Table 5.
Parameter values of three power spectrum models for II site.
-
III K-T model C-P model Hu model ɷg βg S0 ɷg βg S0 ɷf βf ɷg βg S0 ɷc NF 14.66 0.81 165.70 13.10 0.91 185.90 0.40 1.41 13.78 0.87 177.10 1.02 MFF 10.90 0.73 30.64 4.87 1.25 69.50 2.48 0.95 8.44 0.93 40.46 2.54 FF 7.61 0.71 28.01 6.50 0.84 33.85 0.06 6.30 6.91 0.80 31.59 0.97 Table 6.
Parameter values of three power spectrum models for III site.
-
IV K-T model C-P model Hu model ɷg βg S0 ɷg βg S0 ɷf βf ɷg βg S0 ɷc NF 8.30 0.59 225.6 6.84 0.73 321.20 0.67 1.56 7.60 0.68 268.30 1.71 MFF 7.55 0.58 62.17 6.94 0.68 73.74 0.50 1.10 7.22 0.65 68.79 0.90 FF 5.80 0.46 26.99 3.90 0.56 102 0.07 35.69 4.70 0.67 44.26 2.34 Table 7.
Parameter values of three power spectrum models for IV site.
Figures
(14)
Tables
(7)