-

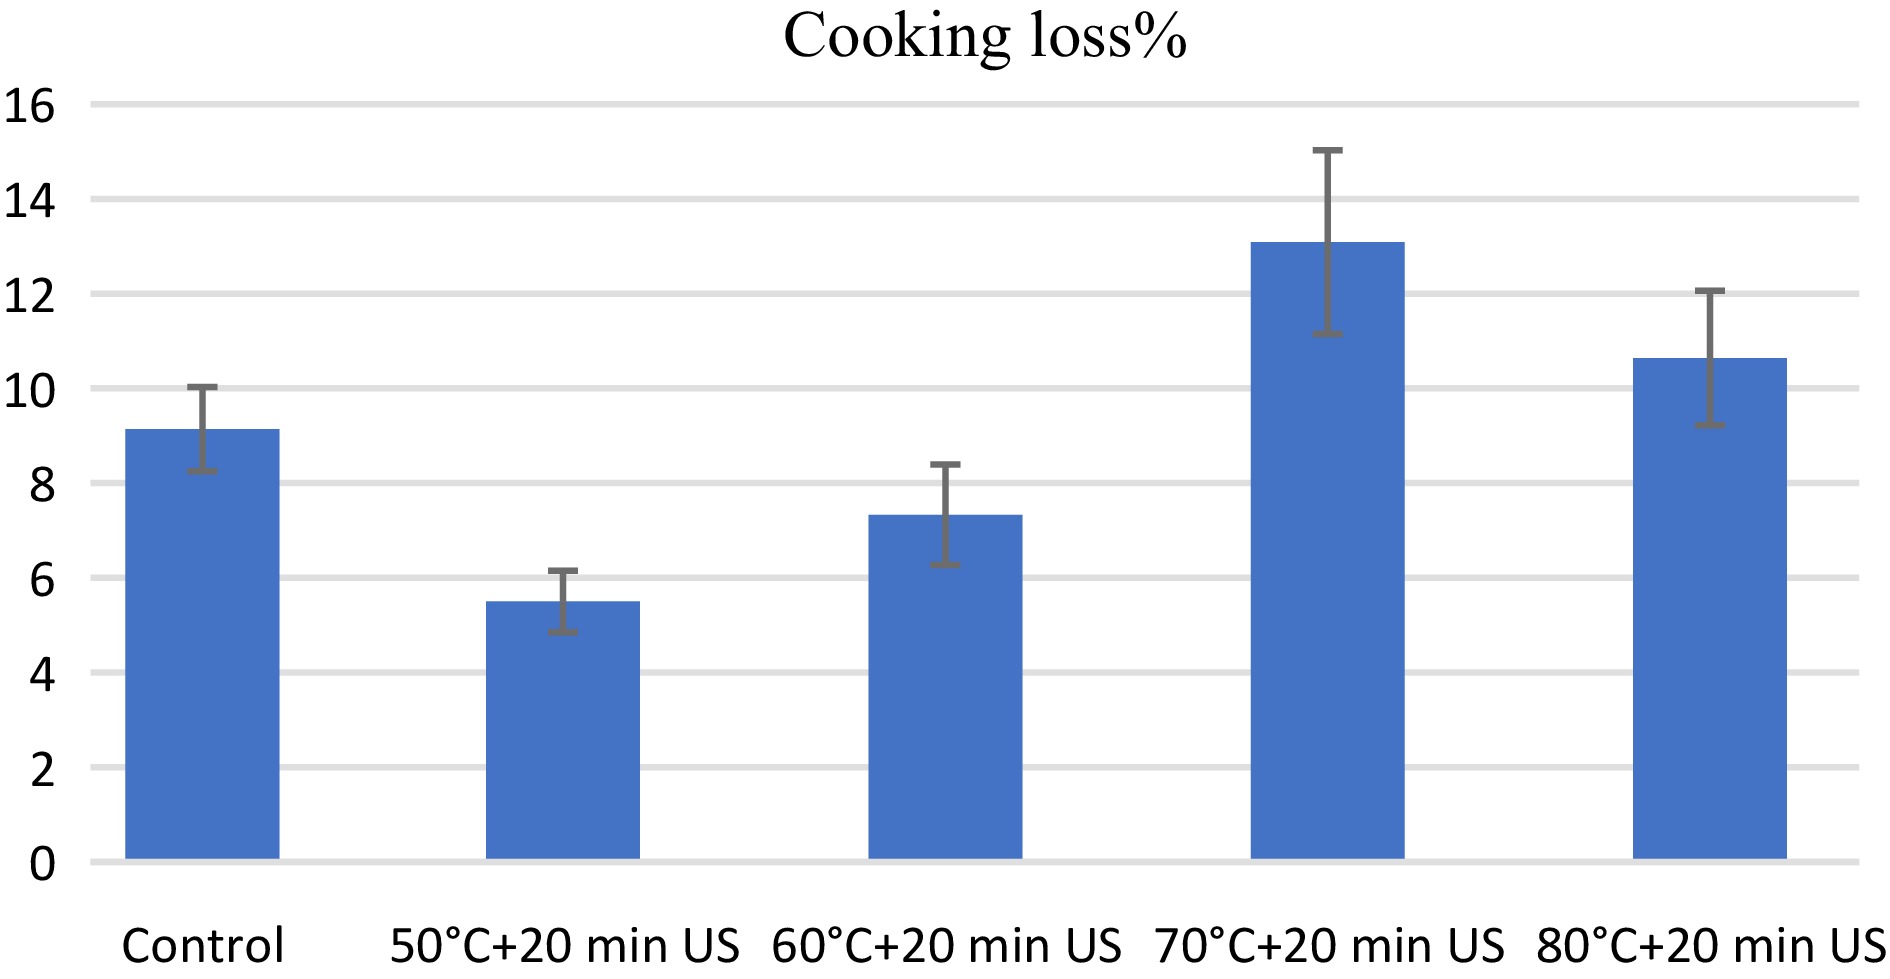
Figure 1.
Effect of ultrasound-assisted cooking on meat cooking loss.
-

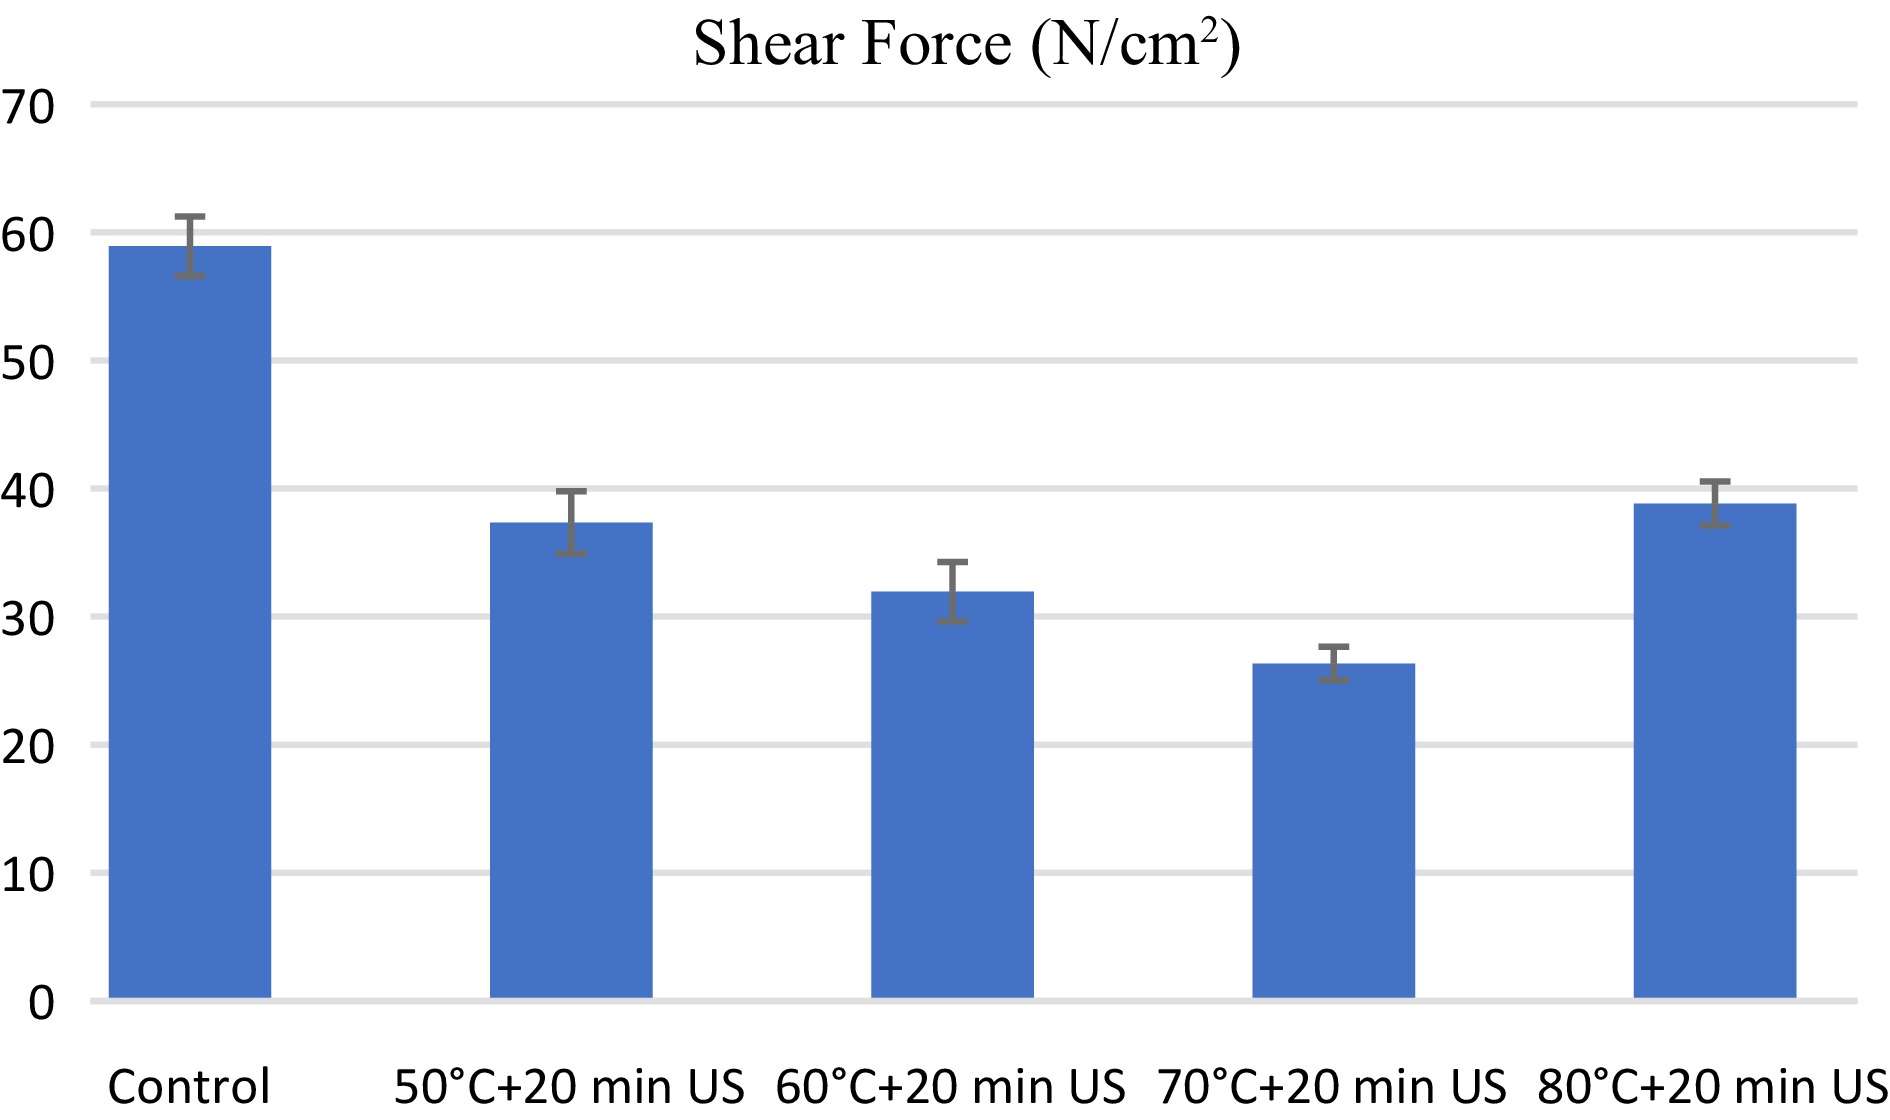
Figure 2.
Effect of ultrasound-assisted cooking on meat shear force values.
-
Cooking method Core temperature Replicate Water bath (T0) 72 °C (control group) Thermo-
sonication(T1) 50 °C
(T2) 60 °C
(T3) 70 °C
(T4) 80 °C5 × 4 × 3 = 60 Birds
5– treatments
4– birds per treatment
3– treatment repetitionTable 1.
Experimental design and treatment conditions.
-
Treatment L* a* b* pH T0 68.08 ± 0.70d 6.67 ± 0.26b 20.48 ± 1.00a 6.33 ± 0.10 T1 73.18 ± 1.24c 10.39 ± 0.61a 19.30 ± 0.40a 6.33 ± 0.10 T2 79.33 ± 0.44a 5.65 ± 0.16c 19.50 ± 0.50a 6.32 ± 0.08 T3 76.29 ± 0.85b 5.45 ± 0.22c 18.85 ± 0.45a 6.36 ± 0.10 T4 74.12 ± 0.89bc 5.19 ± 0.21c 16.82 ± 0.46b 6.17 ± 0.06 P-value < 0.0001 < 0.0001 0.0025 0.5753 Different superscripts (a, b and c) in the same column represent significant differences (P < 0.05) of mean values of this study.
T0: Control, T1: 50 °C + 20 min US, T2: 60 °C + 20 min US, T3: 70 °C + 20 min US, T4: 80 °C + 20 min US.Table 2.
Effect of ultrasound-assisted cooking on broiler meat color and pH.
-
Treatment TBARS Odor Flavor Tenderness Juiciness Overall acceptability T0 2.76 ± 0.12b 5.28 ± 0.39bc 5.72 ± 0.44b 6.67 ± 0.41a 6.17 ± 0.39ab 5.94 ± 0.42b T1 1.42 ± 0.28c 3.83 ± 0.24d 3.89 ± 0.49c 4.17 ± 0.56b 5.33 ± 0.47b 4.39 ± 0.54c T2 2.92 ± 0.66b 4.59 ± 0.50cd 3.52 ± 0.22c 4.70 ± 0.45b 4.94 ± 0.43b 3.94 ± 0.35c T3 2.94 ± 0.18b 5.89 ± 0.33b 6.05 ± 0.35b 6.50 ± 0.31a 6.67 ± 0.47a 6.06 ± 0.39b T4 4.30 ± 0.41a 7.83 ± 0.18a 7.28 ± 0.22a 7.22 ± 0.34a 6.83 ± 0.31a 7.50 ± 0.18a P-value < 0.0001 0.0000 0.0000 0.0000 0.0075 0.0000 Different superscripts (a, b and c) in the same column represent significant differences (P < 0.05) of mean values of this study.
T0: Control, T1: 50 °C + 20 min US, T2: 60 °C + 20 min US, T3: 70 °C + 20 min US, T4: 80 °C + 20 min US.Table 3.
Effect of ultrasound-assisted cooking on broiler meat oxidation and sensory characteristics.
Figures
(2)
Tables
(3)