-
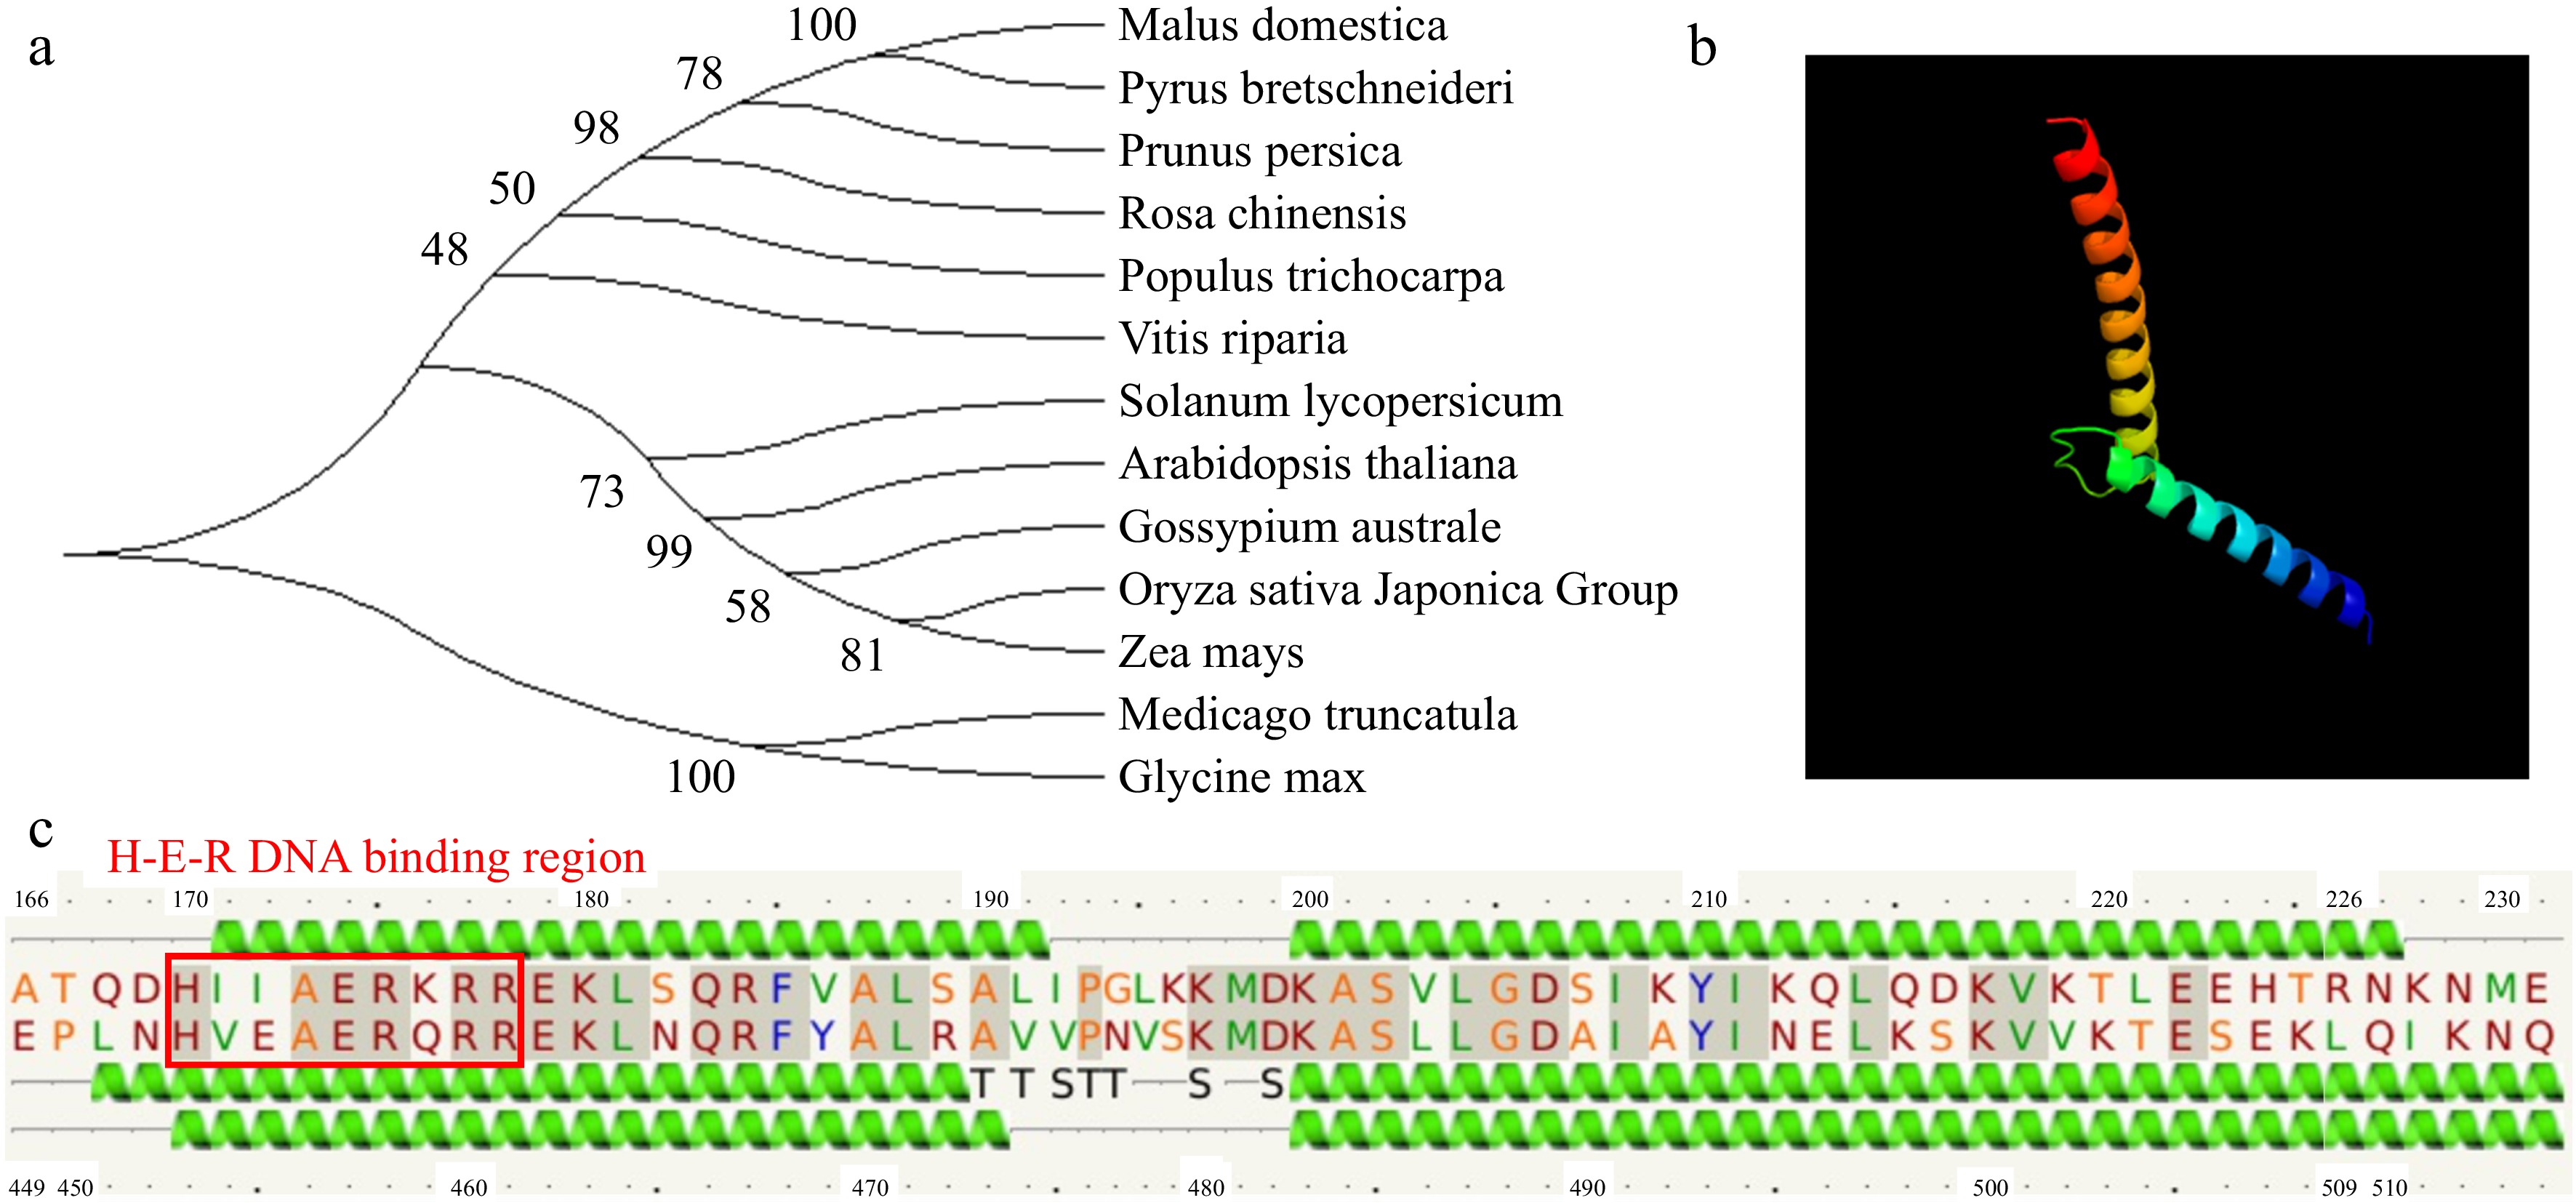
Figure 1.
Phylogenetic relationships, multiple sequence alignment, and protein structure of MdSAT1. (a) Phylogenetic tree of SAT1 sequences; the number on each branch represents the genetic distance. (b) Predicted bHLH 3D structure of MdSAT1 protein. (c) Predicted protein secondary of MdSAT1 bHLH structural domain.
-
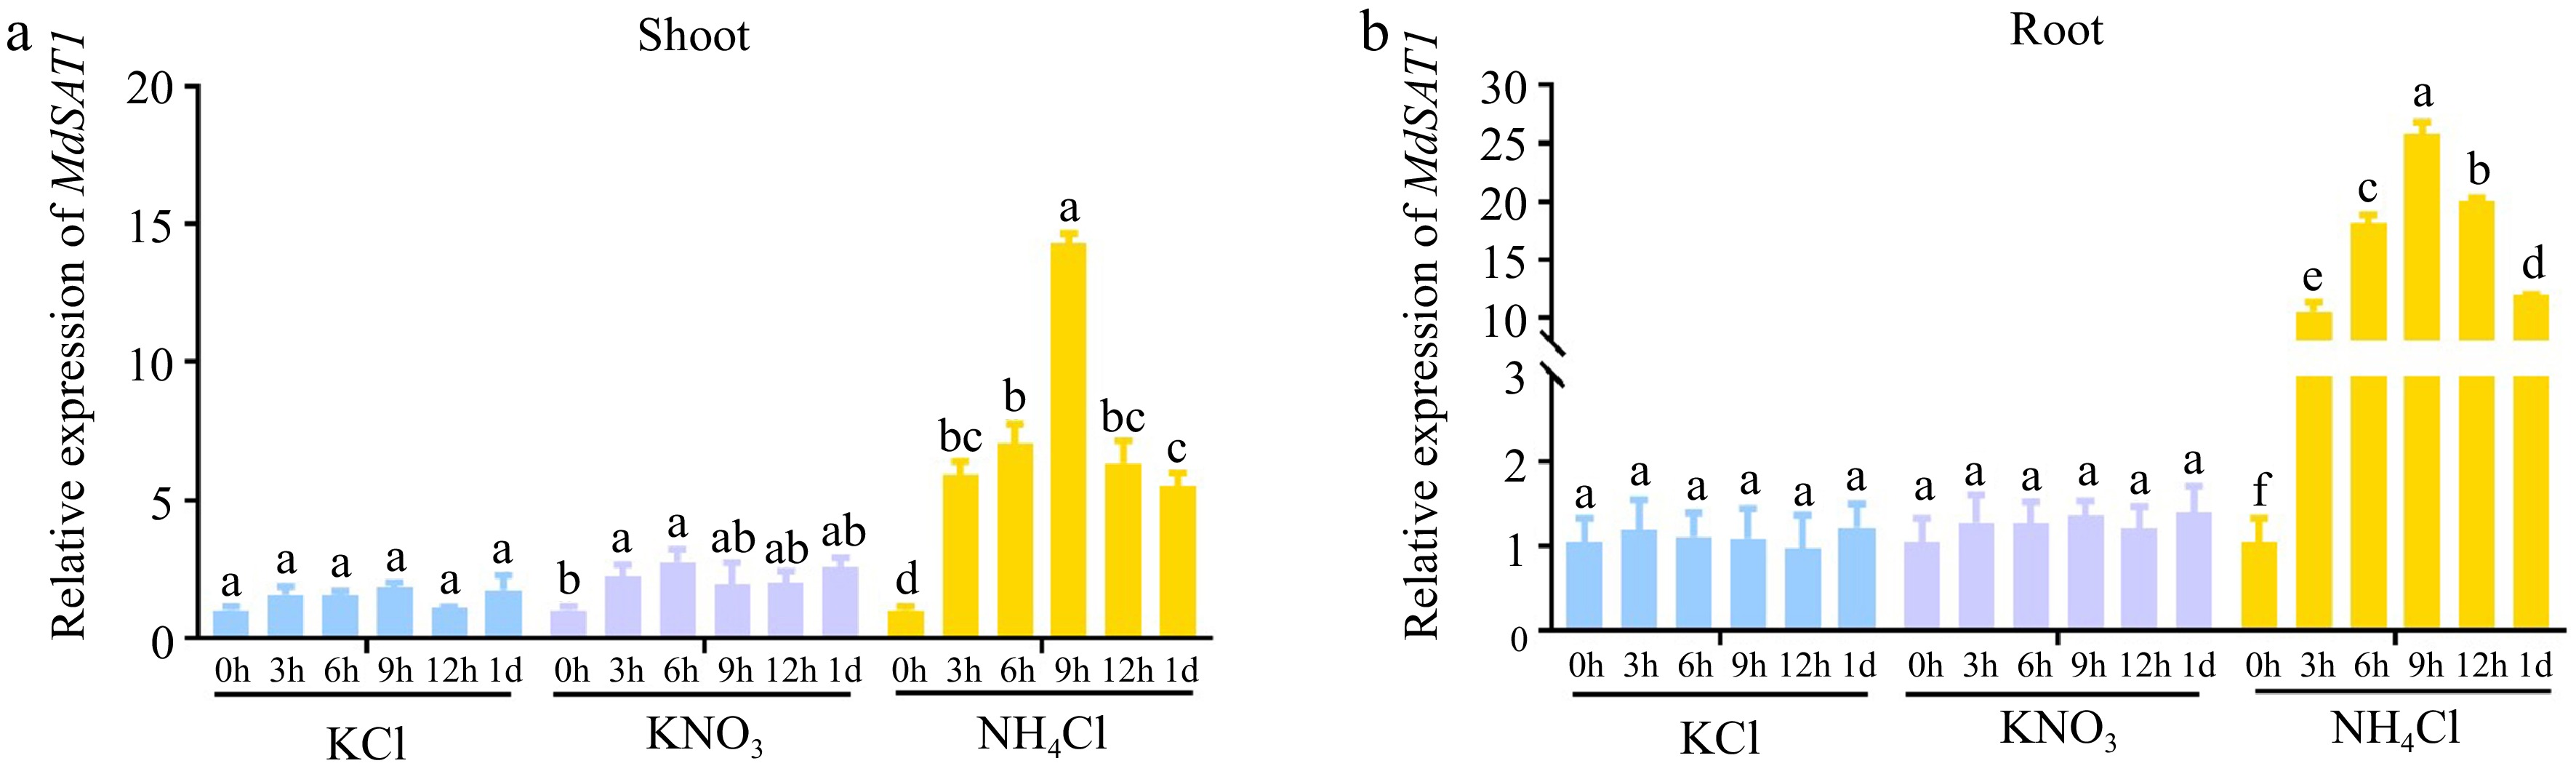
Figure 2.
Nitrogen response of MdSAT1. (a) Shoot and (b) root response of MdSAT1 to KCl (represents 0 N), KNO3 (represents nitrate), and NH4Cl (represents ammonium). Error bars represent standard deviation (n = 3). Different letters above the bars indicate significantly different values (P < 0.05).
-
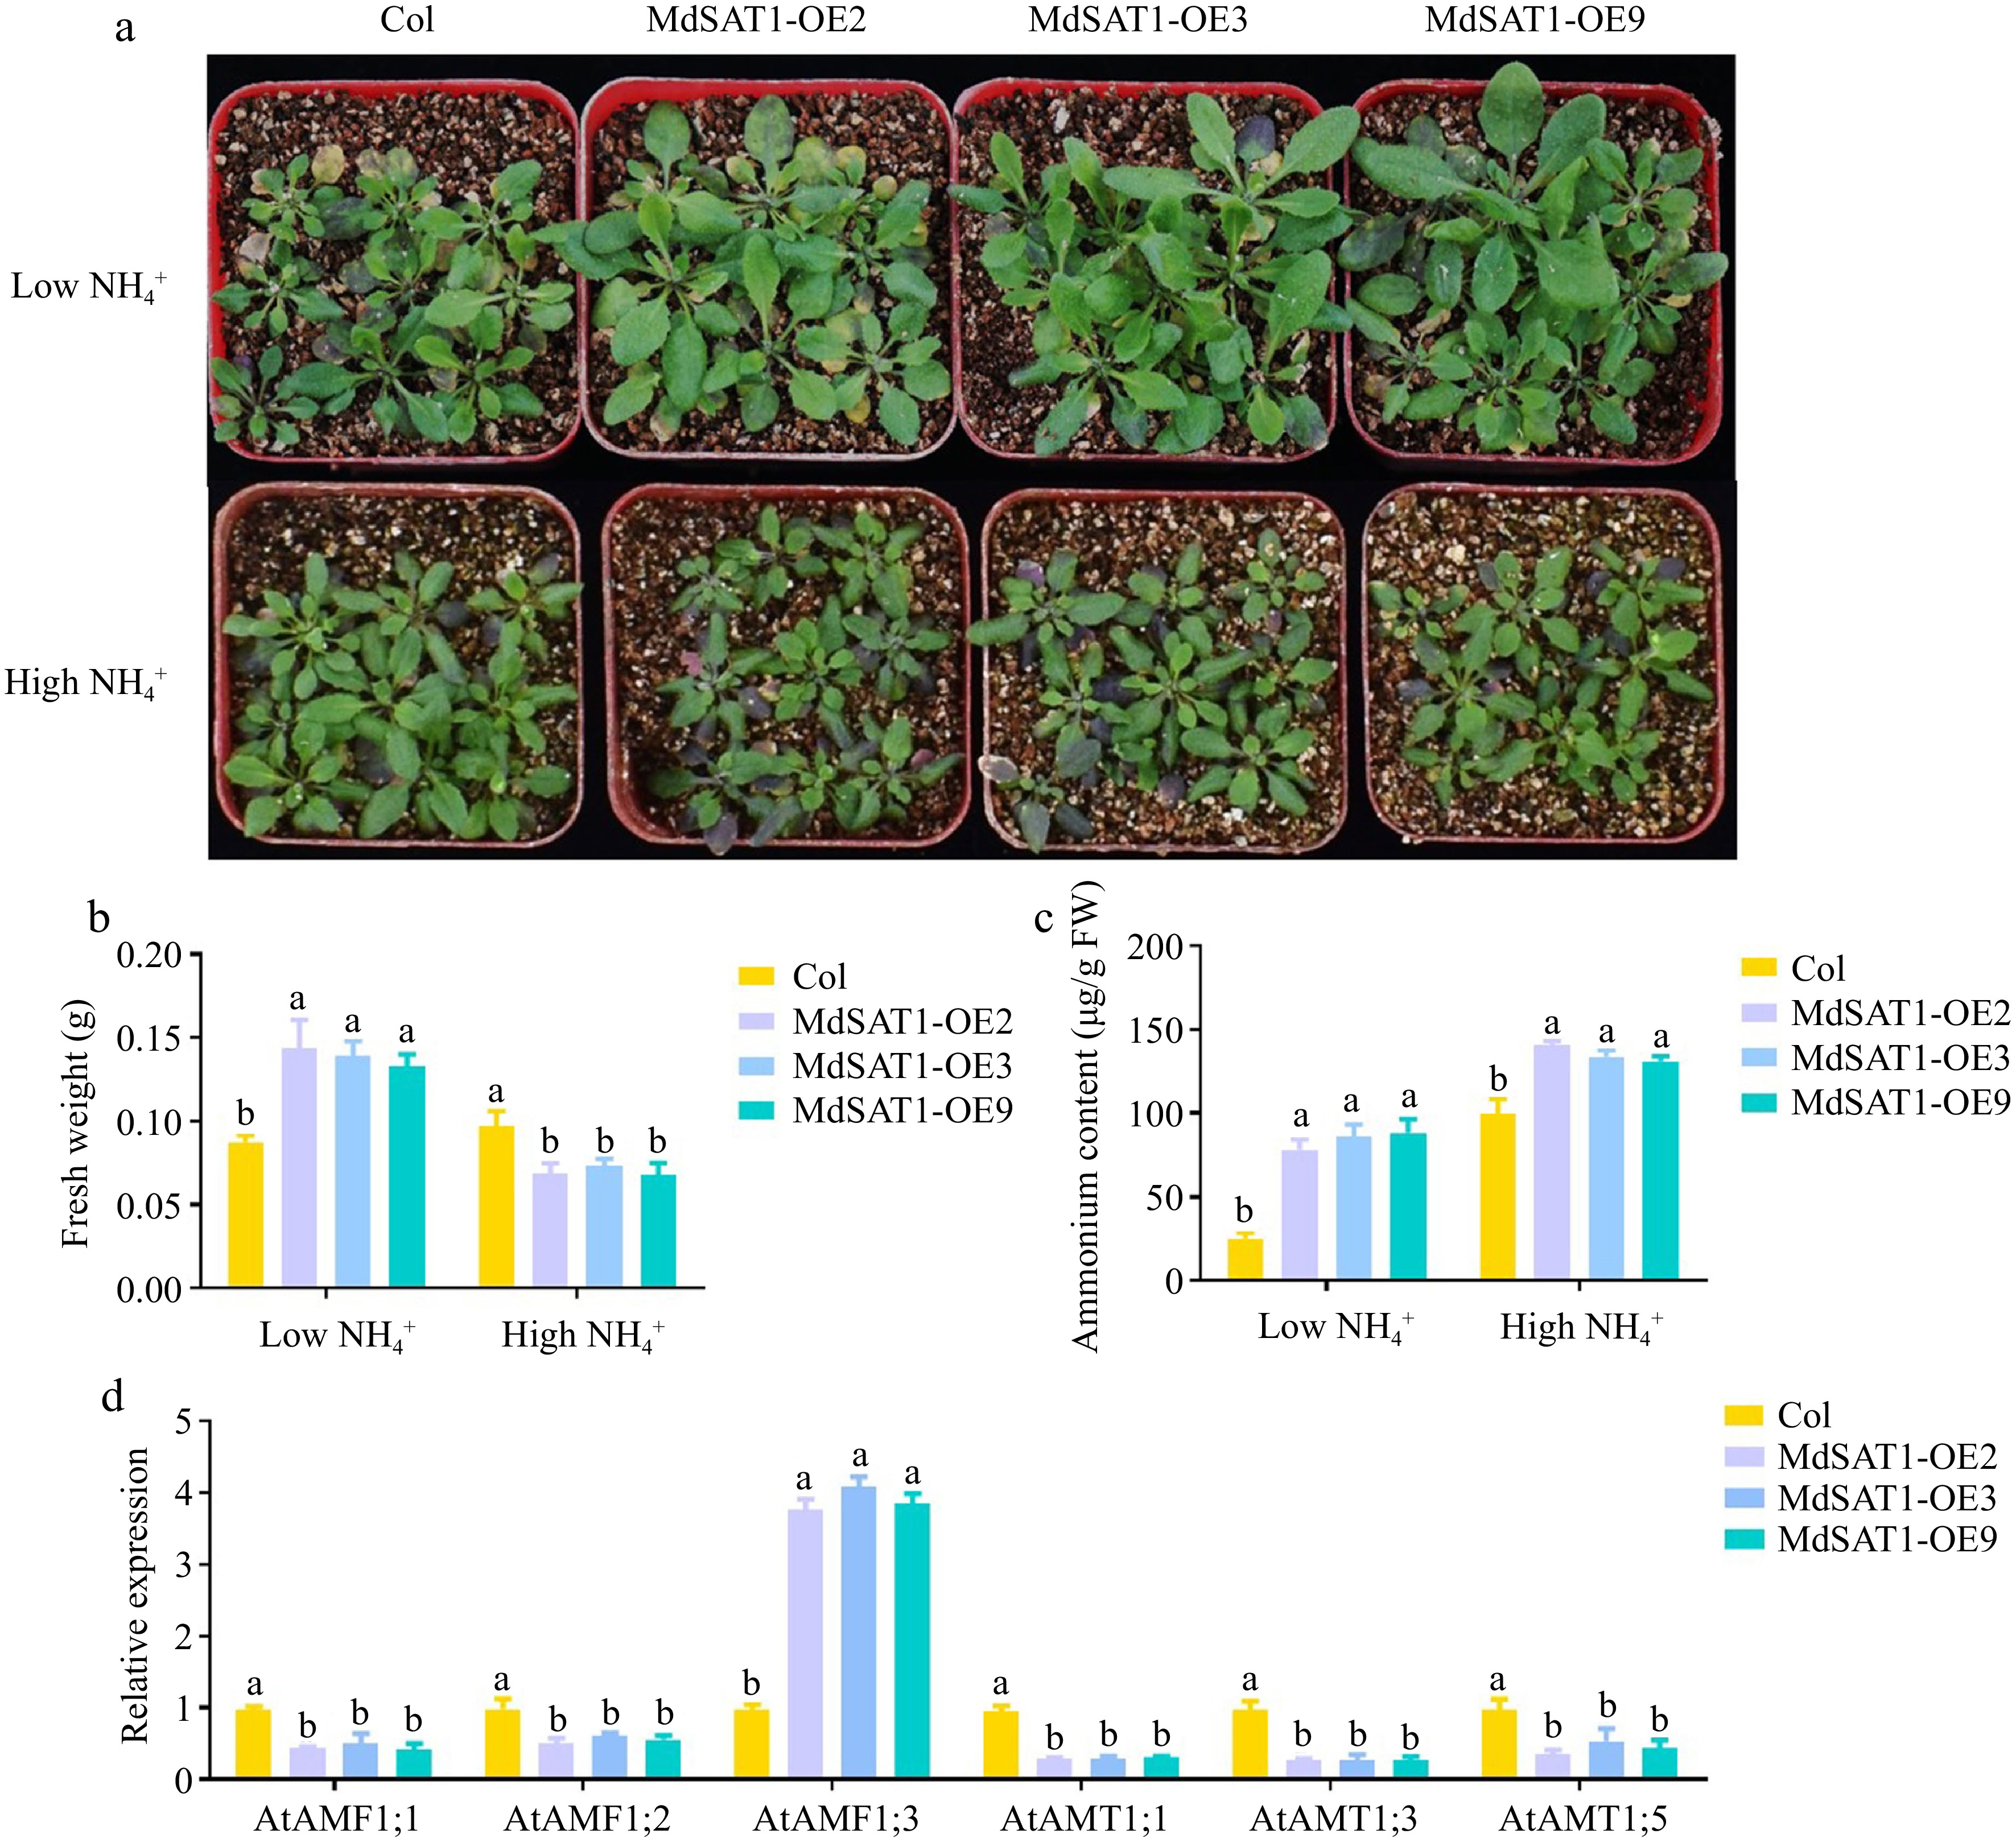
Figure 3.
MdSAT1 regulates ammonium uptake and plant growth MdSAT1-OE and Col plants grown for four weeks under low
$\text{NH}^+_4 $ $\text{NH}^+_4 $ -
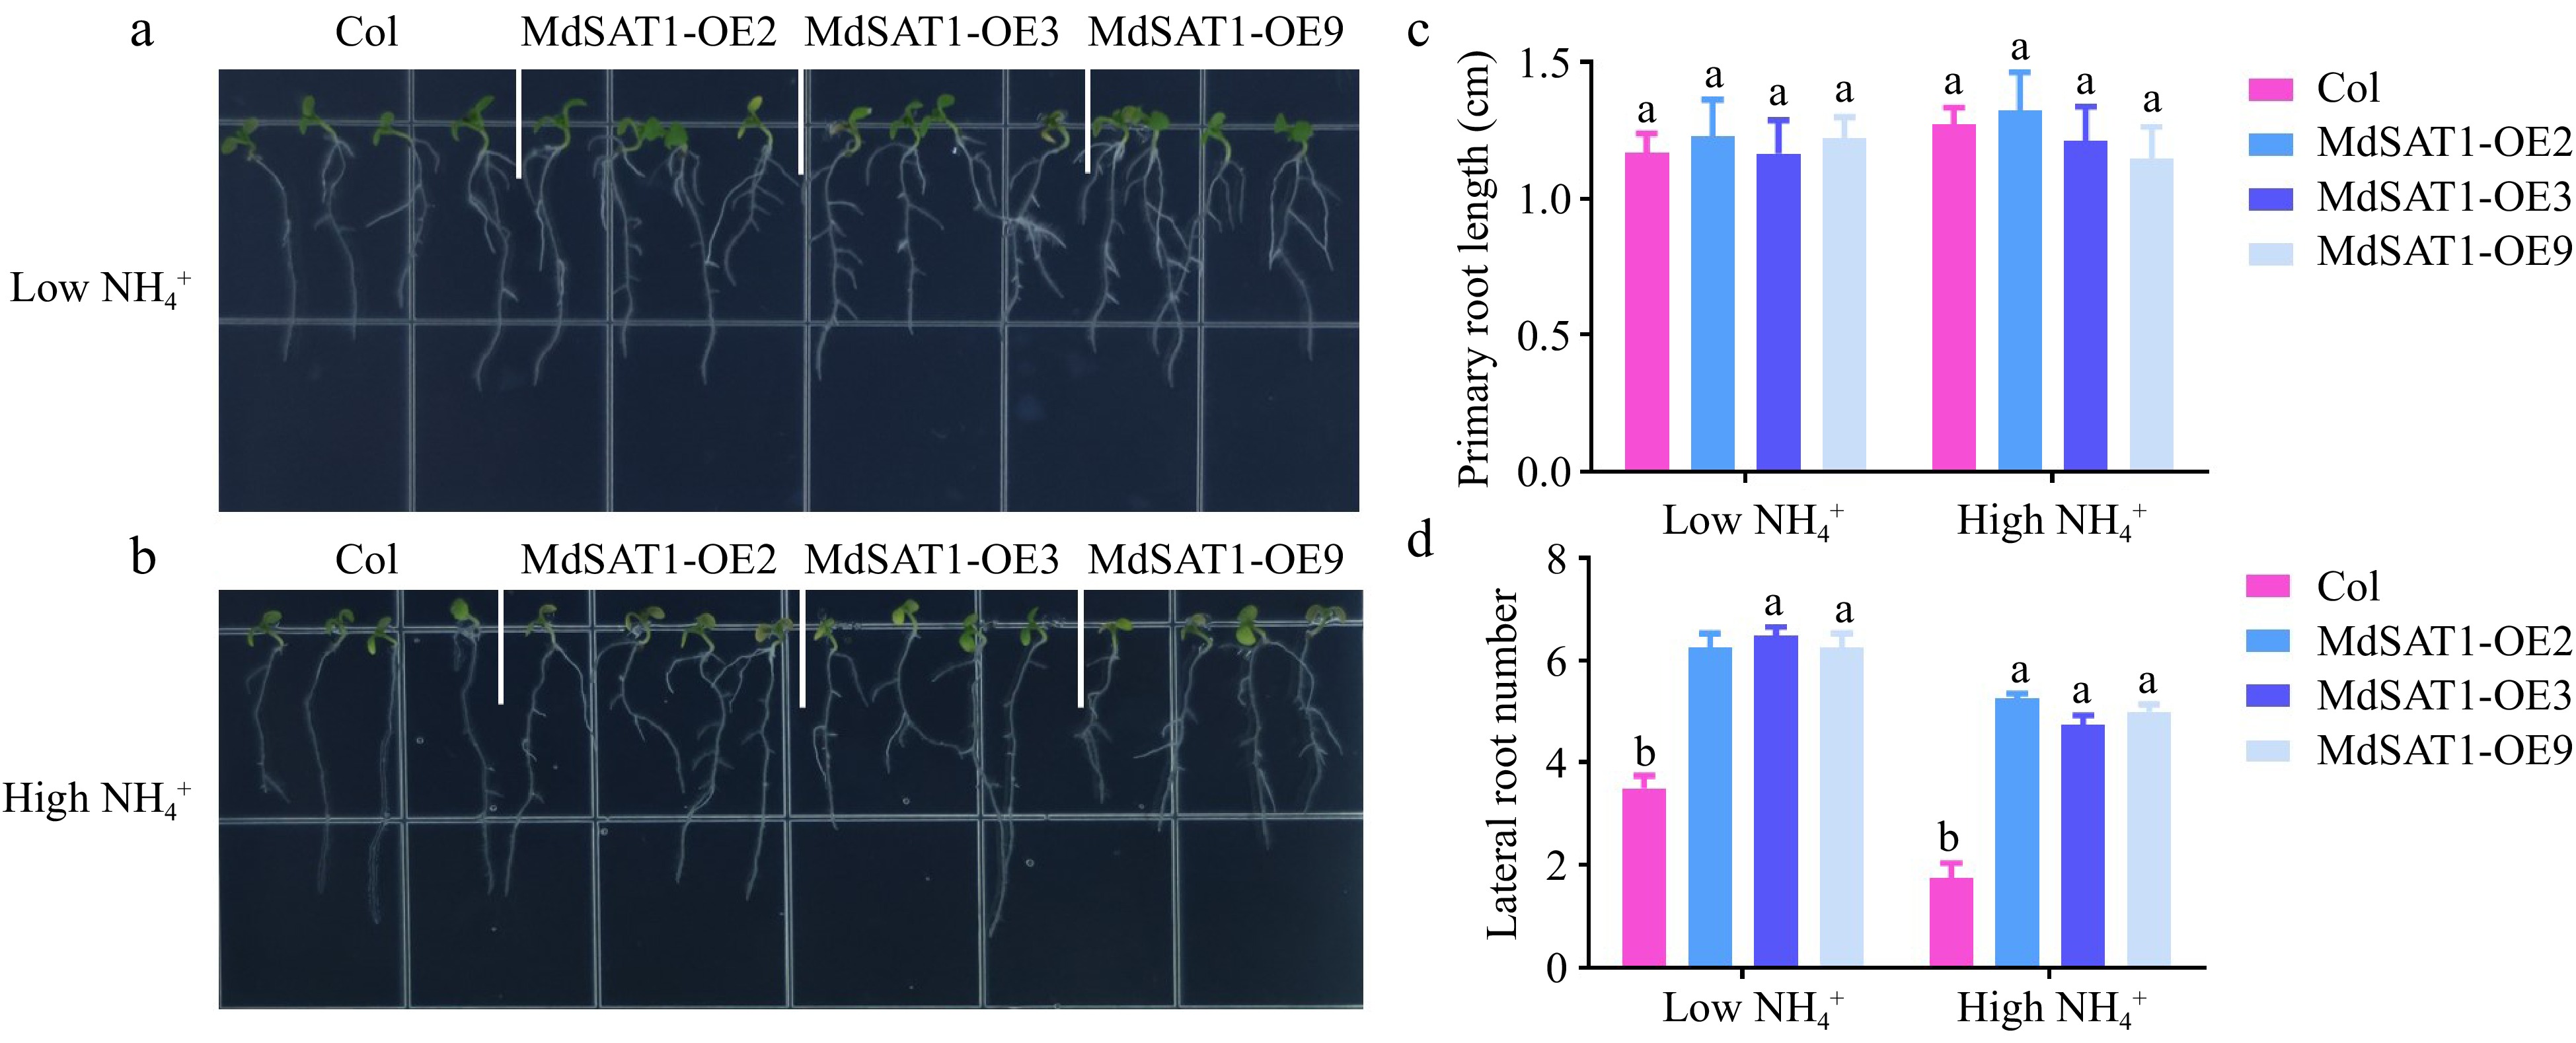
Figure 4.
MdSAT1 regulates root system conformation MdSAT1-OE and Col plants grown for seven days under low
$\text{NH}^+_4 $ $\text{NH}^+_4 $ -
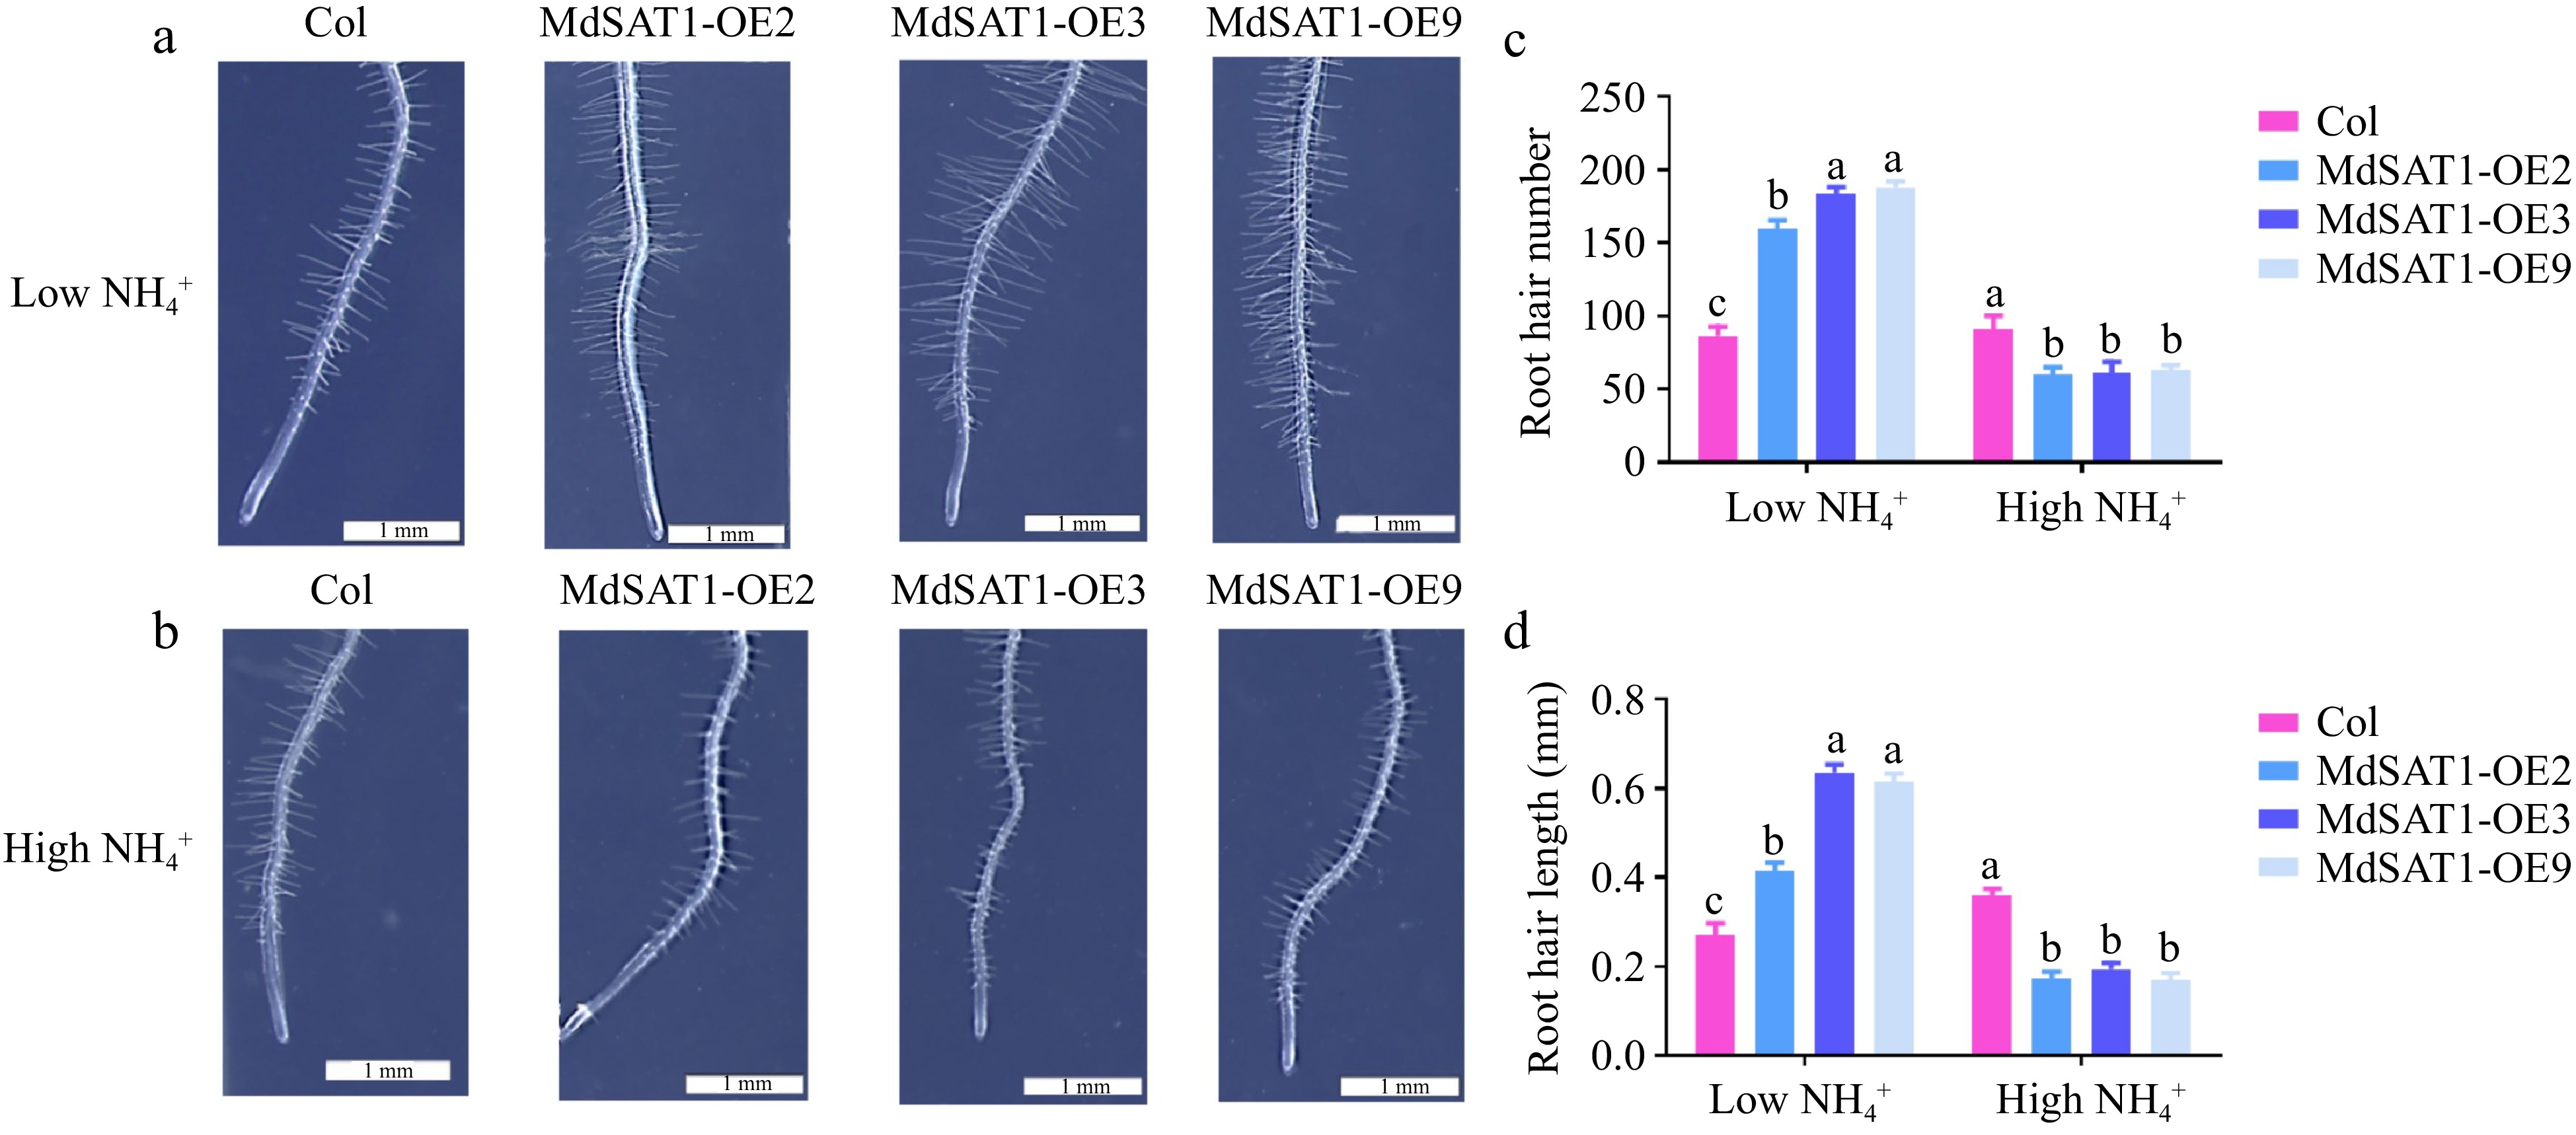
Figure 5.
MdSAT1 regulates root hair growth and development MdSAT1-OE and Col plants grown for three days under low
$\text{NH}^+_4 $ $\text{NH}^+_4 $ -
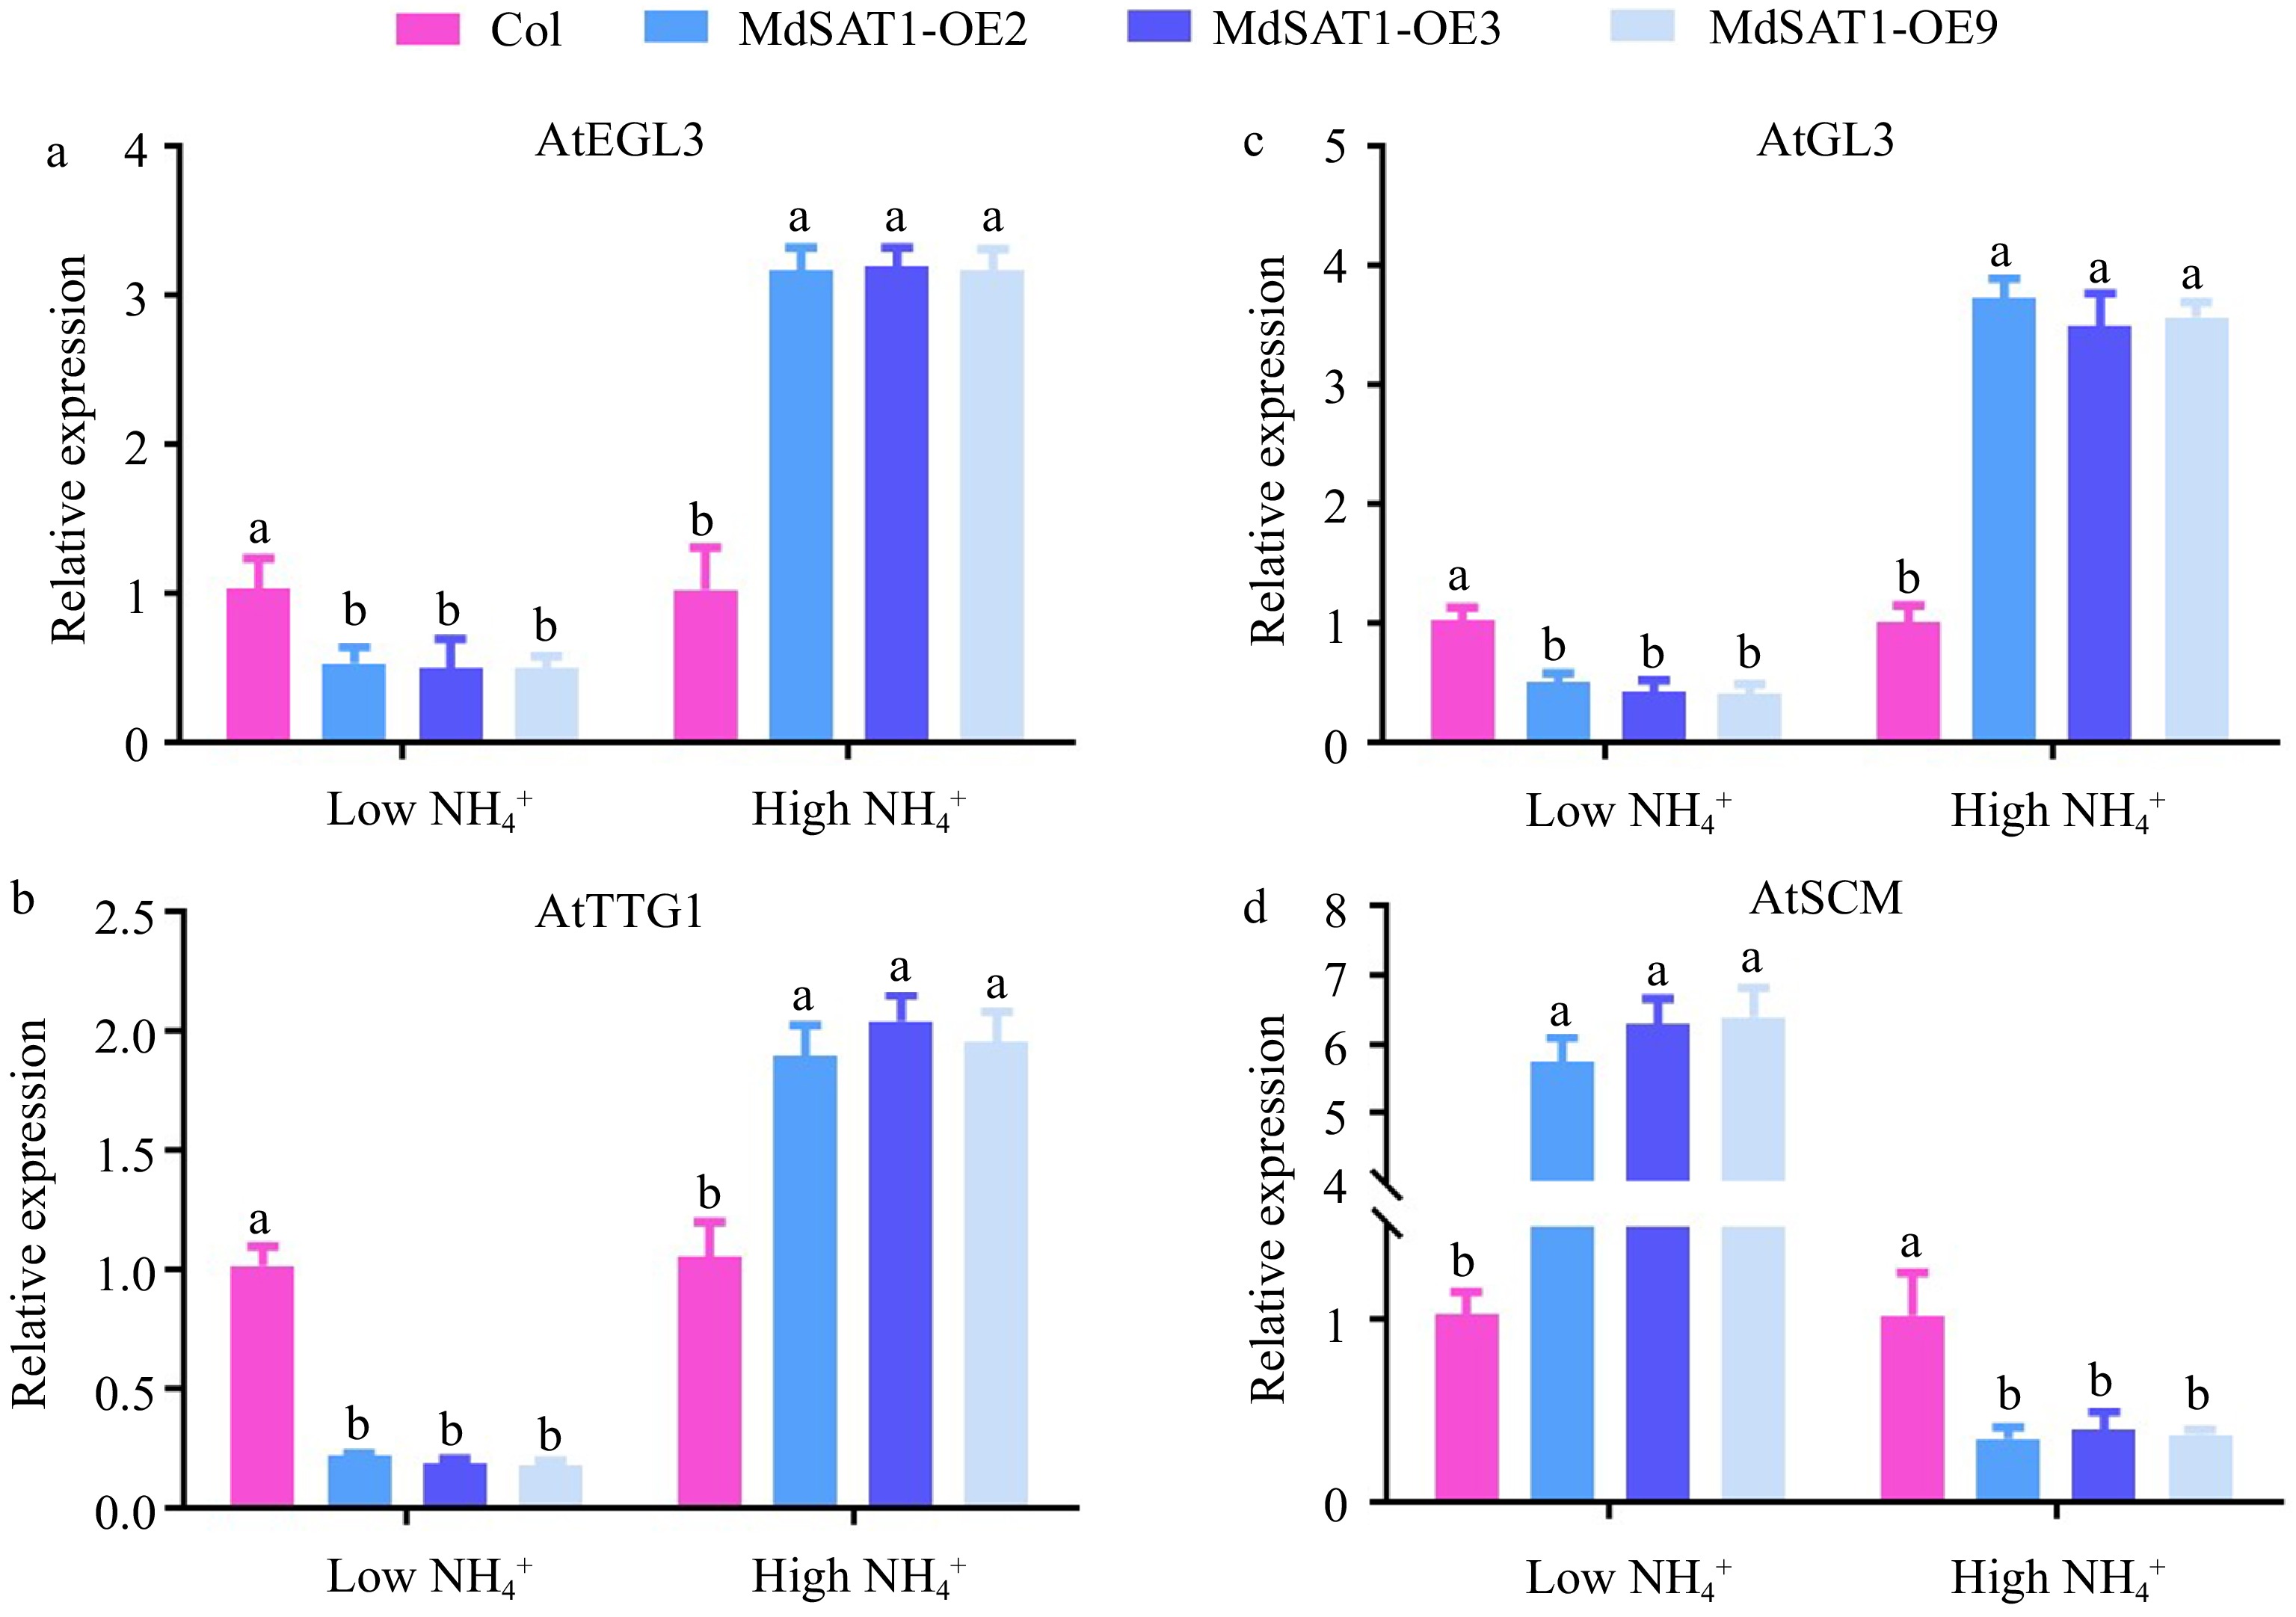
Figure 6.
MdSAT1 regulates the expression of genes related to root hair development Analysis of root hair development-related gene expression by RT-PCR under low
$\text{NH}^+_4 $ $\text{NH}^+_4 $ -
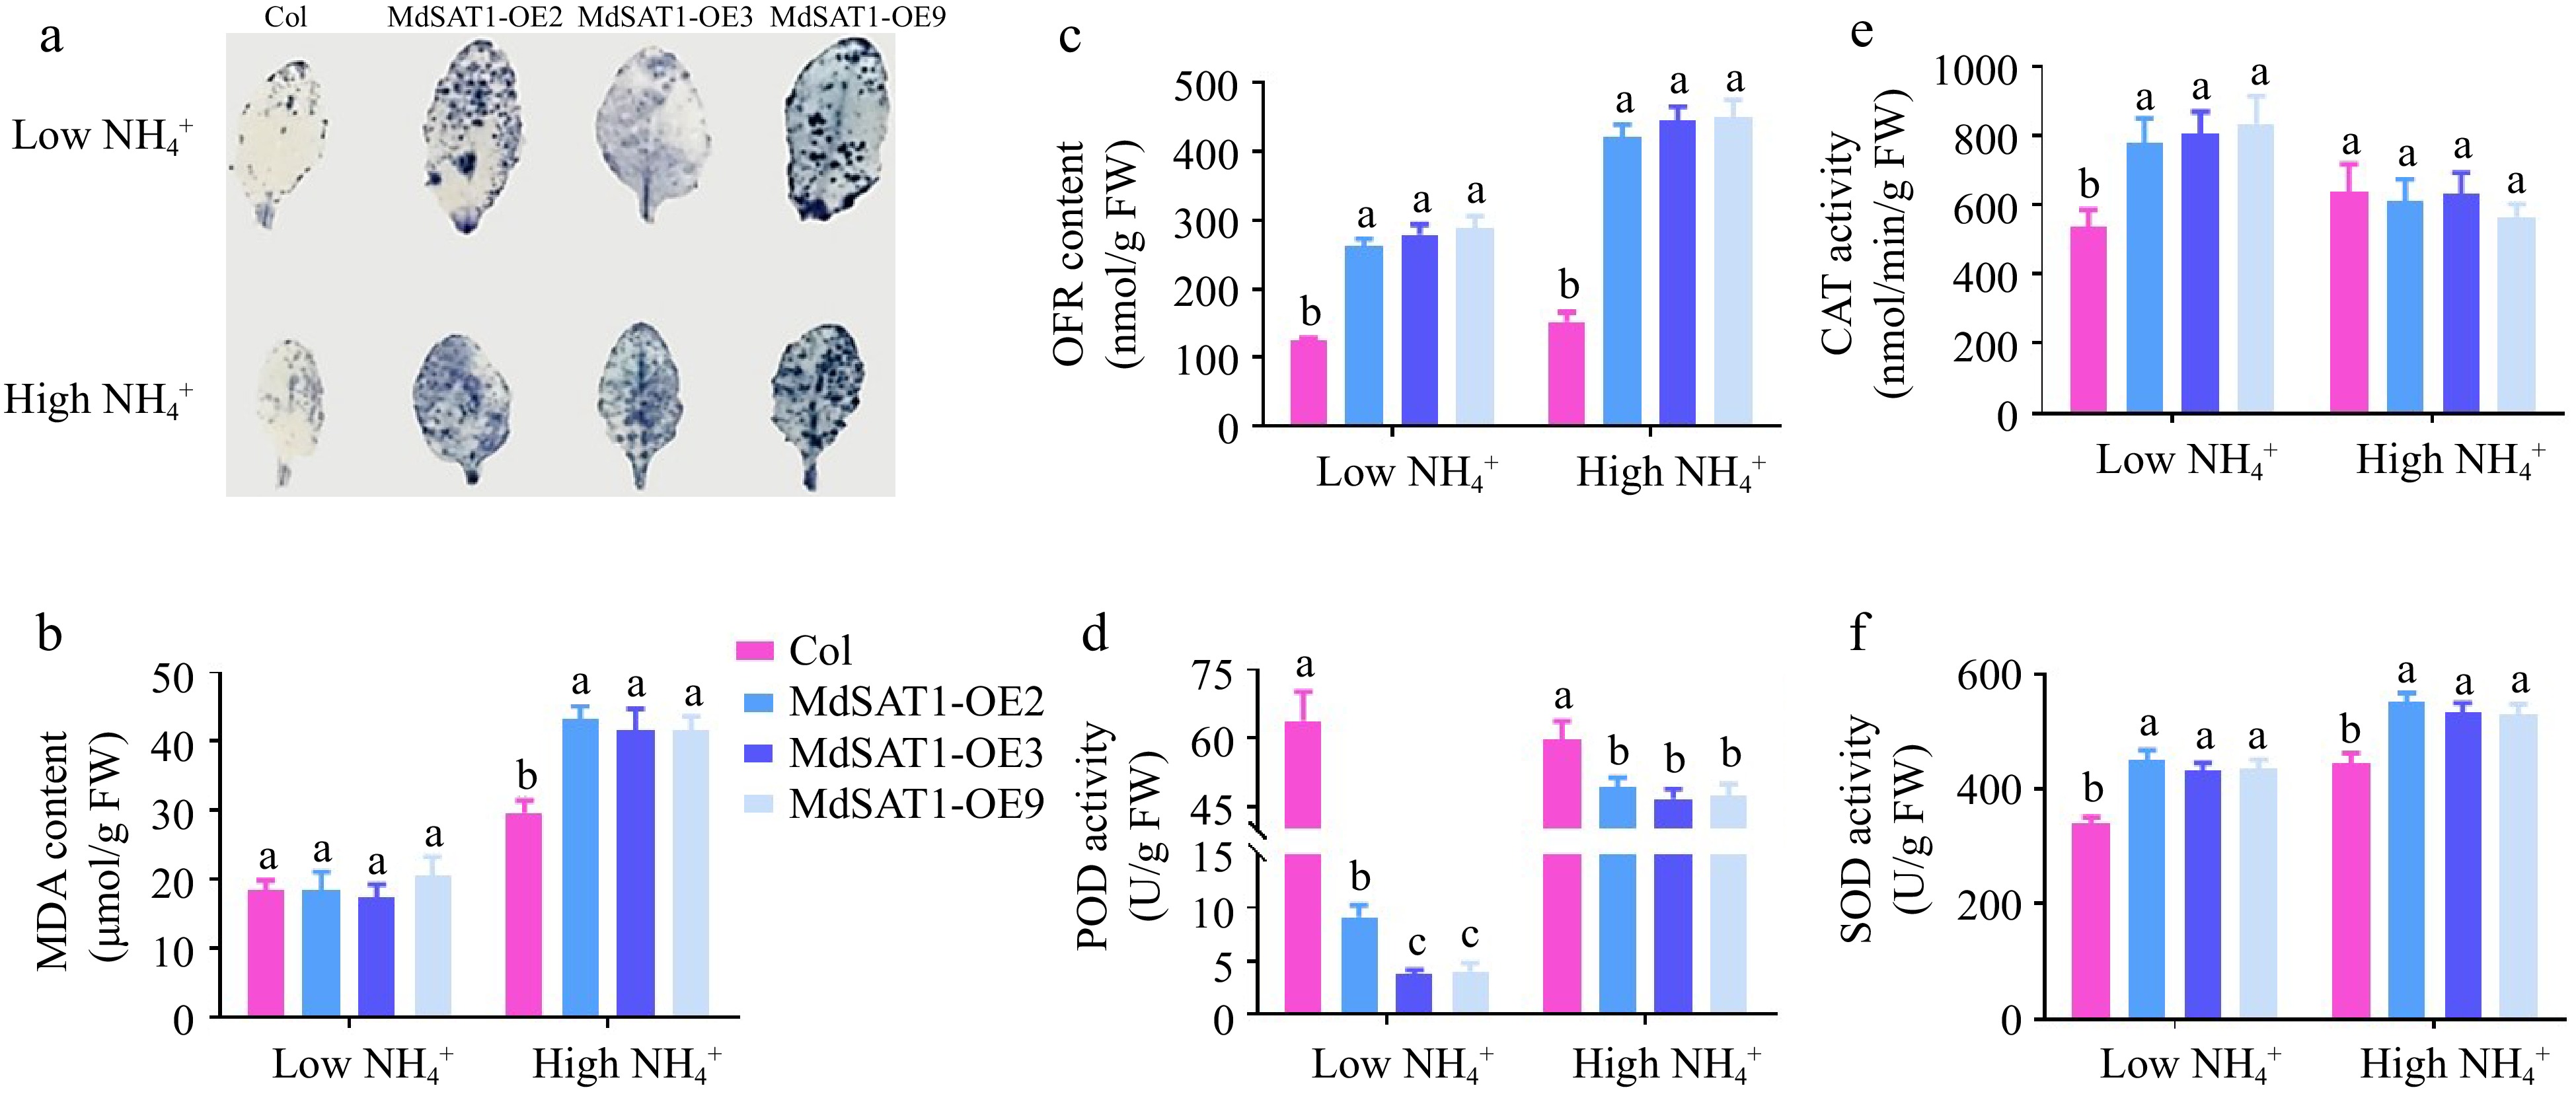
Figure 7.
MdSAT1 regulates ROS accumulation Col and MdSAT1-OE plants grown for four weeks under low
$\text{NH}^+_4 $ $\text{NH}^+_4 $
Figures
(7)
Tables
(0)