-
-
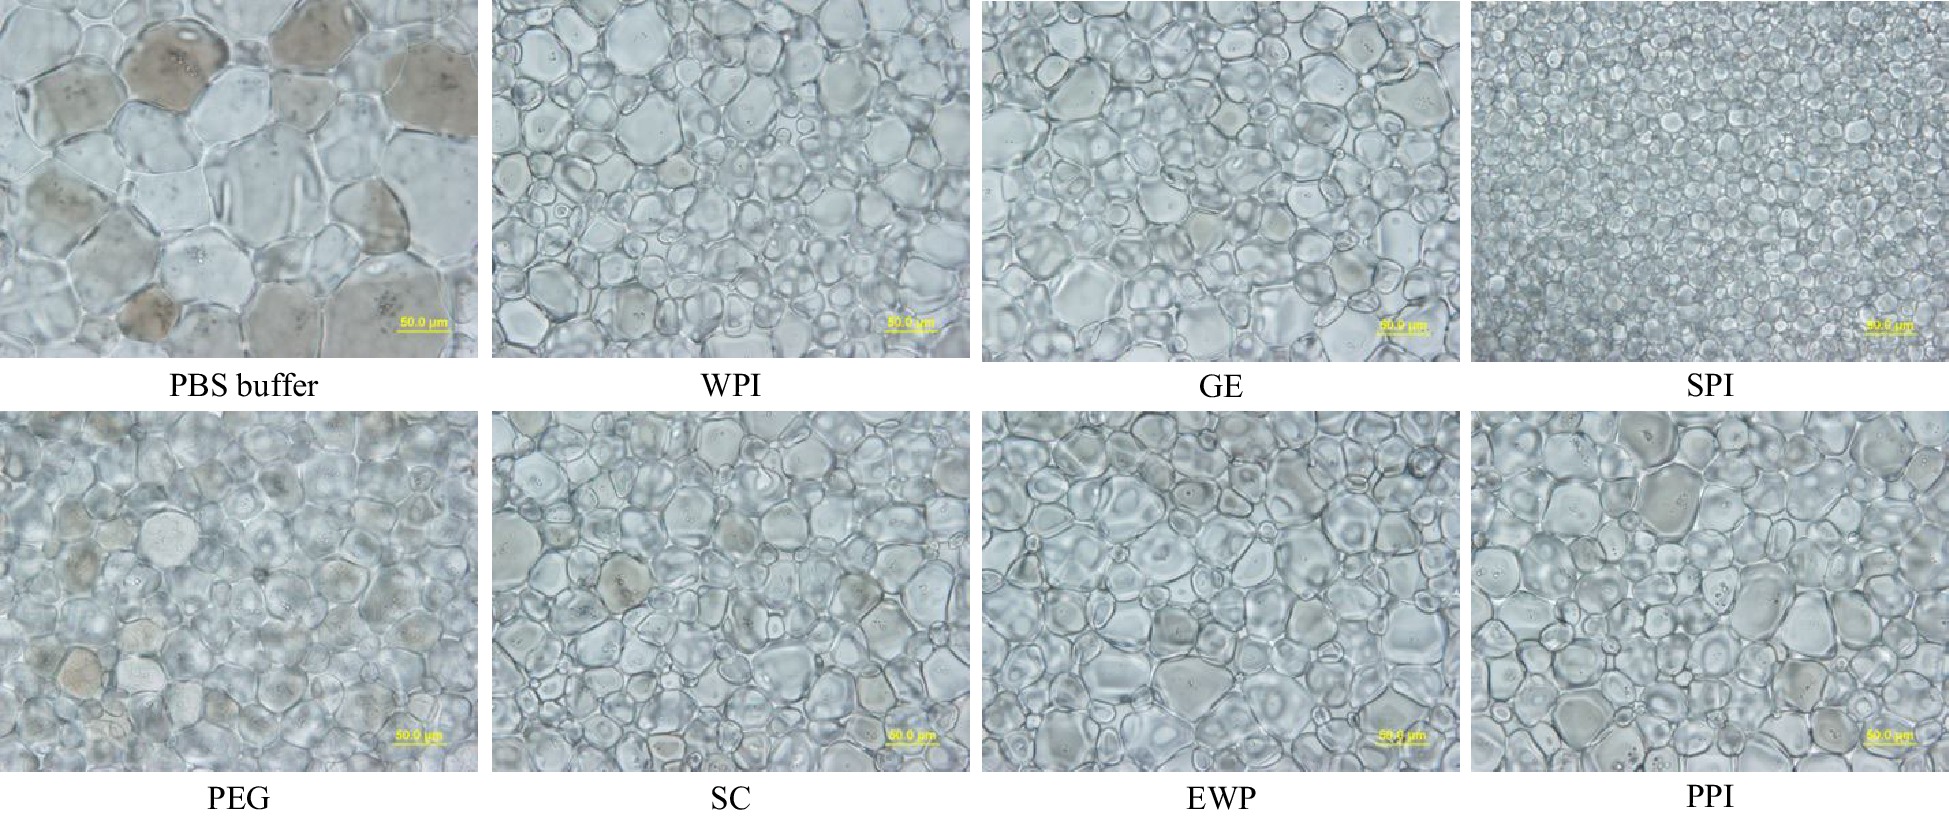
Figure 2.
Standard splat assay microscopic image at 40× for PEG (negative control), and GE, SPI, SC, EWP and PPI hydrolysates after 15-min alcalase hydrolysis at 4% (w/w) concentration, and phosphate buffer saline (PBS – the buffer solvent) annealed at −8 °C for 30 min (scale bar = 50 μm).
-
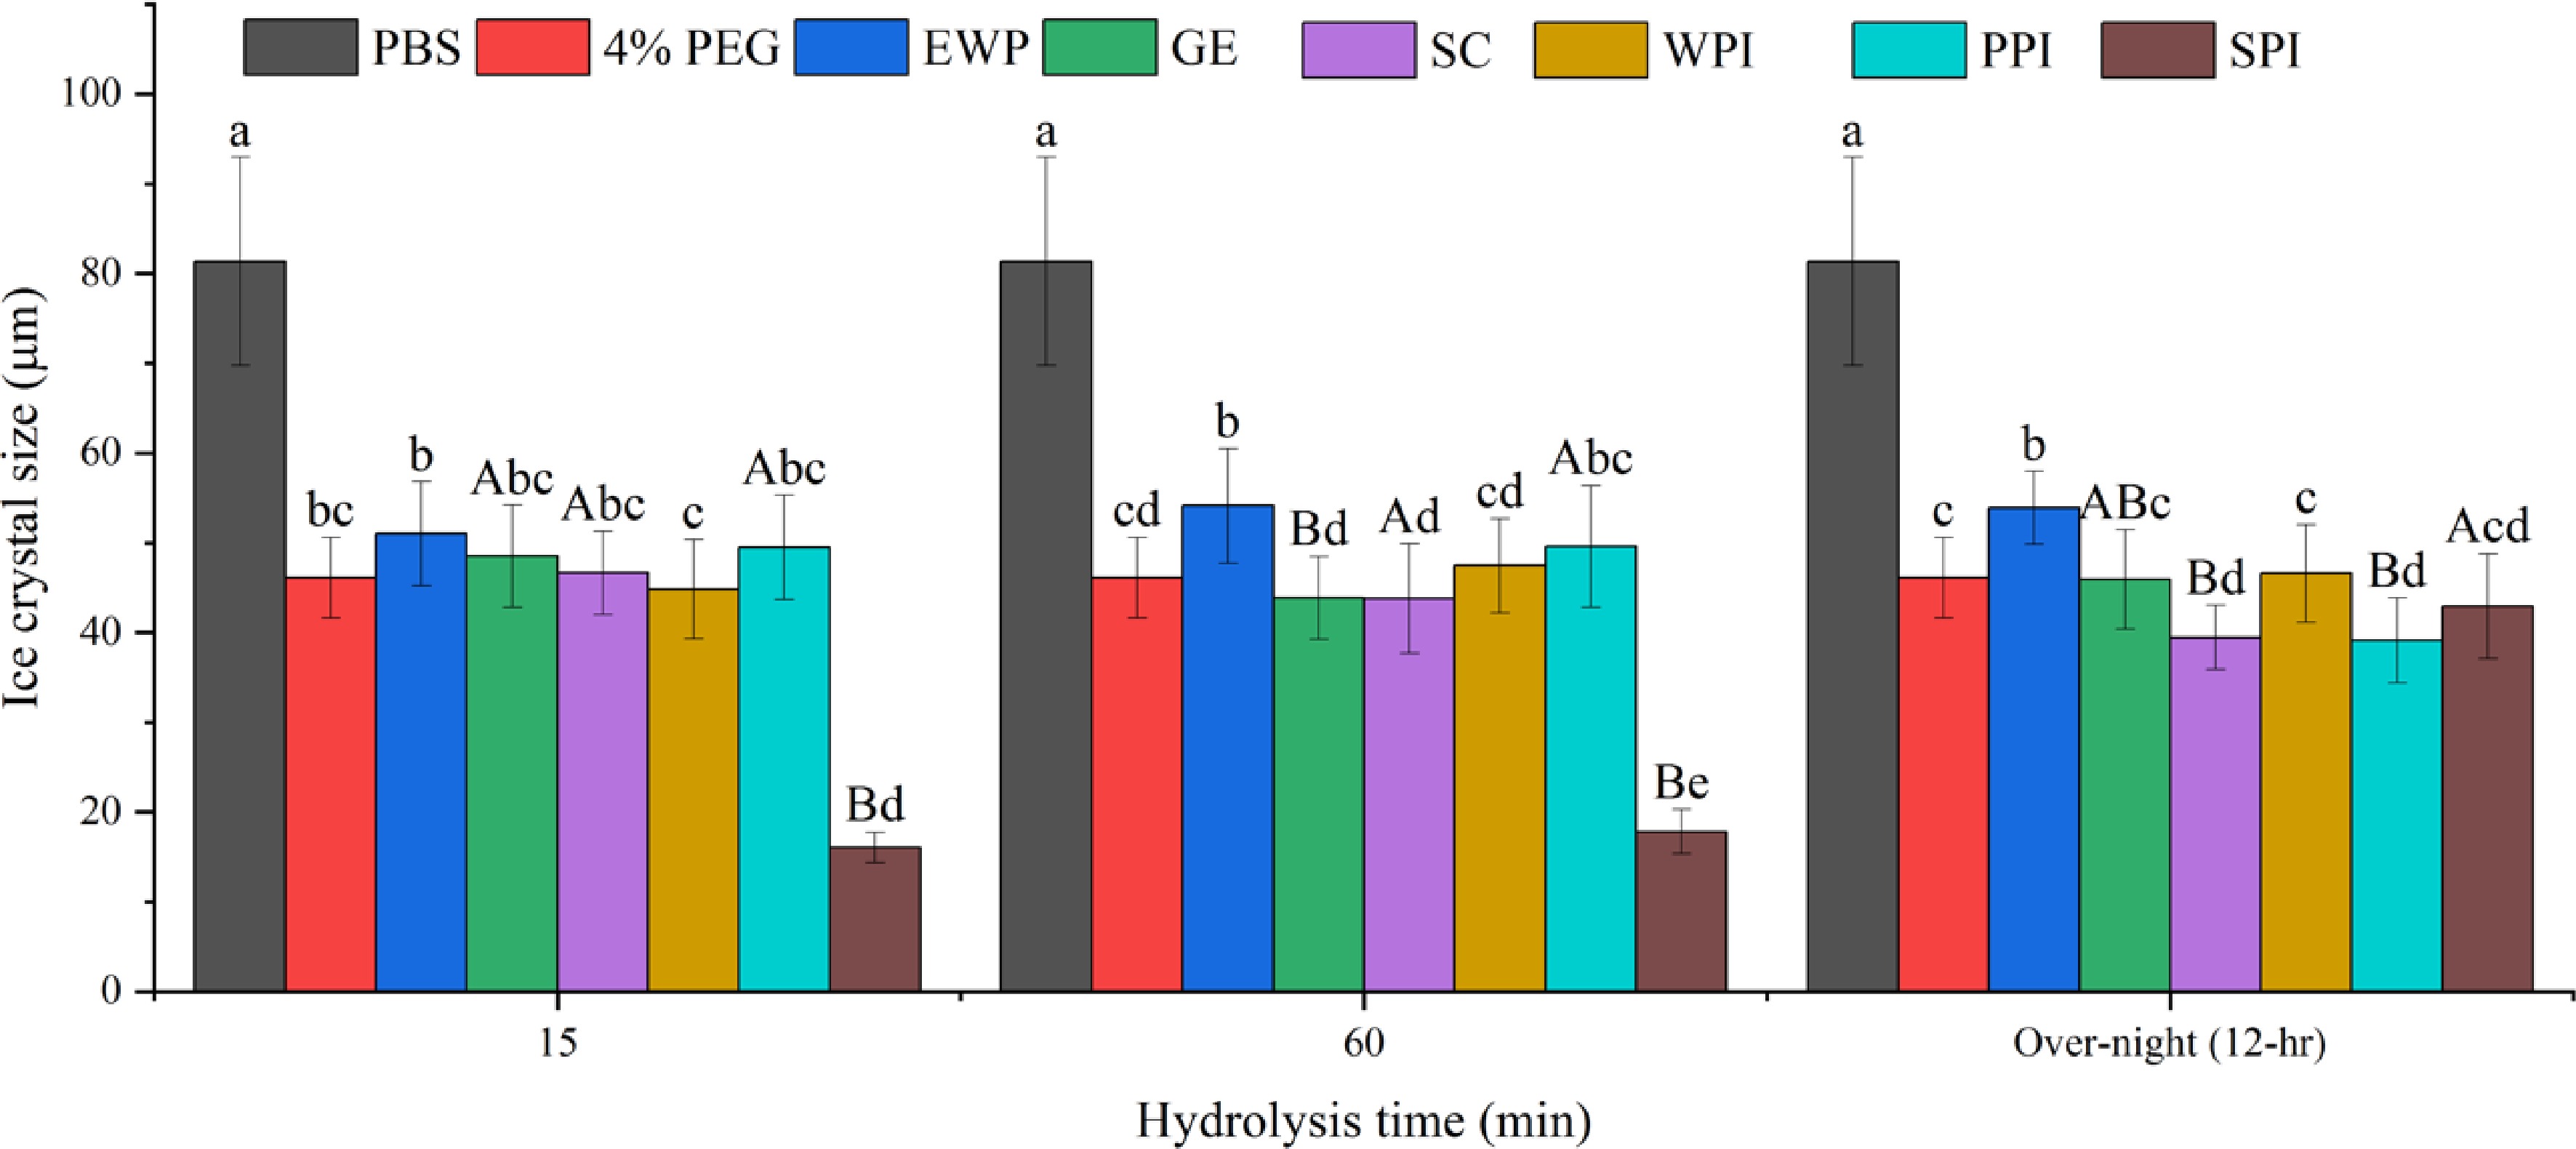
Figure 3.
Mean average ice crystal size (μm) from different protein hydrolysates (4% w/w) solutions under −8 °C. Same lower-case letter indicate no significant difference (p > 0.05) within the same hydrolysis time, while same upper-case letters indicate no significant difference within the same protein (p > 0.05).
-
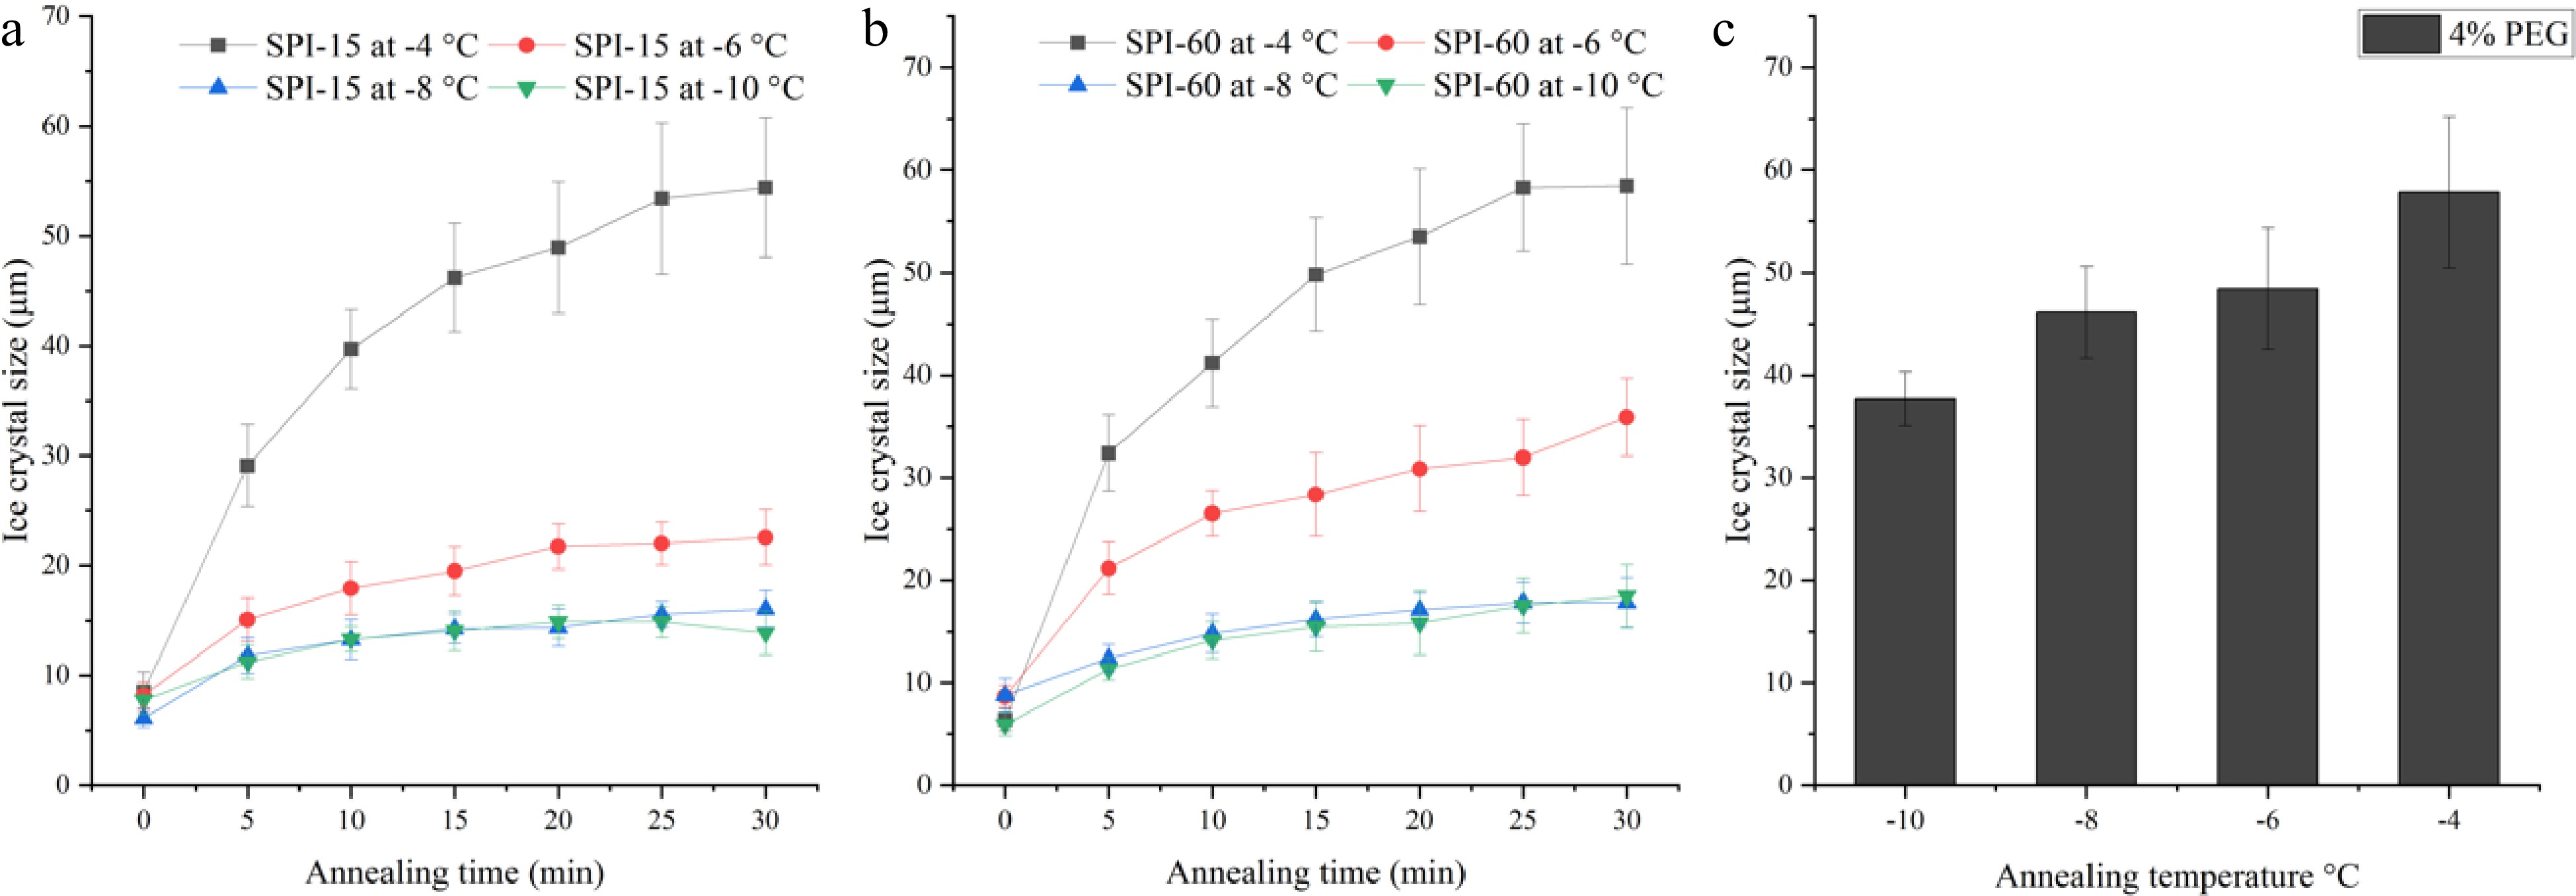
Figure 4.
Ice crystal size of 4% (a) SPI-15 and (b) SPI-60 hydrolysates in PBS buffer system annealed under −10 to −4 °C for various time. (c) Ice crystal size of 4% PEG (negative control) after 30 min annealing under various temperatures.
-
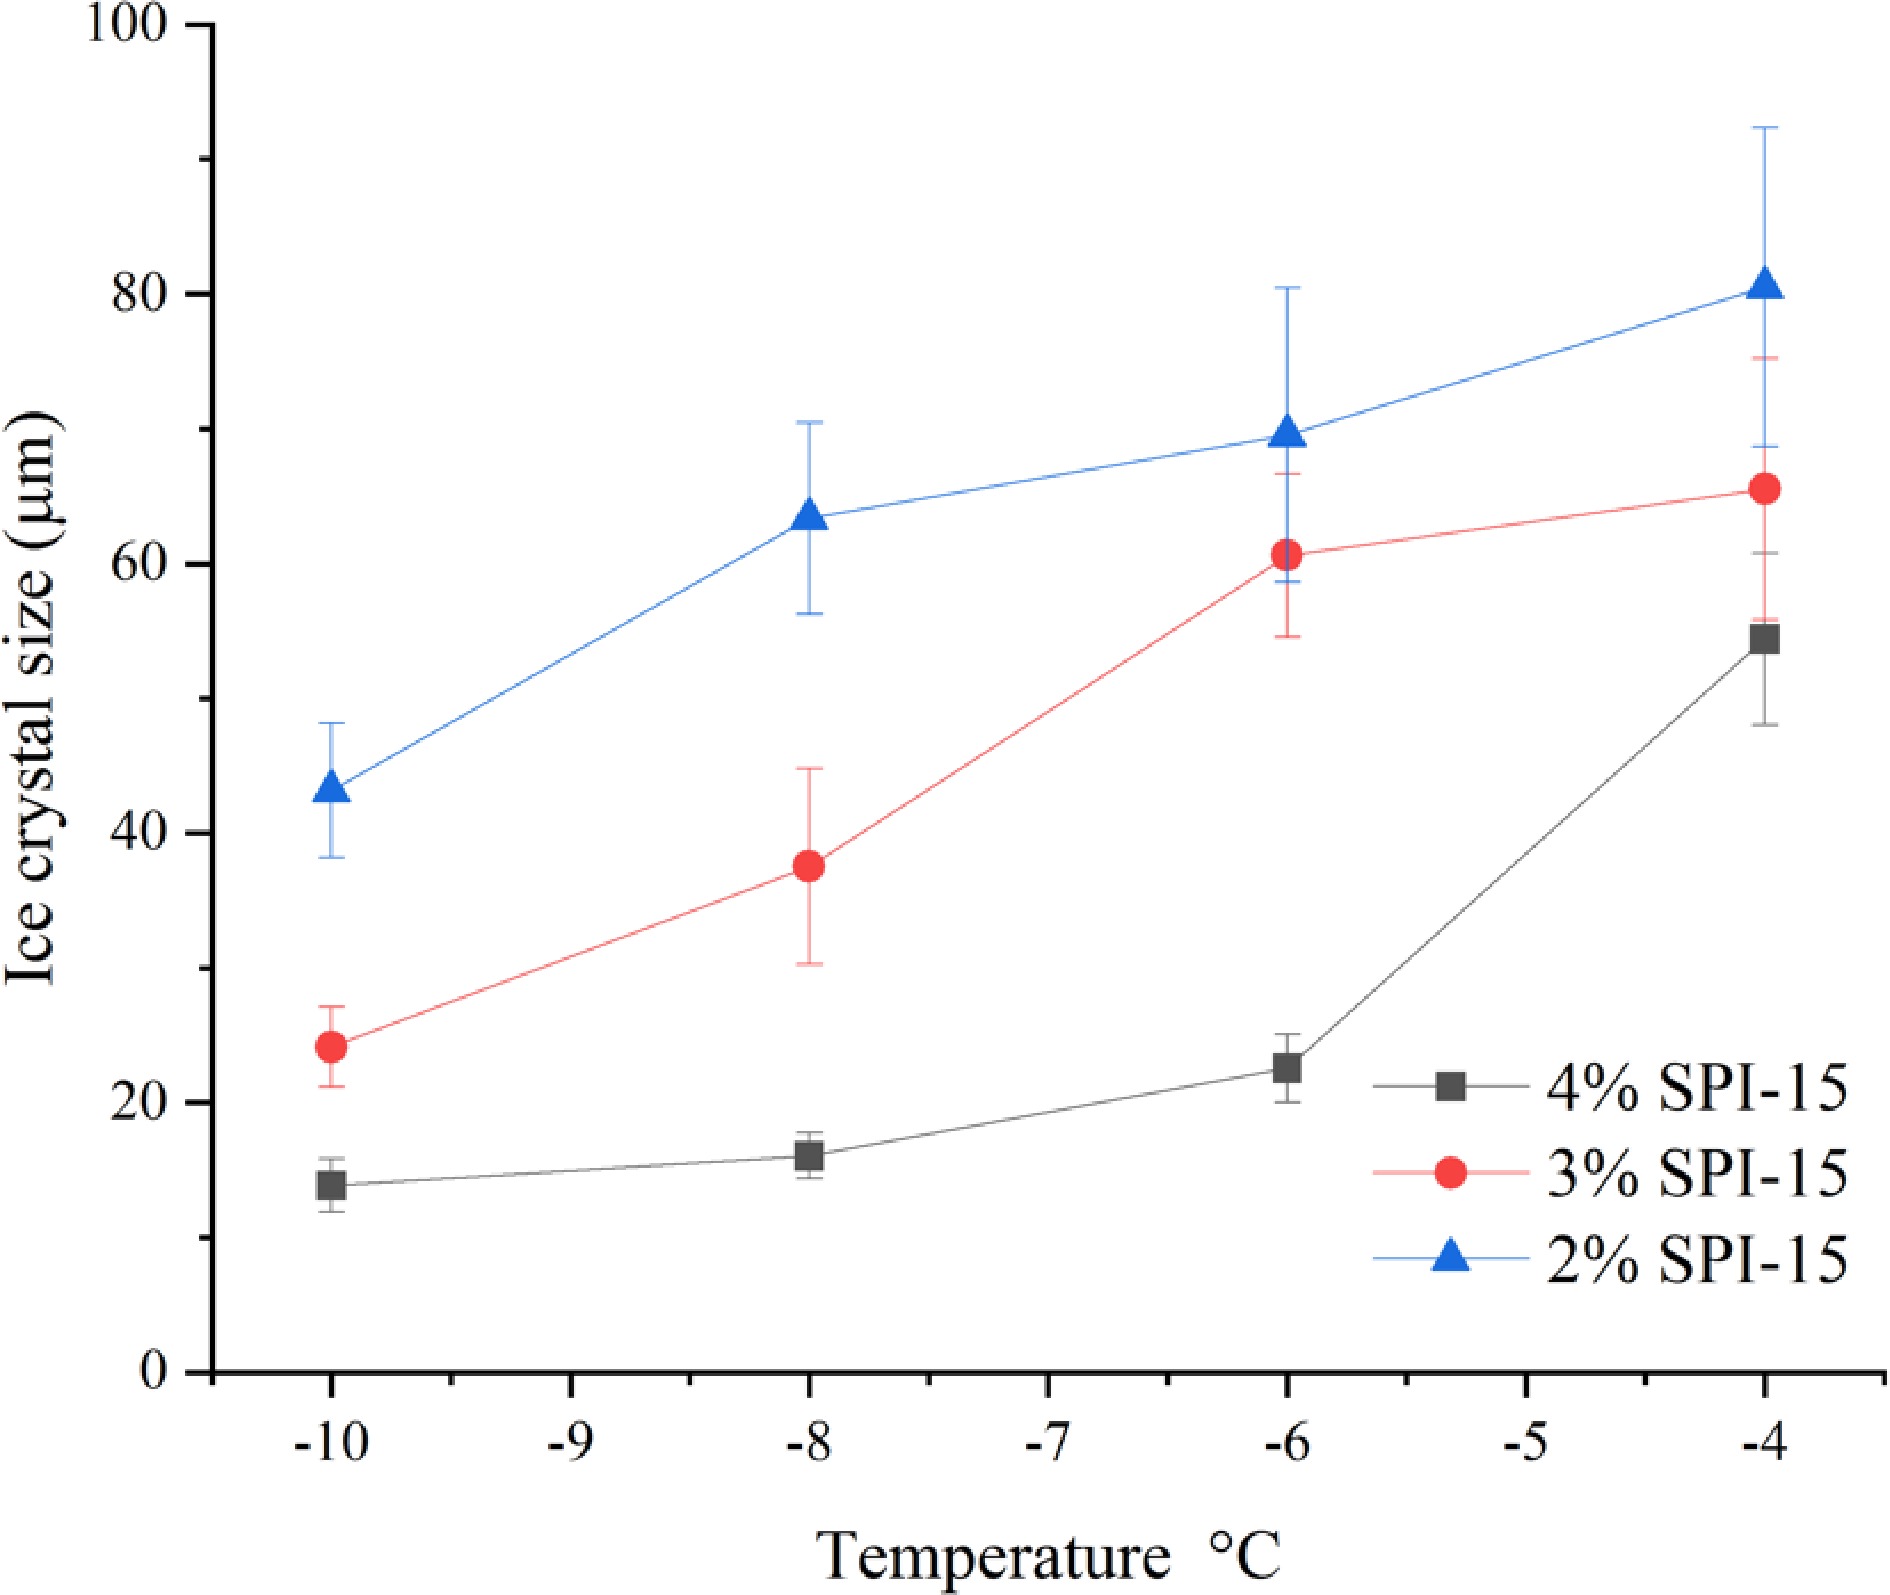
Figure 5.
Ice crystal size of SPI-15 hydrolysates in PBS buffer at varied concentrations (2%−4% w/w) annealed under different temperatures (−10 to −4 °C) for 30 min.
-
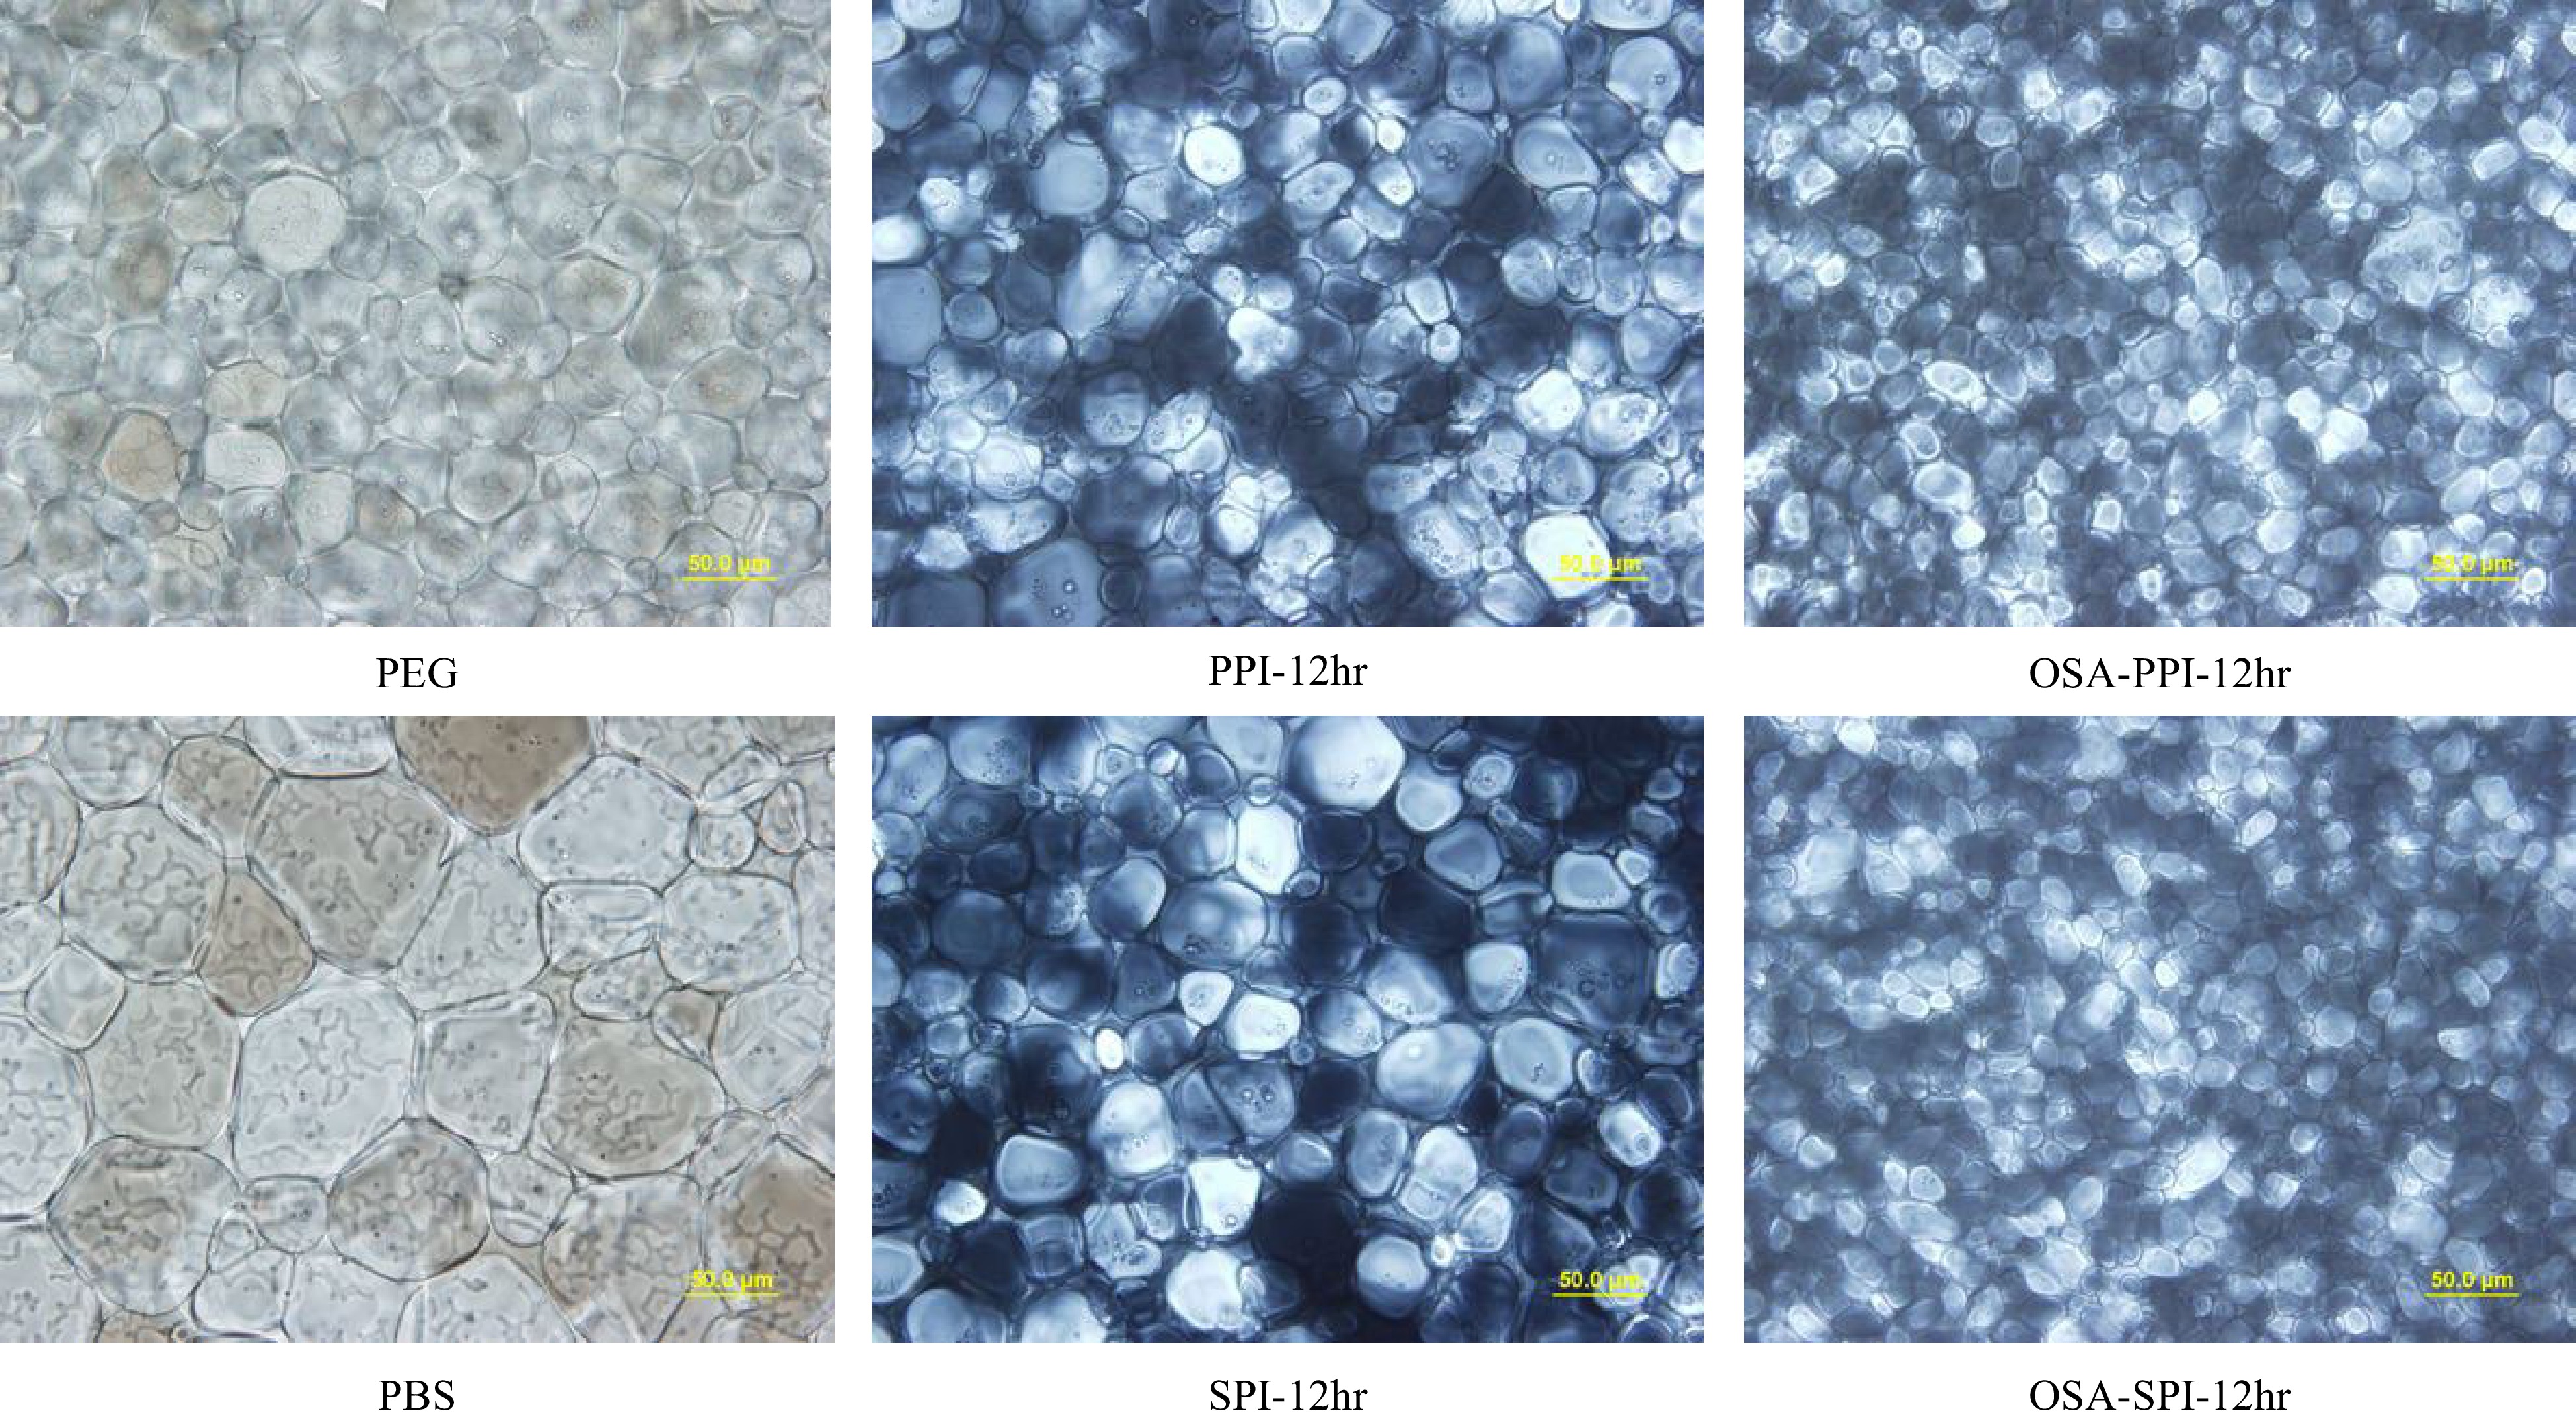
Figure 6.
Ice crystal image under polarized microscope at 40x for 4% SPI hydrolysates, PPI hydrolysates and their OSA-modified derivatives annealed at −8 °C compared to the negative control 4% PEG and PBS (the buffer solvent). (scale bar = 50 μm).
-
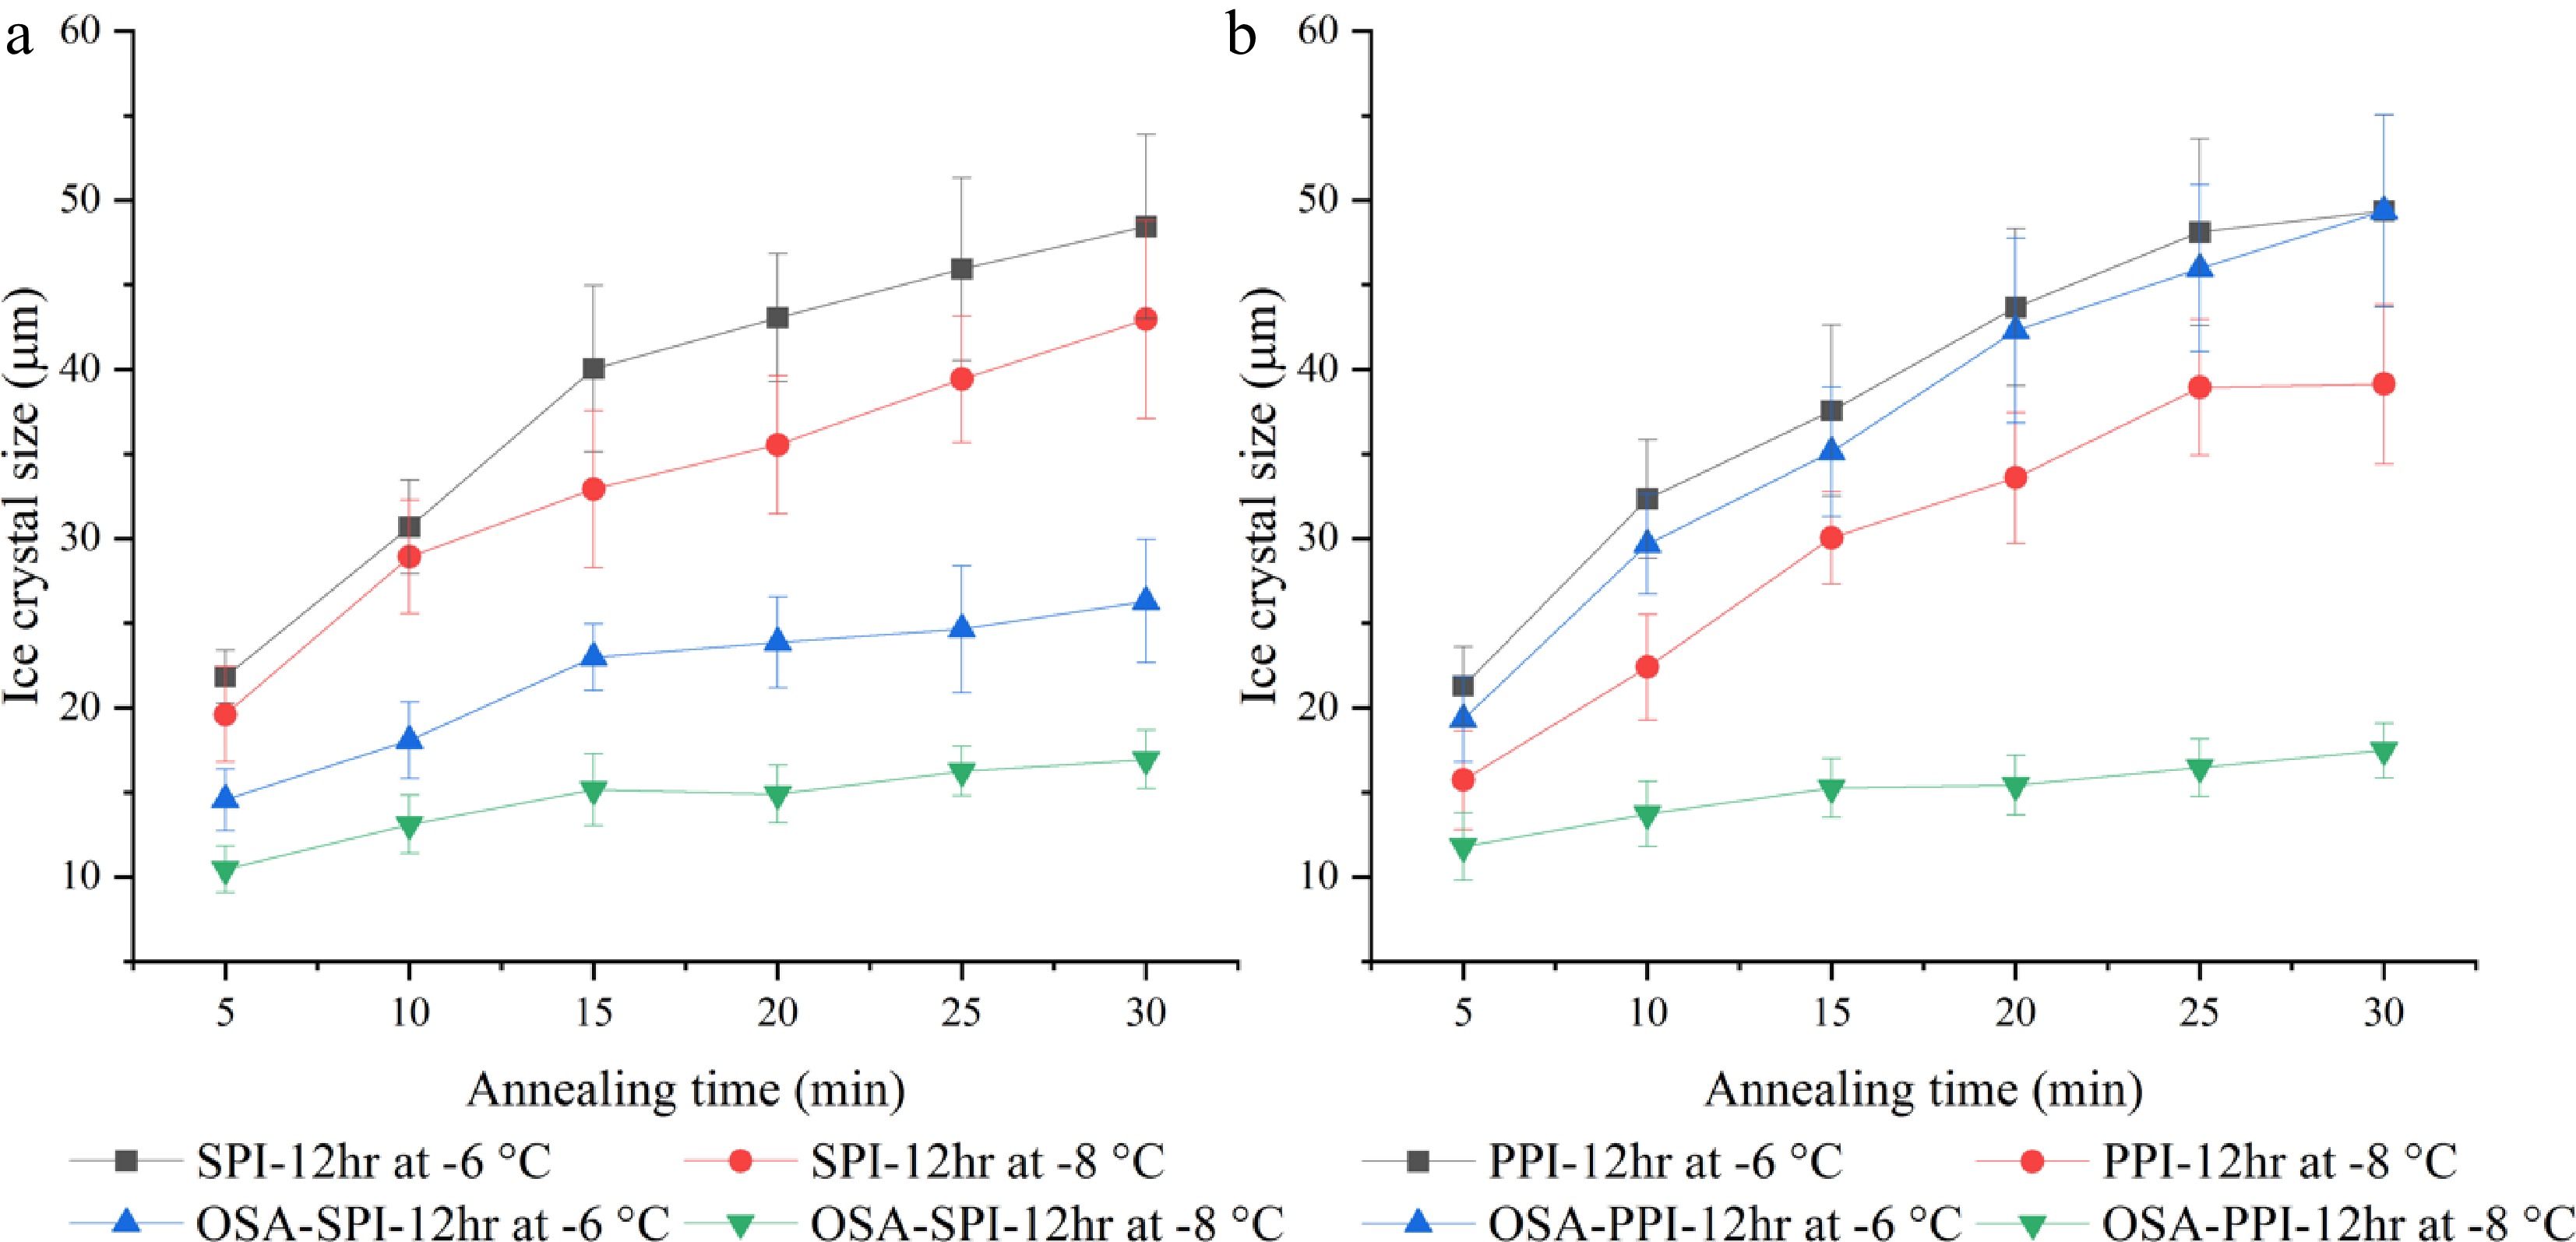
Figure 7.
Ice crystal growth within 30 min annealed at −8 °C and −6 °C in 4% (w/w) (a) SPI-12hr hydrolysate and OSA modified SPI-12hr, and (b) PPI-12hr hydrolysate and OSA modified PPI-12hr.
-
Amino acids Egg white protein Bovine bones gelatin Whey protein Casein protein Soy protein Pea protein Threonine 4.75 1.77 6.87 4.05 3.60 3.70 Alanine 8.93 8.69 5.55 2.76 4.10 4.40 Asparagine 10.08 4.20 9.18 7.57 11.60 11.50 Proline 4.25 12.54 6.66 9.33 5.60 5.00 Total 28.01 27.2 28.26 23.71 24.9 24.6 -
Sample Ice crystal diameter
(μm) −8 °CIce crystal diameter
(μm) −6 °CPEG 46.13a 48.43a SPI-12hr 42.95b 48.45a OSA-SPI-12hr 16.93d 26.29b PPI-12hr 39.12c 49.37a OSA-PPI-12hr 17.47d 49.37a Same superscript indicates no significant difference (p > 0.05) within the same column. Table 2.
Ice crystal size of 4% legume protein (SPI and PPI) hydrolysates and their derivatives (OSA-modified) under annealing temperatures of −8 and −6 °C with 4% PEG as negative control.
-
Sample Surface hydrophobicity SPI-12hr 6685b OSA-SPI-12hr 6196b PPI-12hr 7123b OSA-PPI-12hr 9134a Same superscript indicates no significant difference (p > 0.05) among samples. Table 3.
Surface hydrophobicity of SPI and PPI hydrolysates and their OSA modified products.
Figures
(7)
Tables
(3)