-
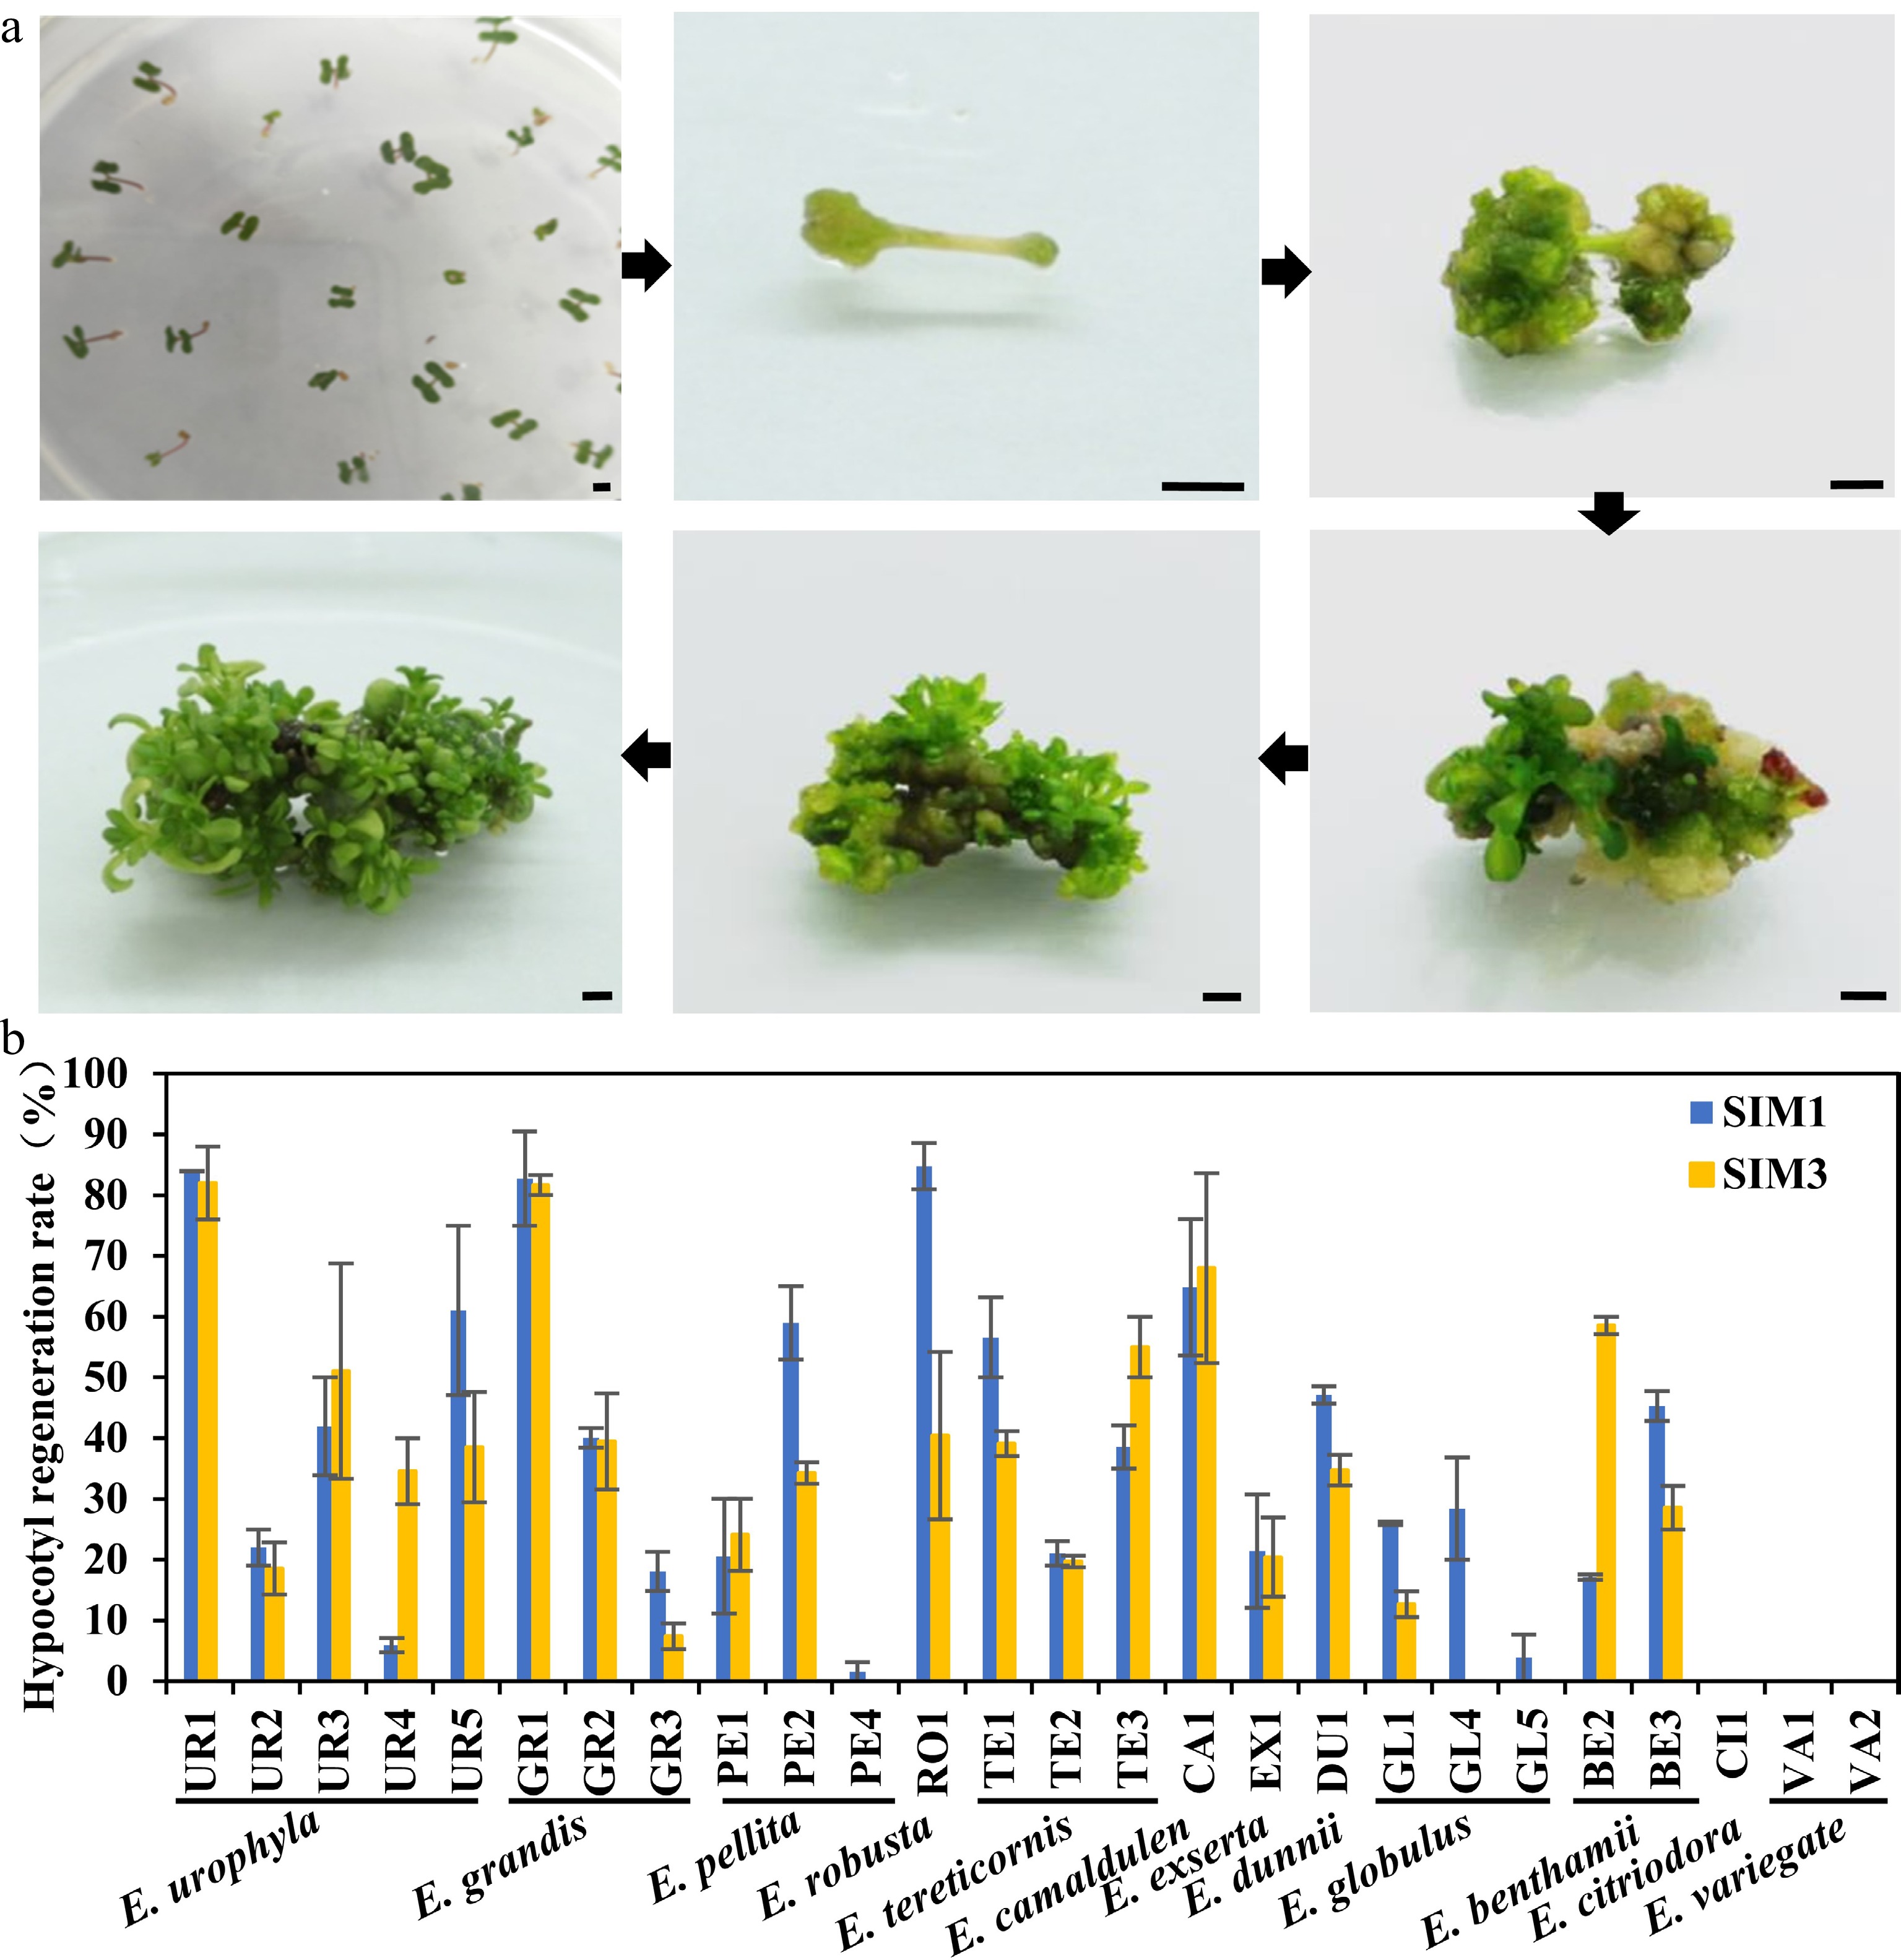
Figure 1.
Regeneration efficiency of different eucalypt species and genotypes using seeding hypocotyl as explants. (a) Representative image of hypocotyl explants regeneration on SIM media at different stages. Photo were taken every other week. Bar = 2 mm. (b) Regeneration efficiency was recorded based on the regeneration ratio. The regeneration rate is defined as a/b × 100%, where a is the number of explants forming shoots after four weeks of screening, and b is the number of explants before the screening. Data shown are mean values from two biological replicates. Error bars ± SE.
-
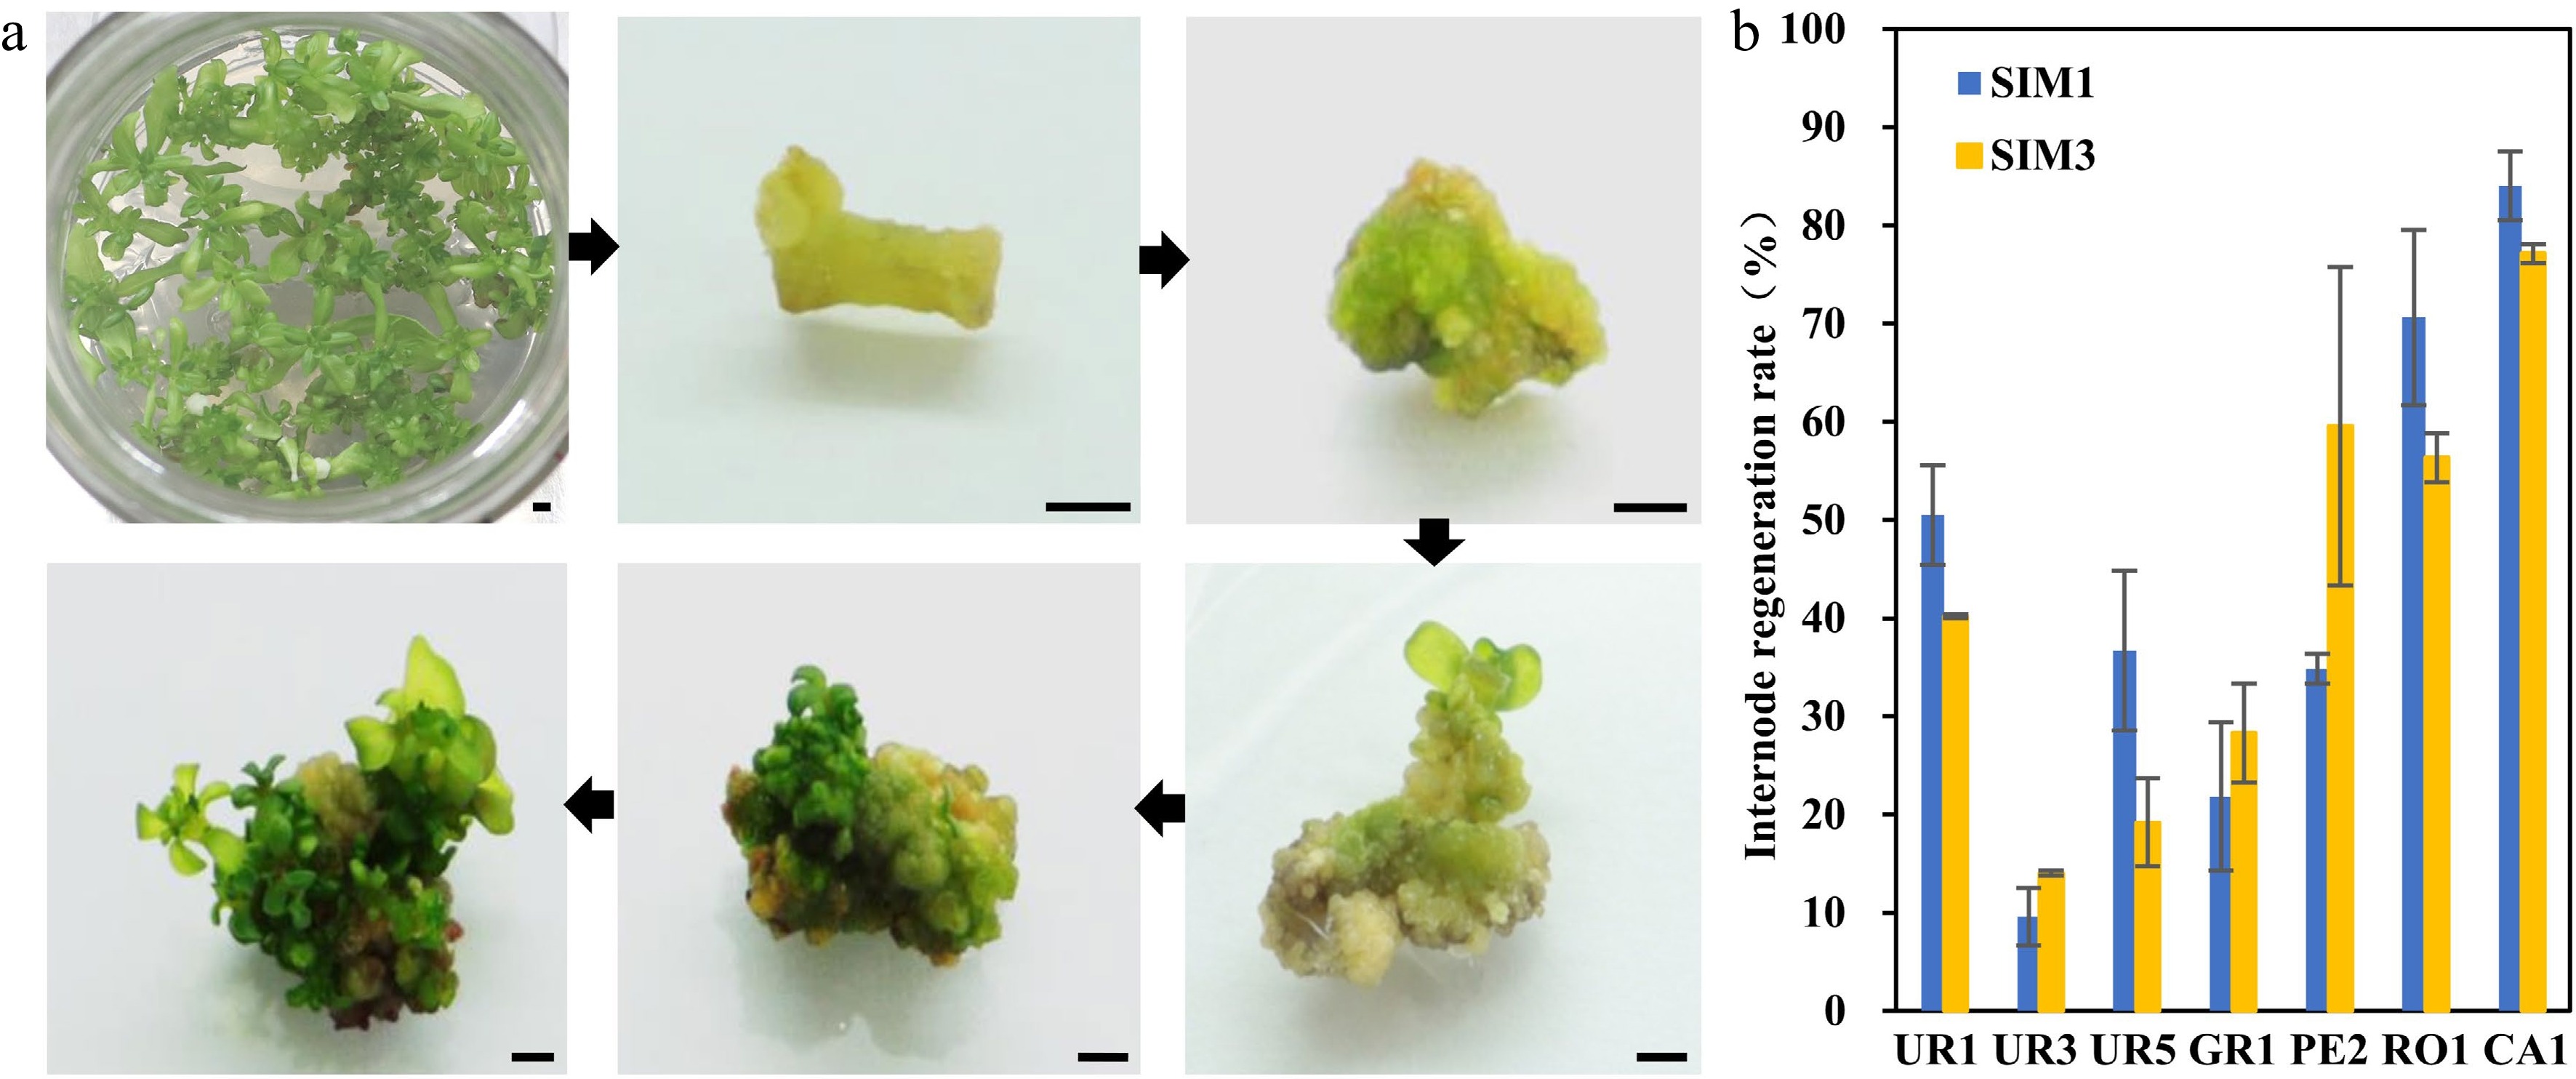
Figure 2.
Regeneration efficiency of different eucalyptus species and genotypes using clonal internode as explants. (a) Representative image of clonal internode explants regeneration on SIM media at different stages. Photos were taken every other week. Bar = 2 mm. (b) Regeneration efficiency was recorded based on the regeneration ratio. The regeneration rate is defined as a/b × 100%, where a is the number of explants forming shoots after four weeks of screening, and b is the number of explants before the screening. Data shown are mean values from two biological replicates. Error bars ± SE.
-
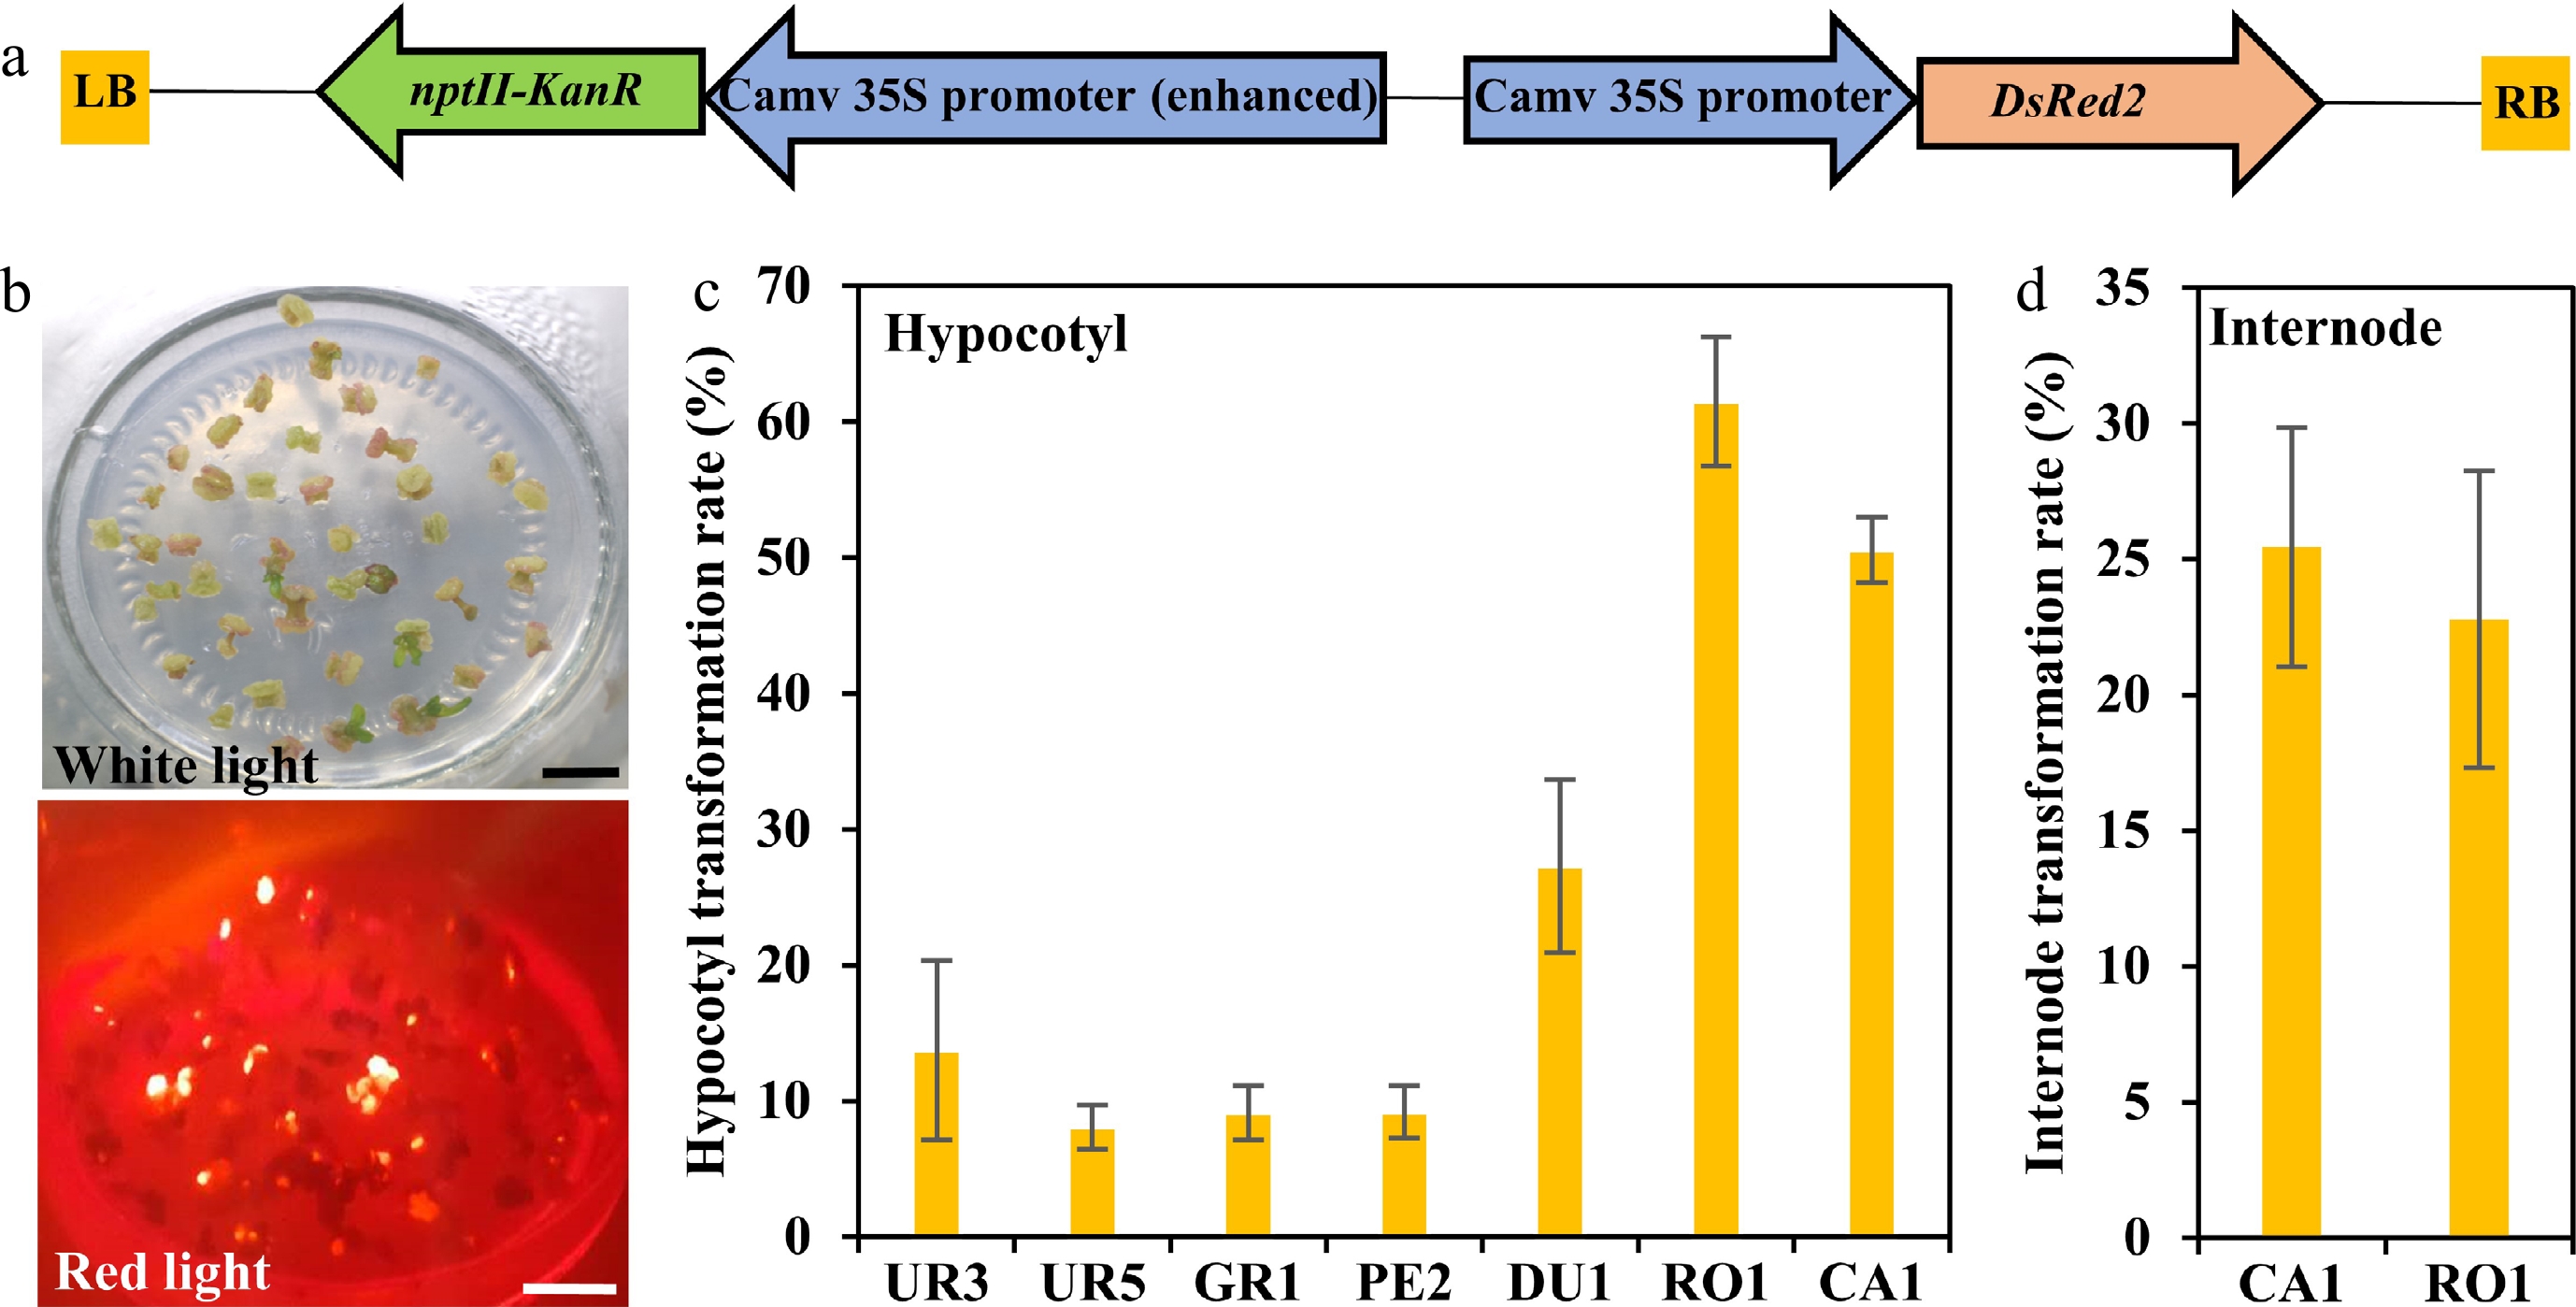
Figure 3.
Transformation efficiency of different eucalyptus species and genotypes. (a) T-DNA region of pCAMBIA2300::35S::DsRed2 vector for genetic transformation. The chimeric neomycin phosphotransferase II (NPT II) selection marker and the reporter gene DsRed2 were driven by cauliflower mosaic virus 35S promoter. LB and RB indicate T-DNA left and right border, respectively. Arrows indicate the direction of transcription. (b) Fluorescence observation of callus. Callus induction one month after Agrobacterium infection were observed at white light and red light with the fluorescence stereo-microscope. Bar = 1 cm. (c), (d) Transformation efficiency calculation of different eucalyptus species and genotypes using seeding hypocotyl and clonal internode as explants, respectively. Transformation efficiency was recorded based on the fluorescence callus of each explant. The transformation rate is defined as a/b × 100%, where a is the number of explants having fluorescence callus after one month of screening, and b is the total number of explants. Data shown are mean values from two biological replicates. Error bars ± SE.
-
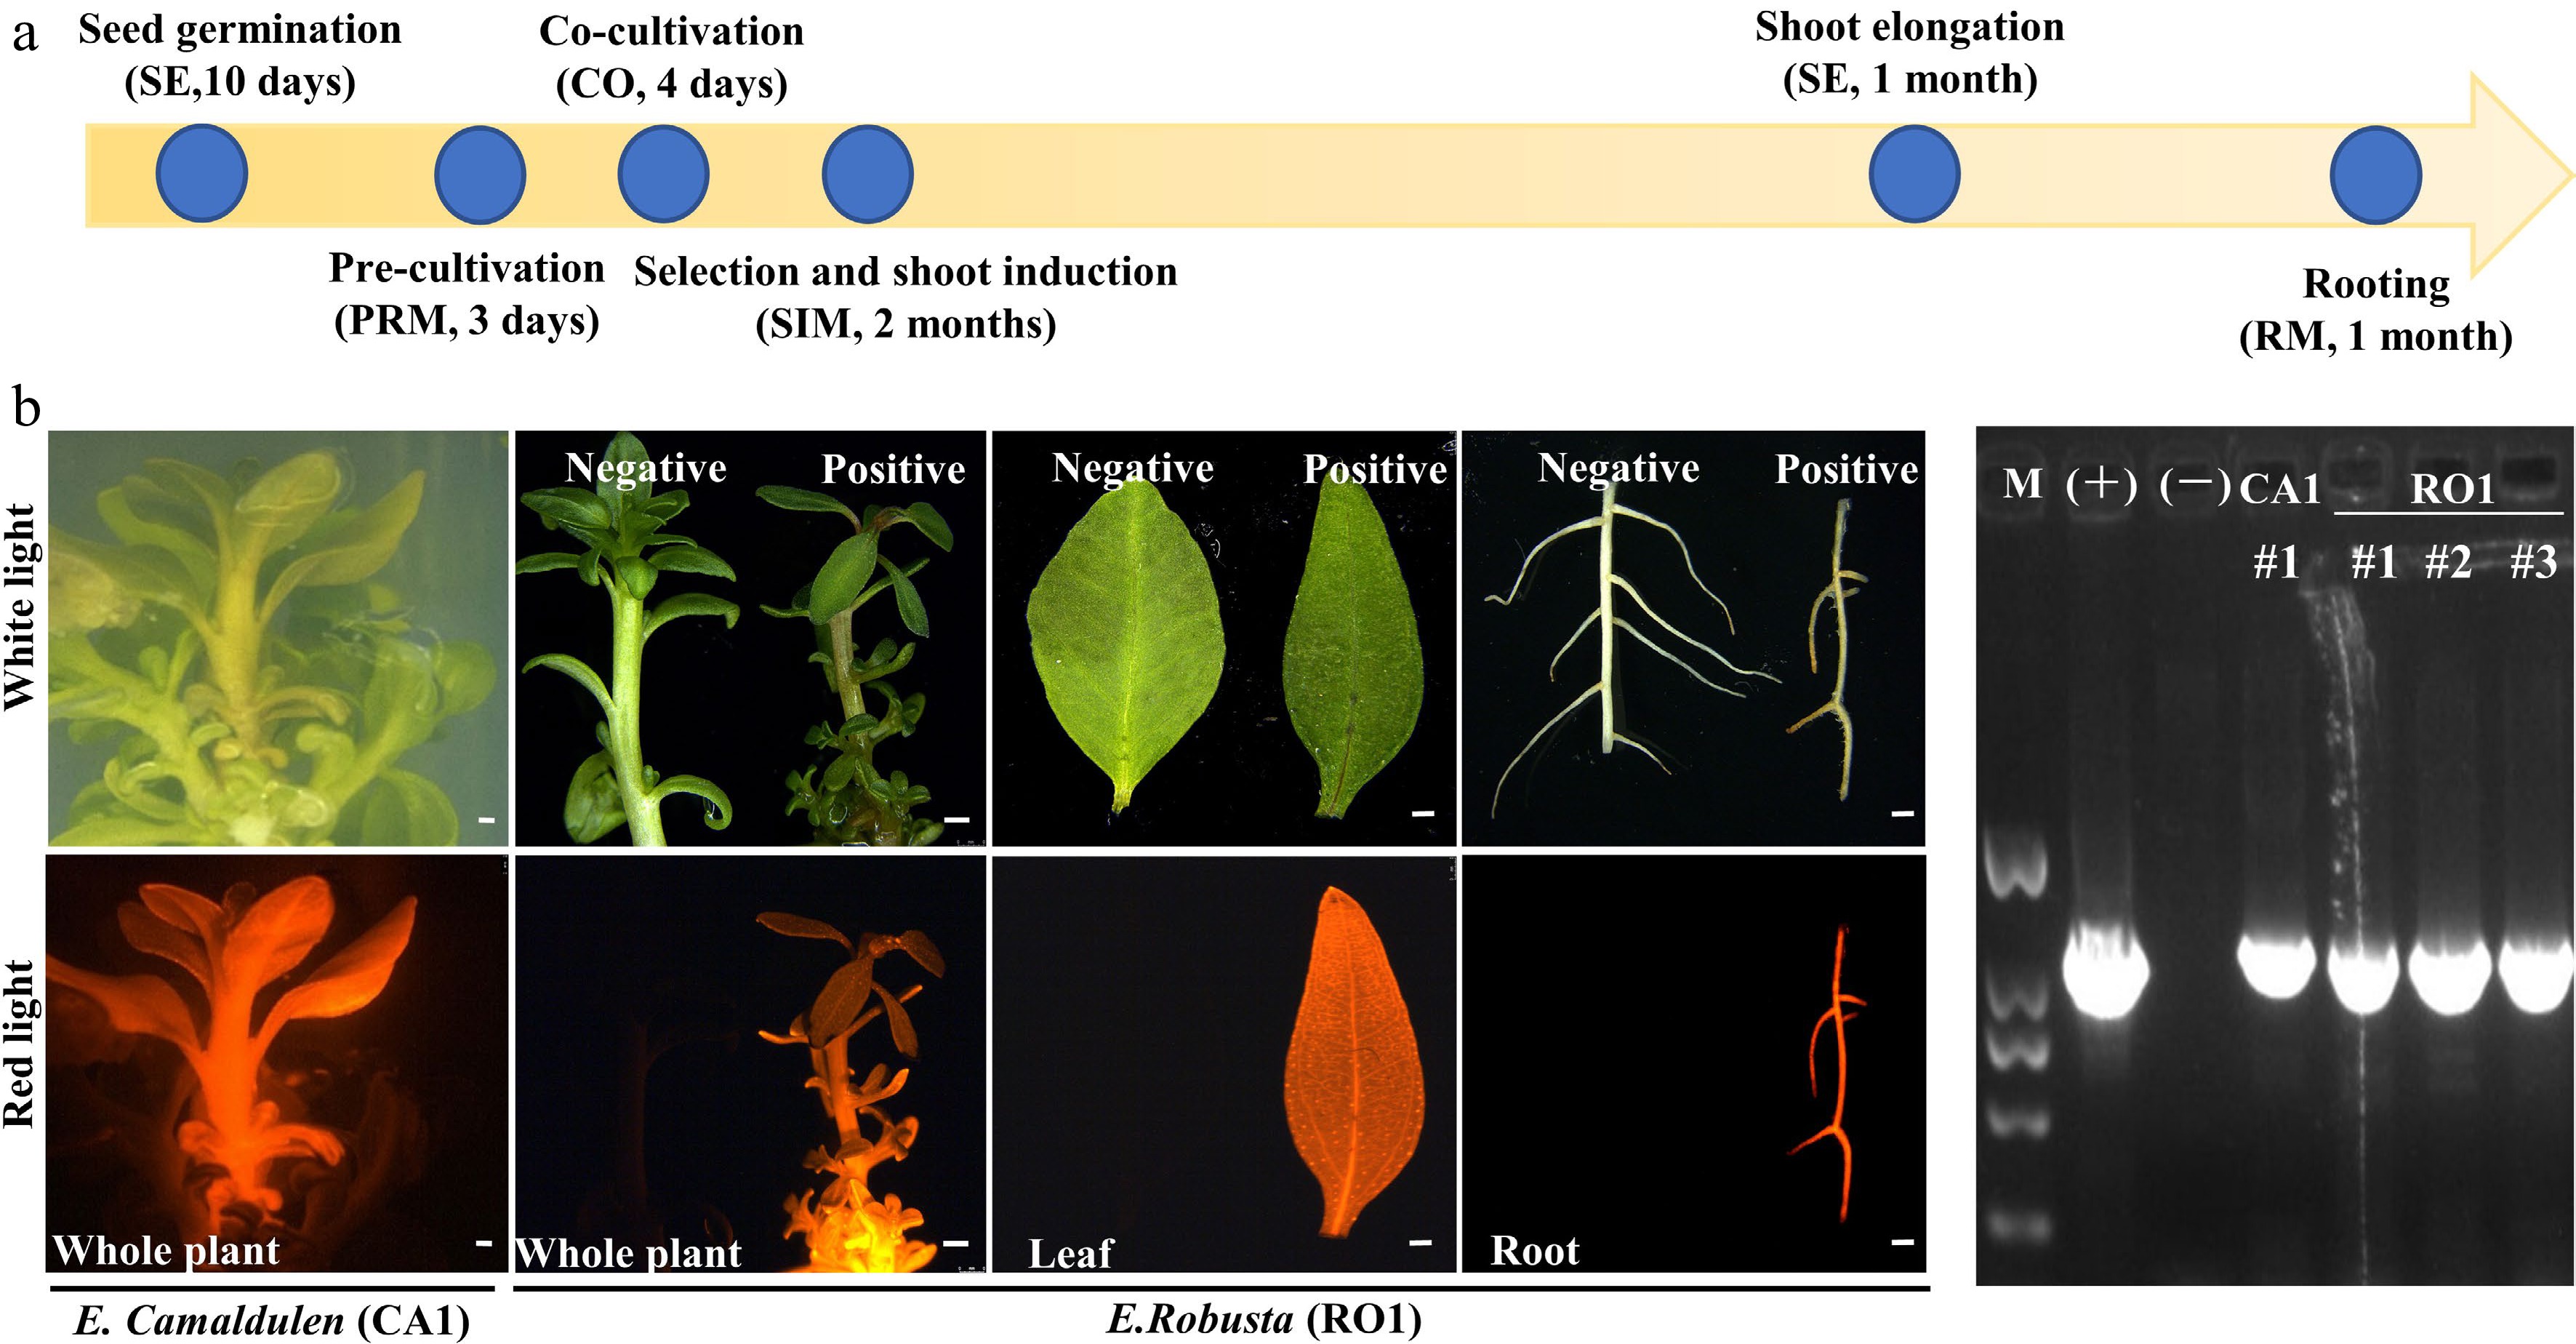
Figure 4.
Agrobacterium-mediated eucalyptus genic transformation with DsRed2 as reporter gene. (a) Flow diagram for agrobacterium-mediated eucalyptus genic transformation. The yellow arrow represents the process direction of transformation. The blue circles with notes represent important transformation steps and time required (the media information of each step is listed in Supplemental Table S2). (b) DsRed2 gene expression in different tissue and organs in transgenic plants. Photos were taken at white light and red light with the fluorescence stereo-microscope. E. robusta (RO1) plants that untransformed were used as a negative control (Negative). Successful transformed plants were marked with Positive. Bar = 1 mm. (c) Positive test of DsRed2 transgenic plants using PCR amplification. M, DNA marker; (+), Positive control with transformation vector as the PCR template; (−), wild type plants; CA1 and RO1, genotypes of E. camaldulen and E. robusta respectively used for transformation donor in this study. The number represents the independent transgenic line.
-
Species Clone SIM1 SIM3 Total Shoot induction Regeneration efficiency (%) Differentiation amount Total Shoot induction Regeneration efficiency (%) Differentiation amount E.urophylla UR1 81 68 83.96 ± 0.04a *** 50 41 82.00 ± 6.00a *** UR2 41 9 22.02 ± 2.98ghi * 56 11 18.57 ± 4.29ijkl * UR3 78 29 41.94 ± 8.06def *** 67 28 51.04 ± 17.71bcde *** UR4 35 2 5.95 ± 1.19ijk * 44 15 34.58 ± 5.42efghi ** UR5 33 20 61.03 ± 13.97bc * 38 15 38.52 ± 9.10defg * E.grandis GR1 53 43 82.74 ± 7.74a *** 49 40 81.67 ± 1.67a ** GR2 87 35 40.06 ± 1.60def ** 38 47 39.47 ± 7.89cdef * GR3 162 28 18.08 ± 3.23hij * 80 6 7.39 ± 2.13kl * E.pellita PE1 28 5 20.56 ± 9.44hi ** 21 5 24.09 ± 5.91fghijk ** PE2 71 40 58.97 ± 6.03bc ** 65 22 34.25 ± 1.75efghi ** PE4 43 1 1.56 ± 1.56jk * 66 0 0.00 ± 0.00l E.robusta RO1 112 96 84.76 ± 3.81a *** 87 43 40.42 ± 13.75cdef *** E.tereticornis TE1 47 26 56.58 ± 6.58bcd *** 44 17 39.11 ± 2.07defg ** TE2 60 13 21.06 ± 2.01hi ** 61 12 19.72 ± 0.97hijk * TE3 39 15 38.55 ± 3.55efg ** 40 22 55.00 ± 5.00bcd *** E.camaldulen CA1 102 65 64.83 ± 11.26b *** 76 57 68.01 ± 15.63ab *** E.exserta EX1 85 20 21.45 ± 9.32hi * 62 12 20.41 ± 6.52ghijk ** E.dunnii DU1 186 88 47.13 ± 1.45cde ** 192 67 34.74 ± 2.52efghi ** E.globulus GL1 54 14 26.02 ± 0.30fgh * 65 8 12.67 ± 2.14jkl * GL4 107 31 28.42 ± 8.42fgh * 99 0 0.00 ± 0.00l GL5 98 5 3.85 ± 3.85jk * 92 0 0.00 ± 0.00l E.benthamii BE2 190 33 17.12 ± 0.45hij ** 27 16 58.57 ± 1.43bc ** BE3 79 36 45.29 ± 2.44cde *** 88 26 28.57 ± 3.57fghij ** E.citriodora CI1 122 0 0.00 ± 0.00k 92 0 0.00 ± 0.00l E.variegate VA1 123 0 0.00 ± 0.00k 109 0 0.00 ± 0.00l VA2 125 0 0.00 ± 0.00k 116 0 0.00 ± 0.00l Mean values of two independent experiments ( ± ) with standard errors. Values with the same letter within columns are not significantly different according to Duncan’s Multiple Range Test (DMRT) at a 5% level. Shoots number of each explant were counted and classified (*, < five shoots; five shoots < ** < ten shoots; ***, > ten shoots). Table 1.
Regeneration rate of shoots induced by hypocotyl as explants in different eucalyptus species or genotypes.
-
Species Clone SIM1 SIM3 Total Shoot induction Regeneration efficiency (%) Differentiation amount Total Shoot induction Regeneration efficiency (%) Differentiation amount E.urophylla UR1 80 40 50.51 ± 5.05b *** 92 37 40.19 ± 0.19bc ** UR3 46 4 9.58 ± 2.92d ** 36 5 14.04 ± 0.25d * UR5 57 21 36.70 ± 8.13bc * 71 14 19.20 ± 4.49cd * E.grandis GR1 41 11 21.85 ± 7.56cd ** 49 12 28.29 ± 5.04cd *** E.pellita PE2 70 24 34.85 ± 1.52bc ** 63 38 59.55 ± 16.21ab ** E.robusta RO1 125 85 70.63 ± 8.91a ** 111 64 56.33 ± 2.49ab *** E.camaldulen CA1 117 97 84.01 ± 3.49a *** 74 57 77.16 ± 0.97a ** Mean values of two independent experiments ( ± ) with standard errors. Values with the same letter within columns are not significantly different according to Duncan's Multiple Range Test (DMRT) at a 5% level. Shoots number of each explant were counted and classified (*, < five shoots; five shoots < ** < ten shoots; ; ***, > ten shoots). Table 2.
Regeneration rate of shoots induced by stem segments as explants in different eucalypt species or genotypes.
-
Species Clone Explant Total Red fluorescence Transformation efficiency (%) E. robusta RO1 Hypocotyl 177 89 61.48 + 4.76a E. camaldulen CA1 Hypocotyl 71 31 50.55 + 2.40a CA2 Hypocotyl 63 19 29.68 + 2.76b E. dunnii DU1 Hypocotyl 159 45 27.30 + 6.40 E. urophylla UR3 Hypocotyl 73 13 13.75 + 6.60c UR4 Hypocotyl 93 8 8.07 + 1.62c E. pellita PE2 Hypocotyl 73 6 9.19 + 1.92c E. grandis GR1 Hypocotyl 41 4 9.13 + 1.98c E. robusta RO1 Internode 48 11 22.78 + 5.47a E. camaldulen CA1 Internode 475 124 25.46 + 4.40a Mean values of two independent experiments (±) with standard errors. Values with the same letter within columns are not significantly different according to Duncan’s Multiple Range Test (DMRT) at a 5% level. Table 3.
Transformation efficiency test of different eucalypt species by monitoring the red fluorescence rate of the callus after transformed with the reporter DsRed2.
-
Genotype Construct Explant type Explant number Positive plants Transformation efficiency (%) E. robusta (RO1) 35S::DsRed Hypocotyl 77 3 3.9 E. robusta (RO1) 35S::DsRed Hypocotyl 67 1 1.5 E. camaldulen (CA1) 35S::DsRed Hypocotyl 55 1 1.9 E. robusta (RO1) 35S::EgFT Internode 51 2 3.9 E. camaldulen (CA1) 35S::EgFT Internode 69 1 1.5 Table 4.
Transformation efficiency test of E.robusta and E.camaldulen using hypocotyl and internode as explants respectively.
Figures
(4)
Tables
(4)