-
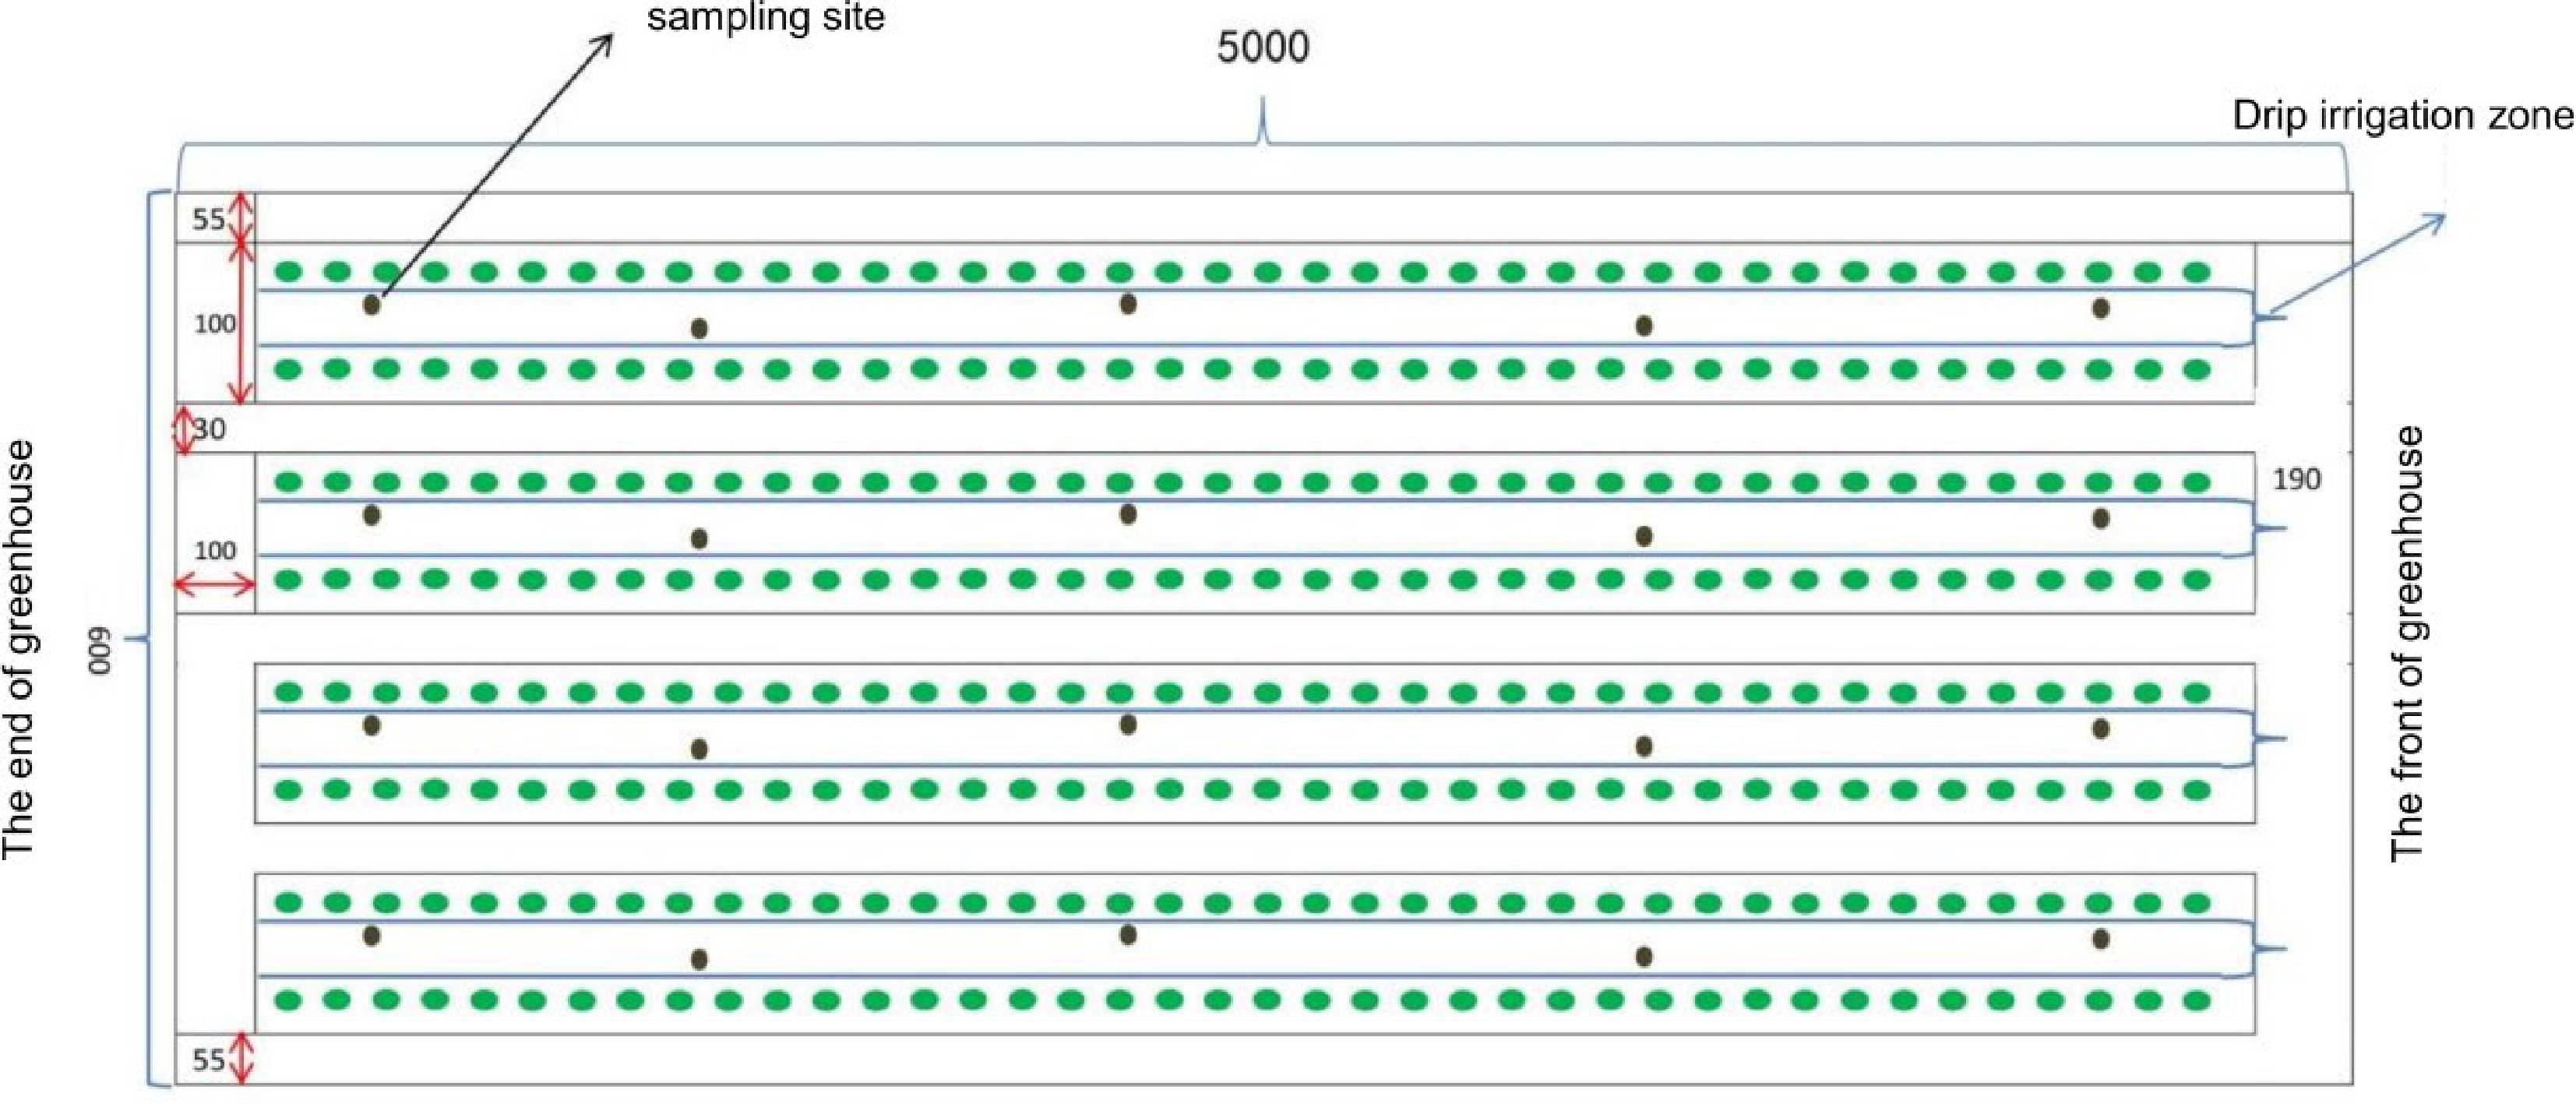
Figure 1.
Design diagram of the greenhouse cucumber plot. The green circles show the cucumber plants; the black circles show the soil sampling sites. The units of numbers in the figure are centimeters (cm).
-
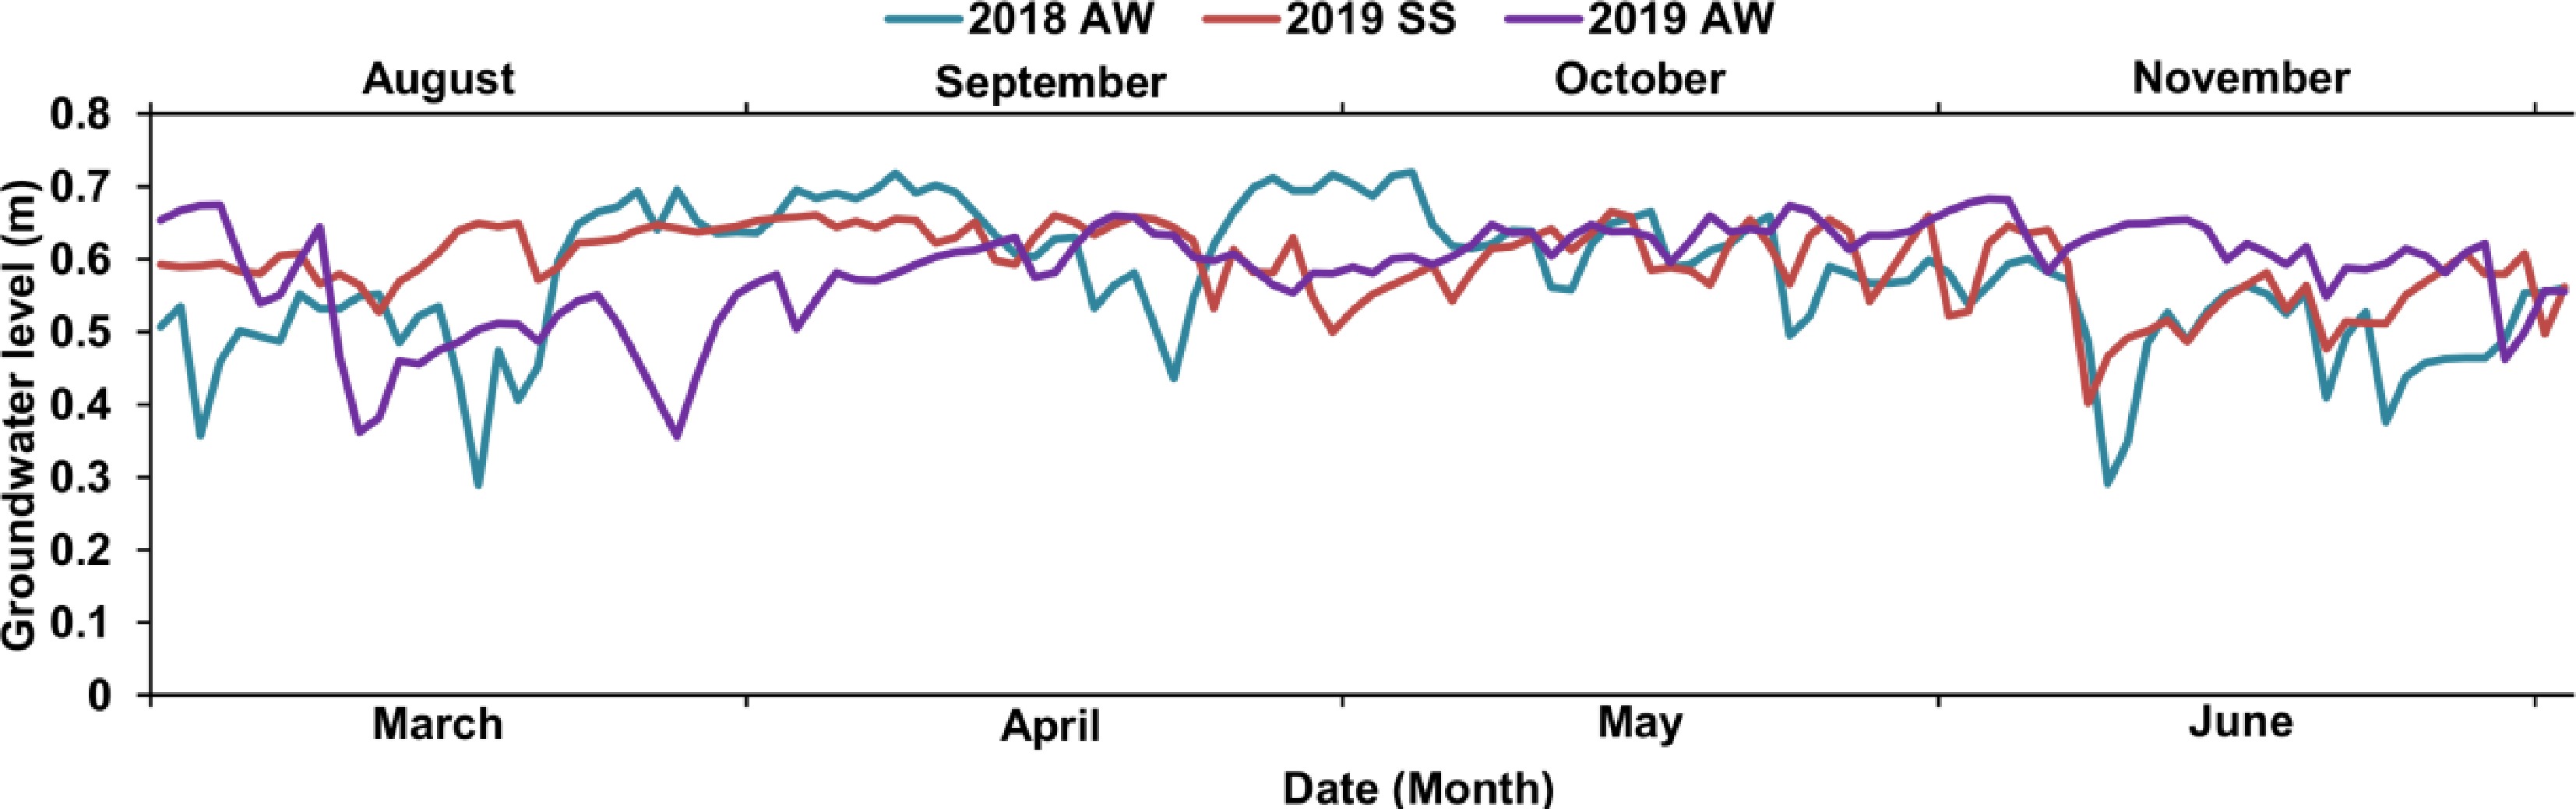
Figure 2.
The groundwater level during the experiments of 2018 AW, 2019 SS and 2019 AW.
-
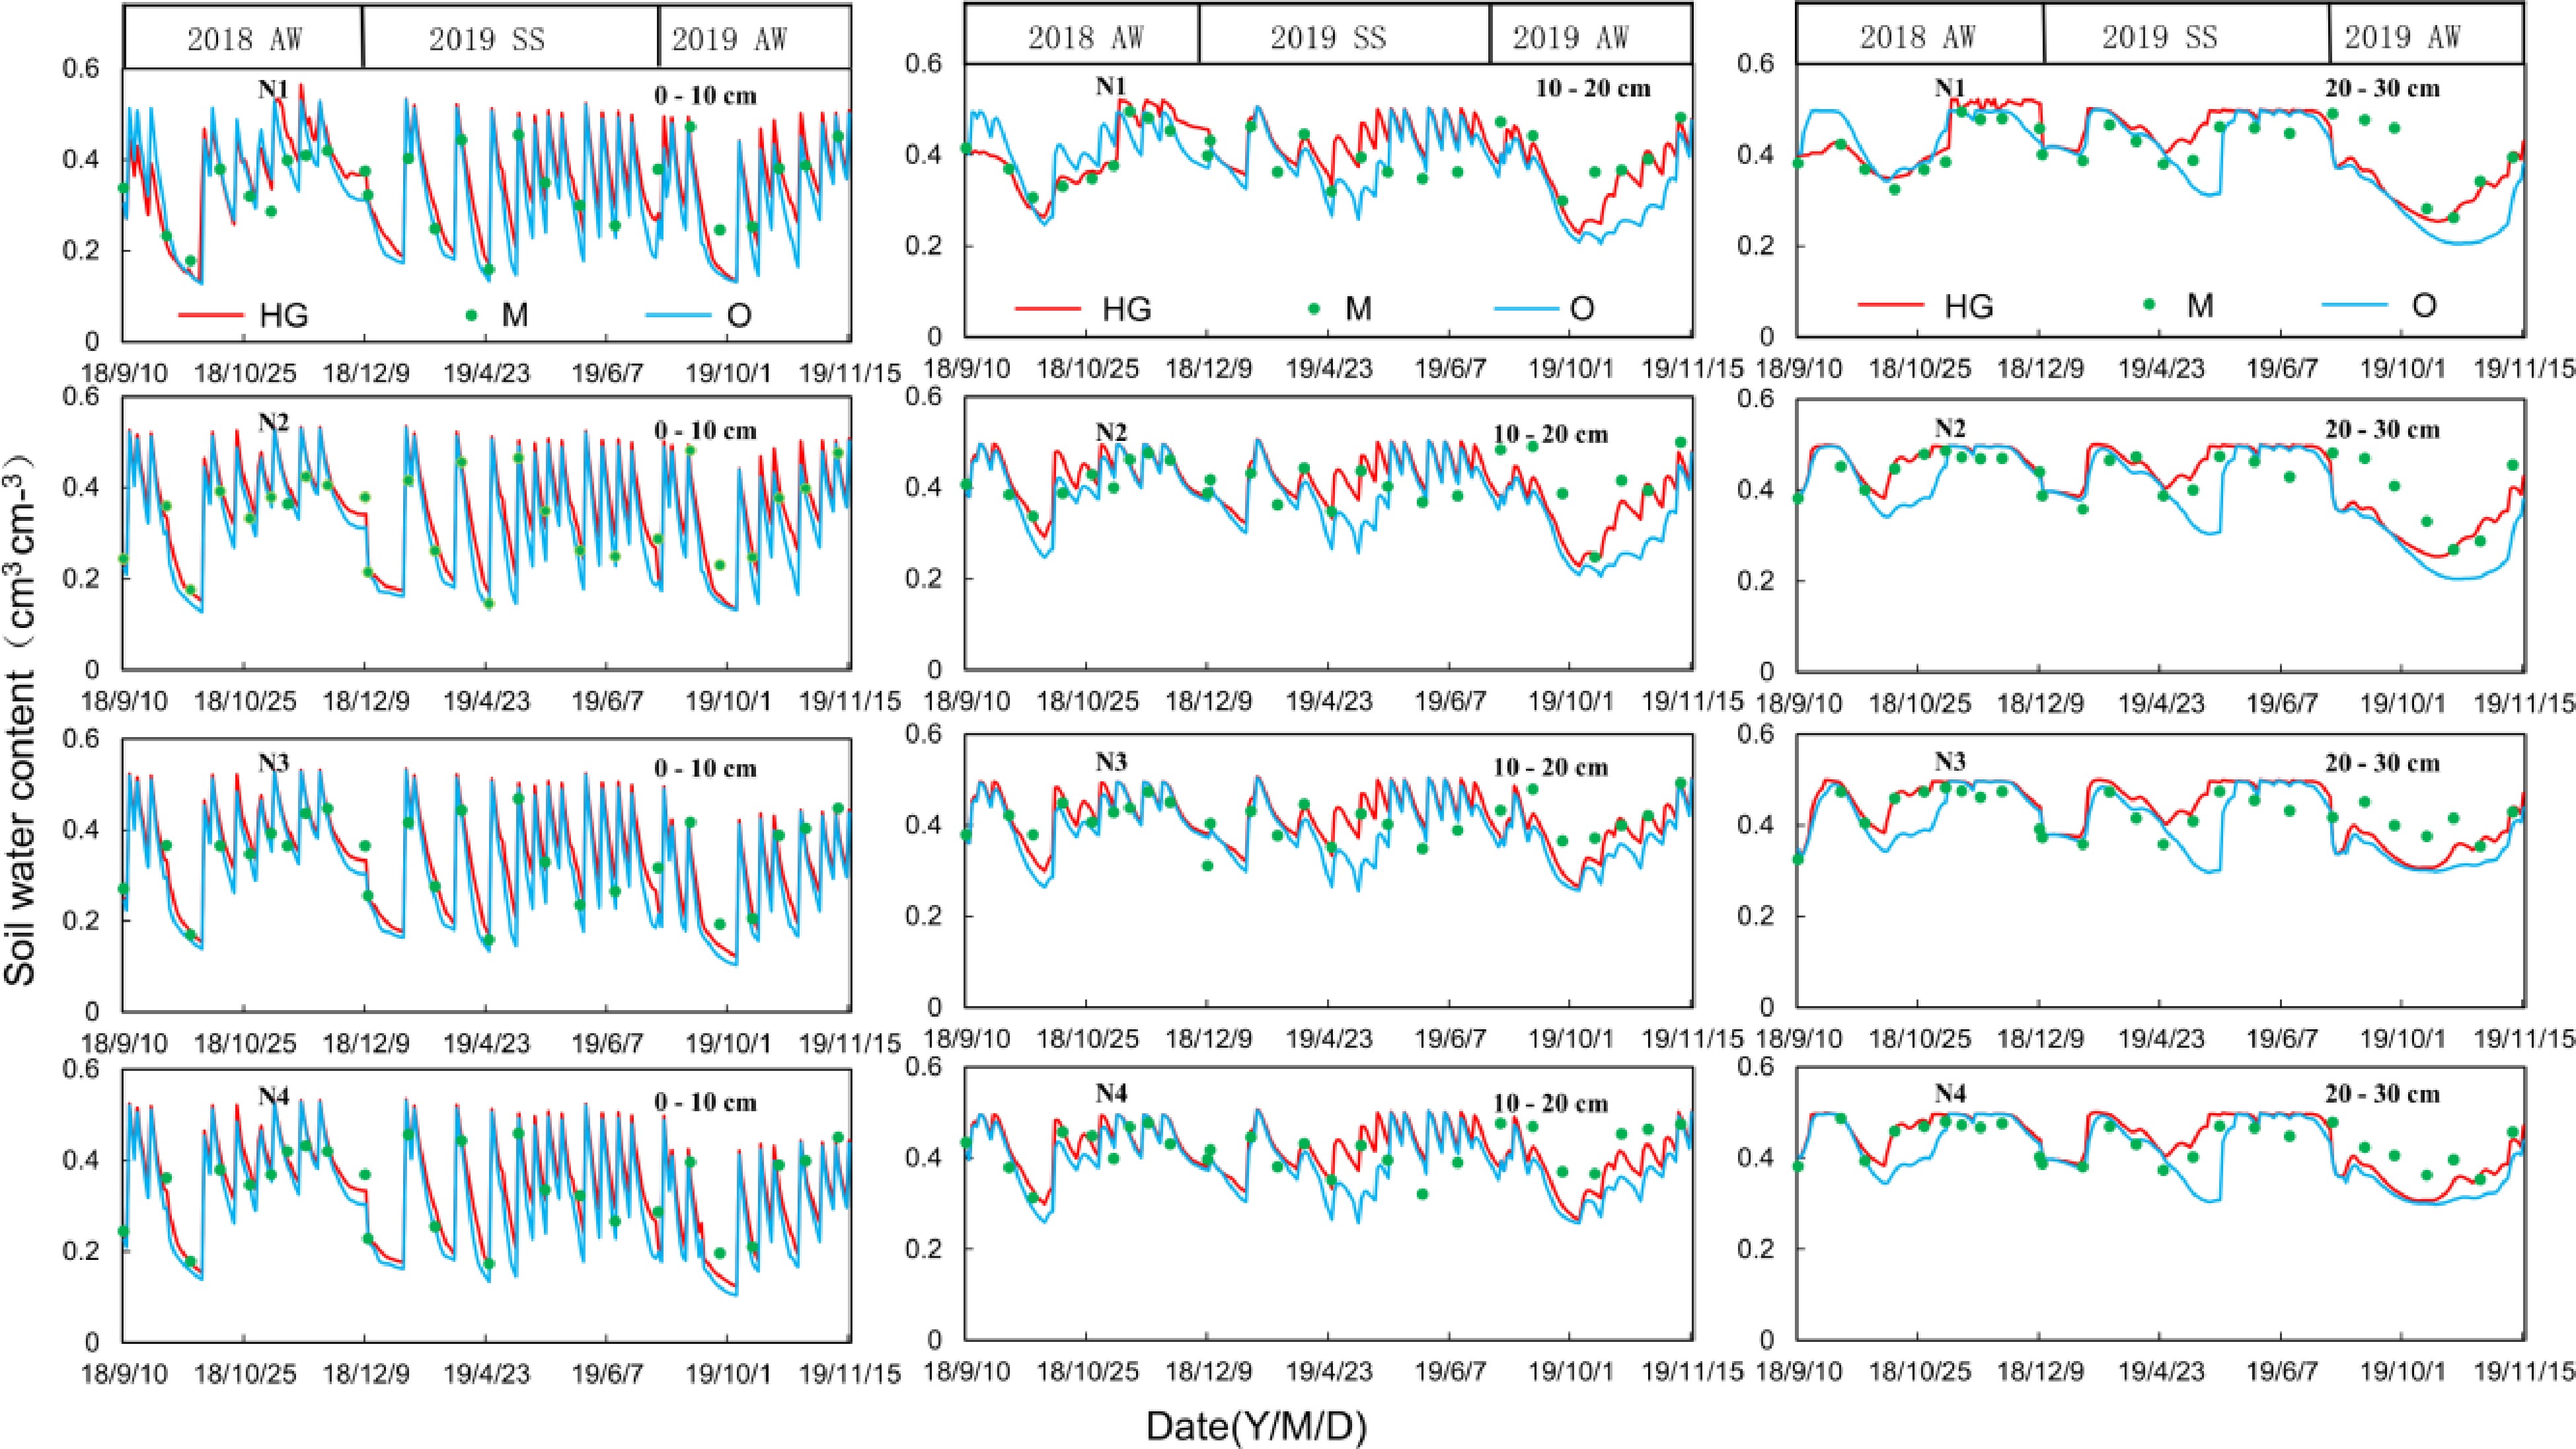
Figure 3.
The comparison between simulated and measured values of SWC in the 0–10 cm 10–20 cm and 20–30 cm soil layers. The red lines show the simulating value of the HG model (HG); the blue lines show the simulating values of the original model (O); the green dots show the measured values.
-
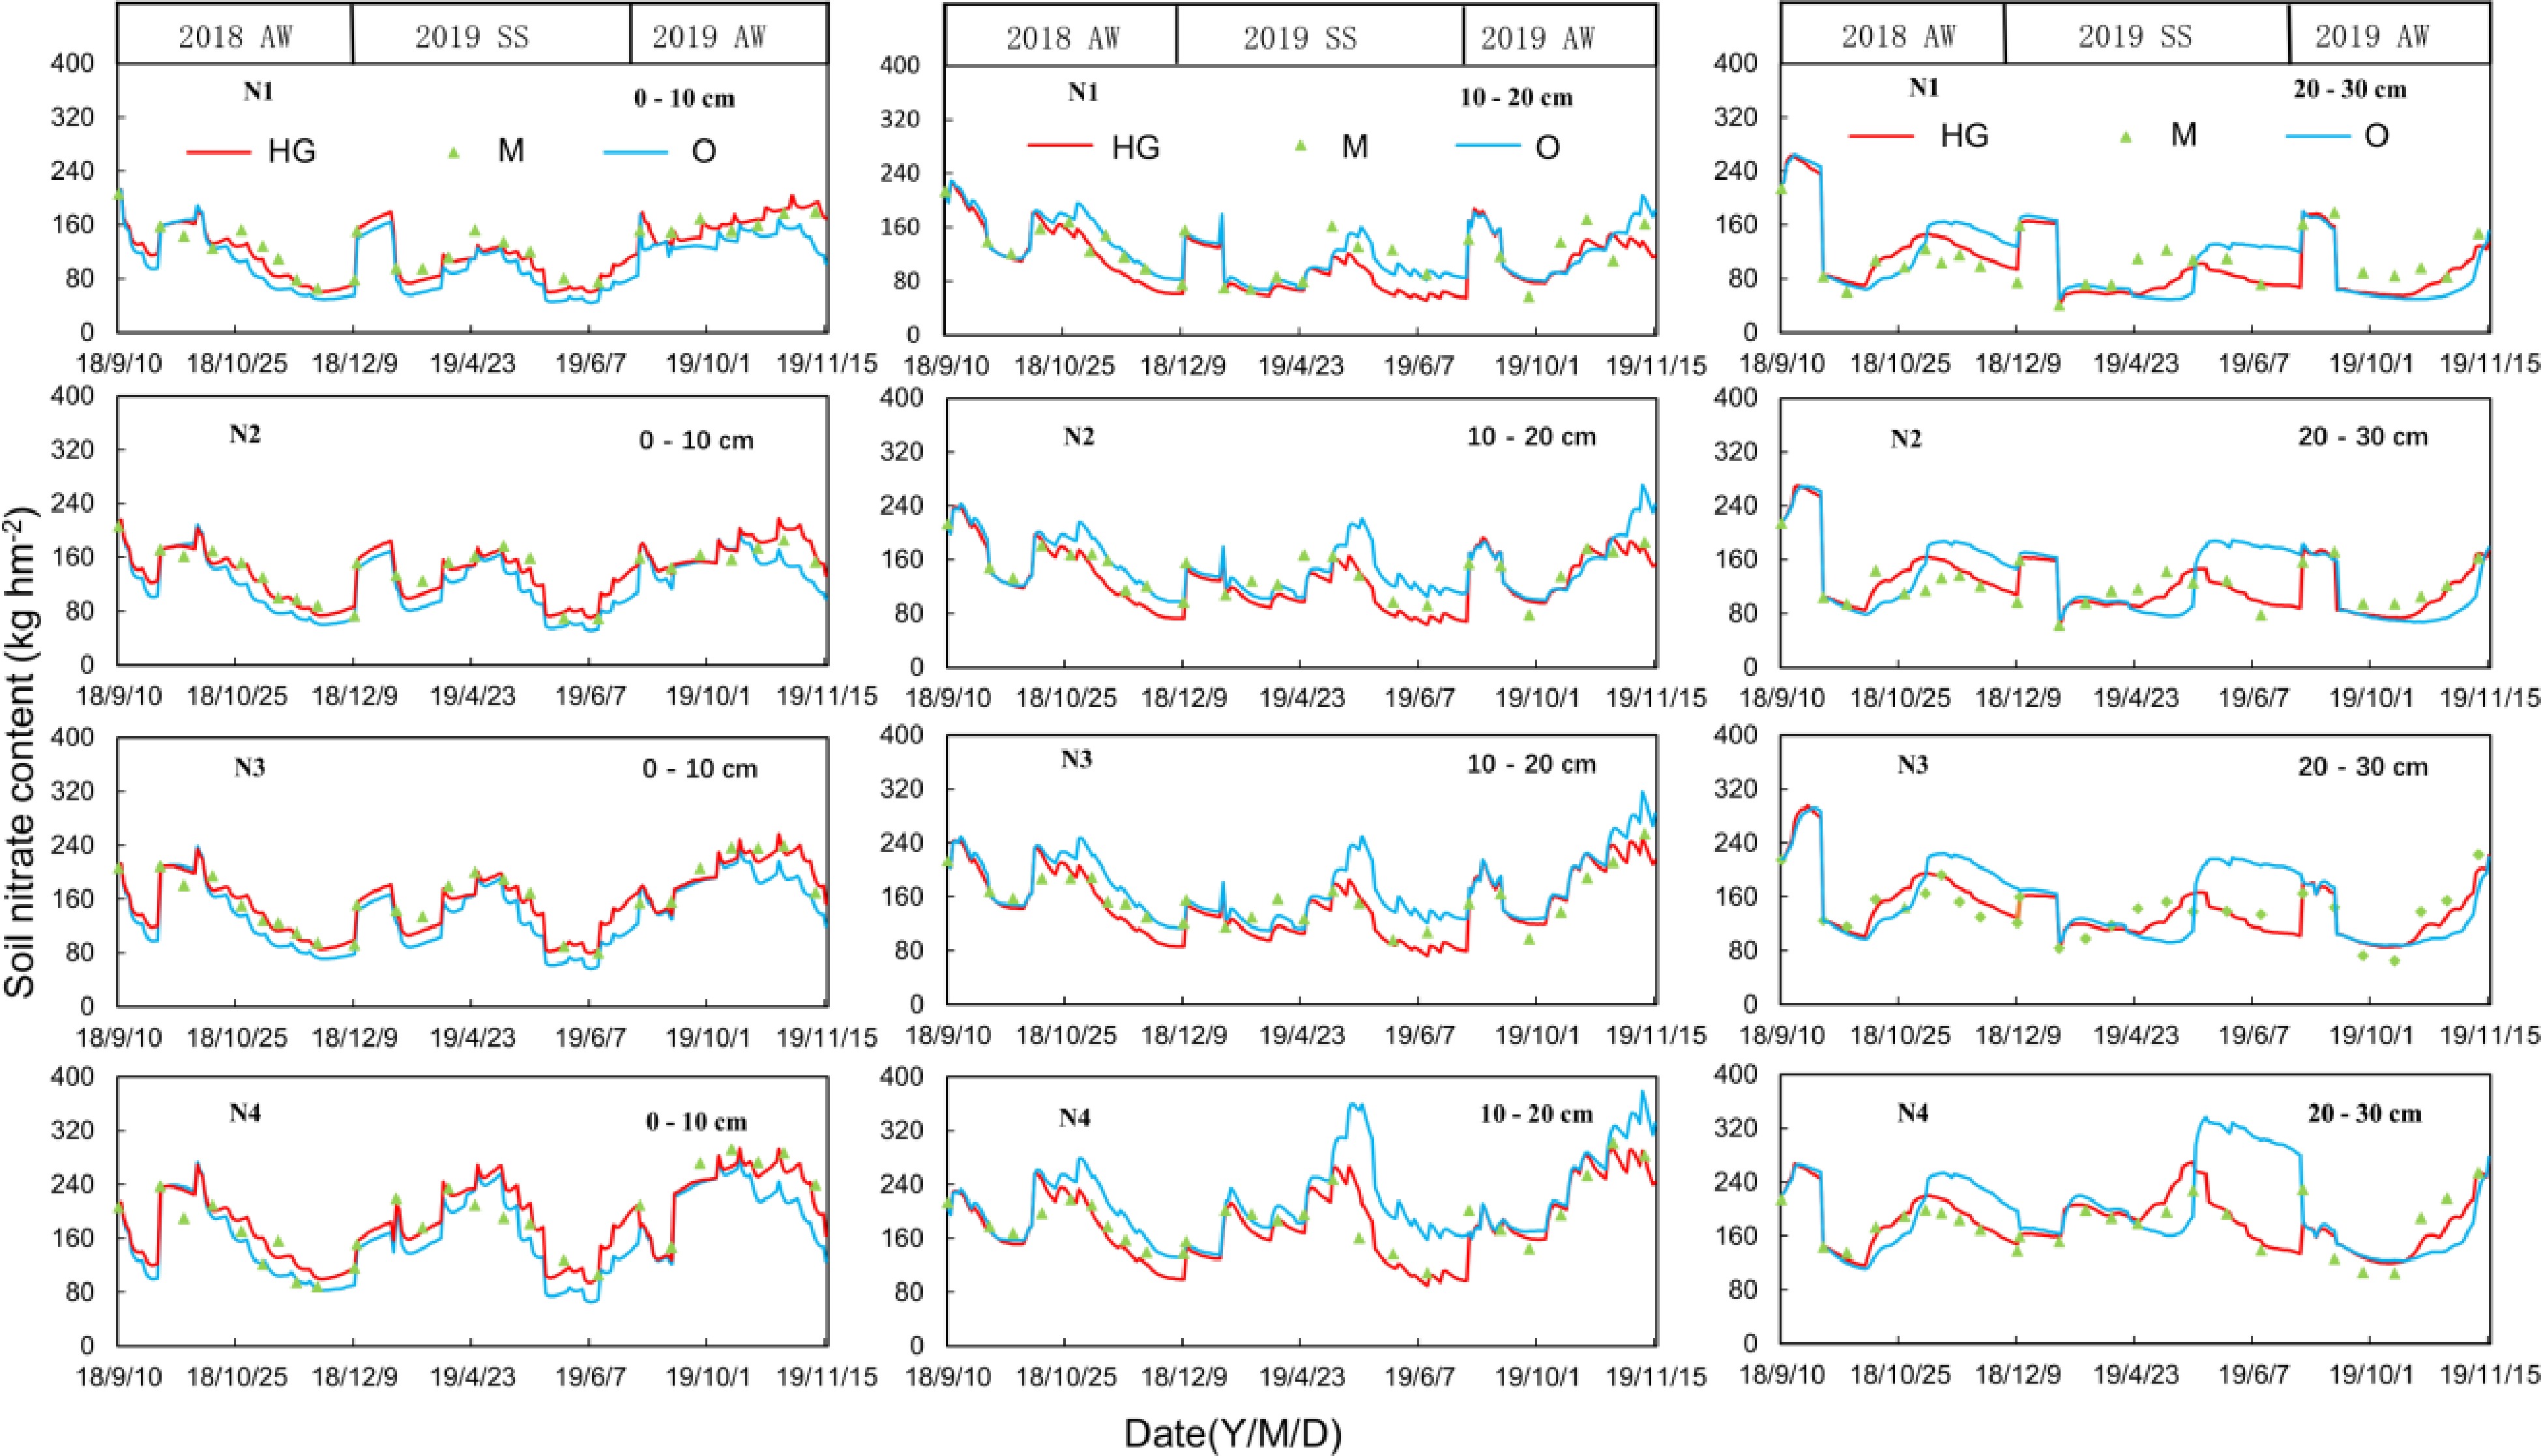
Figure 4.
The comparison between simulated and measured values of SNC in the 0–10 cm 10–20 cm and 20–30 cm soil layers. The red lines show the simulating value of the HG model (HG); the blue lines show the simulating values of the original model (O); the green dots show the measured values.
-
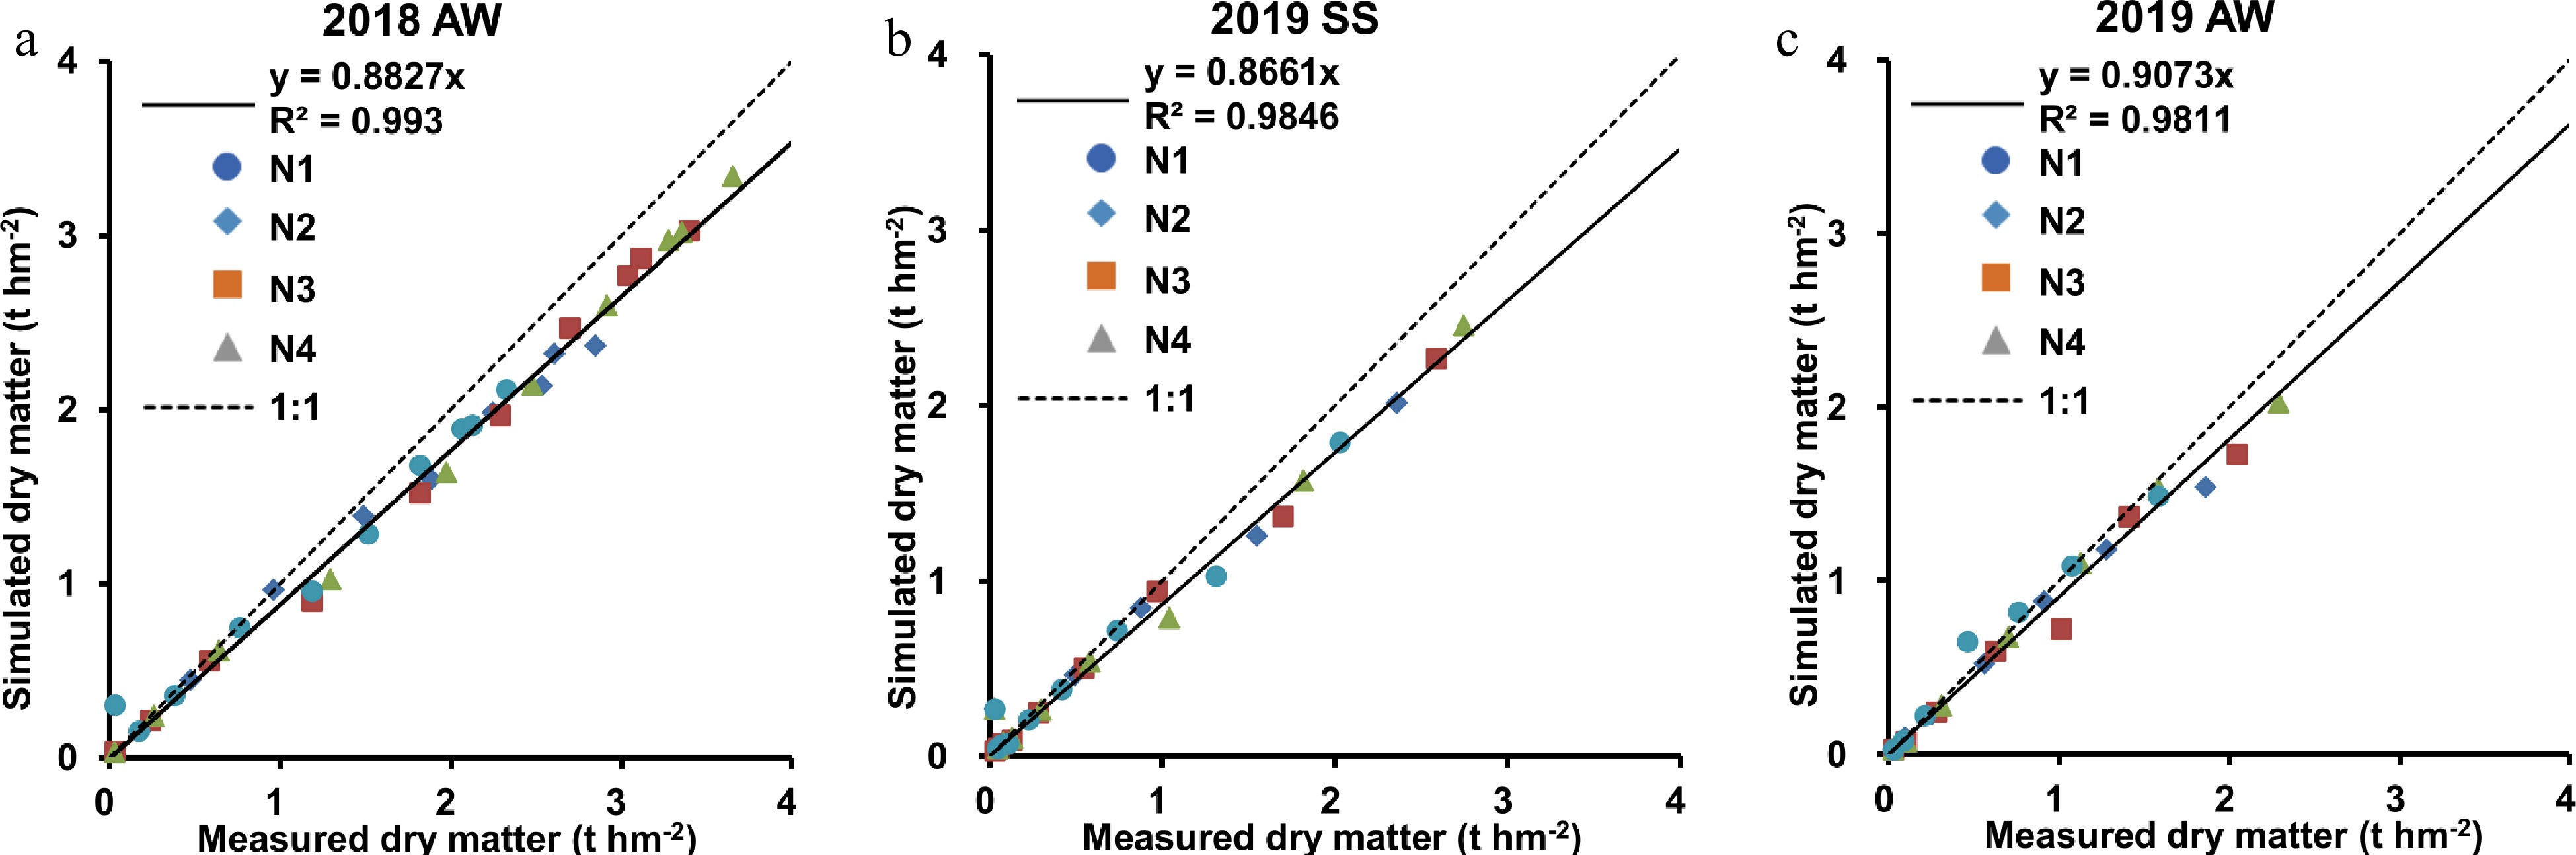
Figure 5.
Comparison between simulated and measured values of plant dry weight of two crops. The dates were collected from (a) 2018 AW, (b) 2019 SS, (c) 2019 AW treatment under N2-N4 treatments. The blue circles indicated the N1 treatments; the blue rhombus indicated the N2 treatments; the red square indicated the N3 treatments; the green triangle indicated the N4 treatments. The black line indicated the linear regression equation. The dotted lines show the 1:1 line.
-
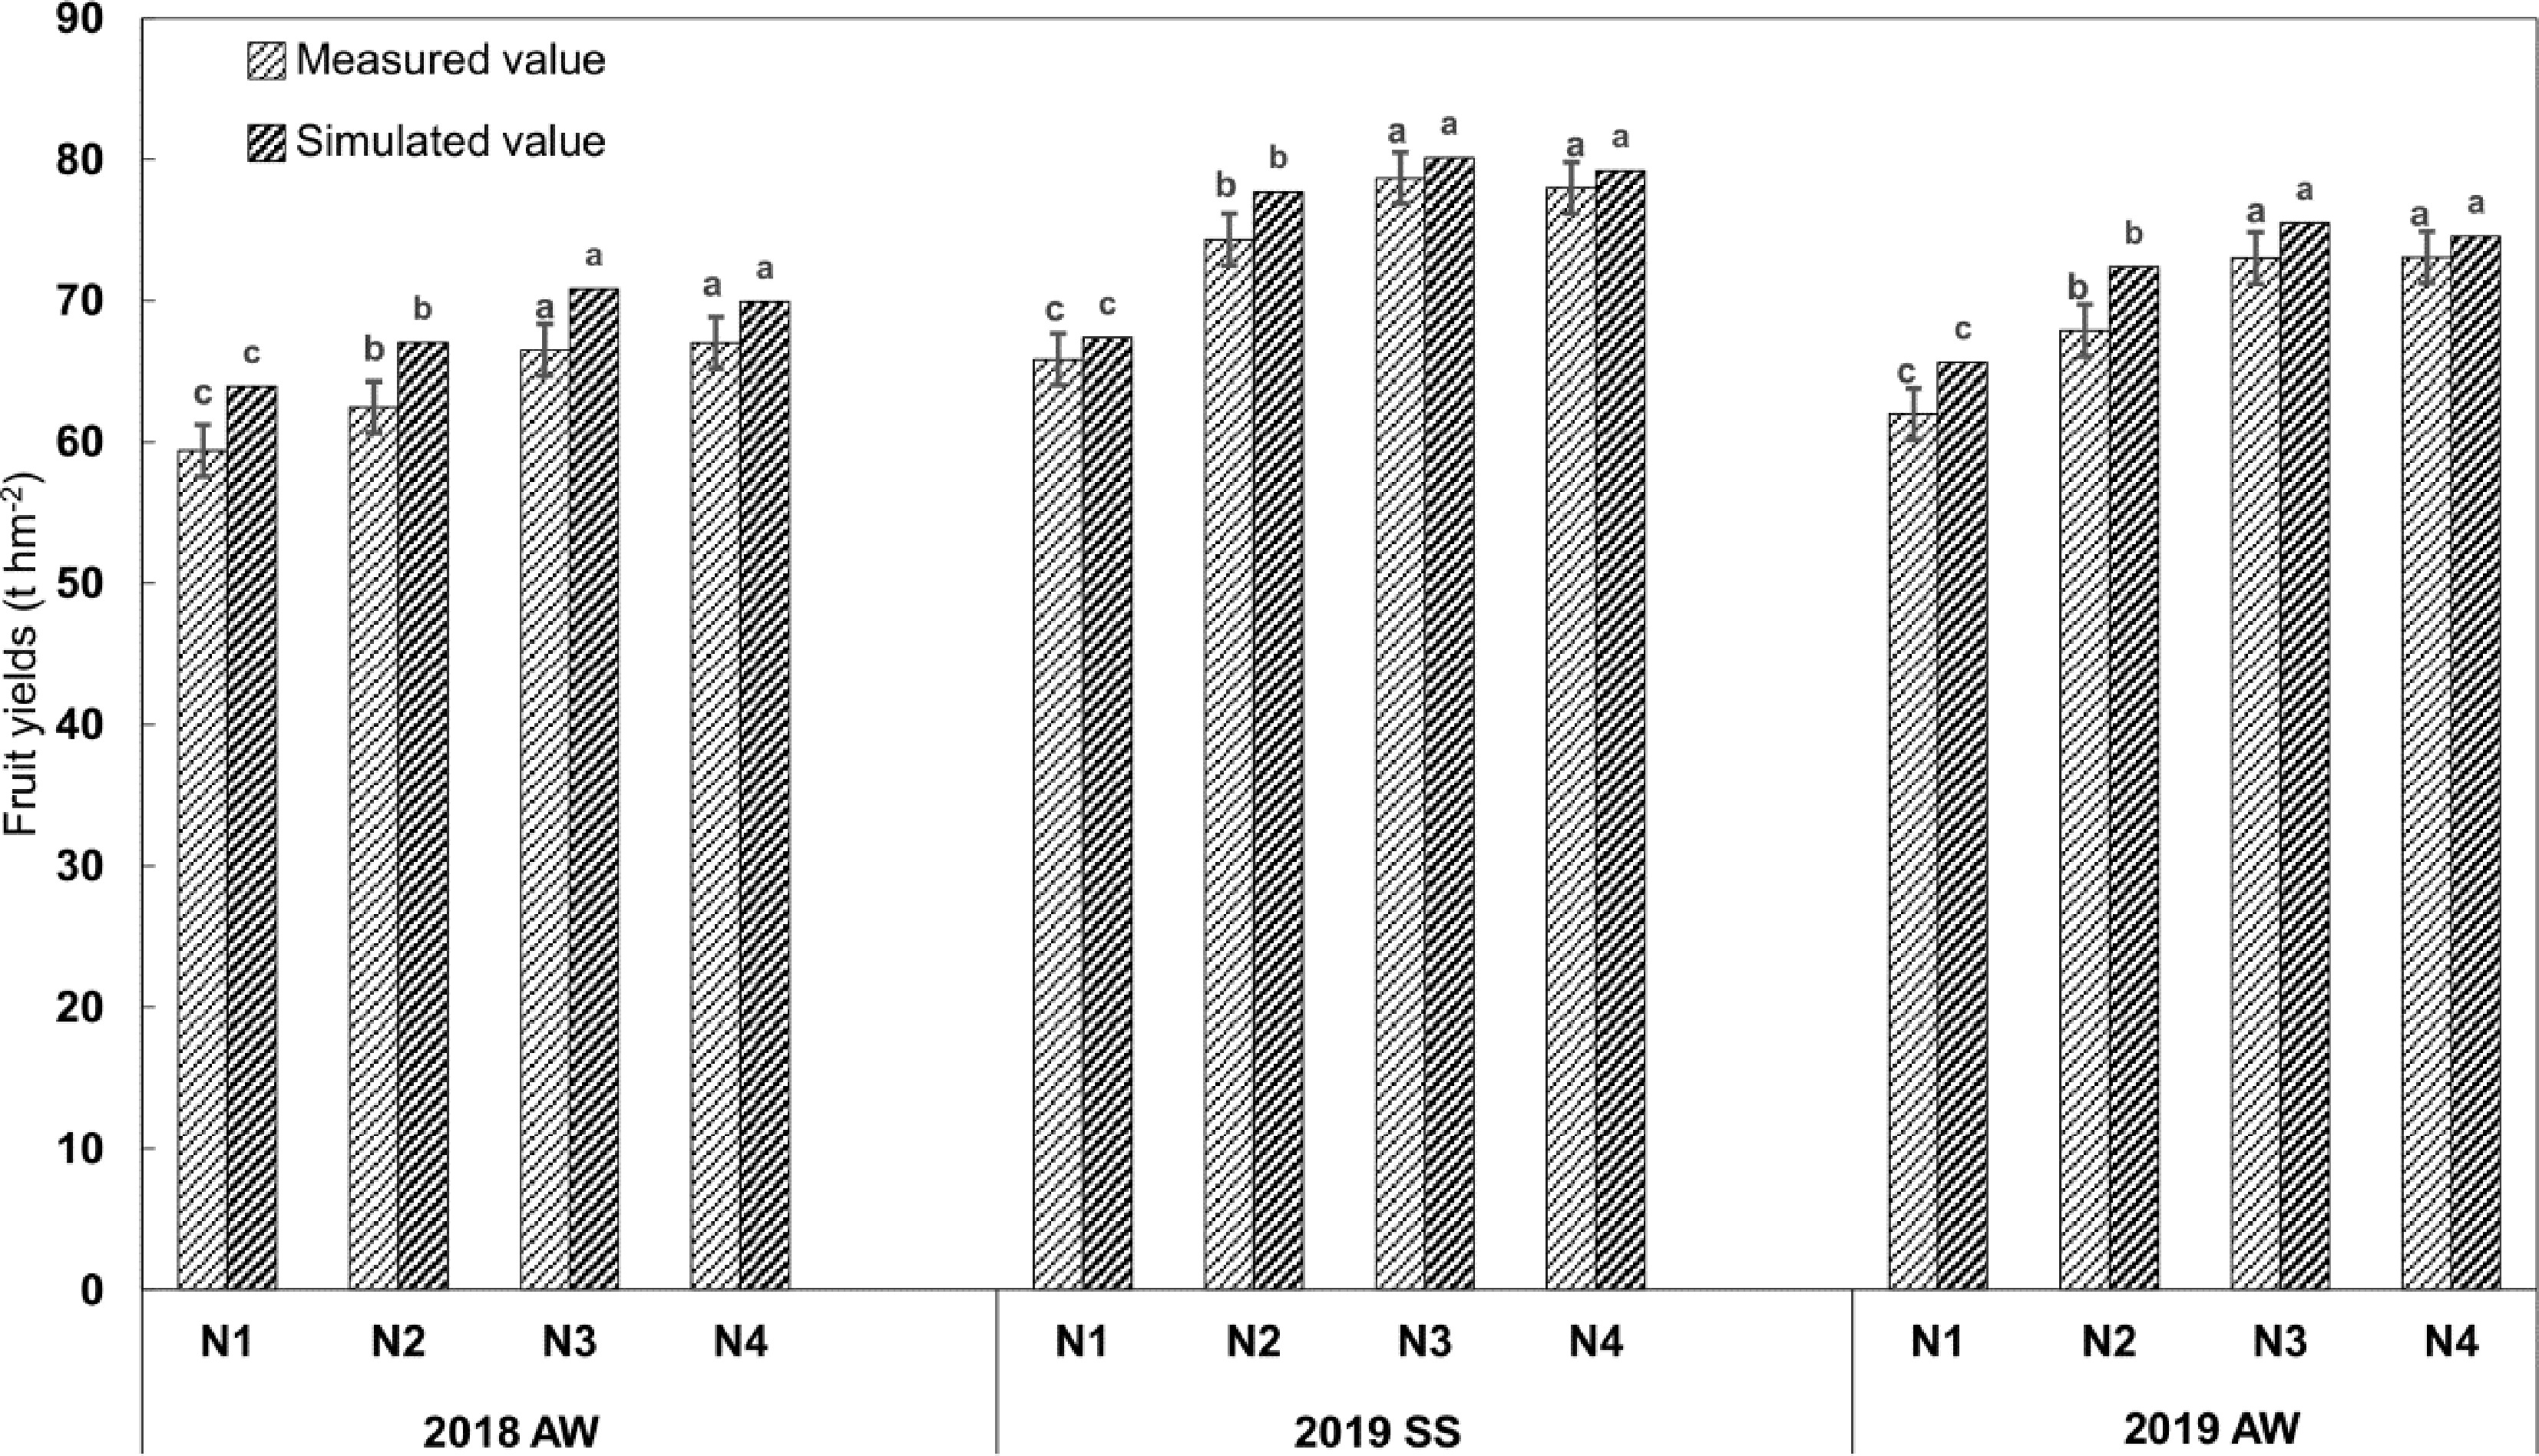
Figure 6.
Comparison of simulated and measured values of cucumber yield in four N treatments.
-
Date Amount (mm) Mode 2018AW 2018/09/12 41.57 Drip 2018/09/15 21.39 Drip 2018/09/20 27.68 Drip 2018/10/10 34.14 Drip 2018/10/18 32.29 Drip 2018/10/22 26.60 Drip 2018/10/30 35.28 Drip 2018/11/05 26.82 Drip 2018/11/15 42.70 Drip 2018/11/22 29.26 Drip 2019 SS 2019/03/24 49.24 Drip 2019/03/27 23.26 Drip 2019/04/12 38.24 Drip 2019/04/25 47.35 Drip 2019/05/05 44.86 Drip 2019/05/11 39.17 Drip 2019/05/16 58.62 Drip 2019/05/21 60.16 Drip 2019/05/30 55.27 Drip 2019/06/05 46.52 Drip 2019/06/11 41.83 Drip 2019/06/16 30.02 Drip 2019 AW 2019/08/27 37.67 Drip 2019/08/30 20.48 Drip 2019/09/05 28.25 Drip 2019/09/24 33.66 Drip 2019/10/02 32.58 Drip 2019/10/07 21.97 Drip 2019/10/17 32.68 Drip 2019/10/25 27.4 Drip 2019/10/30 31.16 Drip 2019/11/04 30.87 Drip Table 1.
Specific irrigation management used in the experiments.
-
Date N1 N2 N3 N4 2018 AW (kg hm−2) 09/12 14.2 17.5 19.8 21.5 09/15 7.3 9.0 10.2 11.1 09/20 9.4 11.6 13.2 14.3 10/10 28.4 45.4 63.2 81.4 10/18 27.7 44.6 62.3 80.5 10/22 9.1 11.2 12.7 13.8 10/30 20.4 30.4 40.3 50.2 11/05 29.3 46.5 64.5 82.8 11/15 31.3 49.0 67.3 85.9 11/22 18.3 27.8 37.4 47.0 2019 SS (kg hm−2) 03/24 11.1 13.9 16.1 17.3 03/27 5.3 6.6 7.6 8.2 04/12 25.2 41.7 60.1 77.7 04/25 27.2 44.3 63.0 80.9 05/05 10.2 12.7 14.6 15.8 05/11 8.9 11.1 12.8 13.8 05/16 29.8 47.5 66.7 84.8 05/21 13.6 17.0 19.6 21.2 05/30 20.8 31.1 41.8 51.6 06/05 10.5 13.1 15.2 16.4 06/11 26.0 42.7 61.2 78.9 06/16 15.1 23.9 28.6 42.7 2019 AW (kg hm−2) 08/27 13.3 15.3 17.0 21.3 08/30 7.2 8.3 9.3 11.6 09/05 9.9 11.5 12.8 15.9 09/24 33.0 50.2 69.7 87.0 10/02 32.6 49.8 69.2 86.3 10/07 7.7 8.9 9.9 12.4 10/17 32.7 49.8 69.2 86.4 10/25 20.2 29.4 39.6 49.4 10/30 32.2 49.2 68.5 85.5 11/04 21.5 30.8 39.7 49.5 Table 2.
Applied N fertiliser for greenhouse cucumber in the experiments.
-
Soil layer (cm) Bulk density (g·cm−3) Sand (%) Clay (%) pH FC (cm3·cm−3) θs (cm3·cm−3) 0−10 1.35 1.50 34.2 6.70 0.30 0.46 10−20 1.40 9.16 44.8 7.05 0.27 0.39 20−30 1.41 11.07 37.4 7.16 0.29 0.36 FC: Field water holding capacity; θs: Saturated water content. Table 3.
Soil physical and chemical properties for the soil profile at the experimental site.
-
Parameters Description Default
valueOptimized value PNINF Crop specific parameters of critical N 1.35 1.20 B0 curve equation 3 3 RLUX Coefficient for luxury N consumption 1.2 1.2 TB Base temperature (°C) 7 12 Ddlag Lag period before growth begins (°C days) 100 100 Krz Vertical root penetration rate (m d–1 °C –1 ) 0.001 0.001 K_ini Crop coefficient in initial stage 0.80 0.50 K_mid Crop coefficient in middle stage 1.10 0.80 K_end Crop coefficient in end stage 1.10 1.10 H_max Maximum crop height (m) 0.2 2.1 L_ini Length of the initial growth period (d) 20 20 L_dev Lengthof the development period (d) 30 30 L_mid Length of the middle period (d) 70 70 L_lat Length of the late growth period (d) 15 15 HI Harvest index 0.50 0.55 Table 4.
Parameters used in the HG EU-Rotate_N model.
-
Treatment Soil layer (cm) RMSE NSE d Original model HG model Original model HG model Original model HG model N1 0−10 0.046 0.043 0.708 0.745 0.938 0.945 10−20 0.057 0.042 −0.001 0.436 0.807 0.876 20−30 0.062 0.050 −0.014 0.344 0.824 0.853 N2 0−10 0.042 0.037 0.805 0.847 0.954 0.964 10−20 0.061 0.042 −0.278 0.384 0.732 0.840 20−30 0.060 0.046 −0.042 0.384 0.835 0.866 N3 0−10 0.045 0.038 0.754 0.831 0.942 0.958 10−20 0.042 0.036 −0.006 0.274 0.786 0.834 20−30 0.046 0.039 −0.014 0.257 0.822 0.854 N4 0−10 0.042 0.034 0.786 0.859 0.952 0.967 10−20 0.048 0.039 −0.067 0.318 0.745 0.818 20−30 0.043 0.036 −0.022 0.278 0.829 0.860 Table 5.
Model evaluation index of SWC.
-
Treatment Soil layer (cm) RMSE NSE d Original model HG model Original model HG model Original model HG model N1 0−10 21.098 16.537 0.666 0.795 0.919 0.956 10−20 30.059 28.552 0.369 0.431 0.859 0.865 20−30 26.173 23.516 0.535 0.625 0.896 0.915 N2 0−10 25.126 25.126 0.525 0.525 0.902 0.902 10−20 27.563 22.541 0.282 0.520 0.871 0.902 20−30 22.872 19.607 0.486 0.623 0.886 0.916 N3 0−10 27.903 27.903 0.631 0.631 0.914 0.914 10−20 26.187 21.916 0.495 0.646 0.916 0.929 20−30 24.775 19.558 0.540 0.713 0.874 0.924 N4 0−10 27.875 35.332 0.758 0.631 0.945 0.905 10−20 24.198 24.198 0.705 0.705 0.938 0.938 20−30 27.058 20.826 0.474 0.688 0.854 0.916 Table 6.
Model evaluation index of SNC in greenhouse cucumber.
-
Treatment RMSE NSE d 2018 AW 4.156 0.769 0.687 2019 SS 2.094 0.967 0.992 2019 AW 3.248 0.776 0.957 Table 7.
Model evaluation for the greenhouse cucumber yield.
Figures
(6)
Tables
(7)