


-
Greenhouse vegetable cultivation is an important branch of modern intensive agriculture, which increases economic payoffs and improves the utilization efficiency of natural resources. In China, to meet the growing population, the cultivation areas of greenhouse vegetables increased to approximately 3.86 million hectares in 2014[1,2]. Cucumber is a widely cultivated vegetable worldwide, and its production has reached 110.23 million tons worldwide[3]. During the growth cycle of cucumber, nitrogen is one of the main limiting nutrients to cucumber yield and soil nitrogen availability plays a key role in the determination of the nitrogen uptake rate[4−8]. To increase cucumber yields, nitrogenous fertilizer is commonly applied in a manner that far exceeds the requirements. As a result of excess fertilization, coupled with frequent irrigation, nitrate accumulates in both deep and shallow soil which leads to underground water pollution and soil alkalization[9−15]. In addition, cucumber, similar with most vegetable crops, has difficulty taking up nitrate from the deeper soil due to its shallow root structure[16−19].
Irrigation and fertilizer management together with soil properties are the key limiting factors controlling nitrogen loss in the soil–crop system[20−22]. With the increasing vegetable cultivation period, soil properties change and affect the uptake and leaching of nitrogen. For example, coarse-texture soils always have greater water conductivity and lower water holding capacities, which increase the occurrence rates of nitrogen leaching[23−25]. As soil property improvement requires a long time with large amounts of irrigation and fertilizer management, such as drip irrigation, reasonable irrigation scheduling and fertigation, have become commonly used approaches to increase nitrogen use efficiency (NUE) and water use efficiency (WUE) in cucumber cultivation[26−29]. Several studies show that fertigation not only reduces nitrogen leaching and gaseous N emissions but also increases NUE and WUE[10, 28, 30]. However, the amount and application of fertilization and irrigation frequency in the fertigation system heavily rely on the current practices of growers due to the lack of suitable scientific decision making systems in present-day China. It has been reported that some smart irrigation systems have arisen to control the schedule of fertigation. As an important component of smart irrigation systems, fertilization schedules based on sensors are not comprehensive enough to accurately meet the water and nitrogen requirements of crops[22, 31,32]. Therefore, it is necessary to develop models to simulate the needs of water and fertilizer for irrigated crop production.
In order to devise the best management strategies, several mechanistic models have been developed to simulate vegetable growth, water movement and nitrogen dynamics, e.g., the Nitrate Leaching and Economic Analysis Package (NLEAP)[33−35], STICS (Simulateur multidisciplinaire pour les Cultures Standards)[36,37], the Hydrus-2D model[38], CropSyst (cropping systems simulator)[39,40], the EU-Rotate_N model[20, 40−42], the Denitrification-Decomposition (DNDC) model[43−48], and WHCNS_veg model[14,15] and SWMS_2D (a computer program for simulating water and solute movement in two-dimensional variably saturated media)[49]. Among those models, the EU-Rotate_N model successfully simulates soil water, nitrogen dynamics and vegetable growth under various irrigation and fertilization conditions, and is widely used for a variety of vegetables[30, 41, 50,51]. To date, the EU-Rotate_N model has been successfully applied in reducing N inputs and N losses with no associated vegetable yield reduction in China and Germany[20, 29,30, 41,42, 50]. In greenhouse cucumbers grown in northern China, the EU-Rotate_N model successfully predicted high nitrogen mineralization rates and nitrate leaching losses under different water and fertilizer management practices[30, 50].
Jiangsu province is in the middle and lower reaches of the Yangtze River where higher groundwater levels are present. Our previous work showed that the water dynamics and fertilizer in soil in Jiangsu province are obviously different from those in northern China, which has a low groundwater level[21,22]. It has been suggested that groundwater level contributes to crop yield and water requirements, whereas a few models were able to accurately simulate the water and fertilizer requirements in areas with high groundwater levels (areaHG)[52−55]. On the other hand, accompanied by global warming and rising sea levels, areaHG has gradually increased worldwide[56]. Therefore, a model is urgently needed that could accurately simulate water and N consumption and thus minimize the water and fertilizer waste in areaHG.
In this study, we developed the high groundwater (HG) EU-Rotate_N model by altering the soil water module in the original model. To test the modified model, we conducted field experiments on cucumber with four different N treatments (N1-N4), and measured the soil water content (SWC), soil available nitrogen concentration (SNC) in different soil layers, and dry matter weight and fruit yield of cucumber. Results show that the values simulated by the HG model were in much better agreement with the measured values, indicating that the HG EU-Rotate_N model was more applicable to the water and N fertilizer management and helpful to develop the best management practices (BMPs) growing greenhouse cucumber in areaHG.
-
The widely cultivated cucumber (Cucumis sativus L.) cultivar in Jiangsu Provine Jinchun 5 (North China ecotype) was used in the experiments. The experiments were conducted in a greenhouse on the vegetable base of Yangzhou University (32.29° N, 119.48° E), which is located in Yangzhou, Jiangsu Province (China). The climate of this region is classified as a typical subtropical humid climate. In the test site, the annual atmospheric nitrogen subsidence was 22.7 kg hm−2. The annual average air temperature in the greenhouse were 24.2 °C and 23.6 °C in 2018 and 2019, respectively (Supplemental Fig. S1).
Experimental design
-
Four treatments with different nitrogen gradients (N1, N2, N3 and N4) were conducted. As shown in Fig. 1, the greenhouse, with an area of 50 m × 6 m, was organized into four plots and each plot had a specific N fertilizer dosage treatment. To prevent movement of nutrients, the plots were separated by 50 cm deep plastic plates. The wide and narrow row spacings were 80 cm and 50 cm, respectively. The cucumber plants were spaced at 30 cm within the row. The experiments were repeated three times.
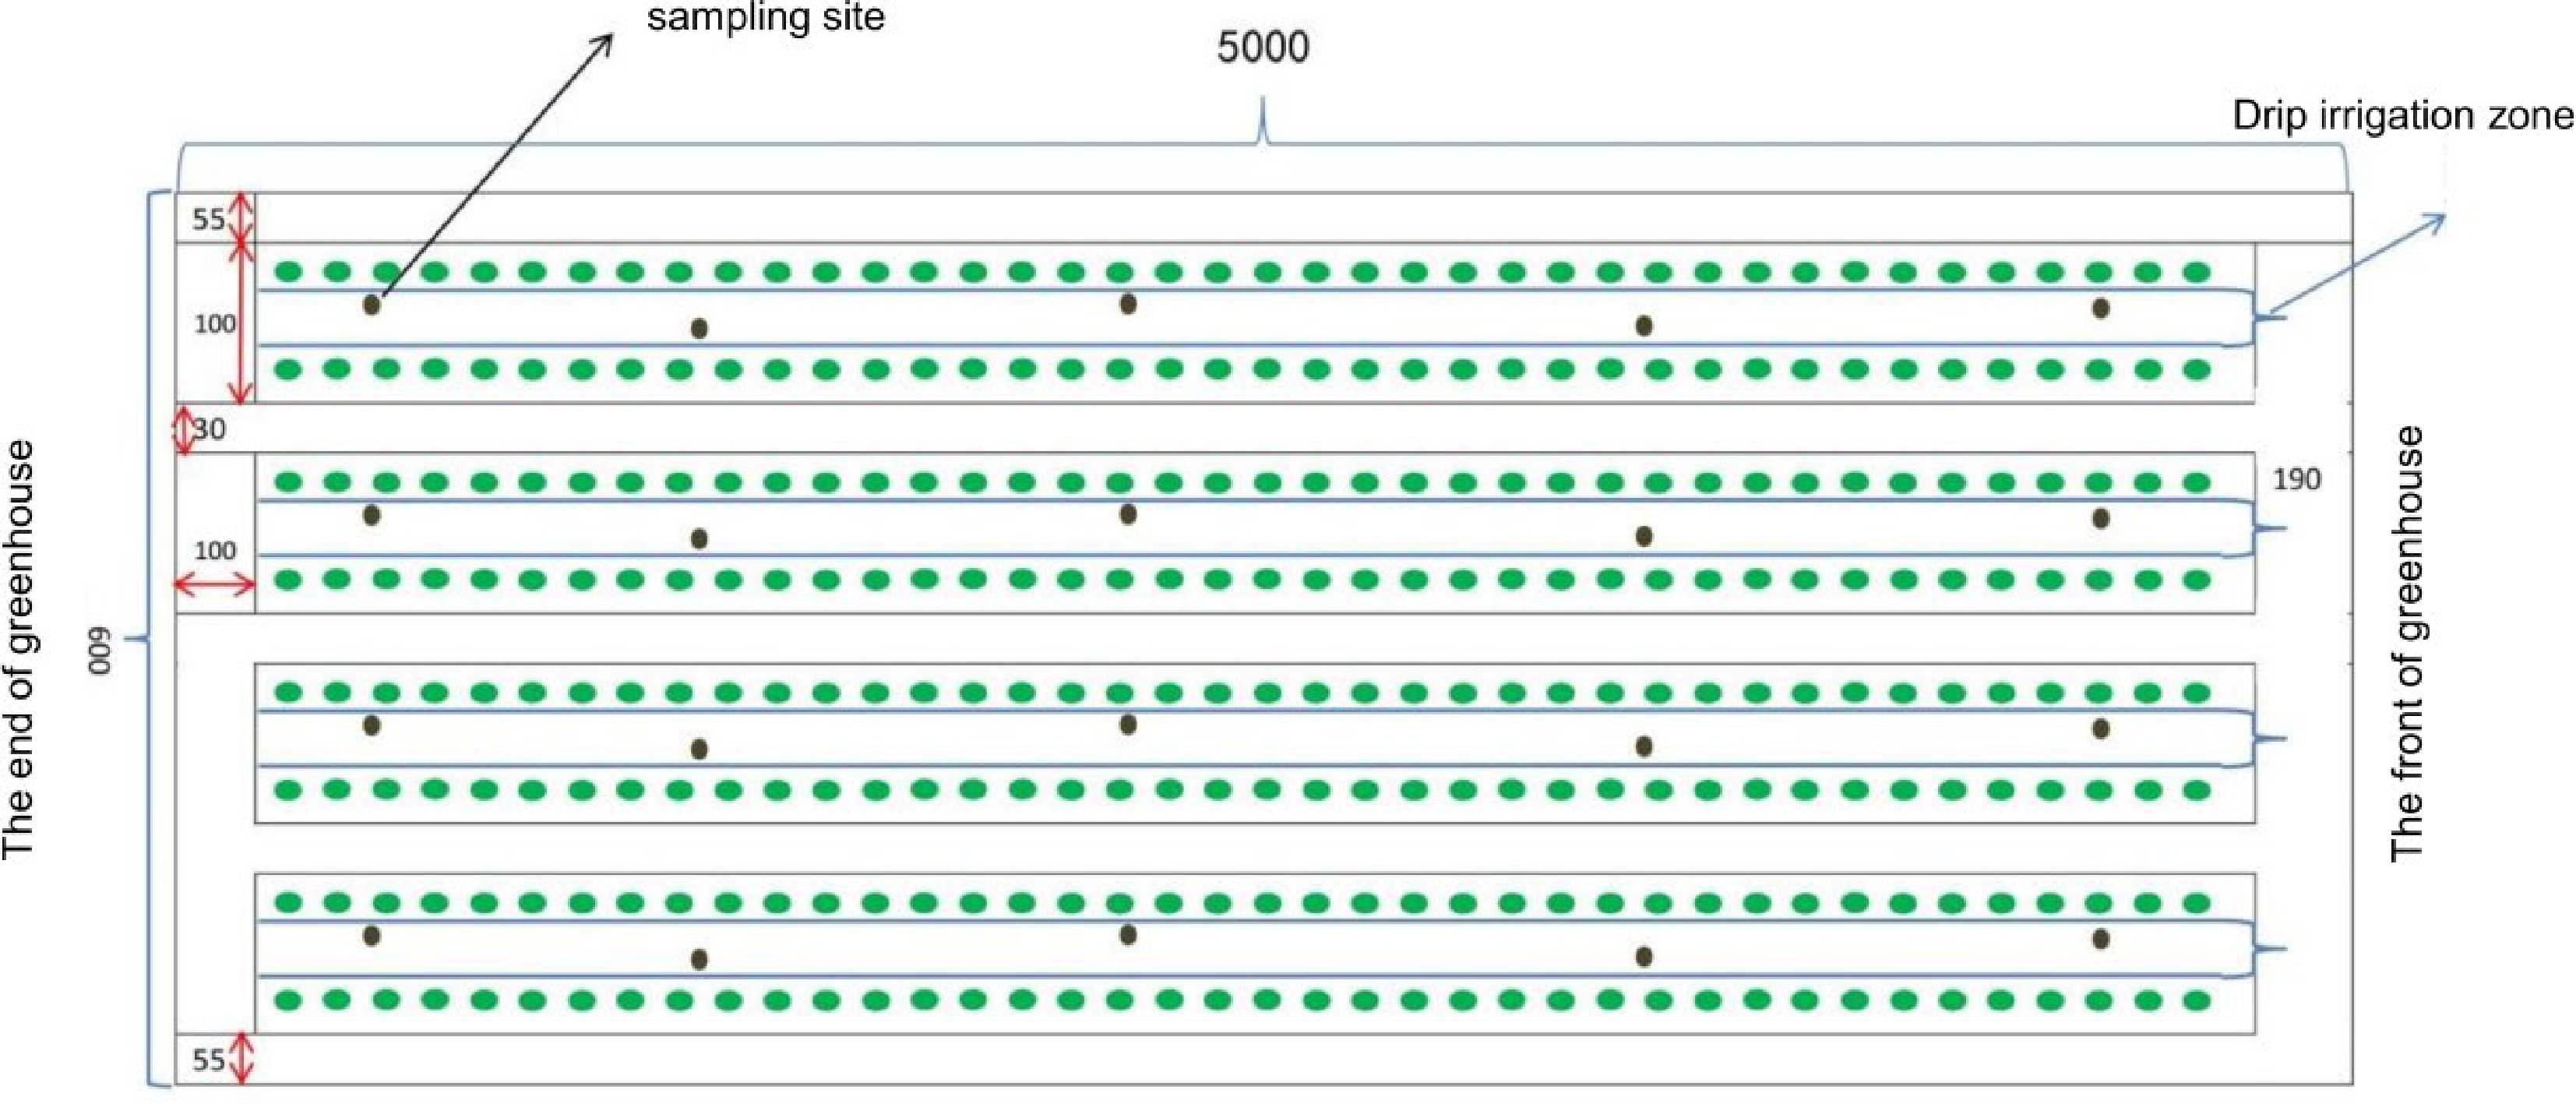
Figure 1.
Design diagram of the greenhouse cucumber plot. The green circles show the cucumber plants; the black circles show the soil sampling sites. The units of numbers in the figure are centimeters (cm).
As shown in Table 1, the crops were grown in three seasons: 16 September 2018 to 9 December 2018 (autumn-winter season, 2018AW), 24 March 2019 to 10 June 2019 (spring-summer season, 2019SS), 27 August 2019 to 15 November 2019 (2019AW). Samples of soil, plant and soil water drainage were collected every 10 d after planting. Drip fertigation was used in the experiments and each row was equipped with two irrigation belts. The irrigation was applied as shown in Table 1 according to soil water sensors (remaining 60%−90% of soil water of field capacity).
Table 1. Specific irrigation management used in the experiments.
Date Amount (mm) Mode 2018AW 2018/09/12 41.57 Drip 2018/09/15 21.39 Drip 2018/09/20 27.68 Drip 2018/10/10 34.14 Drip 2018/10/18 32.29 Drip 2018/10/22 26.60 Drip 2018/10/30 35.28 Drip 2018/11/05 26.82 Drip 2018/11/15 42.70 Drip 2018/11/22 29.26 Drip 2019 SS 2019/03/24 49.24 Drip 2019/03/27 23.26 Drip 2019/04/12 38.24 Drip 2019/04/25 47.35 Drip 2019/05/05 44.86 Drip 2019/05/11 39.17 Drip 2019/05/16 58.62 Drip 2019/05/21 60.16 Drip 2019/05/30 55.27 Drip 2019/06/05 46.52 Drip 2019/06/11 41.83 Drip 2019/06/16 30.02 Drip 2019 AW 2019/08/27 37.67 Drip 2019/08/30 20.48 Drip 2019/09/05 28.25 Drip 2019/09/24 33.66 Drip 2019/10/02 32.58 Drip 2019/10/07 21.97 Drip 2019/10/17 32.68 Drip 2019/10/25 27.4 Drip 2019/10/30 31.16 Drip 2019/11/04 30.87 Drip The fertilizer schedule and dosage used in the four N treatments are shown in Table 2. Nitrogen was supplied in the form of urea. Due to the different fertilizer requirements at different stages of cucumber growth, the whole growth period was divided into three stages. 20% N was applied for 0−20 day (d) after transplanting; 40% N and 40% potassium (K) were applied for 20−60 d; and the remaining 40% N and 60% K were applied at the last growth stage[8]. Dairy manure was applied for all treatments at rates 40 m3 hm−2 (containing 29.19 kg hm−2 N, 57.71 kg hm−2 P2O5 and 80.42 kg hm−2 K2O) as the basal fertilizer. Based on local fertilization experience and our previous tests, the use efficiency of soil N, phosphorus (P) and K were set to 45%, 50% and 50%, respectively; the use efficiency of N, P and K in organic fertilizers were set to 20%; the use efficiency of N, P and K in chemical fertilizers were set to 50%, 30% and 60%, respectively[21,22]. According to nutrient content in soil, the nutrient demand of cucumber 3.4 kg N, 1.3 kg P2O5 and 4.5 kg K2O were needed for 1 ton cucumber yield[4] and the principle of nutrient balance, the recommended nitrogen fertilizer dosage per hectare was calculated and shown in Supplemental Table S1. N 390.8 kg hm−2, 407.3 kg hm−2 and 405.0 kg hm−2 were taken as the reference for 2018 AW, 2019 SS and 2019 AW experiments, respectively. The four nitrogen treatments (0.5, 0.75, 1, and 1.25 fold of reference) were named as N1, N2, N3 and N4, respectively. For one treatment, there were 170 plant used for dry weight measurements in one replicate and we conducted three replicates.
Table 2. Applied N fertiliser for greenhouse cucumber in the experiments.
Date N1 N2 N3 N4 2018 AW (kg hm−2) 09/12 14.2 17.5 19.8 21.5 09/15 7.3 9.0 10.2 11.1 09/20 9.4 11.6 13.2 14.3 10/10 28.4 45.4 63.2 81.4 10/18 27.7 44.6 62.3 80.5 10/22 9.1 11.2 12.7 13.8 10/30 20.4 30.4 40.3 50.2 11/05 29.3 46.5 64.5 82.8 11/15 31.3 49.0 67.3 85.9 11/22 18.3 27.8 37.4 47.0 2019 SS (kg hm−2) 03/24 11.1 13.9 16.1 17.3 03/27 5.3 6.6 7.6 8.2 04/12 25.2 41.7 60.1 77.7 04/25 27.2 44.3 63.0 80.9 05/05 10.2 12.7 14.6 15.8 05/11 8.9 11.1 12.8 13.8 05/16 29.8 47.5 66.7 84.8 05/21 13.6 17.0 19.6 21.2 05/30 20.8 31.1 41.8 51.6 06/05 10.5 13.1 15.2 16.4 06/11 26.0 42.7 61.2 78.9 06/16 15.1 23.9 28.6 42.7 2019 AW (kg hm−2) 08/27 13.3 15.3 17.0 21.3 08/30 7.2 8.3 9.3 11.6 09/05 9.9 11.5 12.8 15.9 09/24 33.0 50.2 69.7 87.0 10/02 32.6 49.8 69.2 86.3 10/07 7.7 8.9 9.9 12.4 10/17 32.7 49.8 69.2 86.4 10/25 20.2 29.4 39.6 49.4 10/30 32.2 49.2 68.5 85.5 11/04 21.5 30.8 39.7 49.5 Collection and measurements of soil samples
-
The soil samples were collected as shown in Supplemental Fig. S2. Soil samples from five sites were mixed and separated according the different soil depths (0−10 cm, 10−20 cm, 20−30 cm), and were then dried to measure the soil water. The soil particle sizes were measured using laser particle size distribution instrument (Better size 2000, Baite).
The measurement of SNC was conducted as follows[57]: Two grams dry soil was placed in the outer chamber of the diffusion dish, 0.2 g ferrous sulfate powder was added and the diffusion plate was gently rotated to evenly smooth the soil. Two mL boric acid-indicator solution was added in the diffusion chamber and then 10.0 mL sodium hydroxide solution was added in the diffusion dish. After 24 h in an incubator at 40 ± 1 °C, the NH3 in the chamber absorption solution was titrated with a standard solution of sulfuric acid. The results were calculated based on the equation:
$\rm\omega(N)=(V-V_0)\times c\times M \times 1000/m $ (V-V0) ω(N) is mass fraction of SNC (mg kg−1), c is the concentration of sulfuric acid standard solution (mol L−1), V is the volume of sulfuric acid standard liquid of treatment (mL), V0 is the volume of sulfuric acid standard liquid of the control (mL), M is 14 g/mol and m is soil weight (g).
Sampling of plants and the determination of plant nutrient content
-
The stems, leaves and fruits were separated and collected to measure the dry weight. Dry matter was measured by drying at 72 °C to a constant weight. Each treatment was repeated three times. Fruit fresh weight was measured to calculate the fruit yields.
Weather dataset collection
-
The weather dataset in the greenhouse was collected using the on-site weather station (NHQXZ60l, Nenghui). The measured variables included air temperature, relative humidity, solar radiation and wind speed. Data were recorded every 10 min.
Determination of groundwater level
-
The water level sensor (YKKT-1E, Xinyi) was used for continuous monitoring of the groundwater level. Data were recorded every 30 min.
Determination of nitrogen leaching
-
The determination of nitrogen leaching was conducted as described in our previous work[22]. Briefly, to collect the sample of nitrogen leaching, self-made lysimeters were placed in the 30 cm soil layer. PVC net in combination with geotextile (fleece) covered the surface of lysimeters and let the leakage pass through. The nitrogen concentration in the collected leakage was measured using a continuous flow analyzer (Futura, Alliance, France). The nitrogen leaching was calculated based on the following equation:
$\rm N_{L} =(V_{n}\times c_{n})_{SUM}\times A_{H}/A_{L}, $ NL is nitrogen leaching (kg hm−2); Vn is the volume of nitrogen leaching at a time; cn is the nitrogen concentration at a time; (Vn × cn)SUM is the sum of Vn × cn; AH is the area of one hectare; AL is the surface area of lysimeters.
Improvements of the EU-Rotate_N model
-
EU-Rotate_N model was developed to simulate water and nitrogen dynamics in the soil-crop system for crop rotations[41]. For crop growth and nitrogen requirement, the modules used in the EU-Rotate_N model were validated in a wide range of crops. However, the modules for soil water movement were recently designed and did not work well. Zhang et al. modified the algorithm to simulate soil water movement of relatively high groundwater table. Here, we improved the EU-Rotate_N model according this study[58].
Model calibration and evaluation
-
We compared the simulation value with the data measured in the field experiment to evaluate the model. The following three statistical methods (Root mean square error (RMSE), Nash–Sutcliffe modeling efficiency (NSE), Agreement index (d)) were used to evaluate the model performance (Supplemental Table S2):
$ \mathrm{R}\mathrm{M}\mathrm{S}\mathrm{E}=\sqrt{\sum _{i=1}^{n}\frac{{(P_i-O_i)}^{2}}{n}} $ $ \mathrm{N}\mathrm{S}\mathrm{E}=1-\dfrac{{\sum }_{i=1}^{n}{(O_i-P_i)}^{2}}{{\sum }_{i=1}^{n}{(O_i-O)}^{2}} $ $ \mathrm{d}=1-\dfrac{{\sum }_{i=1}^{n}{(O_i-P_i)}^{2}}{{\sum }_{i=1}^{n}{(\left|P_i-O\right|+\left|O_i-O\right|)}^{2}} $ where n is the number of samples, Pi and Oi are the predicted and observed values, and O is the mean of the observed data[59−61].
Groundwater level algorithms added in the HG EU-Rotate_N model
-
To promote the performance of the EU-Rotate_N model in the area with high groundwater, we measured the groundwater and added this value into the source code to adjust the soil layer of saturated water content used in the EU-Rotate_N model. We added the groundwater level algorithms into the original model as below:
idate=Tyear-(Tyear/1000)*1000
ilayer=1
if (idate.le.124)then
ilayer=11
else if (idate.le.125)then
ilayer=10
else if (idate.le.126)then
ilayer=2
else if (idate.le.127)then
ilayer=4
else if (idate.le.128)then
ilayer=7
else if (idate.le.129)then
ilayer=9
else if (idate.le.131)then
ilayer=10
else if (idate.le.132)then
ilayer=8
else if (idate.le.136)then
ilayer=10
else if (idate.le.137)then
ilayer=7
else
ilayer=10
endif
do i=ilayer,40
do j=1,Nunit
thtai(i,j)=SATi(i,j)
end do
end do
-
Three experiments on cucumber were conducted in 2018 and 2019, named as 2018 AW, 2019 SS and 2019 AW. The meteorological data in the greenhouse were collected and shown in Supplemental Fig. S1. The groundwater of the greenhouse was continuously monitored with the water level sensor (Supplemental Fig. S3). As shown in Fig. 2, the groundwater was kept at a high level, varing from 0.29 to 0.72 m. The measured values (soil bulk density, SWC, SNC and crop data) from the N1 treatment in 2018AW were used to calibrate the model.
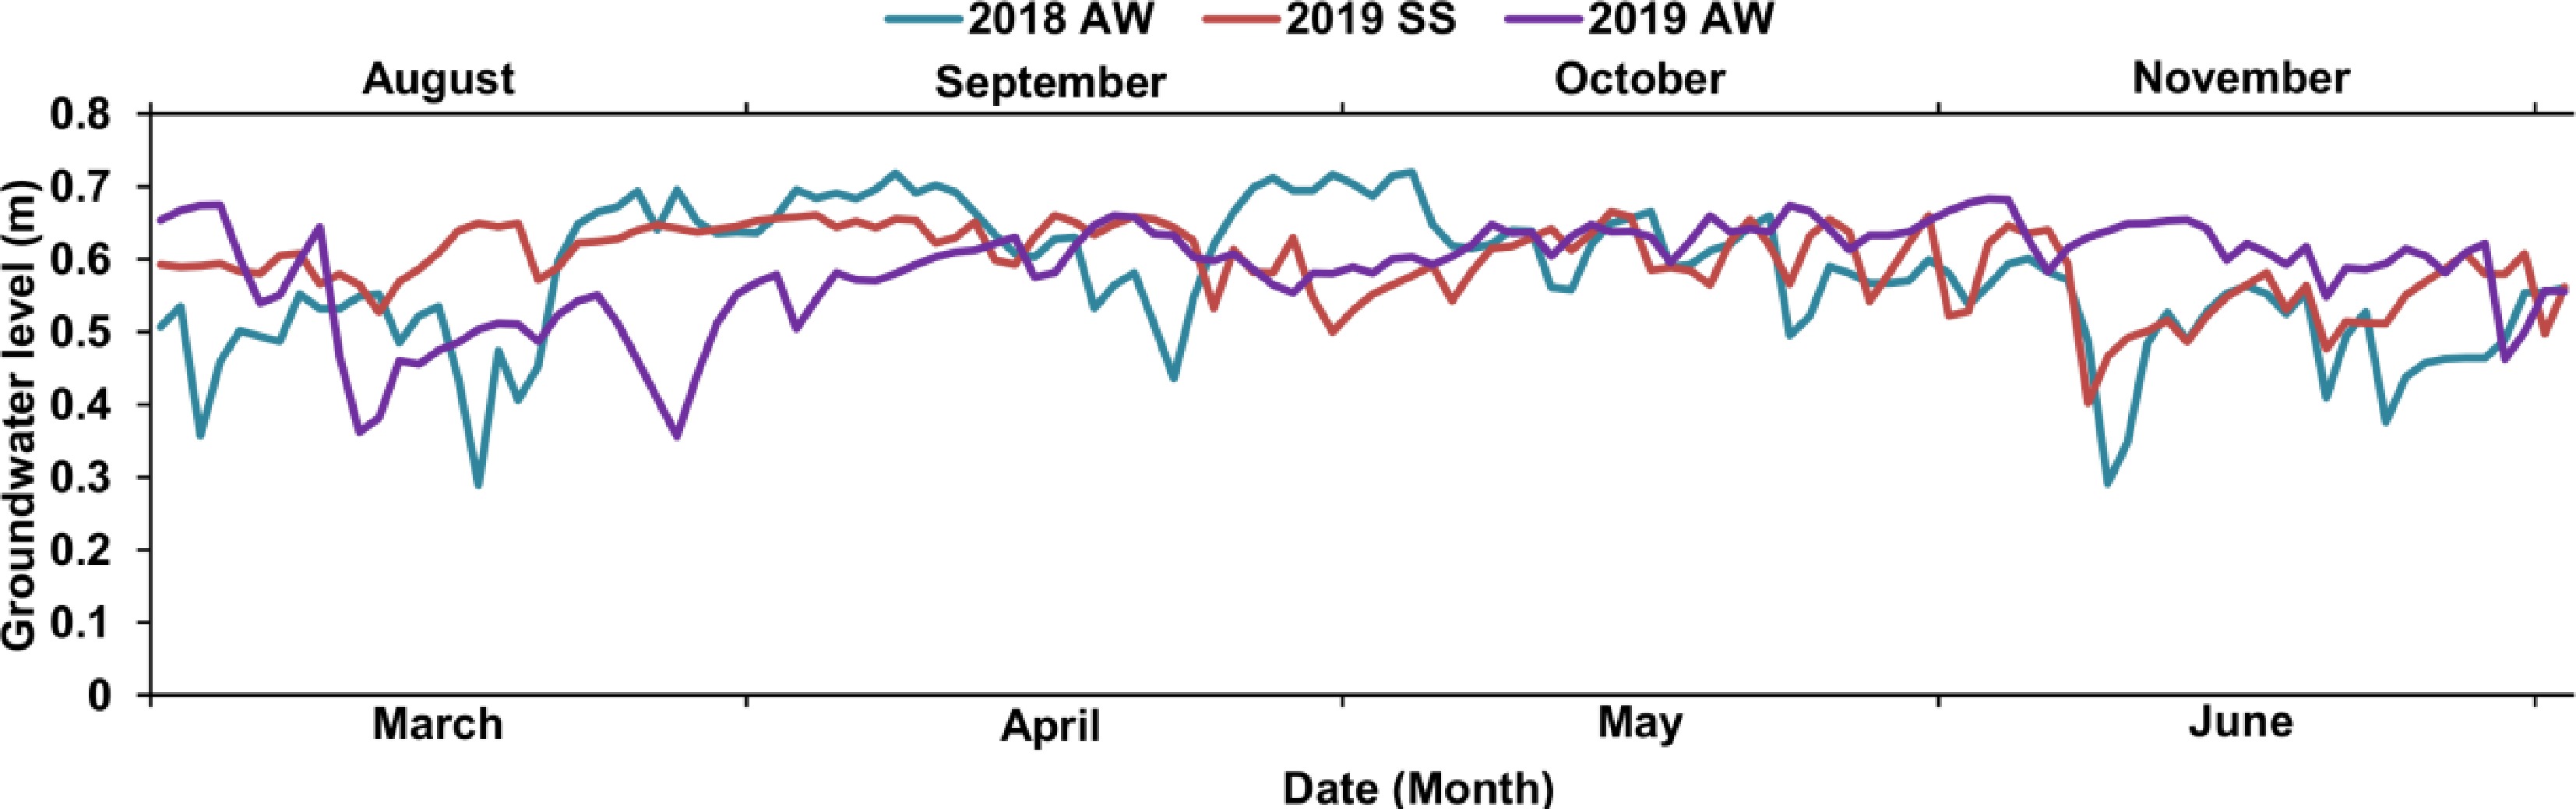
Figure 2.
The groundwater level during the experiments of 2018 AW, 2019 SS and 2019 AW.
The soil physical properties were used to decide soil hydraulic parameter values (Table 3); the crop coefficient (K-ini, K-mid, K-end) and the lengths of the initial growth period, the development period and the late growth period (L_ini, L_dev, L_lat) were adjusted according to measured data from cucumber plants in the common greenhouse in Jiangsu Province (China) (Table 4). The parameters used in the simulations are shown in the Table 4.
Table 3. Soil physical and chemical properties for the soil profile at the experimental site.
Soil layer (cm) Bulk density (g·cm−3) Sand (%) Clay (%) pH FC (cm3·cm−3) θs (cm3·cm−3) 0−10 1.35 1.50 34.2 6.70 0.30 0.46 10−20 1.40 9.16 44.8 7.05 0.27 0.39 20−30 1.41 11.07 37.4 7.16 0.29 0.36 FC: Field water holding capacity; θs: Saturated water content. Table 4. Parameters used in the HG EU-Rotate_N model.
Parameters Description Default
valueOptimized value PNINF Crop specific parameters of critical N 1.35 1.20 B0 curve equation 3 3 RLUX Coefficient for luxury N consumption 1.2 1.2 TB Base temperature (°C) 7 12 Ddlag Lag period before growth begins (°C days) 100 100 Krz Vertical root penetration rate (m d–1 °C –1 ) 0.001 0.001 K_ini Crop coefficient in initial stage 0.80 0.50 K_mid Crop coefficient in middle stage 1.10 0.80 K_end Crop coefficient in end stage 1.10 1.10 H_max Maximum crop height (m) 0.2 2.1 L_ini Length of the initial growth period (d) 20 20 L_dev Lengthof the development period (d) 30 30 L_mid Length of the middle period (d) 70 70 L_lat Length of the late growth period (d) 15 15 HI Harvest index 0.50 0.55 Simulation of soil water dynamics
-
A comparison between the simulated and measured SWCs in the three soil layers (0−10 cm, 10−20 cm, 20−30 cm) for four N treatments in all the experiments is shown in Fig. 3. There were significant differences in the SWCs over three crops especially in the 0−10 cm soil layer. The maximum soil water content in 0−10 cm and 10−20 cm soil layers under different nitrogen treatments all appeared on the dates of irrigation (Fig. 3).
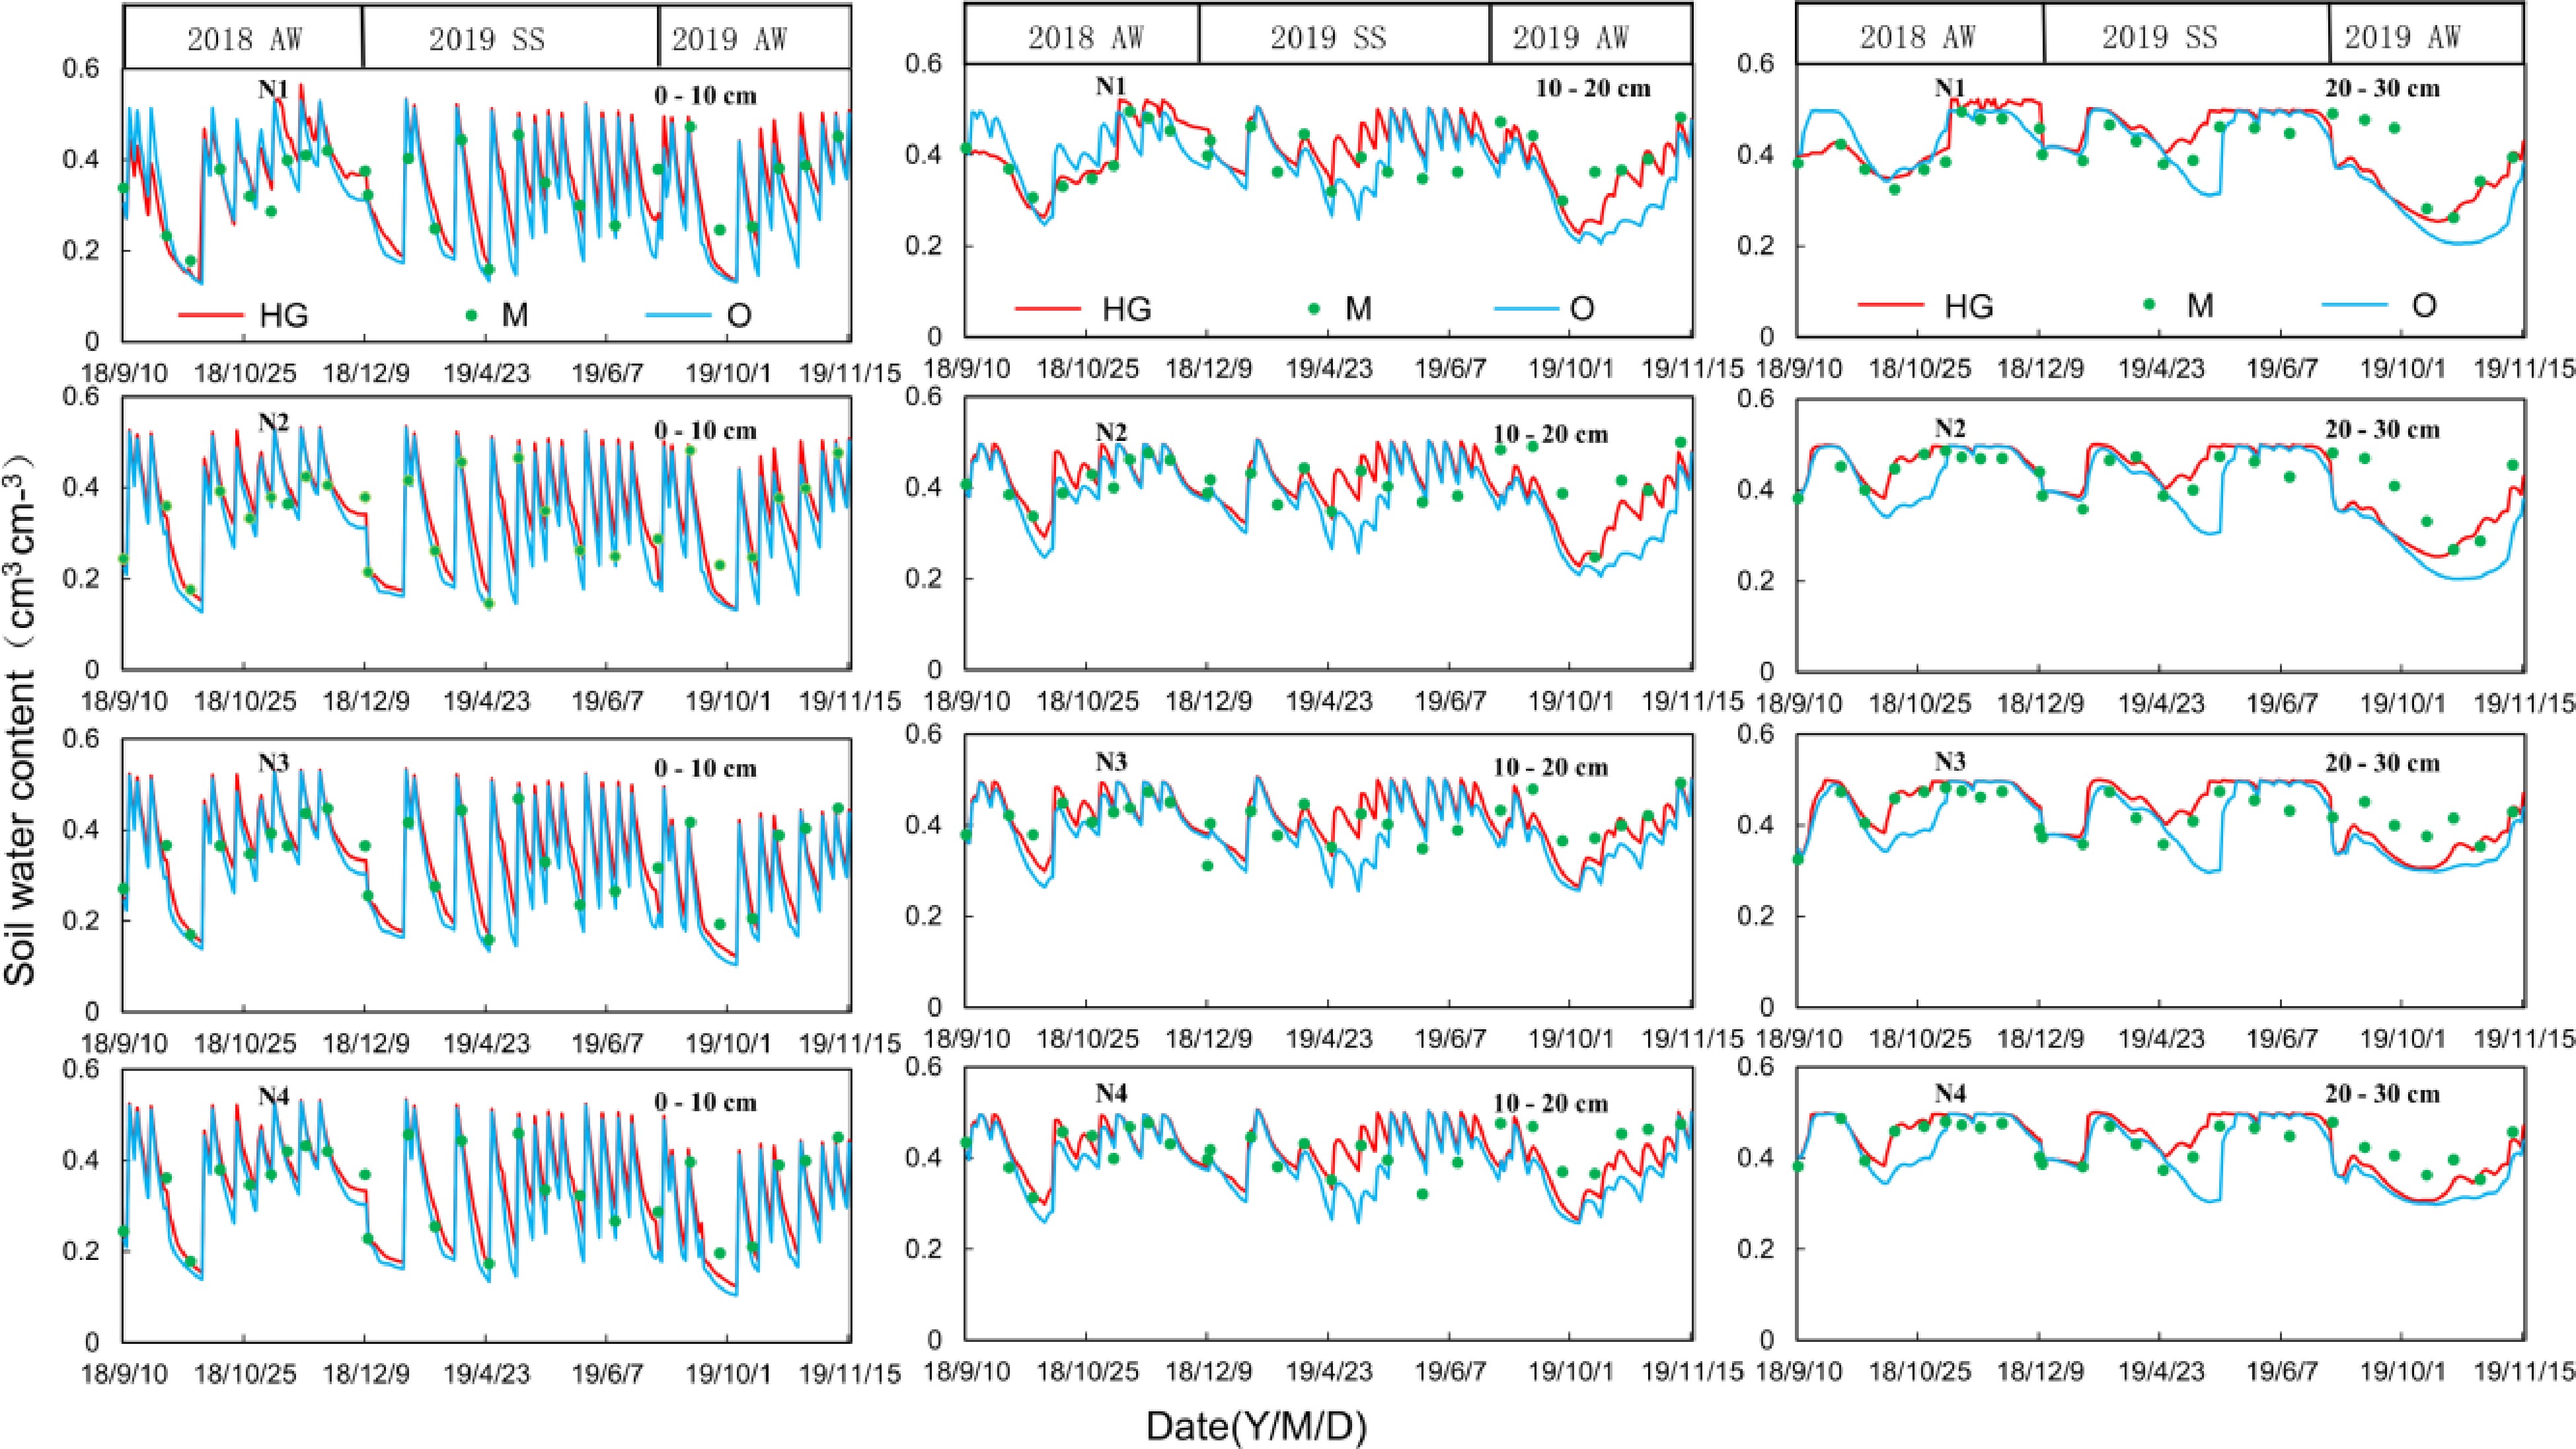
Figure 3.
The comparison between simulated and measured values of SWC in the 0–10 cm 10–20 cm and 20–30 cm soil layers. The red lines show the simulating value of the HG model (HG); the blue lines show the simulating values of the original model (O); the green dots show the measured values.
Among the three soil layers, the SWC in the 0−10 cm soil layer changed dramatically, followed by those in the 10−20 cm soil layer, and the SWC in the 20−30 cm soil layer (Fig. 3). The water content in three soil layers in the 2018 AW, 2019 SS and 2019 AW experiments ranged from 0.10−0.53 cm3 cm−3, 0.25−0.45 cm3 cm−3 and 0.30−0.40 cm3 cm−3, respectively (Fig. 3). There was no significant difference in soil water dynamics between the four N treatments.
Compared with measured values of SWC, the the values of SWC simulated by the original model (SWCO) were apparently lower, and the values of SWC simulated by the HG model (SWCHG) were closer to the measured values (Fig. 3).
The simulations for four N treatments (N1-N4) were also carried out with both models, and the statistical evaluation indexes of SWC are presented in Table 5. For the SWC in three soil layers of four treatments, RMSE values of the HG model (RMSEHG) ranged from 0.36 to 0.50, smaller than those by the original model (RMSEO). NSE values of the HG model (NSEHG) ranged from 0.257 to 0.859 and d values of the HG model (dHG) ranged from 0.818 to 0.967. RMSE、NSE and d values were all better than those by the original model (NSEO and dO) (Table 5). This indicated that the HG model notably increased the performance in simulating soil water dynamics of greenhouse cucumber in the present study (Table 5).
Table 5. Model evaluation index of SWC.
Treatment Soil layer (cm) RMSE NSE d Original model HG model Original model HG model Original model HG model N1 0−10 0.046 0.043 0.708 0.745 0.938 0.945 10−20 0.057 0.042 −0.001 0.436 0.807 0.876 20−30 0.062 0.050 −0.014 0.344 0.824 0.853 N2 0−10 0.042 0.037 0.805 0.847 0.954 0.964 10−20 0.061 0.042 −0.278 0.384 0.732 0.840 20−30 0.060 0.046 −0.042 0.384 0.835 0.866 N3 0−10 0.045 0.038 0.754 0.831 0.942 0.958 10−20 0.042 0.036 −0.006 0.274 0.786 0.834 20−30 0.046 0.039 −0.014 0.257 0.822 0.854 N4 0−10 0.042 0.034 0.786 0.859 0.952 0.967 10−20 0.048 0.039 −0.067 0.318 0.745 0.818 20−30 0.043 0.036 −0.022 0.278 0.829 0.860 Simulation of available nitrogen dynamics (available ND) in the soil
-
To compare the measured and simulated available ND in soil, we analysed the available ND in the three soil layers of three crops (Fig. 4). As shown in Fig. 4, the measured SNC (SNCM) ranged from 80 kg hm−2 to 250 kg hm−2 (Fig. 4). Generally, in the different soil layers, the highest SNC values in the deeper soil layer appeared after the in shallower soil layer (Fig. 4). The SNC variations in the soil in the four N treatments were similar, whereas the differences between the three growing seasons of cucumber were more significant. SNCM and the simulated SNC by the HG model (SNCHG) were higher than the simulated SNC by the original model (SNCO) in the 0−10 cm soil layer (Fig. 4). However, in the 10−20 cm and 20−30 cm soil layers, SNCM and SNCHG were lower than SNCO over most of the time (Fig. 4). Apparently, SNC simulated by the HG model performed better than the original model did, especially in the 10−20 cm and 20−30 cm soil layers (Fig. 4). During the whole growth periods of greenhouse cucumber, the original model performed worse in the middle and late periods than it did in the initial period (Fig. 4). The difference between SNCO and SNCHG was more marked in the N4 treatments (Fig. 4). These results indicated that SNCHG agreed better with SNCM.
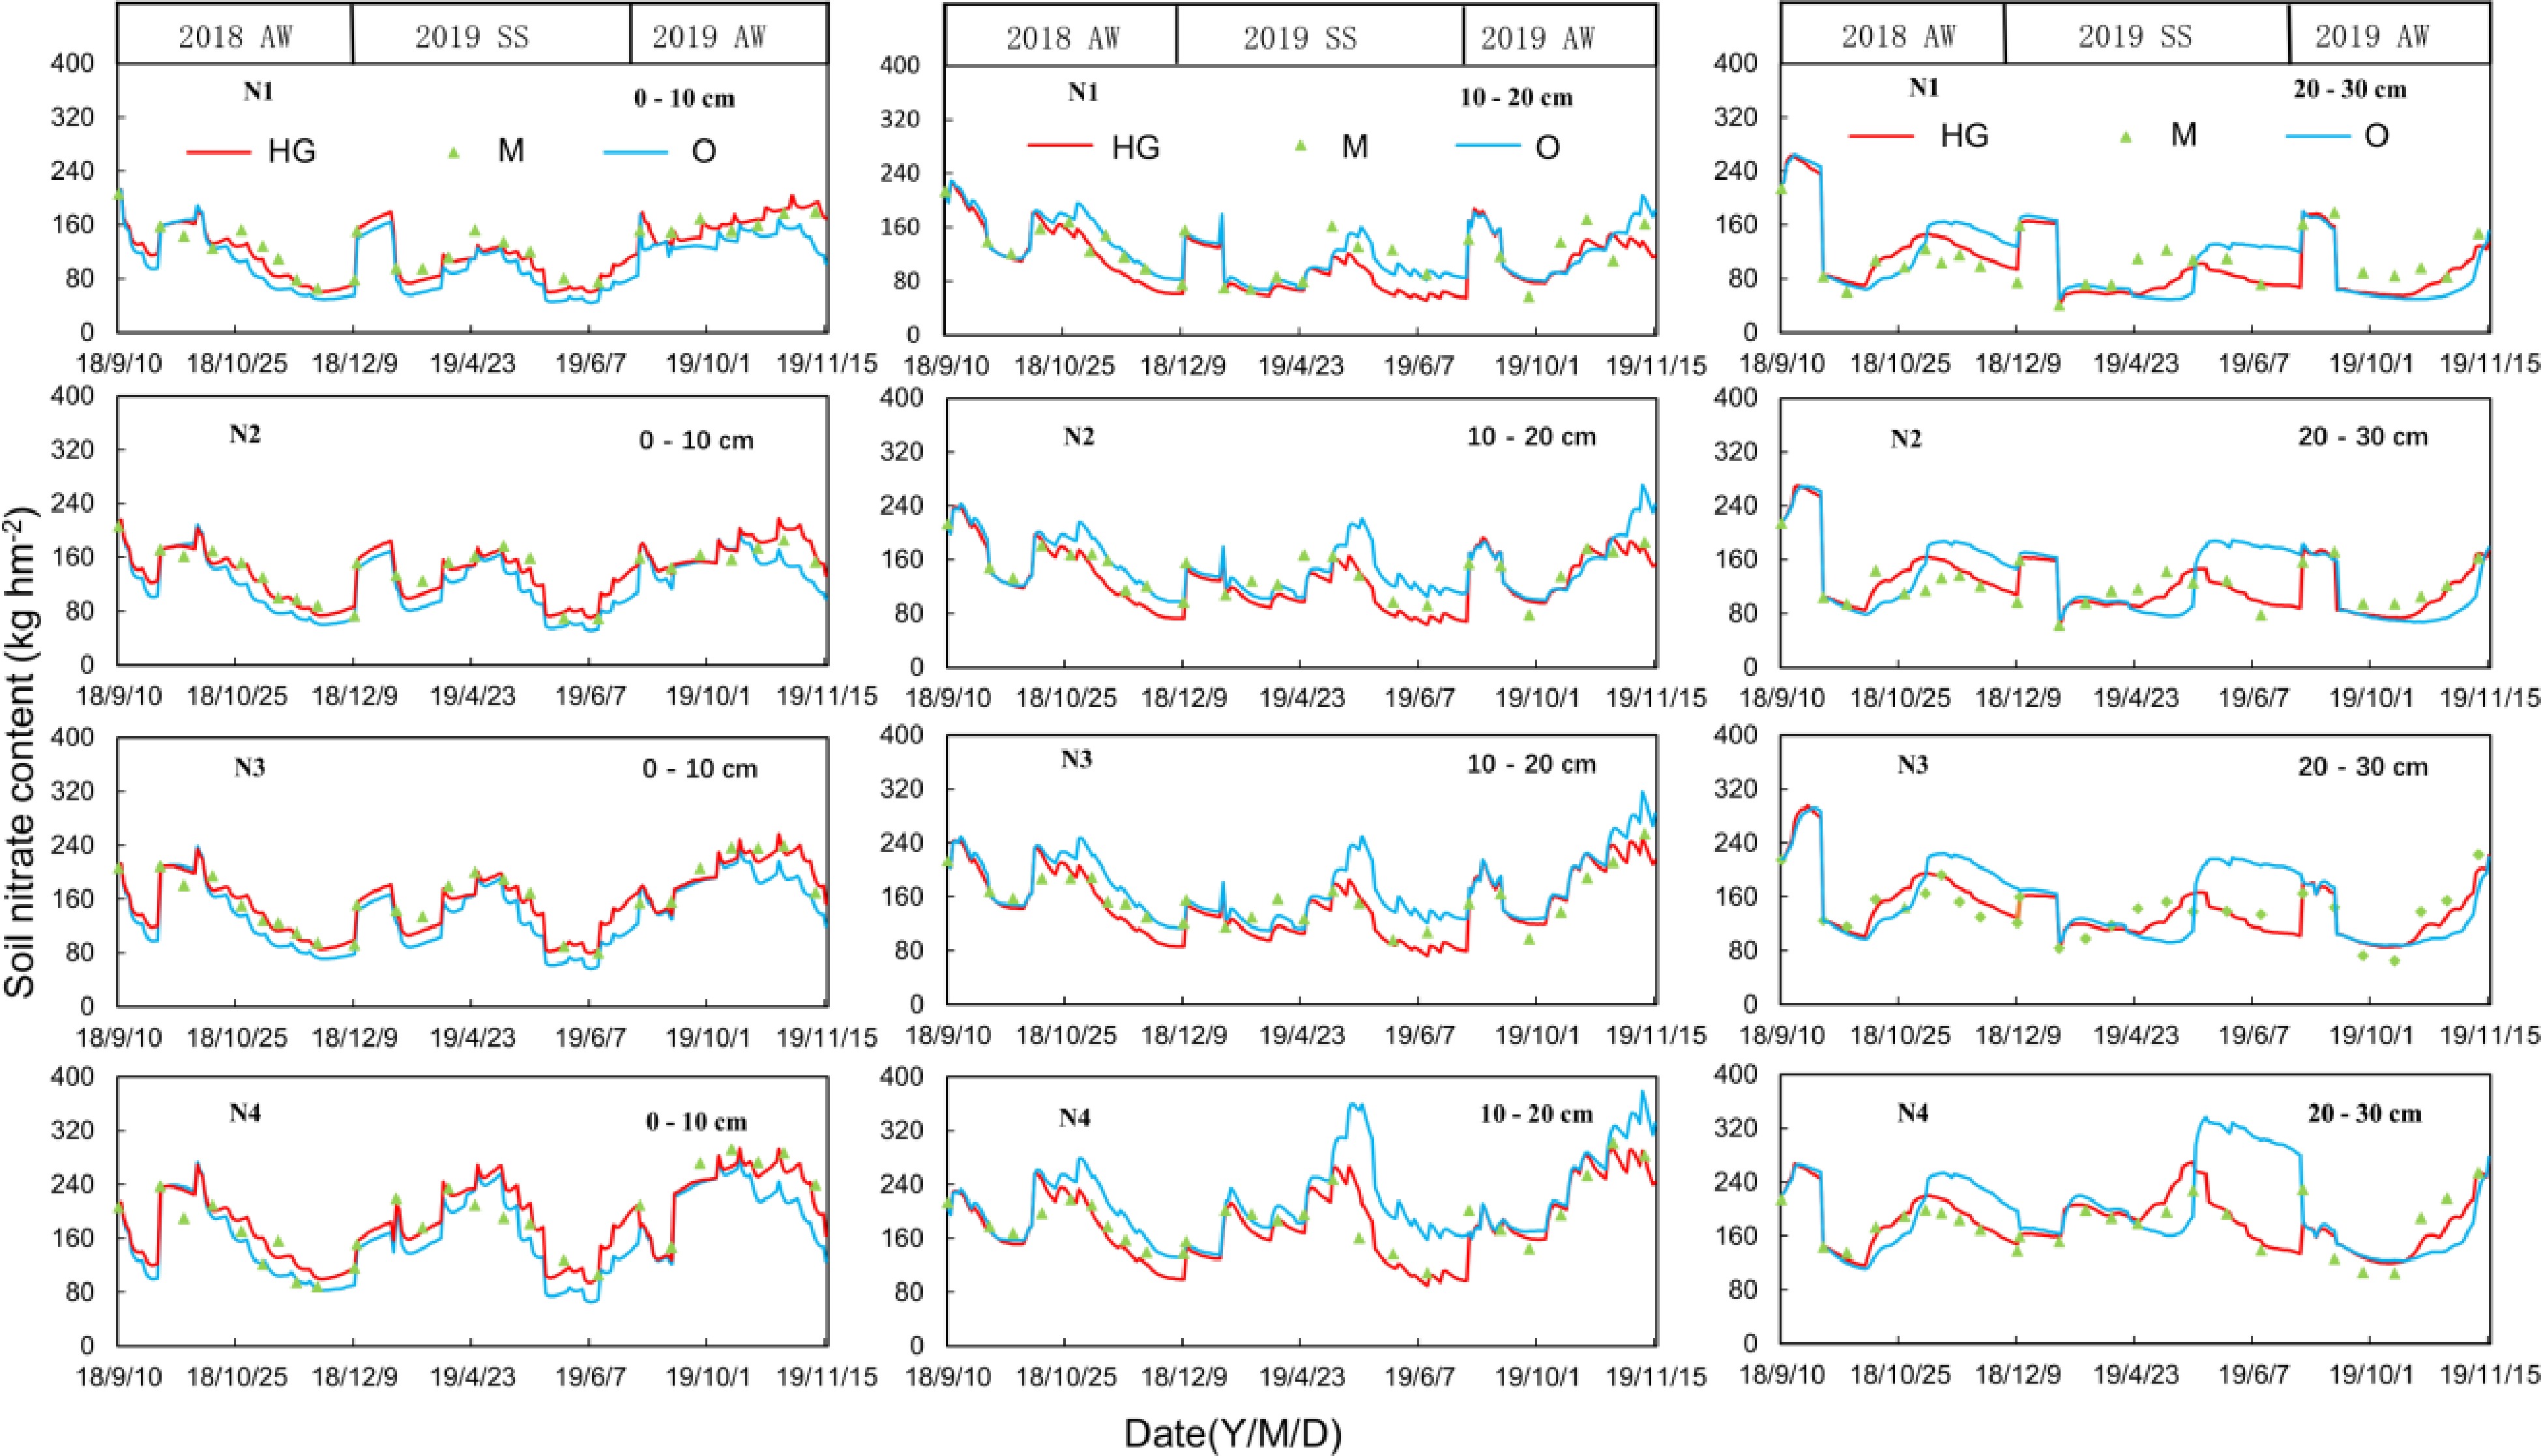
Figure 4.
The comparison between simulated and measured values of SNC in the 0–10 cm 10–20 cm and 20–30 cm soil layers. The red lines show the simulating value of the HG model (HG); the blue lines show the simulating values of the original model (O); the green dots show the measured values.
To further evaluate the performance of the HG model, three statistical methods (RMSE, NSE and d) were used. As shown in Table 6, the RMSEHG and RMSEO ranged from 16.537 to 35.332 and 21.098 to 30.059, respectively. In general, the RMSEHG was smaller than the RMSEO and closer to 1. The NSEO and NSEHG ranged from 0.369 to 0.758, and 0.431−0.795, respectively. The dO and dHG ranged from 0.854−0.945, and 0.863−0.956, respectively (Table 6). Compared with the original model, the NSE, and d values of the HG model were generally closer to 1 (Table 6). The RMSE, NSE and d values co-indicated that the HG model performed better in the simulation of SNC and was more suitable than the original model.
Table 6. Model evaluation index of SNC in greenhouse cucumber.
Treatment Soil layer (cm) RMSE NSE d Original model HG model Original model HG model Original model HG model N1 0−10 21.098 16.537 0.666 0.795 0.919 0.956 10−20 30.059 28.552 0.369 0.431 0.859 0.865 20−30 26.173 23.516 0.535 0.625 0.896 0.915 N2 0−10 25.126 25.126 0.525 0.525 0.902 0.902 10−20 27.563 22.541 0.282 0.520 0.871 0.902 20−30 22.872 19.607 0.486 0.623 0.886 0.916 N3 0−10 27.903 27.903 0.631 0.631 0.914 0.914 10−20 26.187 21.916 0.495 0.646 0.916 0.929 20−30 24.775 19.558 0.540 0.713 0.874 0.924 N4 0−10 27.875 35.332 0.758 0.631 0.945 0.905 10−20 24.198 24.198 0.705 0.705 0.938 0.938 20−30 27.058 20.826 0.474 0.688 0.854 0.916 Simulation of cucumber dry weight and fruit yield
-
The dry weights of the N2−N4 treatments of the three crops were collected and compared separately. The linear regression relationship of the measured values and simulated values is shown in Fig. 5. Overall, the measured dry weights were larger than the simulated values (Fig. 5). The correlation coefficients from linear regressions (R2) for simulated and measured dry matter of the three crops were 0.9949, 0.9871 and 0.9876, respectively, and were significant at P < 0.05 (0.007, 0.006 and 0.005) (Fig. 5). The slopes of the regressions for dry matter of the three crops were 0.8847, 0.8664 and 0.8905 and were close to 1 (Fig. 5). These results suggested that the HG model could successfully simulate the dry weight of cucumber of the N2-N4 treatments in this region.
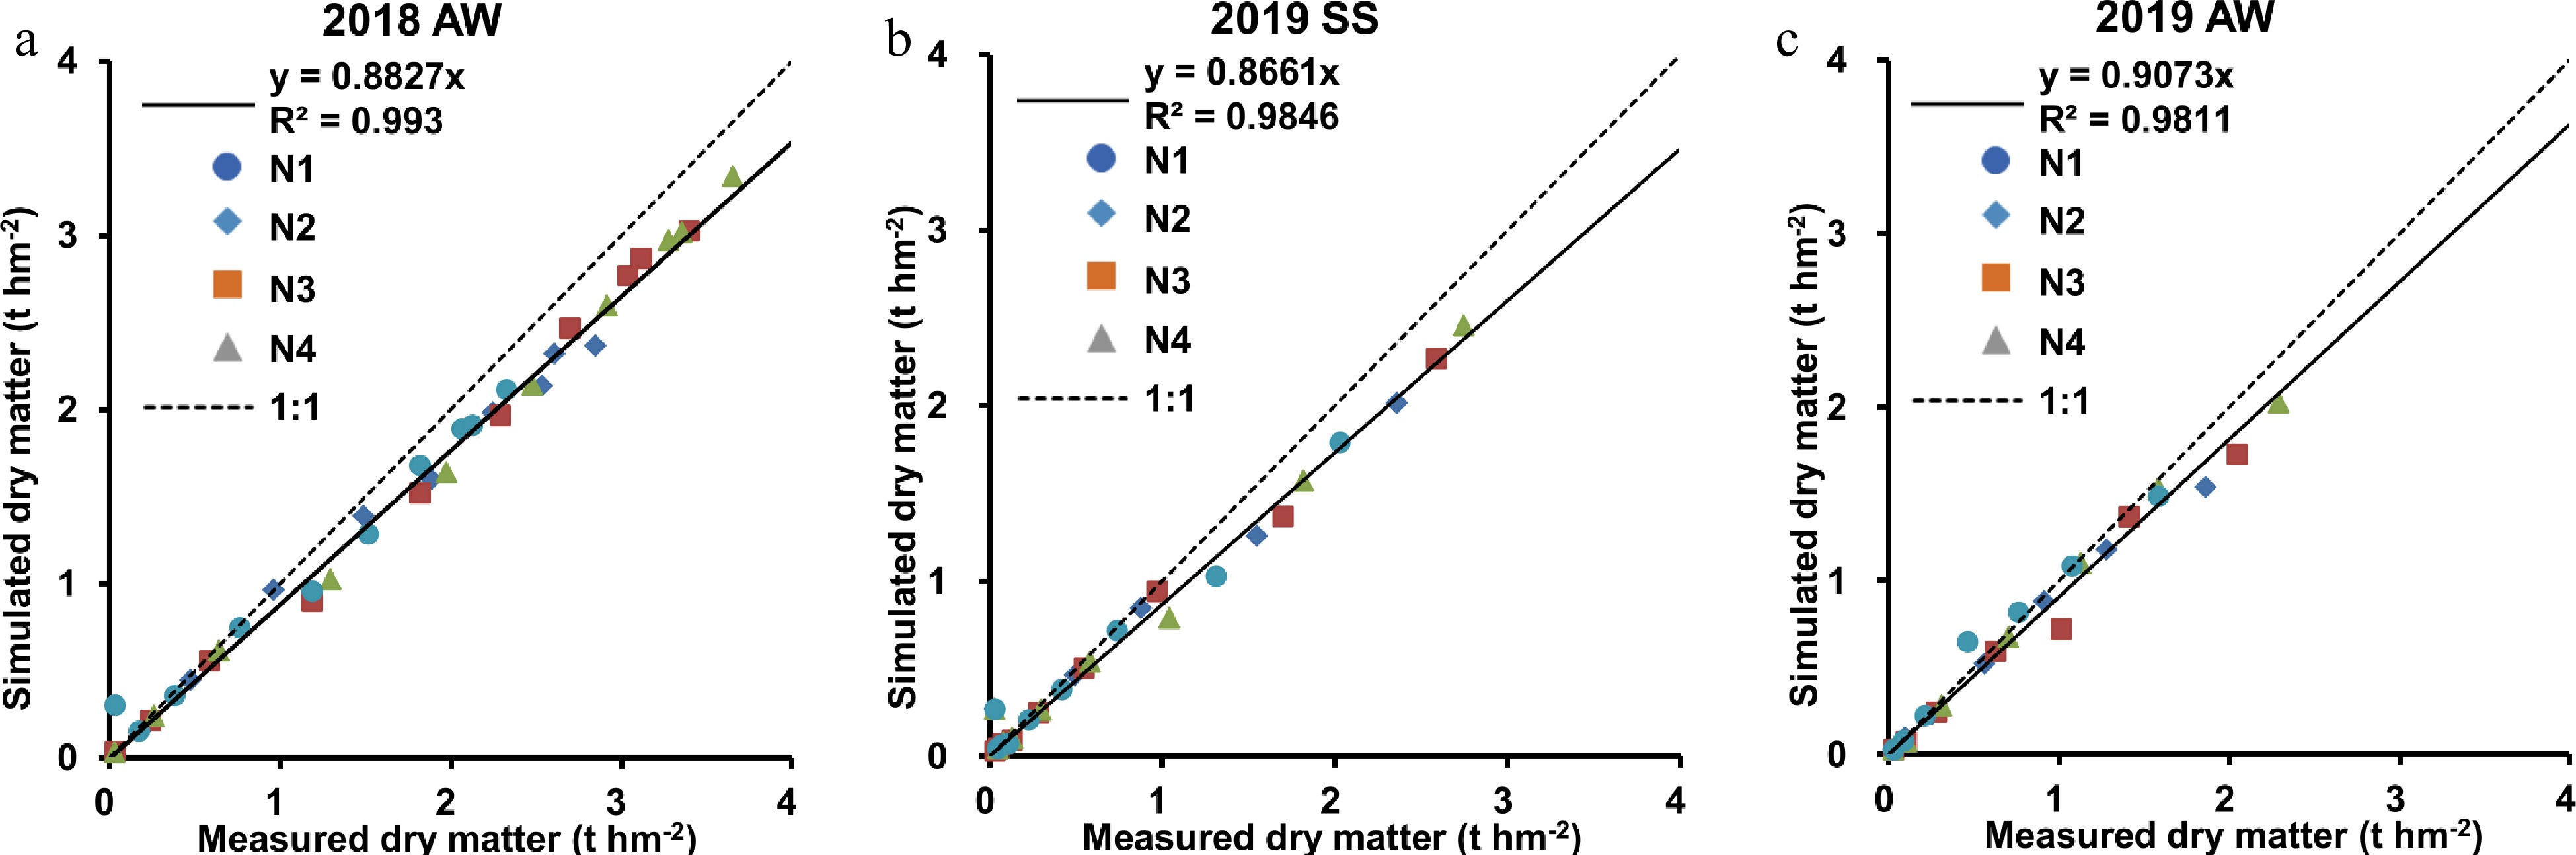
Figure 5.
Comparison between simulated and measured values of plant dry weight of two crops. The dates were collected from (a) 2018 AW, (b) 2019 SS, (c) 2019 AW treatment under N2-N4 treatments. The blue circles indicated the N1 treatments; the blue rhombus indicated the N2 treatments; the red square indicated the N3 treatments; the green triangle indicated the N4 treatments. The black line indicated the linear regression equation. The dotted lines show the 1:1 line.
For cucumber fruit yields, we compared the measured values and simulated values. As expected, the measured fruit yield was approximately 5% larger than the simulated fruit yield (Fig. 6). In the four N treatments, the fruit yields in the N3 and N4 treatments were higher than those of the N1 and N2 treatments (Fig. 6). Such a trend was shown in all the experients. These results suggested that the nitrogen fertilizer used in the N3 treatment was sufficient for cucumber fruit development, and the N3 treatment was the sub-optimal among the four N treatments under this condition (Fig. 6). This result was consistent with the recommended application amount according to the principle of nutrient balance. To validate the HG model on fruit yield, we used three statistical methods (RMSE, NSE and d value). The RMSE values of the three crops were 4.156, 2.094 and 3.248; the NSE values were 0.569, 0.967 and 0.776; and the d values were 0.687, 0.992 and 0.957, respectively. As the NSE and d values fit the criteria (NSE > 0.36,d > 0.7) well, the HG EU-Rotate_N model could successfully calculate the cucumber yield in areaHG (Table 7).
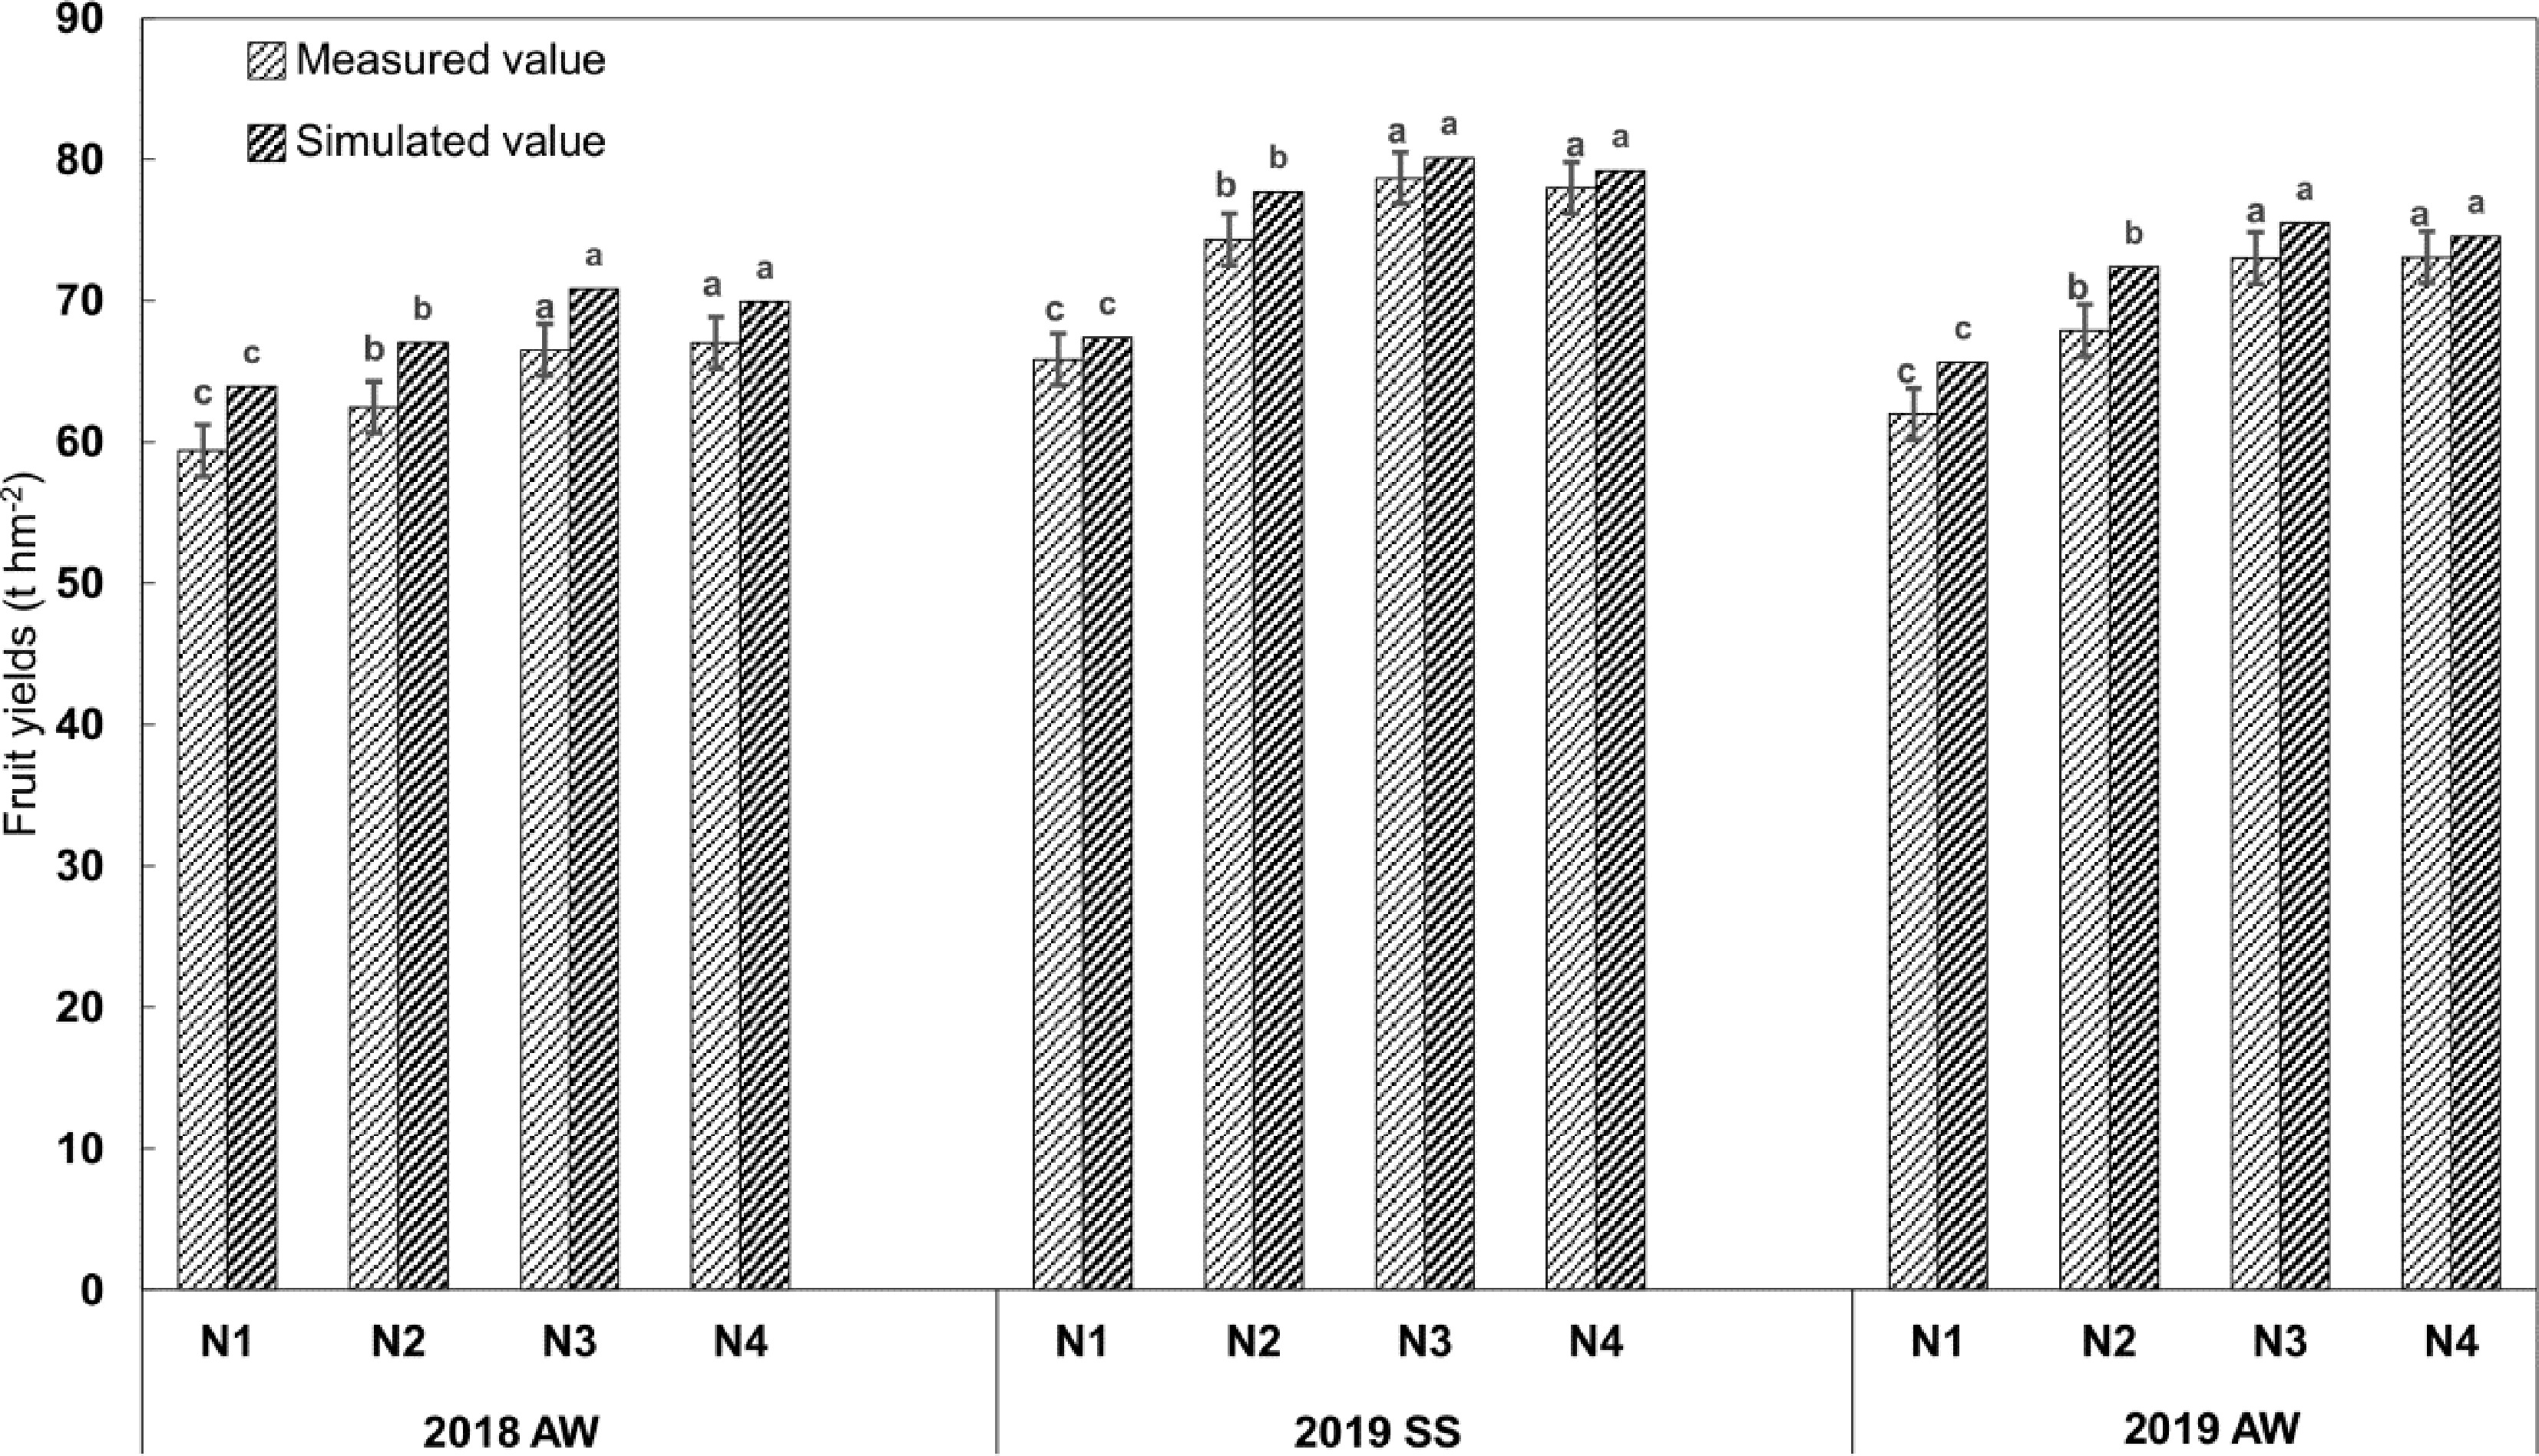
Figure 6.
Comparison of simulated and measured values of cucumber yield in four N treatments.
Table 7. Model evaluation for the greenhouse cucumber yield.
Treatment RMSE NSE d 2018 AW 4.156 0.769 0.687 2019 SS 2.094 0.967 0.992 2019 AW 3.248 0.776 0.957 -
Previous work showed that the EU-Rotate_N model simulated the soil available nitrogen concentration, water content and crop yield of different crops well for different crops grown in the greenhouse, including tomato, cucumber and all other vegetables[20, 29, 41,42, 62]. In those studies, most of them used the default species specific calibration values provided in the crop table of the model[20, 29, 38, 41,42, 50]. According to the conditions of the N3 tratments, there were several parameters adjusted in this study. Among those parameters, the base temperature was adjusted from 7 to 12 °C; the H_max was adjusted from 0.2 to 2.1 m; the crop coefficient (K_ini, K_mid, K_end) were downregulated (Table 4). In the greenhouse cucumber grown in North China, the base temperature was kept at 7 °C and the H_max was adjusted from 0.2 to 1.5 m[20, 30]. The different cucumber cultivar and planting modes in this study might contribute to the changes of crop coefficient and H_max[20, 30]. Compared with those in the original model, the RMSE, NSE and d values indicated that the HG model had better performance in simulating SWC and SNC in the 10-30 cm soil layers (Figs 3,4& Tables 5,6). The results also suggested the modification of the model was essential for it to be employed in the situation of a high groundwater level. Based on the above assessment, it is reasonable to conclude that the HG EU-Rotate_N model was more suitable to predict soil water and N dynamics, and thus had a potential to be used to devise the best management practices (BMPs) of greenhouse cucumber plantation in the areaHG.
Effect of high groundwater on soil water content
-
The EU-Rotate_N model performed satisfactorily in the simulation of SWC in the 0−60 cm soil layer with a better performance in the 30−60 cm soil layer[30, 38, 41]. There have been reports that SWC was negatively correlated with the groundwater level and the shallow groundwater contributed to root transpiration[63−65]. In our study, in the 0−10 cm soil layer, the measured SWC performed fairly well with the simulated SWC, suggesting that the high groundwater had a minor effect on water content in this soil layer in the areaHG (Fig. 3). In the 10-30 cm soil layer, the measured values and SWCHG were often higher than SWCO (Fig. 3). Interestingly, this phenotype usually occurred in the middle growth period of cucumber development, and this might be the result of the higher water requirement of cucumber plant in the middle growth period and the higher groundwater could provide the more abundant SWC via capillary action (Fig. 3).
Effect of high groundwater on soil available nitrogen concentration
-
In general, EU-Rotate_N model performed well in simulating SNC under different growth conditions and the management of water and fertilizer[20, 28−30]. Previous studies indicated that groundwater level plays a critical role in determining the movement of soil nitrogen and the deeper groundwater level increases the nitrate nitrogen leaching[66,67]. In the middle and late growth periods of cucumber plant, the difference between SNCM, SNCHG and SNCO were larger with the increase in dosage of nitrogen application, especially in the N4 treatments (Fig. 4). In our study, SNCM and SNCHG were higher than SNCO in the 0−10 cm soil layer, whereas, SNCM and SNCHG were lower than SNCO in the 10−20 cm and 20−30 cm soil layers (Fig. 4). The higher N requirement in the middle and late period of cucumber plant might be the reason for this phenotype. Overall, the high groundwater level might increase the upward movement of the soil nitrogen.
Effect of high groundwater on yield
-
Previous studies showed that groundwater contributed the yield of the crops planted in the open field, e.g., maize, sorghum and sunflower[52−54]. However, in this study, there was no significant difference in terms of the cucumber yield simulated by the original model and HG model, which indicated that the high groundwater might play a insignificant role in the determination of cucumber yield in the greenhouse in this study.
EU-Rotate_N model has been well established for crops grown under the condition of deep groundwater level. In this study, we first modified the model by altering the algorithm for computing soil water content, and then applied it to the greenhouse cucumber with a high groundwater level. By comparing the water content, available nitrogen concentration in the 0−10, 10−20, 20−30 cm soil layers, dry weight, yield of cucumber, the HG model performed better than the original model. Besides, the high groundwater level increased the upward movement of nitrogen. Those results suggested that the presented HG model is a valuable tool that could be used for devising good farming practices of greenhouse cucumber in areas with high groundwater level.
This research was supported by the Special Funds for Scientific and Technological Innovation of Jiangsu province, China (BE2022425), Project of Jiangsu Province Science and Technology (BE2017380), the National Key Research and Development Program (2018YFD1000800) and the National Natural Science Foundation of China (32072579, 31672160 and 30871721).
-
The authors declare that they have no conflict of interest.
- Supplemental Fig. S1 The weather dataset collection. The blue line indicated the lowest temperature of one day (Tmin); the red line indicated the highest temperature of one day (Tmax); the green line indicated the hours of sunshine (Tsun).
- Supplemental Fig. S2 The method of soil sampling. The hexagon indicated the sampling sites.
- Supplemental Fig. S3 The schematic diagram of water level sensor. The dotted line shows the phreatic line.
- Supplemental Table S1 The amount of fertilizer used in three crops.
- Supplemental Table S2 The equations of SWC, SNC, cucumber yield.
- Copyright: © 2022 by the author(s). Published by Maximum Academic Press, Fayetteville, GA. This article is an open access article distributed under Creative Commons Attribution License (CC BY 4.0), visit https://creativecommons.org/licenses/by/4.0/.
-
About this article
Cite this article
Hua B, Cao Z, Zhang K, Xu X, Zhang Y, et al. 2022. Simulation of greenhouse cucumber growth, water and nitrogen dynamics in areas with high groundwater (HG) levels using the HG EU-Rotate_N model. Vegetable Research 2:16 doi: 10.48130/VR-2022-0016 

Simulation of greenhouse cucumber growth, water and nitrogen dynamics in areas with high groundwater (HG) levels using the HG EU-Rotate_N model
- Received: 05 May 2022
- Accepted: 13 October 2022
- Published online: 29 November 2022
Abstract: The fruit yield of cucumber are associated with high input of nitrogen, which poses a risk of pollution to the environment. The EU-Rotate_N model has been used widely for its high performance in the simulation of vegetable growth, water and nitrogen dynamics. However, whether the underground water level affects the performance of the EU-Rotate_N model is unclear. In this study, we modified the groundwater level algorithms to the original model and named the modified model 'the HG EU-Rotate_N model'. Experiments over two years on greenhouse cucumber with four different nitrogen (N) treatments (N1-N4) were conducted in Jiangsu Province, China, which has a high groundwater level (areaHG). Both original and modified models were used to simulate cucumber growth, water movement and N fate. For the soil water content, the measured values were significantly larger than the simulated values of the original model (valueO) and closer to those of the HG model (valueHG); for the soil available nitrogen concentration (SNC), the measured values were significantly higher and lower than valueO in 0−10 cm and 10−30 cm soil layers, respectively, and were also closer to those of the valuesHG. The higher SNC in the 0-10 cm soil layer indicated that a high groundwater level might increase the upwards movement of water and nitrogen in the 0-30 cm soil layer. The root mean square error, Nash Sutcliffe Efficiency and difference values show that the HG model was more applicable for areaHG than the original model. In this study, the nitrogen dosage of the N3 treatment was sufficient to meet the requirements of cucumber growth, indicating that the fertilization recommendation according to nitrogen nutrient balance was applicable in this area.
-
Key words:
- EU-rotate_N model /
- High groundwater /
- Cucumber /
- Nitrogen /
- Greenhouse.