-
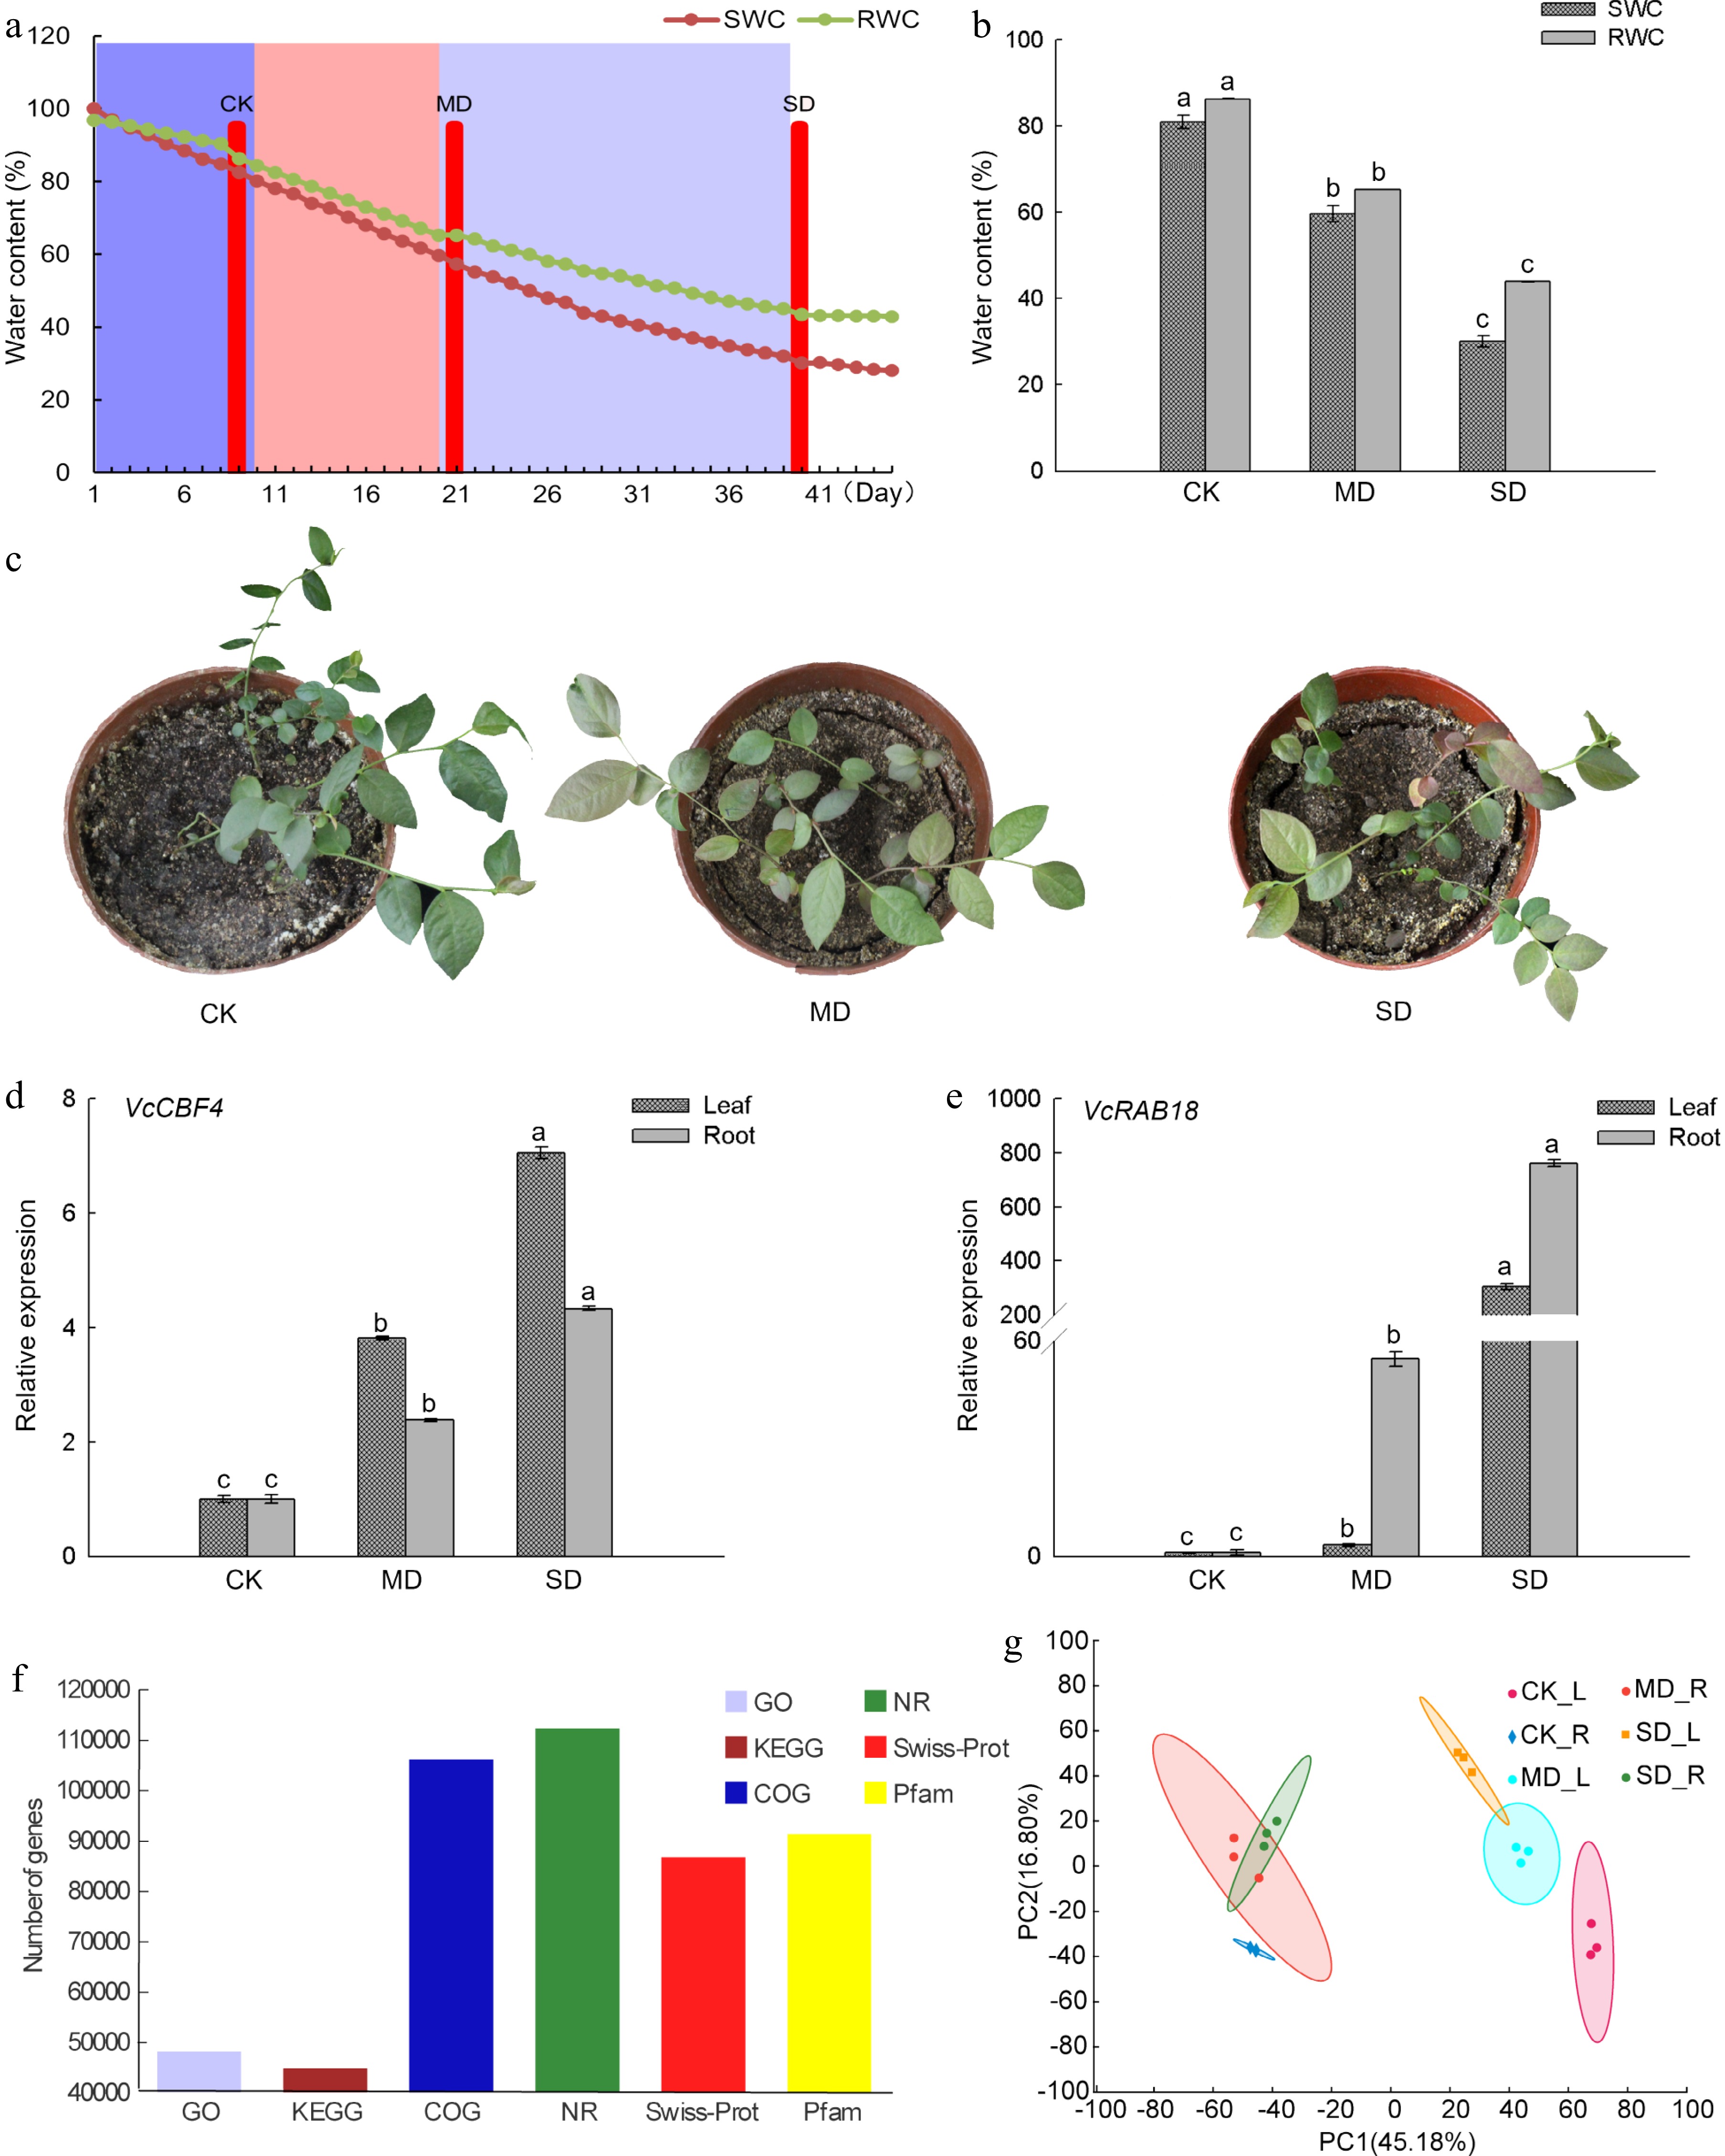
Figure 1.
Drought treatment and the analysis of gene sequence functional annotation in blueberry. (a) Relative SWC and RWC changes of blueberry, and the determination of three drought stress groups. CK, control group; MD, moderate drought stress group; SD severe drought stress group. (b) Differences of SWC and RWC of the blueberry leaf under drought stress groups. (c) Growth status of blueberry seedlings under three drought stress groups. (d) Expression of VcCBF4 f blueberry under drought stress. (e) Expression of VcRAB18 f blueberry under drought stress. (f) Functional annotation analysis of blueberry gene under drought stress. (g) PCA plots of genes identified by RNA-seq of blueberry leaves and roots under drought stress. Each value was represented as the mean value ± standard error of three independent determinations. Different letters indicate that Duncan's multiple range test is significantly different at P < 0.05.
-
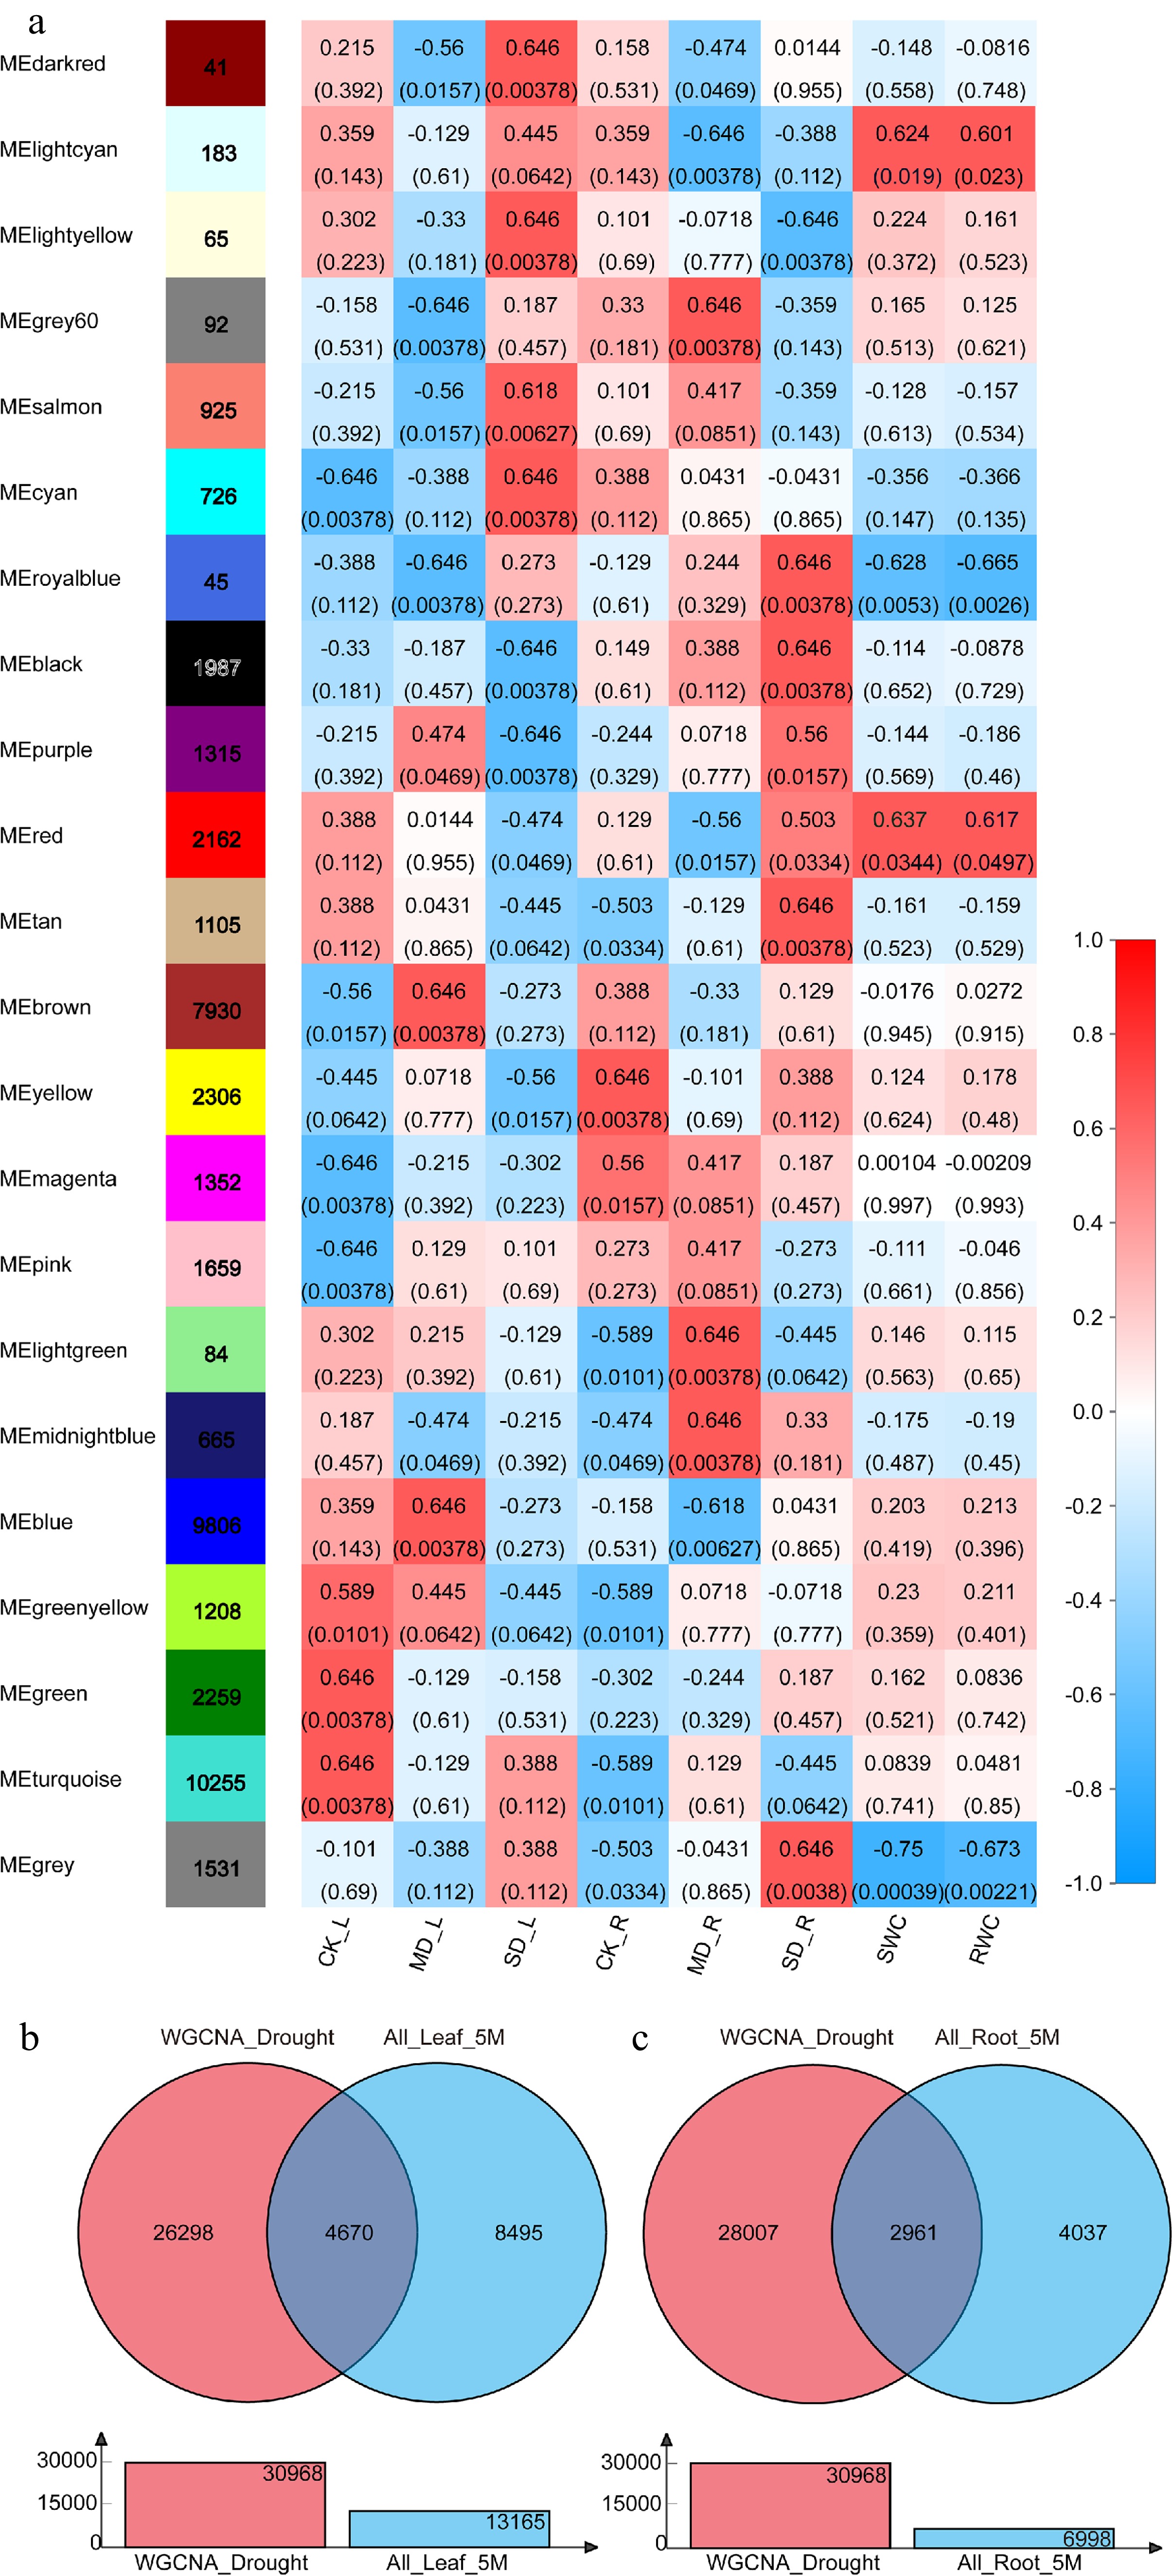
Figure 2.
Weighted gene co-expression network analysis and identification of DEGs in response to drought. (a) Heatmap of correlations (P-value in parentheses) of module eigengenes with the drought treatment, soil relative water content, and leaf relative water content. (b) Identification of DEGs in response to drought in leaves (Venn diagram of 'WGCNA_Drought' and 'All_Leaf_5M'). (c) Identification of DEGs in response to drought in roots (Venn diagram of 'WGCNA_Drought' and 'All_Root_5M').
-
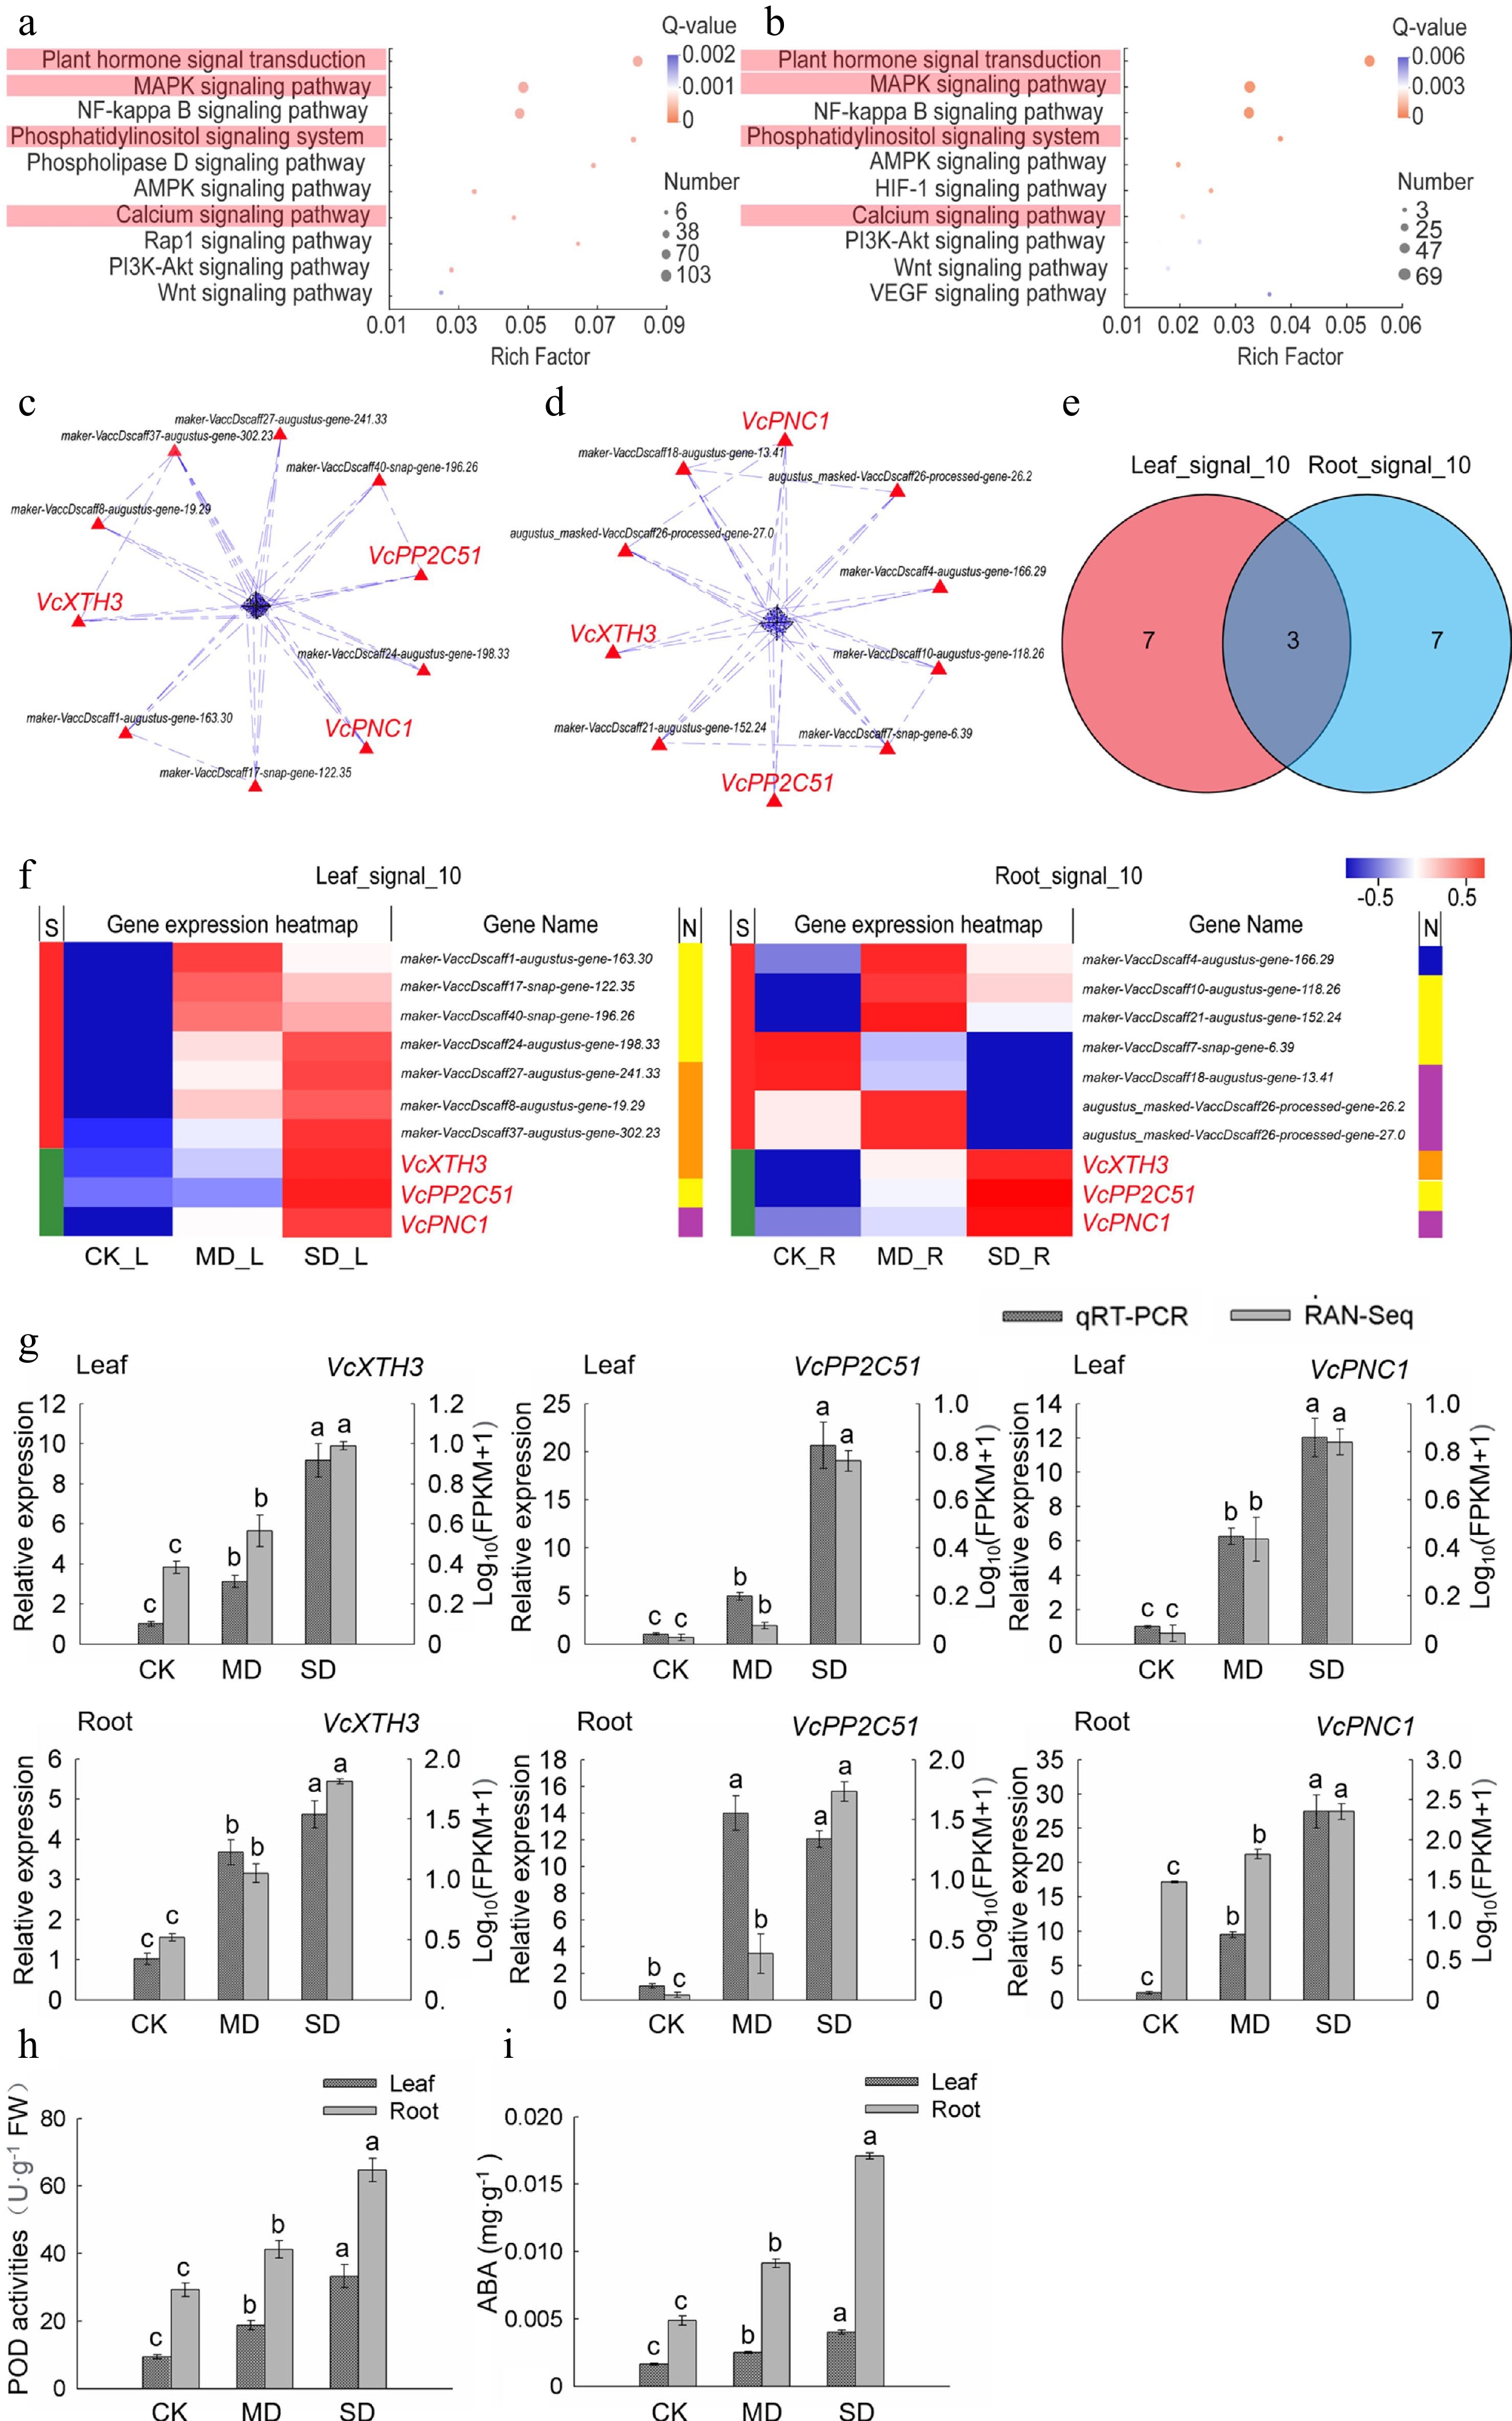
Figure 3.
Analysis of the key genes of signal transduction pathway in leaves and roots under drought stress. (a) KEGG enrichment analysis of plant signal transduction-related DEGs in leaves. (b) KEGG enrichment analysis of plant signal transduction-related DEGs in roots. (c) PPI analysis of 'All_Leaf_signal'. (d) PPI analysis of 'All_Root_signal'. (e) Venn analysis of 'Leaf_signal_10' and 'Root_signal_10'. (f) Hot map analysis of 'Leaf_signal_10' and 'Root_signal_10'. S indicates the difference between 'Leaf_signal_10' and 'Root_signal_10', different genes between the two groups were represented by red color while those being the same are shown in green; function corresponding to each gene in two groups was shown in the N line, purple is reactive oxygen species metabolic and biosynthetic process-related gene, yellow indicates MAPK signaling pathway-related gene, orange is plant hormone signal transduction-related gene, and blue represents calcium signaling pathway-related gene. (g) Relative gene expression (VcPP2C51, VcXTH3, and VcPNC1) in blueberry leaves and roots exposed to drought stress as determined by qRT-PCR with VcUBC28 as the internal reference gene. (h) POD activities in blueberry leaves and roots under drought stress. (i) ABA content in blueberry leaves and roots under drought stress.
-
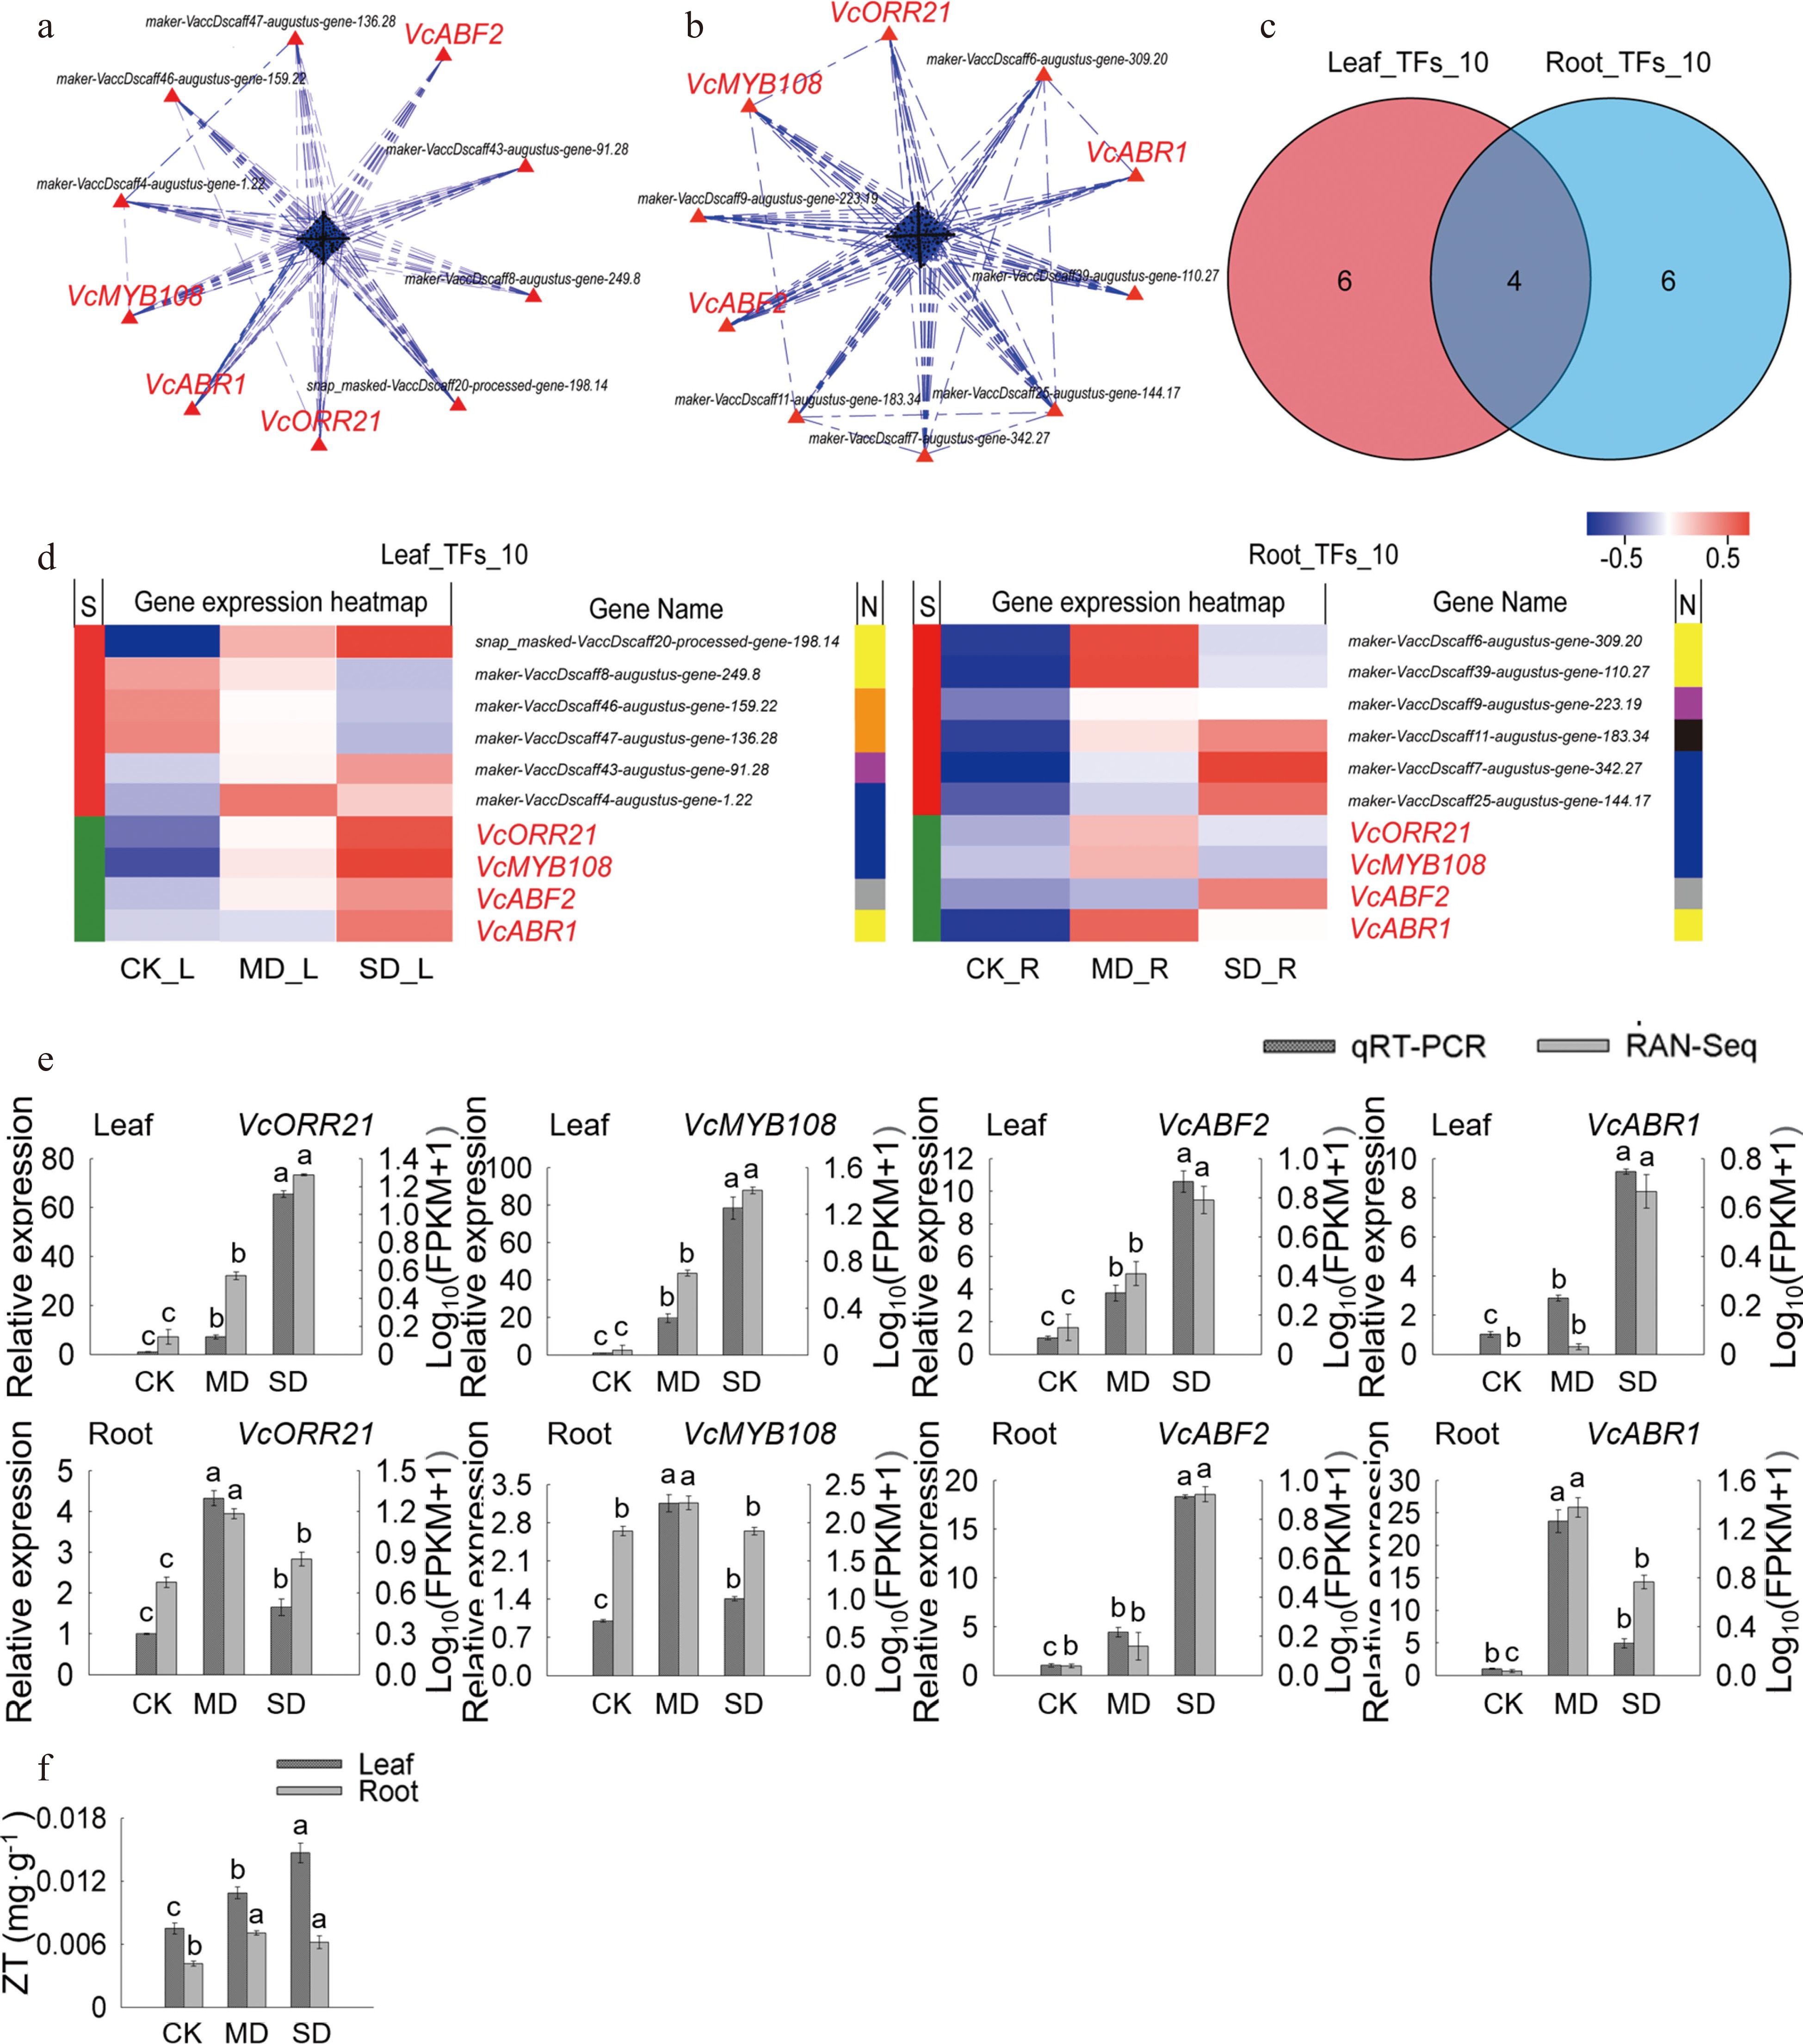
Figure 4.
Analysis of key TFs in leaves and roots under drought stress. (a) PPI analysis of 'All_Leaf_TFs'. (b) PPI analysis of 'All_Root_TFs'. (c) Venn analysis of 'Leaf_TFs_10' and 'Root_TFs_10'. (d) Hot map analysis of 'Leaf_TFs_10' and 'Root_TFs_10'. S indicates the difference between 'Leaf_TFs_10' and 'Root_TFs_10', different genes between the two groups were represented by red color while those being that same are shown in green; TFs families corresponding to each gene in two groups was shown in N line, yellow, orange, purple, blue, grey and black indicates AP2/ERF family, bHLH family, WRKY family, MYB family, bZIP family and MYB_related family, respectively. (e) Relative gene expression (VcABF2, VcABR1, VcMYB93, and VcMYB108) in blueberry leaves and roots when exposed to drought stress as determined by qRT-PCR with VcUBC28 as the internal reference gene. (f) ZT content in blueberry leaves and roots under drought stress.
-
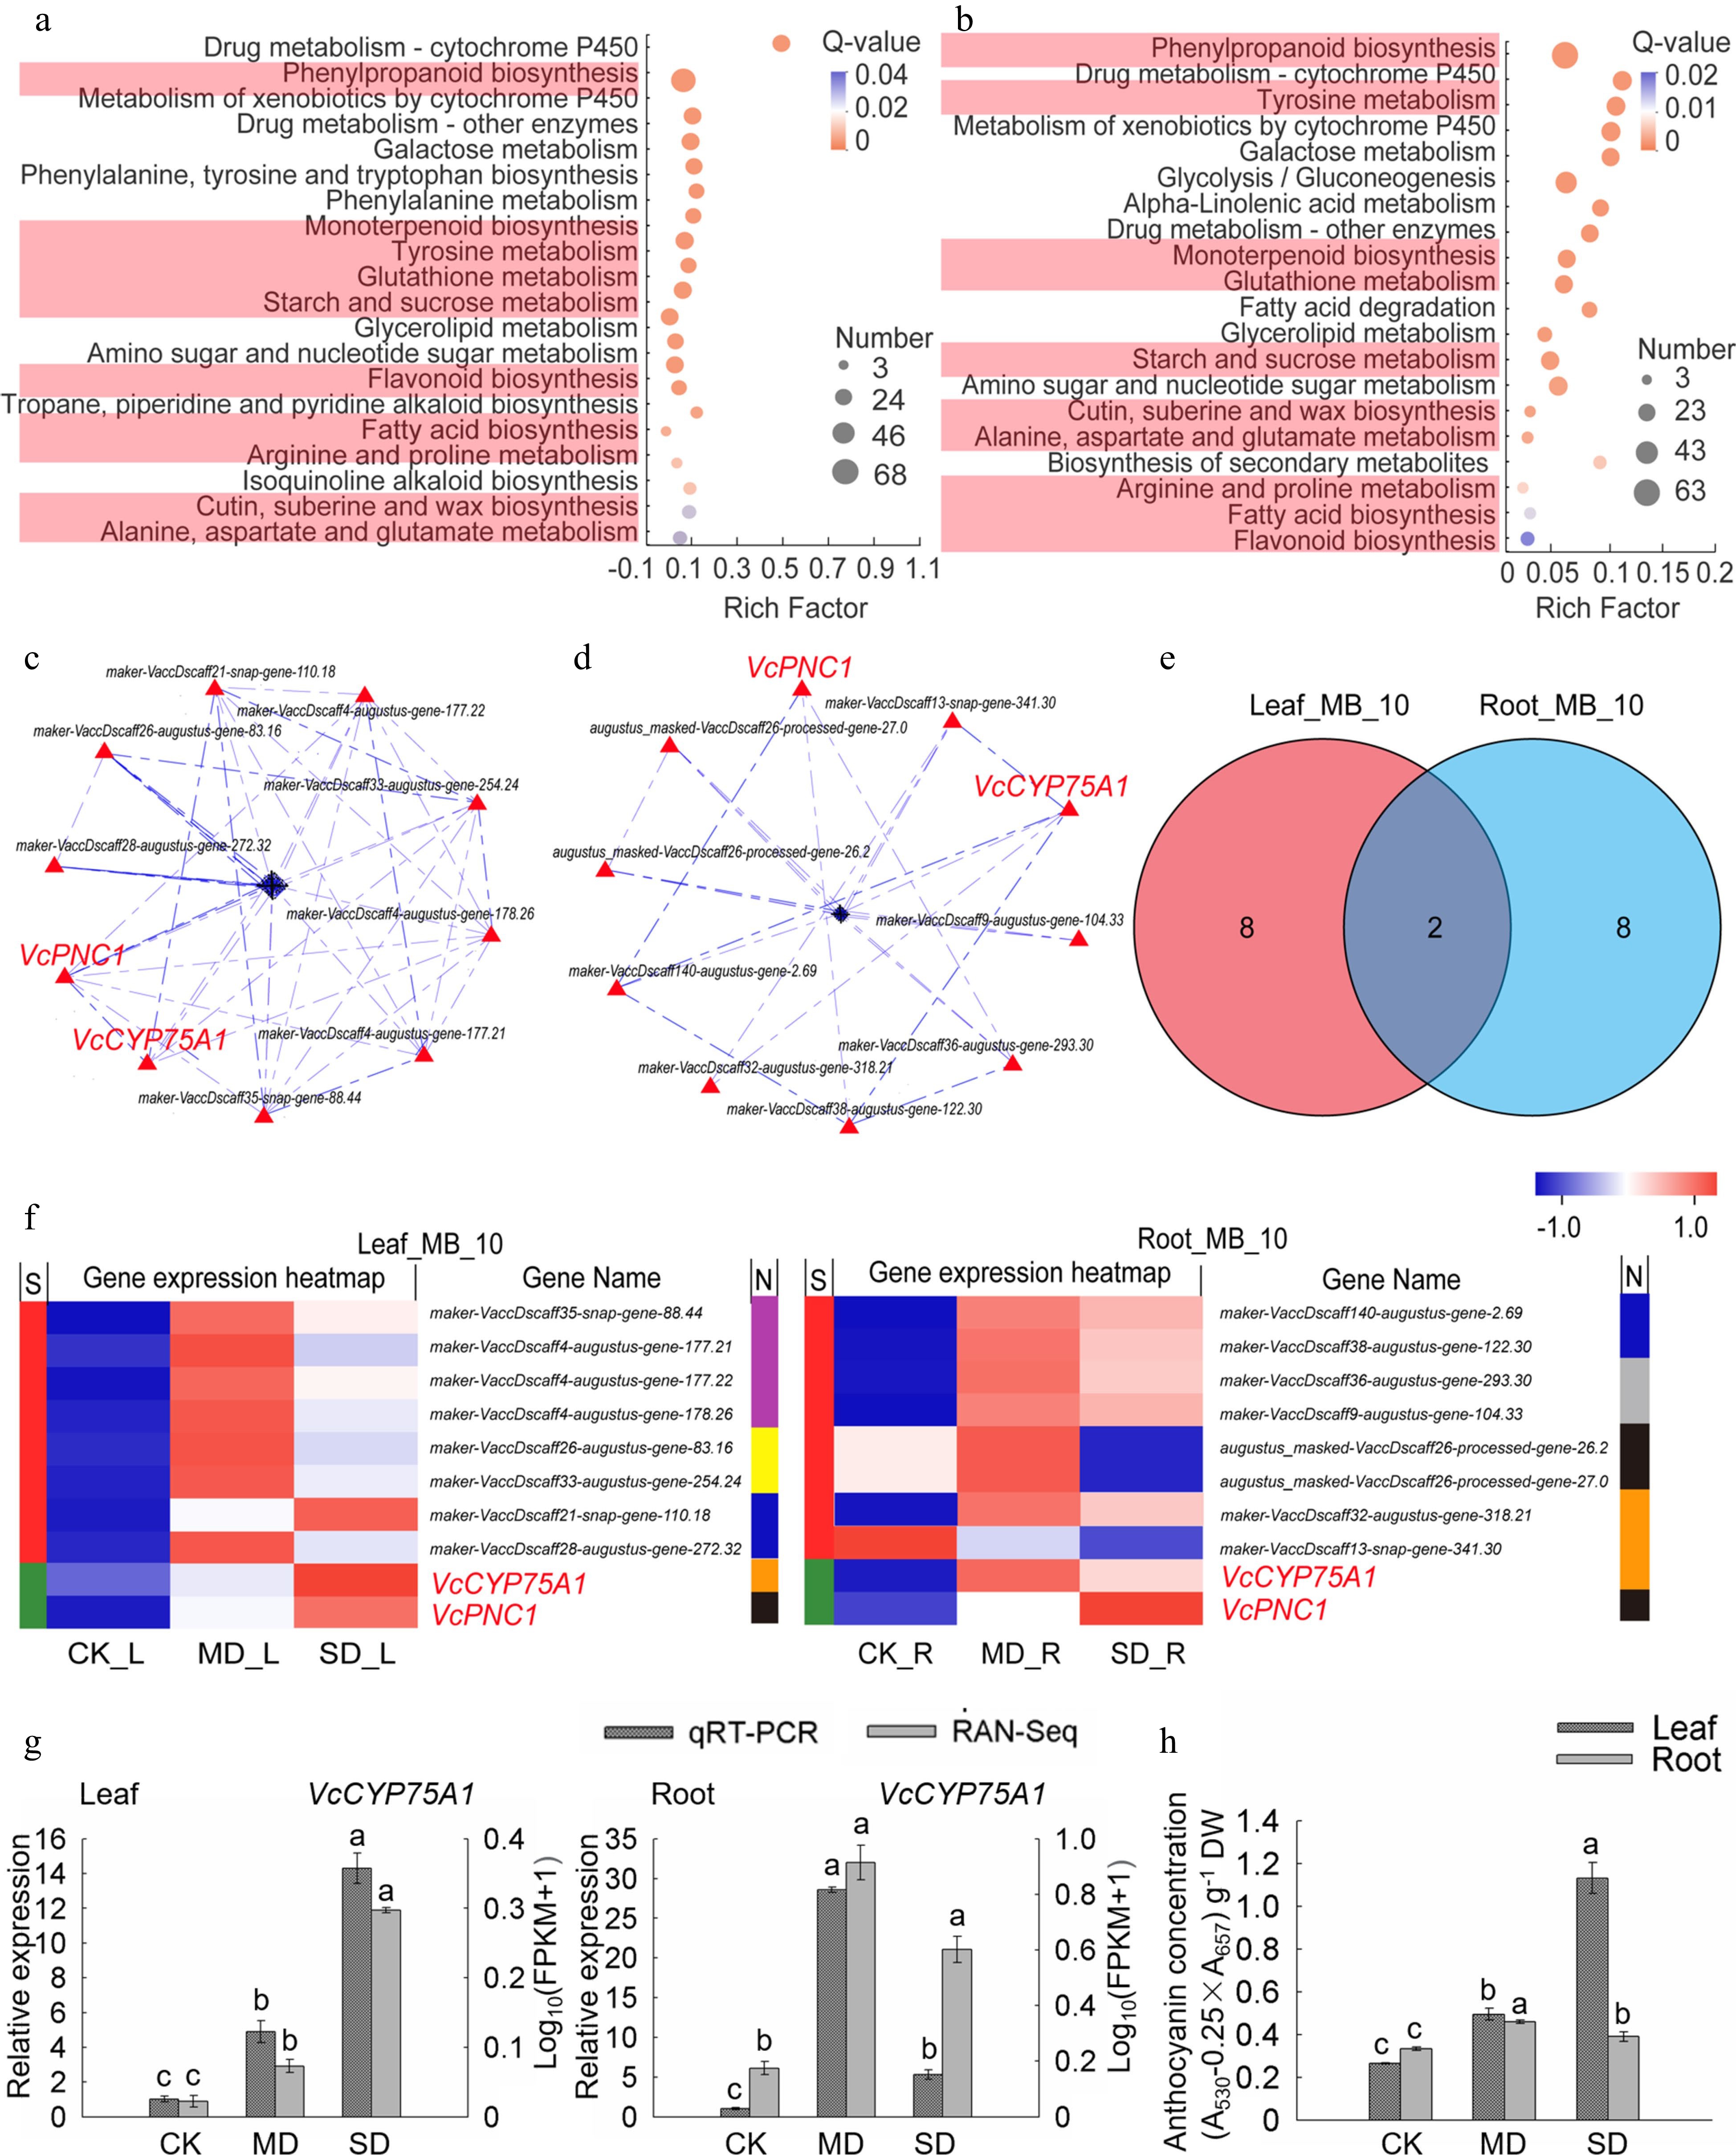
Figure 5.
Analysis of key genes of metabolism and biosynthesis in leaves and roots under drought stress. (a) KEGG enrichment analysis of the metabolism and biosynthesis-related DEGs in leaves. (b) KEGG enrichment analysis of the metabolism and biosynthesis-related DEGs in roots. (c) PPI analysis of 'All_Leaf_MB'. (d) PPI analysis of 'All_Root_MB'. (e) Venn analysis of 'Leaf_MB_10' and 'Root_MB_10'. (f) Hot map analysis of 'Leaf_MB_10' and 'Root_MB_10'. S indicates the difference between 'Leaf_MB_10' and 'Root_MB_10', Different genes between the two groups were represented by red color while those being the same are shown in green; metabolisms corresponding to each gene in two groups was shown in N line, purple, yellow, blue, brown, black, grey and indigo indicates monoterpenoid biosynthesis, starch and sucrose metabolism, cutin, submarine and wax biosynthesis, flavonoid biosynthesis, phenylpropanoid biosynthesis, fatty acid biosynthesis, and tyrosine metabolism, respectively. (g) Relative gene expression (VcCYP75A1) in blueberry leaf and root from plants exposed to drought stress as determined by qRT-PCR with VcUBC28 as the internal reference gene. (h) Anthocyanin concentration in blueberry under drought stress.
-
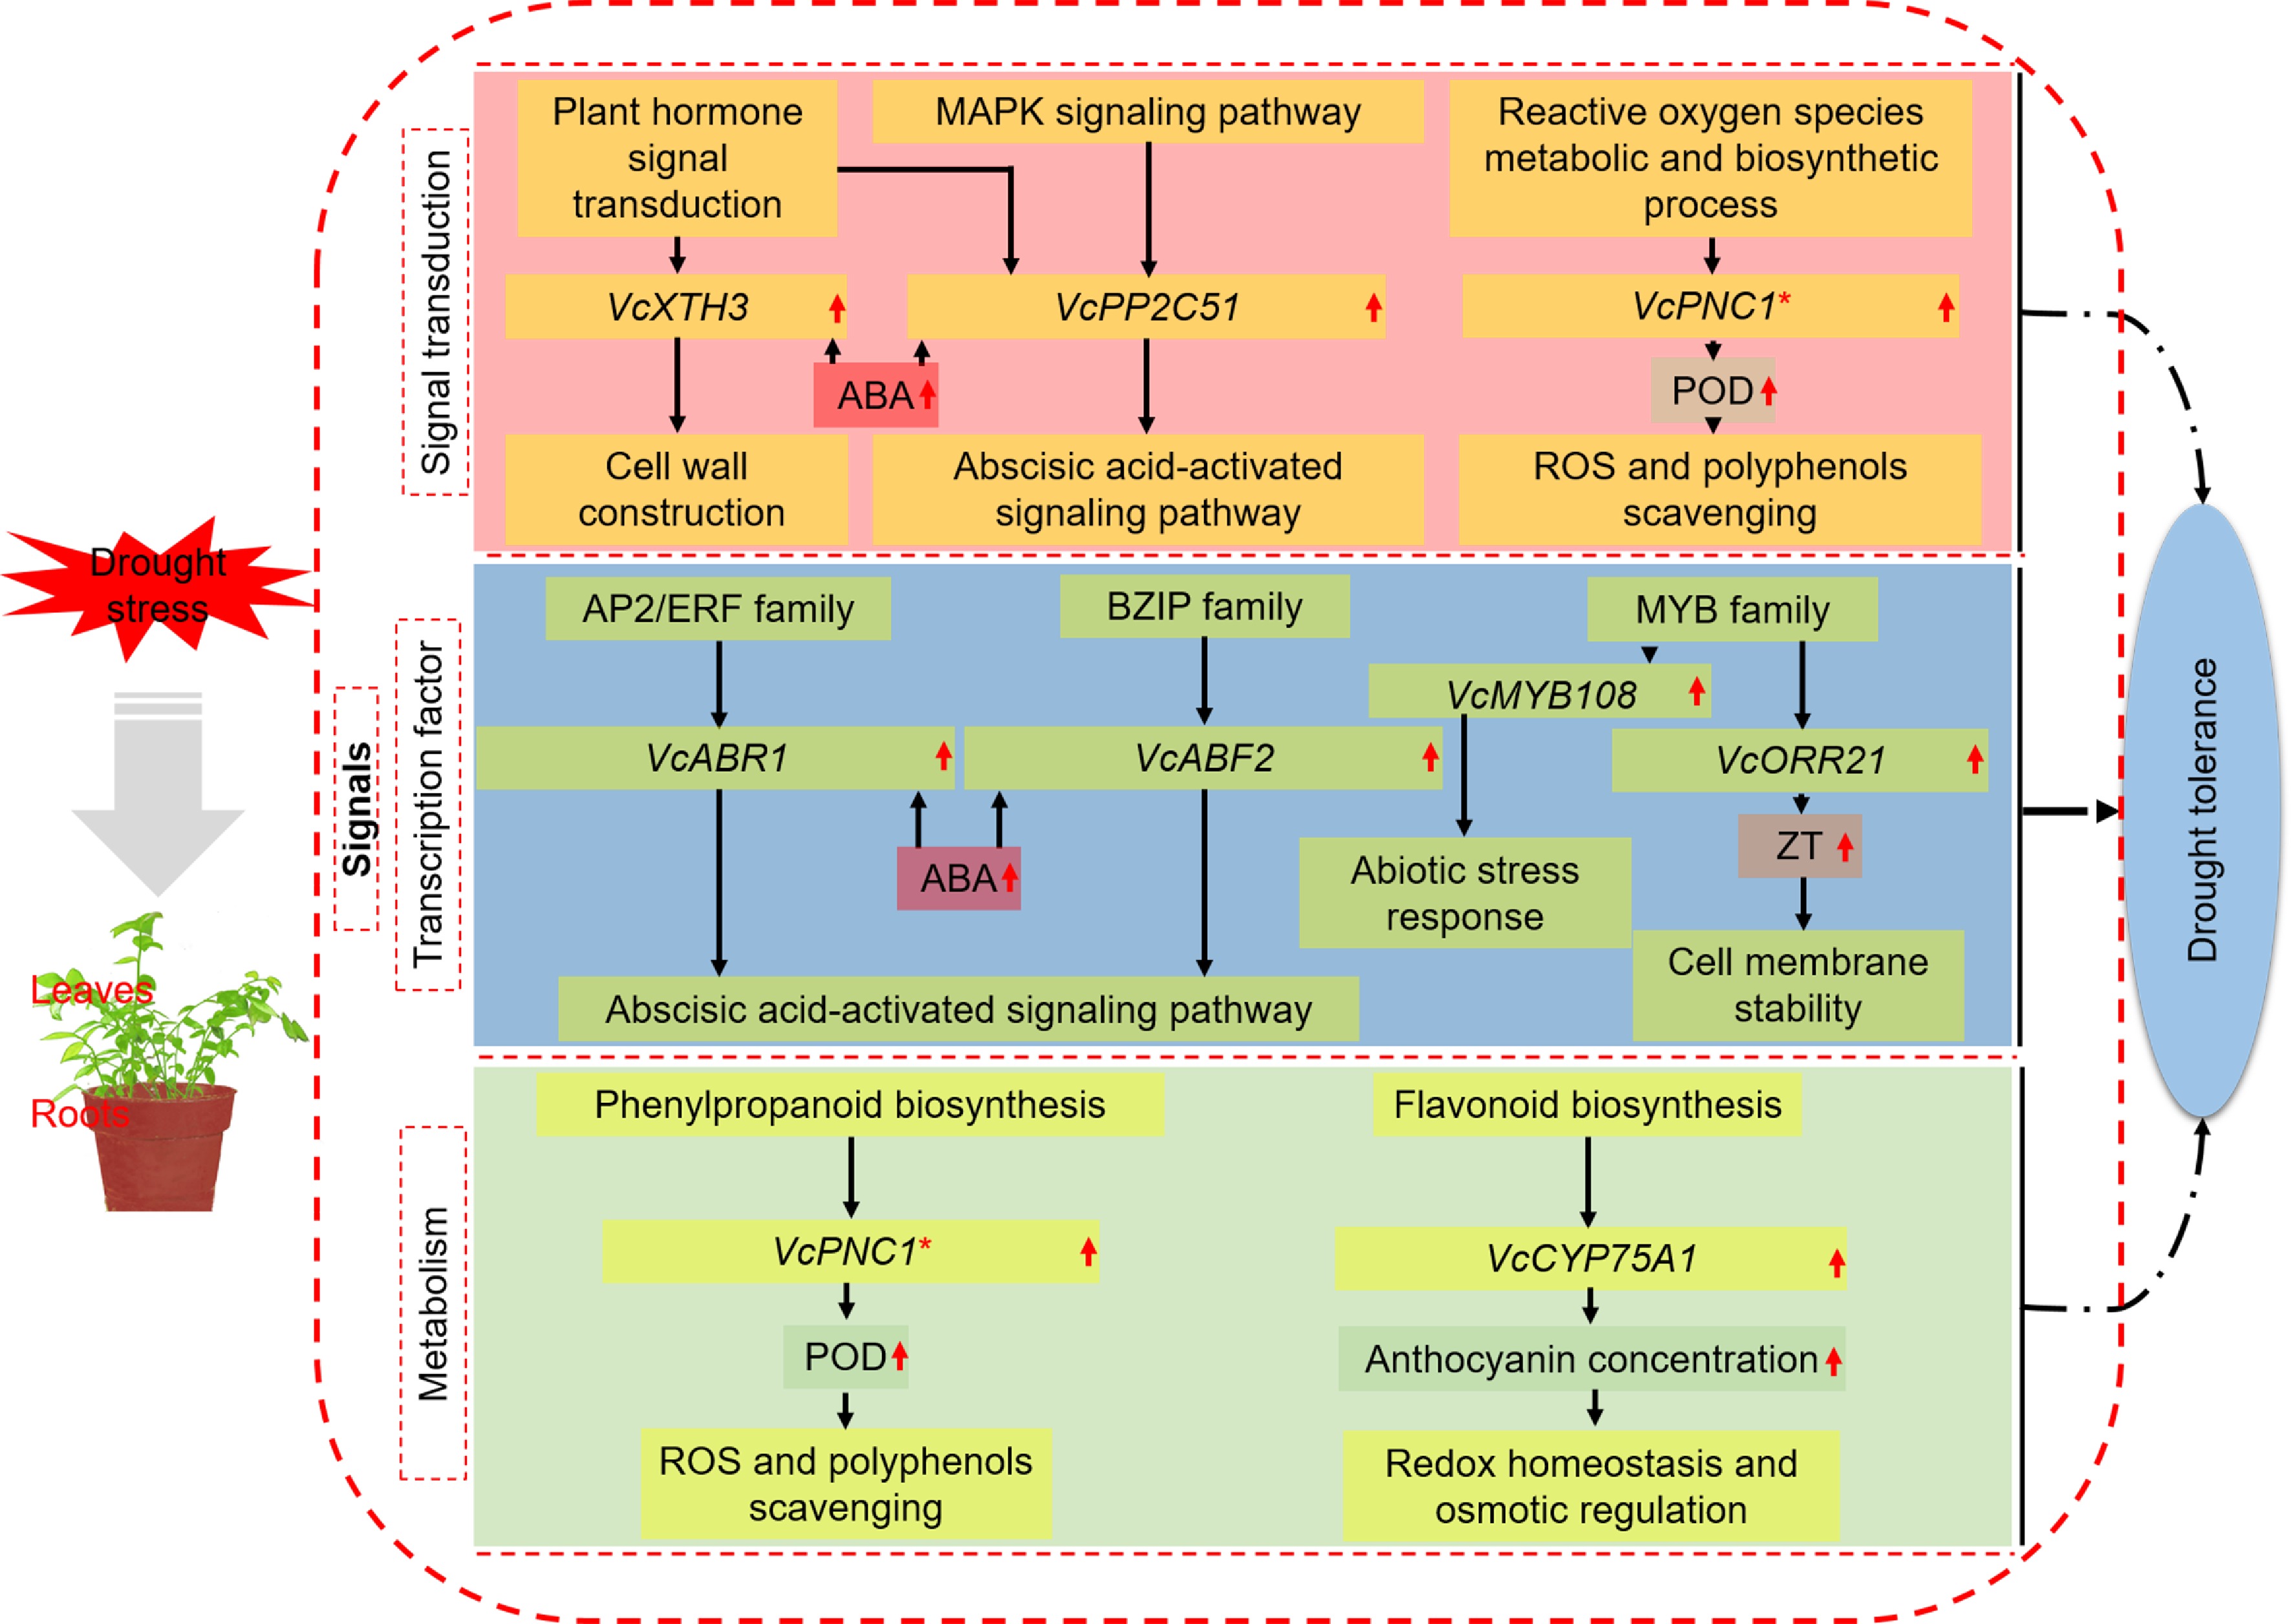
Figure 6.
A model for mechanisms underlying the enhanced drought tolerance shared by blueberry leaves and roots. * Important genes also identified in other categories.
-
Accession number Biological process Number of enriched genes Leaf_ Drought_5M Root_ Drought_5M GO:0055114 Oxidation-reduction
process310 227 GO:0005975 Carbohydrate metabolic process 194 123 GO:0009056 Catabolic process 170 111 GO:0050896 Response to stimulus 170 106 GO:0055085 Transmembrane transport 162 131 GO:0044248 Cellular catabolic process 125 95 GO:0006950 Response to stress 123 73 GO:0006811 Ion transport 122 100 GO:0071554 Cell wall organization or biogenesis biogenesis 86 28* GO:0034220 Ion transmembrane transport 84 67 GO:0044550 Secondary metabolic process 73* 54 * Not included in the 10 GOs with the highest enrichment. Table 1.
GO analysis of blueberry leaf and root DEGs under drought stress.
-
Pathway Name Number of enriched genes Leaf_ Drought_5M Root_ Drought_5M map04010 MAPK signaling pathway 103 69 map04621 NOD-like receptor signaling pathway 102 65 map04075 Plant hormone signal transduction 92 61 map04064 NF-kappa B signaling pathway 88 60 map04626 Plant-pathogen interaction 78 32 map00940 Phenylpropanoid biosynthesis 68 63 map04141 Protein processing in endoplasmic reticulum 67 48 map00010 Glycolysis / Gluconeogenesis 20* 39 map00902 Monoterpenoid biosynthesis 34 26 map00983 Drug metabolism - other enzymes 33 25 map00480 Glutathione metabolism 33 26 map00982 Drug metabolism - cytochrome P450 32 30 map00980 Metabolism of xenobiotics by cytochrome P450 32 30 map00520 Amino sugar and nucleotide sugar metabolism 31 29 map00500 Starch and sucrose metabolism 31 27 map00052 Galactose metabolism 29 26 map00350 Tyrosine metabolism 25 29 map00561 Glycerolipid metabolism 27 15 map00360 Phenylalanine metabolism 25 13* map00400 Phenylalanine, tyrosine and tryptophan biosynthesis 24 10* map00941 Flavonoid biosynthesis 23 11* map00592 alpha-Linolenic acid metabolism 18* 22 map00071 Fatty acid degradation 6* 18 * Not included in the 20 pathways with highest enrichment. Table 2.
KEGG pathway enrichment analysis of blueberry leaf and root DEGs under drought stress.
Figures
(6)
Tables
(2)