


-
Blueberry (Vaccinium corymbosum) is a perennial shrub of the genus Vaccinium of the Ericaceae. Its fruit is rich in anthocyanins and multiple bioactive substances that are beneficial to the human body[1]. In recent years, drought and water deficit have become the major constraints for agriculture production and blueberry industries with the frequency of extreme weather[2]. Blueberry is a shallow-rooted plant species that lacks root hairs and is vulnerable to drought stress[3]. Across the globe, the yield of blueberries has decreased by about 25%−30% due to drought stress[4].
During the past decade, many studies on the molecular regulation network of plant tolerance to abiotic stress were reported by genome-wide transcriptional gene expression profiles[5]. It is feasible and effective to study the dynamic changes and regulatory mechanisms of plants' resistance to drought stress on transcriptional levels by RNA sequencing (RNA-seq)[6]. In sweet orange, 1764 transcripts showed significant variation under drought-stress treatment, with 1081 drought-induced and 683 drought-repressed genes[7]. In Oryza sativa, over 50% of MYB genes had different expression levels under drought stress[8]. Analysis of NAC genes in peanut under salt and drought stress by RNA sequencing revealed that the expression of 43 NAC genes was up- or down-regulated under salt and drought stress[9]. Meanwhile, multiple potential key pathways and genes associated with drought tolerance have been identified on plant transcriptional levels using RNA-Seq combined with bioinformatics analysis. Arabidopsis MYB15 and MYB2 can be induced by drought stress, and activate dehydration-responsive genes such as AtRD22 to positively regulate plant drought tolerance[10]. Overexpression of AtMYB94 in Arabidopsis can improve drought tolerance by increasing the cuticle accumulation wax[11]. RNA-seq analysis of halophytic grass Puccinellia nuttalliana under salt treatment revealed that the transcription levels of genes such as PIP2;2, HKT1;5, and ABF2 were significantly increased under NaCl treatment, suggesting that these genes are involved in salt stress responses[12]. In addition, overexpression of ABF2 also increased the expression of ABA and stress-related genes to promote drought tolerance[13]. These results suggested that transcription factors universally participated in plant response to various kinds of stress and involved multiple signaling pathways during the process. To date, a variety of molecular mechanisms and the relevant signal networks involved in the drought stress response have been increasingly identified in a number of plant species. However, the potential pathways and mechanisms involved in blueberry response to drought stress remain elusive.
The existing studies of blueberry drought tolerance are mostly concentrated at the physiological level. Most of the blueberry varieties are sensitive to drought stress, and the contents of ABA, total soluble sugar and proline in leaves show an increasing trend[14], while the relative water content, gibberellin and polyamine content in leaves show a downward trend[3]. A recent study showed that the cuticle played an important role in limiting water loss in blueberry[15]. In view of the limited knowledge in blueberry tolerance to drought stress, it is necessary to reveal the molecular mechanisms and gene expression networks of blueberry in response to drought stress at the whole-plant level and genome-wide level.
In this study, the global transcriptome profile of the leaves and roots of blueberry under different drought treatments by RNA-seq were conducted and drought-related genes were analyzed using WGCNA and KEGG enrichment. Three main categories including signal transduction, transcriptional regulation and metabolism were enriched both in leaves and roots. MYB, AP2/ERF, and bZIP were identified as the key TFs families in blueberry response to drought stress. Eight key pathways including MAPK, ROS, plant hormone signal and eight DEGs were identified through PPI and Venn analysis. The eight key DEGs were markedly induced at different drought treatments and exhibited differential expression in leaves and roots. Moreover, these key genes were analyzed by KEGG annotation and combined with the physiological assays. Collectively, our study provides a genome-wide understanding of the molecular regulation network and mechanism of blueberry tolerance to drought, and a research basis and genetic resources for future research on blueberry cultivation in areas with insufficient soil moisture.
-
In this study, we assigned three different drought treatments based on SWC with CK (80.1%), MD (59.7%), and SD (30.1%) and the differences between the treatments were significant (P < 0.05) (Fig. 1a, b). The RWC of blueberry leaves under the treatment of CK, MD, and SD were 86.3%, 65.3%, and 43.9%, respectively. As the degree of drought increases, the soil gradually loses water and cracks occur between the soil and the pot wall. At the same time, as the degree of drought treatment increases, the leaves shrank and turned red (Fig. 1c). It was reported that the CBF/DREB1 transcription factor (CBF4) in Arabidopsis and Vitis vinifera and ABA-dependent RAB18 in Arabidopsis[16,17] controlled two critical pathways for drought tolerance in plants, and were considered to be drought-responsive marker genes of plants[18]. Therefore, we examined the expressions of VcCBF4 and VcRAB18 under different drought treatments and found that these two genes were significantly up-regulated with the increase of the degree of drought treatment. The expression level of VcCBF4 in leaves and roots under MD treatment was 3.8 and 2.4 times that under CK treatment, respectively. The expression level of VcRAB18 in leaves and roots under MD treatment was 3.1 times and 54.9 times that under CK treatment, respectively (Fig. 1d, e). The expressions of VcCBF4 and VcRAB18 induced by SD treatment were more evident than MD treatment, which indicated that the assignment of drought treatment was reasonable and reliable in this study.
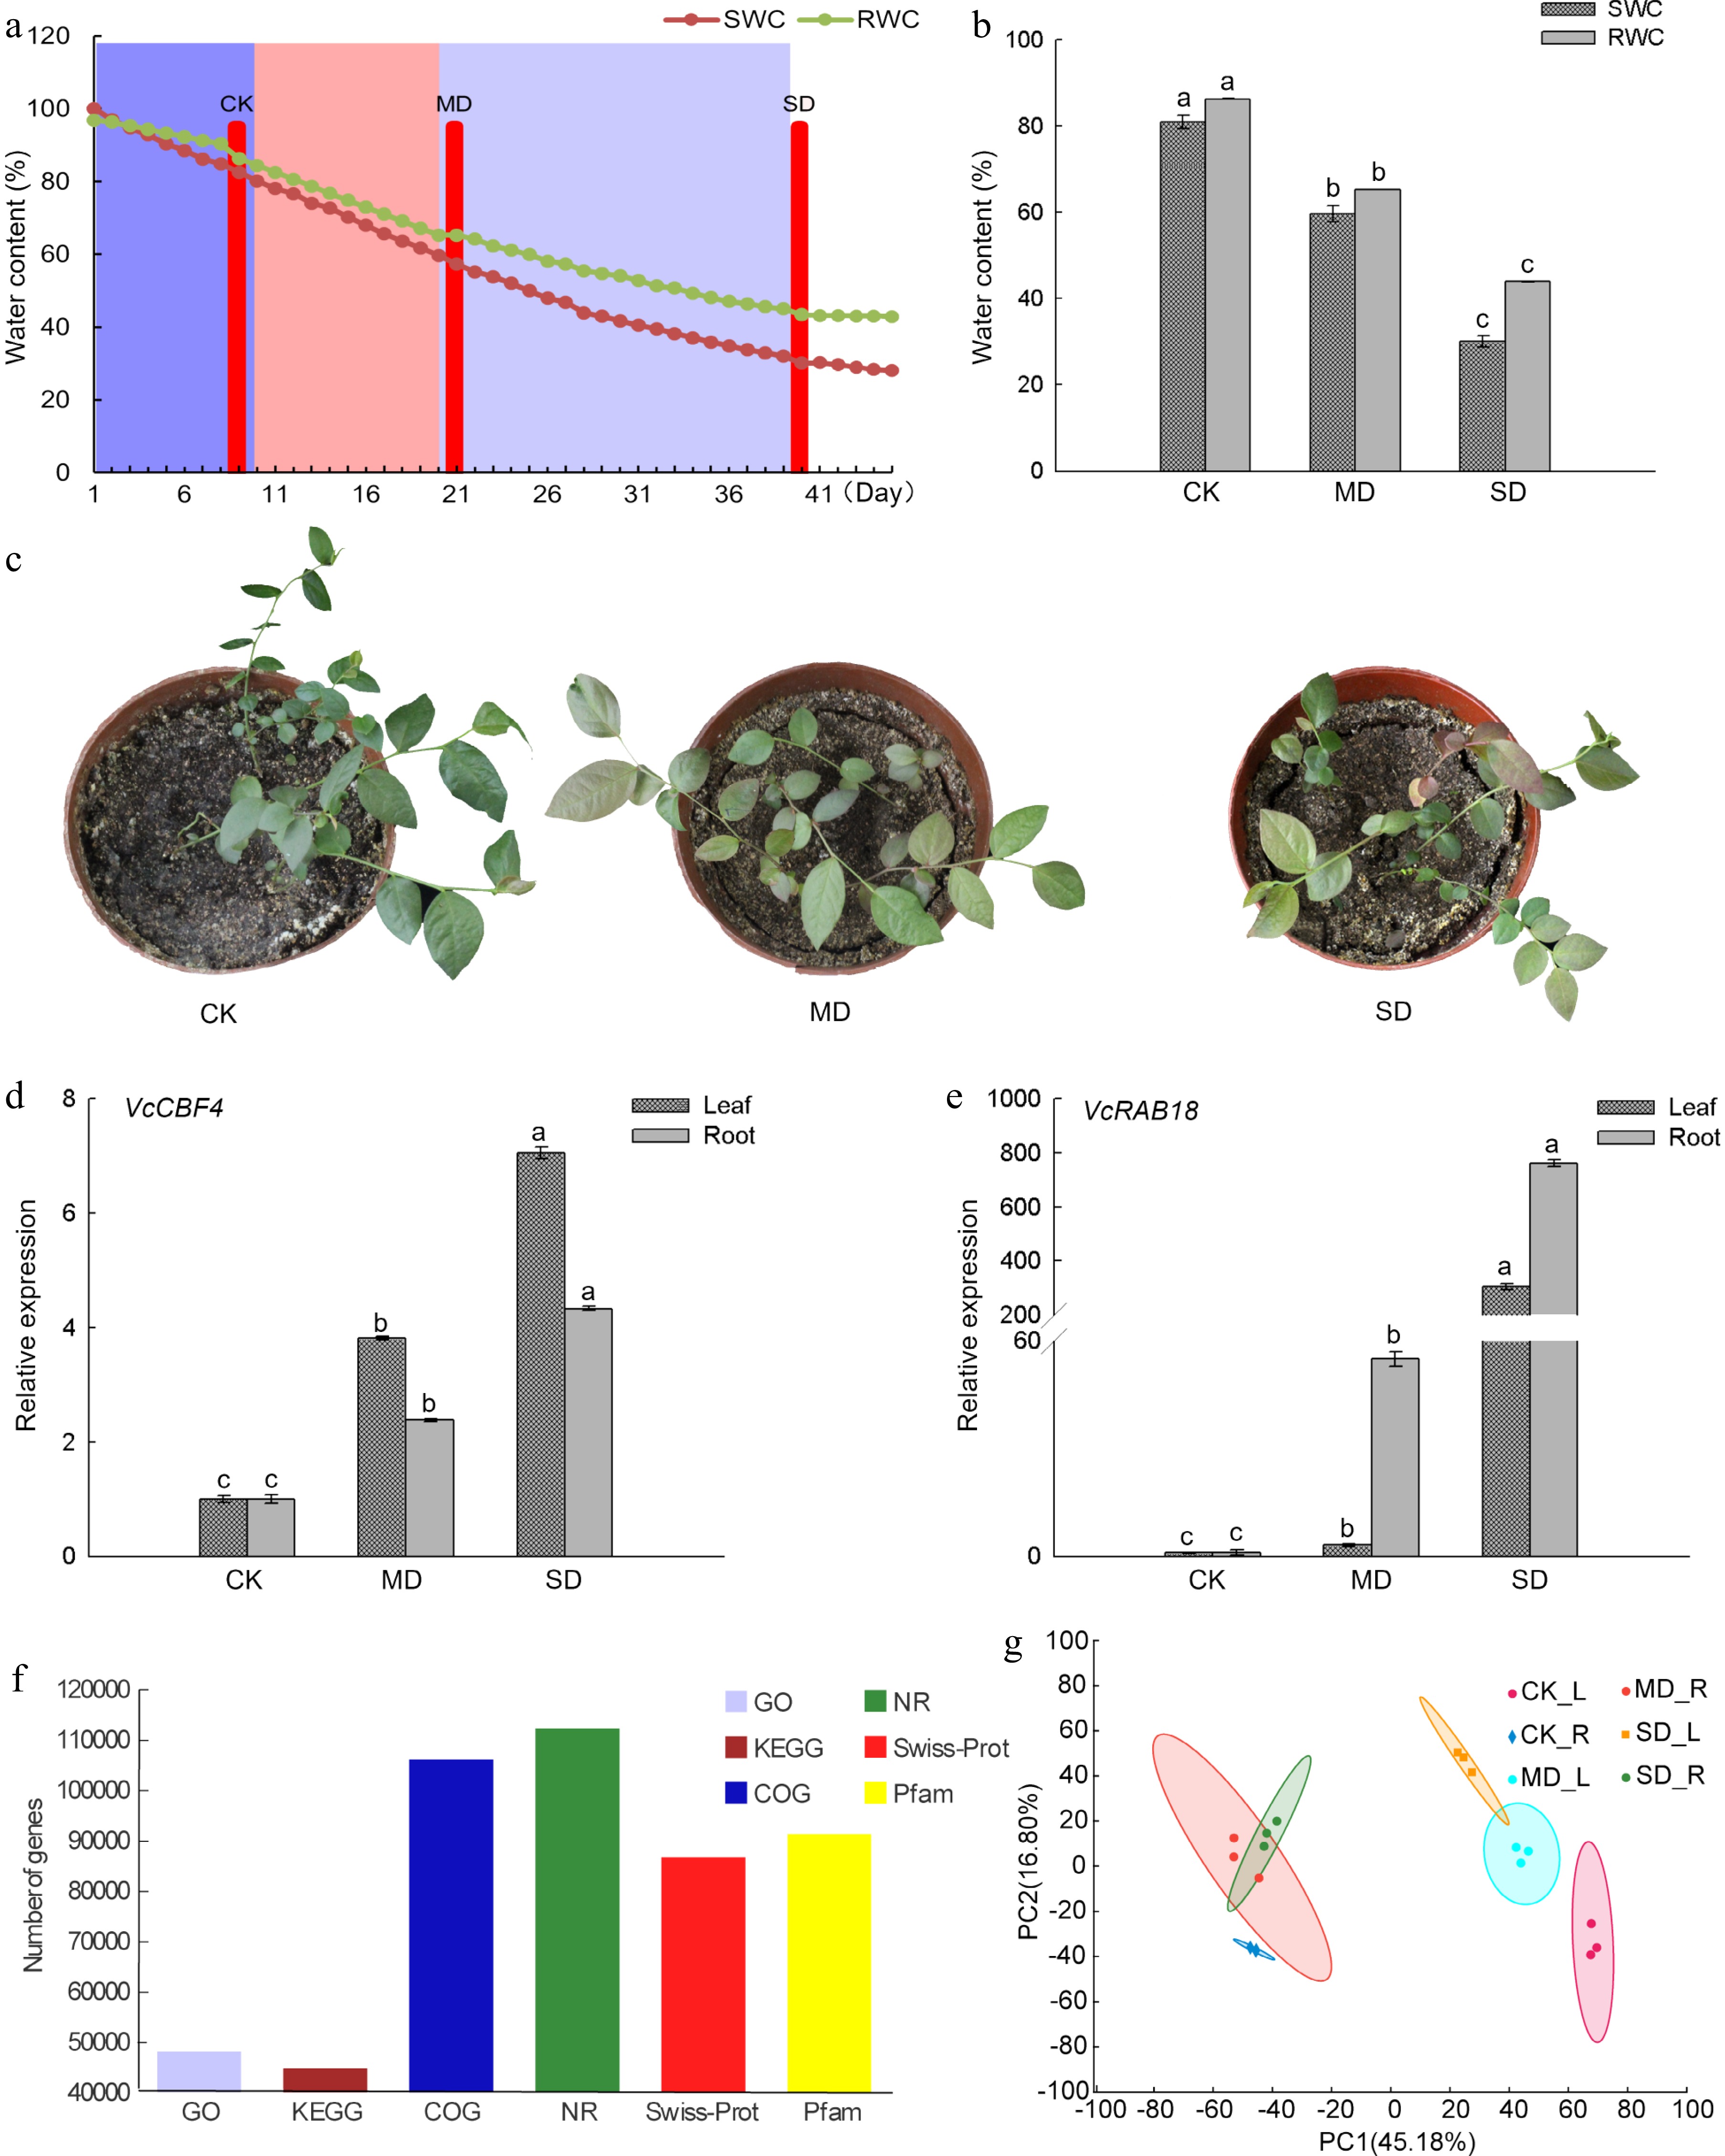
Figure 1.
Drought treatment and the analysis of gene sequence functional annotation in blueberry. (a) Relative SWC and RWC changes of blueberry, and the determination of three drought stress groups. CK, control group; MD, moderate drought stress group; SD severe drought stress group. (b) Differences of SWC and RWC of the blueberry leaf under drought stress groups. (c) Growth status of blueberry seedlings under three drought stress groups. (d) Expression of VcCBF4 f blueberry under drought stress. (e) Expression of VcRAB18 f blueberry under drought stress. (f) Functional annotation analysis of blueberry gene under drought stress. (g) PCA plots of genes identified by RNA-seq of blueberry leaves and roots under drought stress. Each value was represented as the mean value ± standard error of three independent determinations. Different letters indicate that Duncan's multiple range test is significantly different at P < 0.05.
Analysis of transcriptome sequencing and annotation
-
In this study, a total of 18 cDNA libraries were constructed, which were derived from different drought treatments of blueberry leaves and roots with three biological replications for each treatment. The transcriptome obtained about 136.53 Gb of clean data and each cDNA library was above 5.74 Gb. The percentage of Q30 bases was above 90.59%, and the average GC content value was 46.20%. The alignment rate ranges from 70.08% to 93.48% by comparing the Clean Data of each library with the designated reference genome (
http://gigadb.org/dataset/100537 ) (Supplemental Table S1). A total of 128,559 genes were obtained from this transcriptome. The genes annotated to GO, NR, COG were 48,131, 112,182, 106,043, respectively, and annotated to Pfam, KEGG and Swiss-Prot databases were 91,289, 44,755 and 86,699, respectively. Annotated genes account for 88.16% of the total number of genes (Fig. 1f). Principal Component Analysis (PCA) showed that the similarity among the three replications of each treatment was high, which was 45.18% in PC1 and 16.80% in PC2 (Fig. 1g). The data showed that the obtained sequence was of high-quality and suitable for further bioinformatics analysis.Identification of differentially expressed genes
-
Twenty two highly co-expressed modules were identified based on WGCNA analysis and each module was coded with a unique color (Fig. 2a; Supplemental Fig. S1). Prior to analysis, data should be preprocessed to remove genes with low expression or low coefficient of variation that would affect the accuracy of WGCNA analysis. Before and after preprocessing, the numbers of genes were 128,559 and 47,701, respectively, and the filtered data was used for further analysis. It was found that the first group ('light cyan', 'royal blue', 'red' and 'grey' modules) consisted of 3,921 genes. These eigengenes in the first group were positively or negatively correlated with at least 1 of the 4 samples (MD_L, SD_L, MD_R, and SD_R), and also showed a significant correlation with phenotypic indicators SWC and RWC. Meanwhile, the second group ('turquoise', 'green', 'green yellow', 'pink' and 'magenta' modules) was found to consist of 16,733 genes. No correlation was found with either the four drought treatments (MD_L, SD_L, MD_R, and SD_R) nor the phenotypic indicators SWC and RWC with eigengenes in the second group. There were 27,047 genes in the third group (the other 13 colors modules) and these eigengenes were positively or negatively correlated with at least one of the four drought treatments (MD_L, SD_L, MD_R, and SD_R), but no correlation with the phenotypic indicators SWC and RWC. Compared with the total number of genes after preprocessing, the number of genes in the first, second, and third groups accounted for 8.22%, 35.08%, and 56.70%, respectively. The genes in the first and third groups were combined into a large collection (64.92% of the genes after preprocessed) named "WGCNA_Drought" (a total of 30,968 genes), which was speculated to be critical genes responding to drought stress.
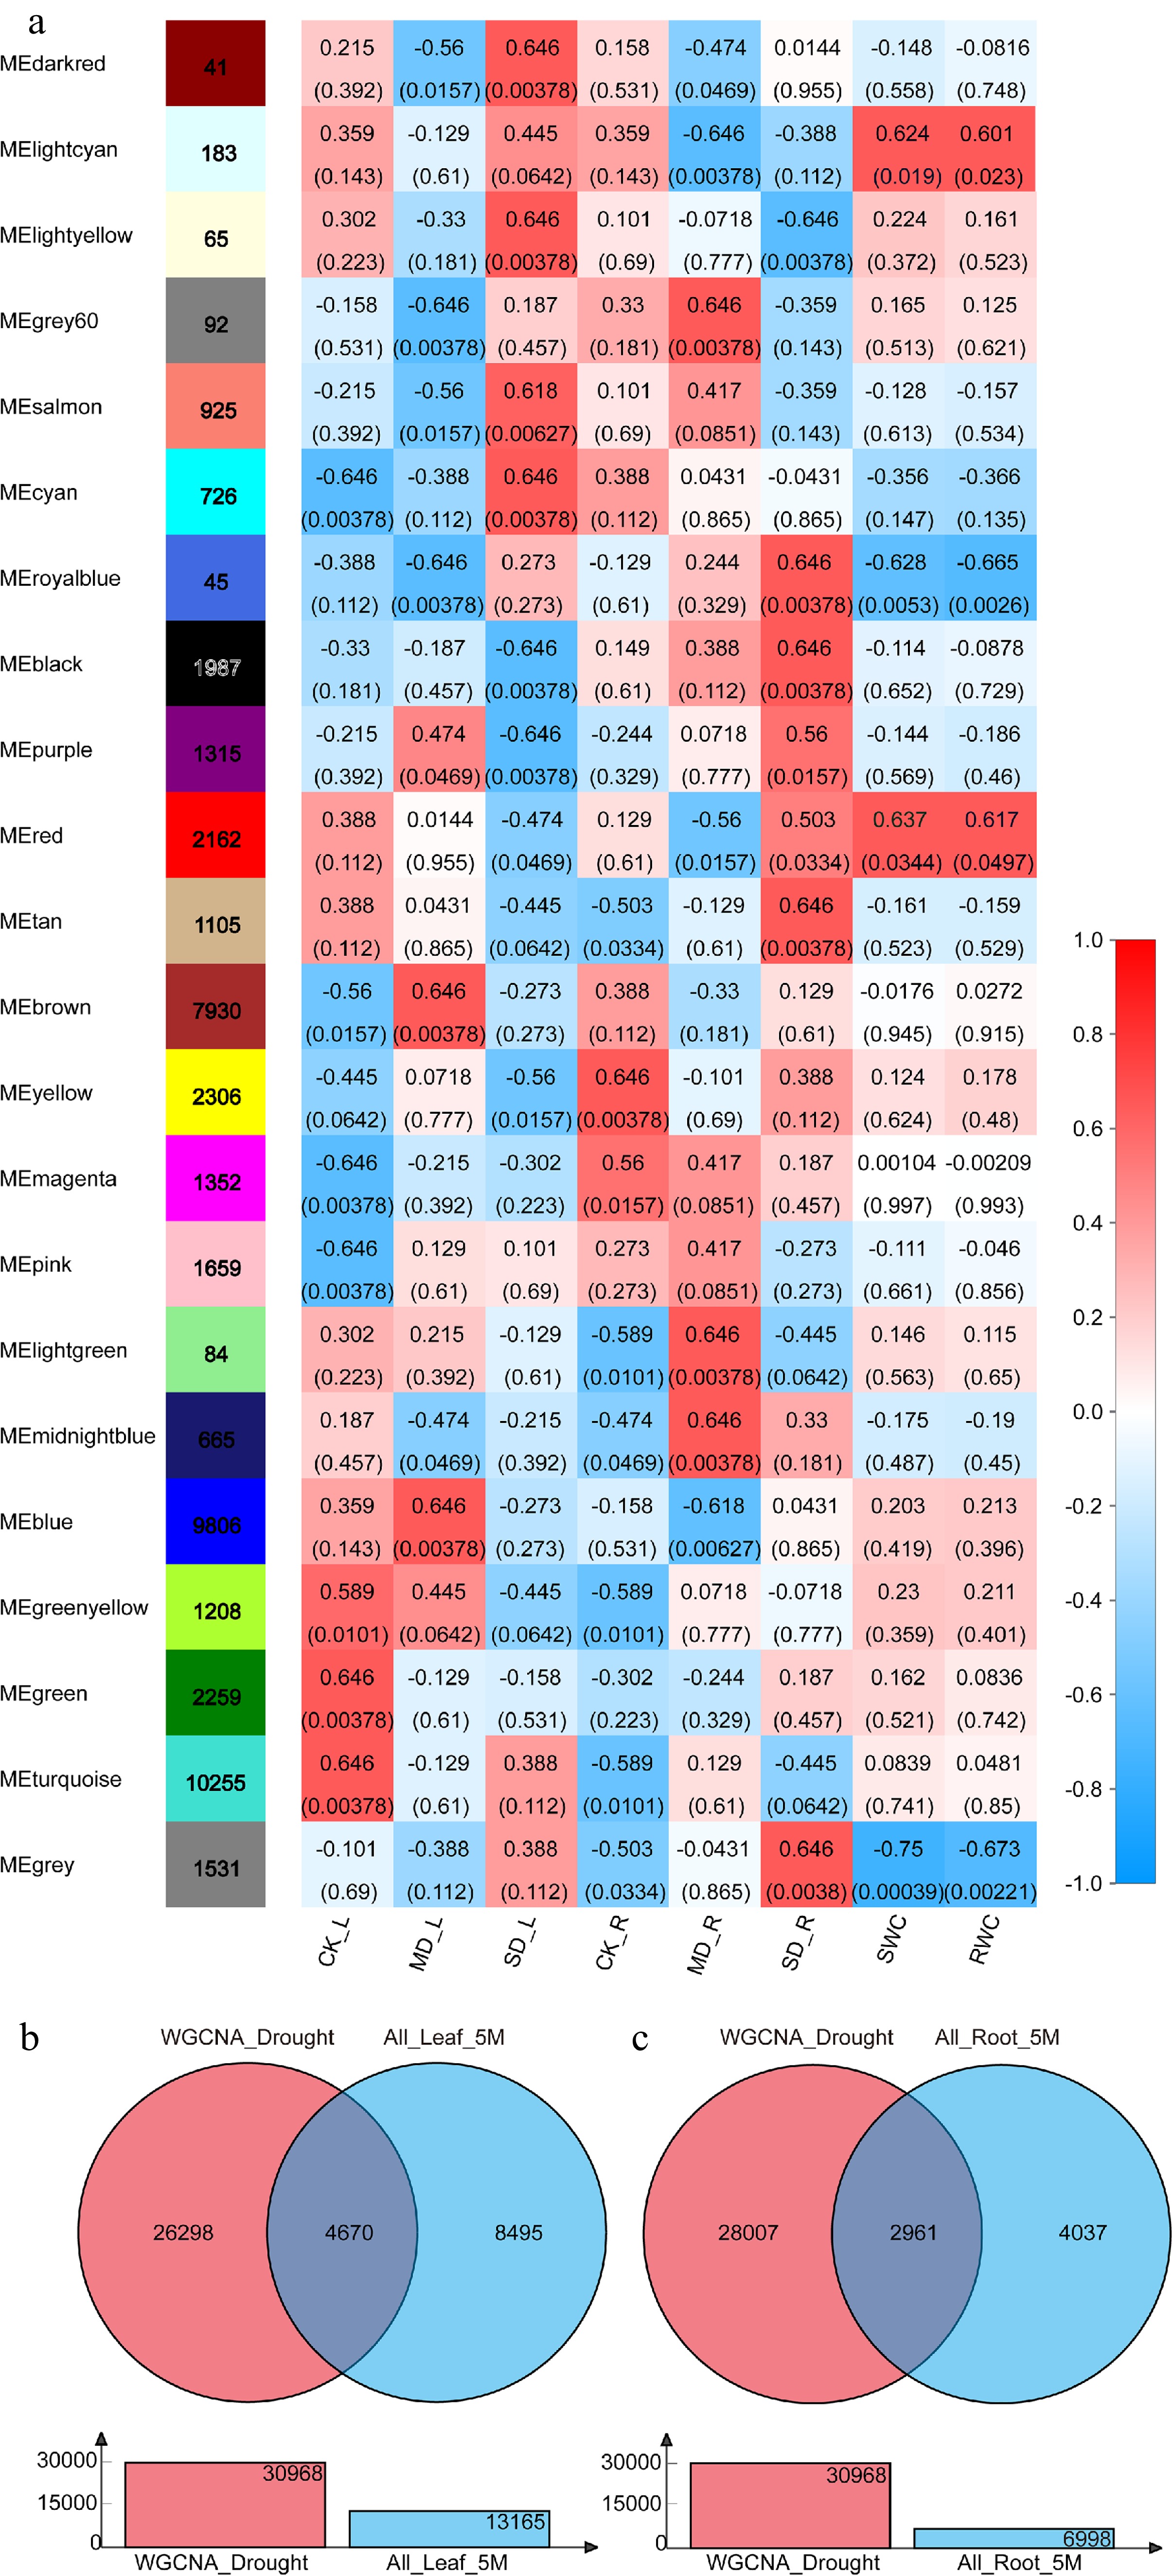
Figure 2.
Weighted gene co-expression network analysis and identification of DEGs in response to drought. (a) Heatmap of correlations (P-value in parentheses) of module eigengenes with the drought treatment, soil relative water content, and leaf relative water content. (b) Identification of DEGs in response to drought in leaves (Venn diagram of 'WGCNA_Drought' and 'All_Leaf_5M'). (c) Identification of DEGs in response to drought in roots (Venn diagram of 'WGCNA_Drought' and 'All_Root_5M').
The main cultivated varieties of blueberry are divided into highbush blueberry (Vaccinium corymbosum), lowbush blueberry (Vaccinium angustifolium) and rabbiteye blueberry (Vaccinium virgatum), which belong to tetraploid, tetraploid and hexaploid, respectively[19,20]. The highbush blueberry variety 'Bluecrop' in this study was used, and the number of 2-fold DEGs was excessively discovered in our previous analysis. Therefore, in this study, differentially expressed genes were identified and analyzed by the parameters of p-adjust and multiple of difference as 0.05 and 5.0, respectively. Three DEGs collections, in a total of 13,165 DEGs named 'All_Leaf_5M' (Supplemental Fig. S2a), were obtained through comparison with the different treatments on leaves. Simultaneously, three DEGs collections were obtained in roots with a total of 6998 DEGs named 'All_Root_5M' (Supplemental Fig. S2b). Venn analysis was performed on 'WGCNA_Drought' and 'All_Leaf/Root_5M' to obtain 4,670 and 2,961 DEGs which respond to drought in leaf and root, respectively and we named these two sets as 'Leaf_Drought_5M' and 'Root_Drought_5M' (Fig. 2b, c).
GO and KEGG analysis of DEGs
-
The GO analysis showed that 552 GO terms were enriched by 'Leaf_ Drought_5M', 439 GO terms were enriched by 'Root_ Drought_5M', and 264 GO terms were simultaneously enriched by the two groups. The similar DEGs which were enriched in both the 'Leaf_ Drought_5M' and 'Root_ Drought_5M' groups, and the 10 most highly enriched DEGs in blueberry root and leaf under drought stress with their associated biological processes are shown in Table 1. The associated biological processes included oxidation-reduction process, catabolism, redox controls, stimulus-response, stress response, ion transport, secondary metabolism, and cell wall-related metabolism, etc. It can be seen that the GO terms enriched in leaf DEGs are more than those enriched in roots.
Table 1. GO analysis of blueberry leaf and root DEGs under drought stress.
Accession number Biological process Number of enriched genes Leaf_ Drought_5M Root_ Drought_5M GO:0055114 Oxidation-reduction
process310 227 GO:0005975 Carbohydrate metabolic process 194 123 GO:0009056 Catabolic process 170 111 GO:0050896 Response to stimulus 170 106 GO:0055085 Transmembrane transport 162 131 GO:0044248 Cellular catabolic process 125 95 GO:0006950 Response to stress 123 73 GO:0006811 Ion transport 122 100 GO:0071554 Cell wall organization or biogenesis biogenesis 86 28* GO:0034220 Ion transmembrane transport 84 67 GO:0044550 Secondary metabolic process 73* 54 * Not included in the 10 GOs with the highest enrichment. Collectively, the enrichment analysis of GO and KEGG showed that most GO terms and KEGG pathways of the leaves and roots of blueberry in response to drought treatment were common, suggesting the similar cellular biology processes and pathways involved in leaves and roots responding to drought stress (Table 2). However, the leaves and roots also showed certain specific drought-resistant mechanisms due to their own characteristics based on whether GO terms or KEGG pathways were more enriched in leaves than roots.
Table 2. KEGG pathway enrichment analysis of blueberry leaf and root DEGs under drought stress.
Pathway Name Number of enriched genes Leaf_ Drought_5M Root_ Drought_5M map04010 MAPK signaling pathway 103 69 map04621 NOD-like receptor signaling pathway 102 65 map04075 Plant hormone signal transduction 92 61 map04064 NF-kappa B signaling pathway 88 60 map04626 Plant-pathogen interaction 78 32 map00940 Phenylpropanoid biosynthesis 68 63 map04141 Protein processing in endoplasmic reticulum 67 48 map00010 Glycolysis / Gluconeogenesis 20* 39 map00902 Monoterpenoid biosynthesis 34 26 map00983 Drug metabolism - other enzymes 33 25 map00480 Glutathione metabolism 33 26 map00982 Drug metabolism - cytochrome P450 32 30 map00980 Metabolism of xenobiotics by cytochrome P450 32 30 map00520 Amino sugar and nucleotide sugar metabolism 31 29 map00500 Starch and sucrose metabolism 31 27 map00052 Galactose metabolism 29 26 map00350 Tyrosine metabolism 25 29 map00561 Glycerolipid metabolism 27 15 map00360 Phenylalanine metabolism 25 13* map00400 Phenylalanine, tyrosine and tryptophan biosynthesis 24 10* map00941 Flavonoid biosynthesis 23 11* map00592 alpha-Linolenic acid metabolism 18* 22 map00071 Fatty acid degradation 6* 18 * Not included in the 20 pathways with highest enrichment. Signal transduction-related genes
-
Significantly enriched signal transduction module in leaves and roots were identified by KEGG pathway enrichment analysis. The top 10 pathways of leaves and roots were obtained from the first KEGG enrichment signal transduction module by secondary KEGG pathway enrichment analysis (Supplemental Table S2). Among them, four pathways including plant hormone signal transduction, MAPK signaling pathway, phosphatidylinositol signaling system and calcium signaling pathway were enriched in both leaves and roots (Fig. 3a, b). In addition, the reactive oxygen species metabolic and biosynthetic process enriched by GO also play a vital role in the signal transduction of abiotic stress. In view of this, the genes of the above five pathways in 'Leaf_Drought_5M' and 'Root_Drought_5M' were aggregated into two gene sets 'All_Leaf_signal' and 'All_Root_signal', of which there were 247 and 170 genes, respectively (Supplemental Table S2).
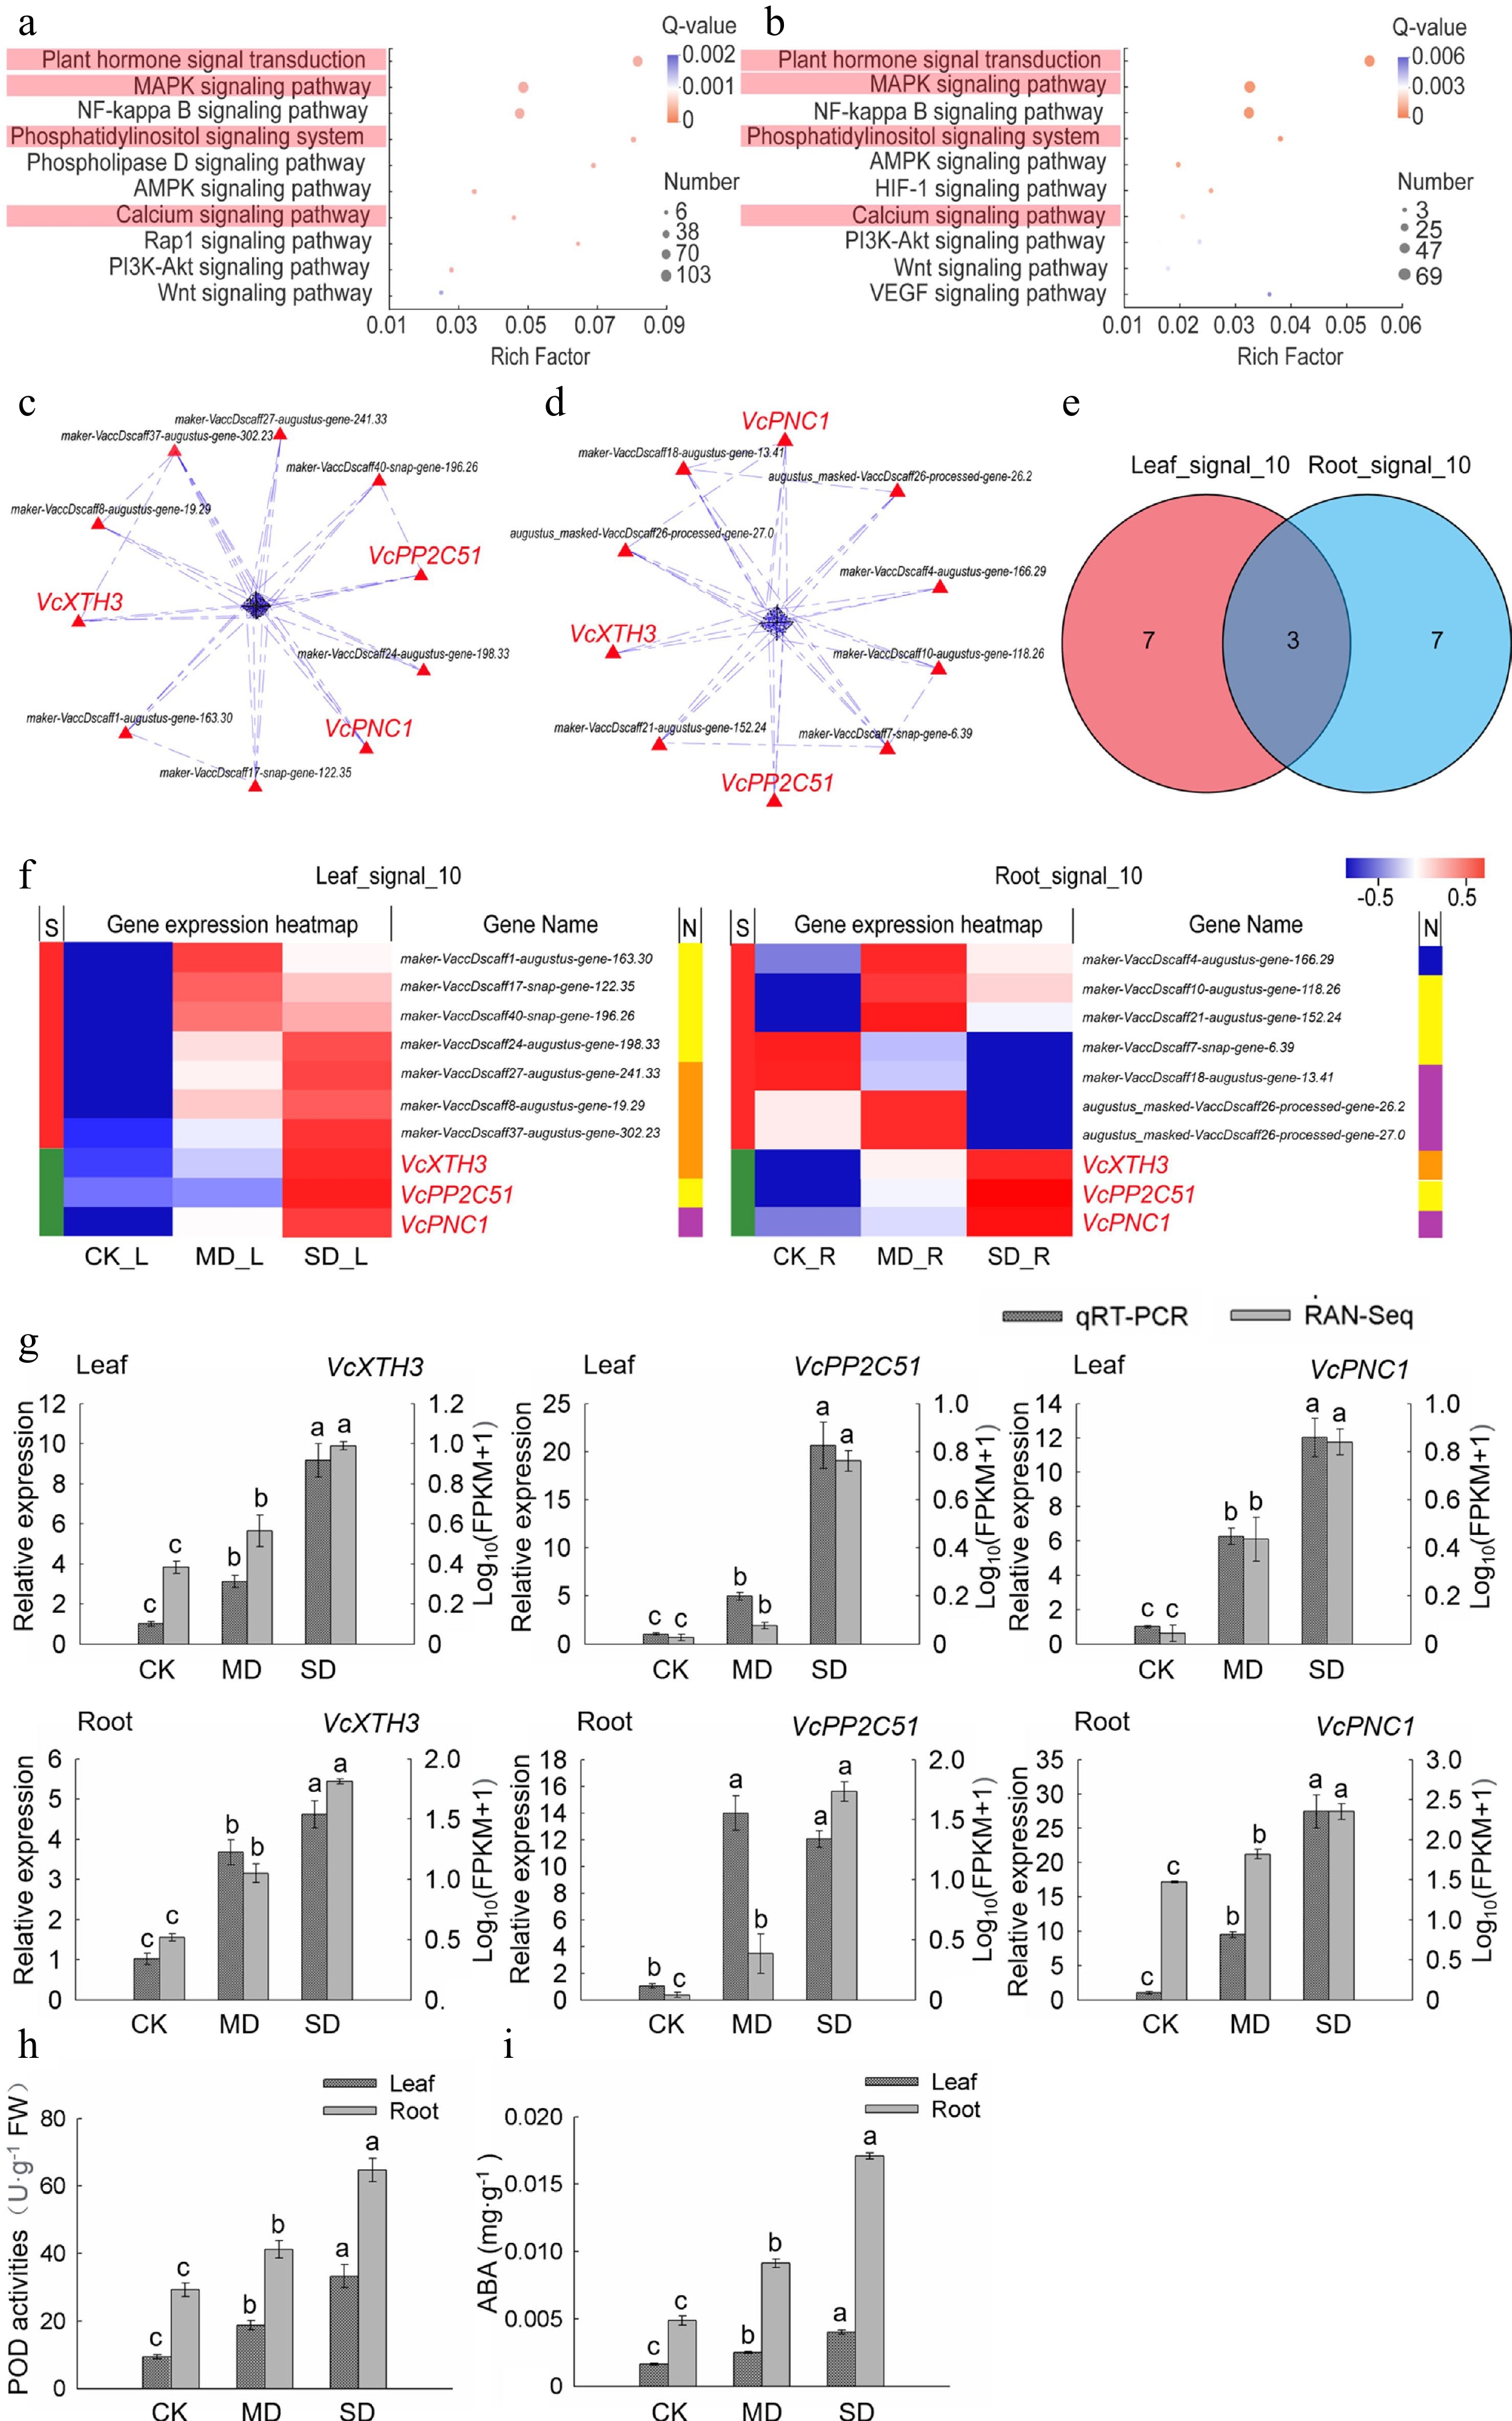
Figure 3.
Analysis of the key genes of signal transduction pathway in leaves and roots under drought stress. (a) KEGG enrichment analysis of plant signal transduction-related DEGs in leaves. (b) KEGG enrichment analysis of plant signal transduction-related DEGs in roots. (c) PPI analysis of 'All_Leaf_signal'. (d) PPI analysis of 'All_Root_signal'. (e) Venn analysis of 'Leaf_signal_10' and 'Root_signal_10'. (f) Hot map analysis of 'Leaf_signal_10' and 'Root_signal_10'. S indicates the difference between 'Leaf_signal_10' and 'Root_signal_10', different genes between the two groups were represented by red color while those being the same are shown in green; function corresponding to each gene in two groups was shown in the N line, purple is reactive oxygen species metabolic and biosynthetic process-related gene, yellow indicates MAPK signaling pathway-related gene, orange is plant hormone signal transduction-related gene, and blue represents calcium signaling pathway-related gene. (g) Relative gene expression (VcPP2C51, VcXTH3, and VcPNC1) in blueberry leaves and roots exposed to drought stress as determined by qRT-PCR with VcUBC28 as the internal reference gene. (h) POD activities in blueberry leaves and roots under drought stress. (i) ABA content in blueberry leaves and roots under drought stress.
In order to obtain highly correlated genes, we further performed PPI analysis on the two gene sets 'All_Leaf_signal' and 'All_Root_signal'. The top 10 crucial genes in leaves and roots were obtained and named 'Leaf_signal_10' and 'Root_signal_10', respectively (Fig. 3c, d). VcXTH3, VcPP2C51, and VcPNC1 were common key genes (core enriched genes) in leaves and roots (Fig. 3e, f). The heat map and KEGG annotation analysis of the two gene sets showed that the pathway involving the largest number of genes in 'Leaf_signal_10' was plant hormone signal transduction, while the pathways in 'Root_signal_10' were MAPK signaling pathway and reactive oxygen species metabolic and biosynthetic process. Among them, VcXTH3, VcPP2C51, and VcPNC1 belong to the MAPK signaling pathway, and plant hormone signal transduction, reactive oxygen species metabolic and biosynthetic process, respectively. Moreover, transcriptome data showed that the expression levels of the above three key genes in leaves and roots under MD and SD treatments were higher than those with CK treatment (Fig. 3f).
qRT-PCR was further performed to validate our RNA-seq results. As shown in Fig. 3g, we found that qRT-PCR data were substantially consistent with the RNA-seq data except VcPP2C51 However, it was true that VcPP2C51 expression showed a similar change trend by using the two methods, suggesting the validity of our transcriptome data. Previous studies and KEGG annotation analysis revealed that the homologous genes of VcXTH3 encode xyloglucan endotransglucosylase/hydrolase 3, and these genes are associated with changes in ABA levels in plants[21], protein phosphatase 2C encoded by the VcPP2C51 homologous gene participates in the ABA-activated signaling pathway[22], and POD1 encoded by the VcPNC1 homologous gene was related to POD activities[23]. In order to validity the accuracy of analysis, we measured the POD activities and ABA content in the leaves and roots of blueberry, and the result showed that the activity of POD and ABA content significantly increased (P < 0.05) both in leaves and roots with the enhanced degree of drought treatment (Fig. 3h, i).
Transcription factors involved in blueberry response to drought stress
-
Transcription factors (TFs) play crucial roles in plant responses to stress such as drought. In this study, we found that there are 367 transcription factors identified from 28 transcription factor families in 'Leaf_Drought_5M' (gene set 'All_Leaf_TFs'), 185 from 21 transcription factor families in 'Root_Drought_5M' (gene set 'All_Root_TFs') (Supplemental Table S3).
Through PPI analysis, the top 10 crucial genes in leaves and 10 in roots were obtained and named 'Leaf_TFs_10' and 'Root_TFs_10', respectively (Fig. 4a, b). Among them, VcABR1, VcABF2, VcMYB108, and VcMYB93 were common key genes (core enriched genes) in leaves and roots (Fig. 5c, d). The heat map and KEGG annotation analysis of the gene sets 'Leaf_TFs_10' and 'Root_TFs_10' showed that the transcription factor families involving the largest number of genes in 'Leaf_TFs_10' were AP2/ERF family and MYB family, while the transcription factor families in 'Root_TFs_10' was the MYB family. VcMYB108 and VcMYB93 belong to the MYB family, VcABR1 and VcABF2 belong to the AP2/ERF family and bZIP family. Meanwhile, it was also found that the expression levels of these four key genes in leaves and roots under MD and SD treatments were higher than those with CK treatment (Fig. 4d).
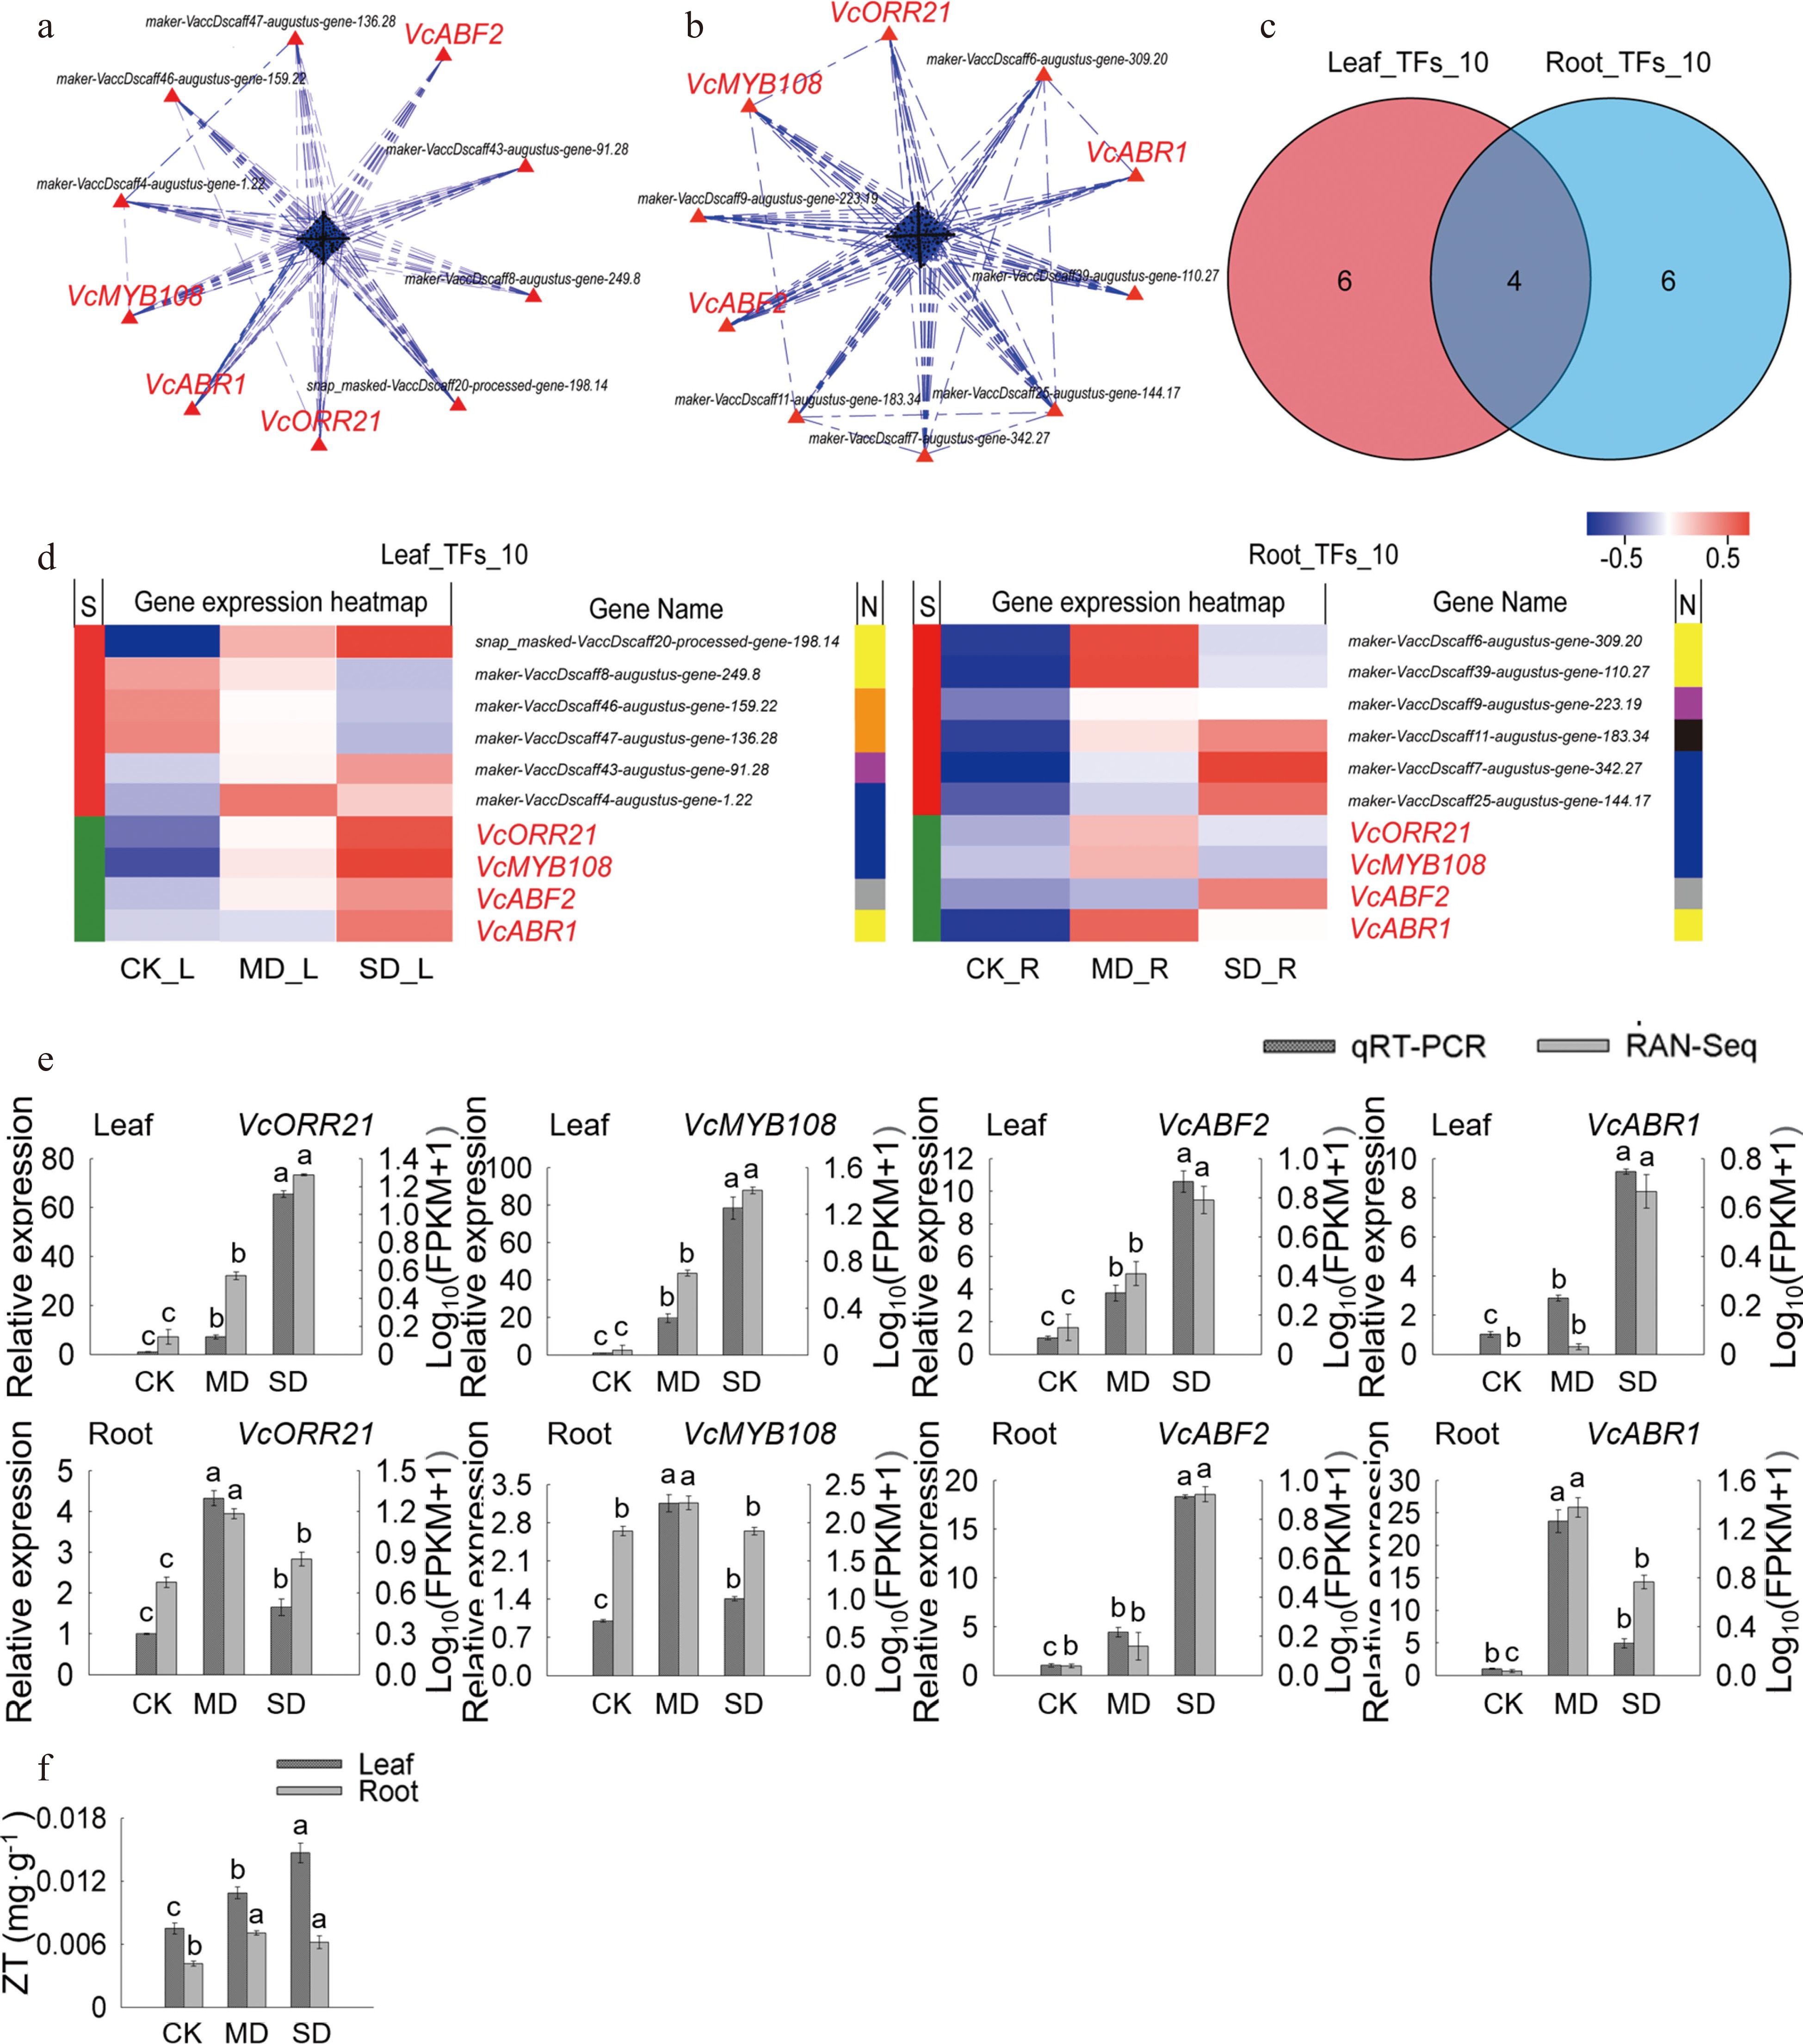
Figure 4.
Analysis of key TFs in leaves and roots under drought stress. (a) PPI analysis of 'All_Leaf_TFs'. (b) PPI analysis of 'All_Root_TFs'. (c) Venn analysis of 'Leaf_TFs_10' and 'Root_TFs_10'. (d) Hot map analysis of 'Leaf_TFs_10' and 'Root_TFs_10'. S indicates the difference between 'Leaf_TFs_10' and 'Root_TFs_10', different genes between the two groups were represented by red color while those being that same are shown in green; TFs families corresponding to each gene in two groups was shown in N line, yellow, orange, purple, blue, grey and black indicates AP2/ERF family, bHLH family, WRKY family, MYB family, bZIP family and MYB_related family, respectively. (e) Relative gene expression (VcABF2, VcABR1, VcMYB93, and VcMYB108) in blueberry leaves and roots when exposed to drought stress as determined by qRT-PCR with VcUBC28 as the internal reference gene. (f) ZT content in blueberry leaves and roots under drought stress.
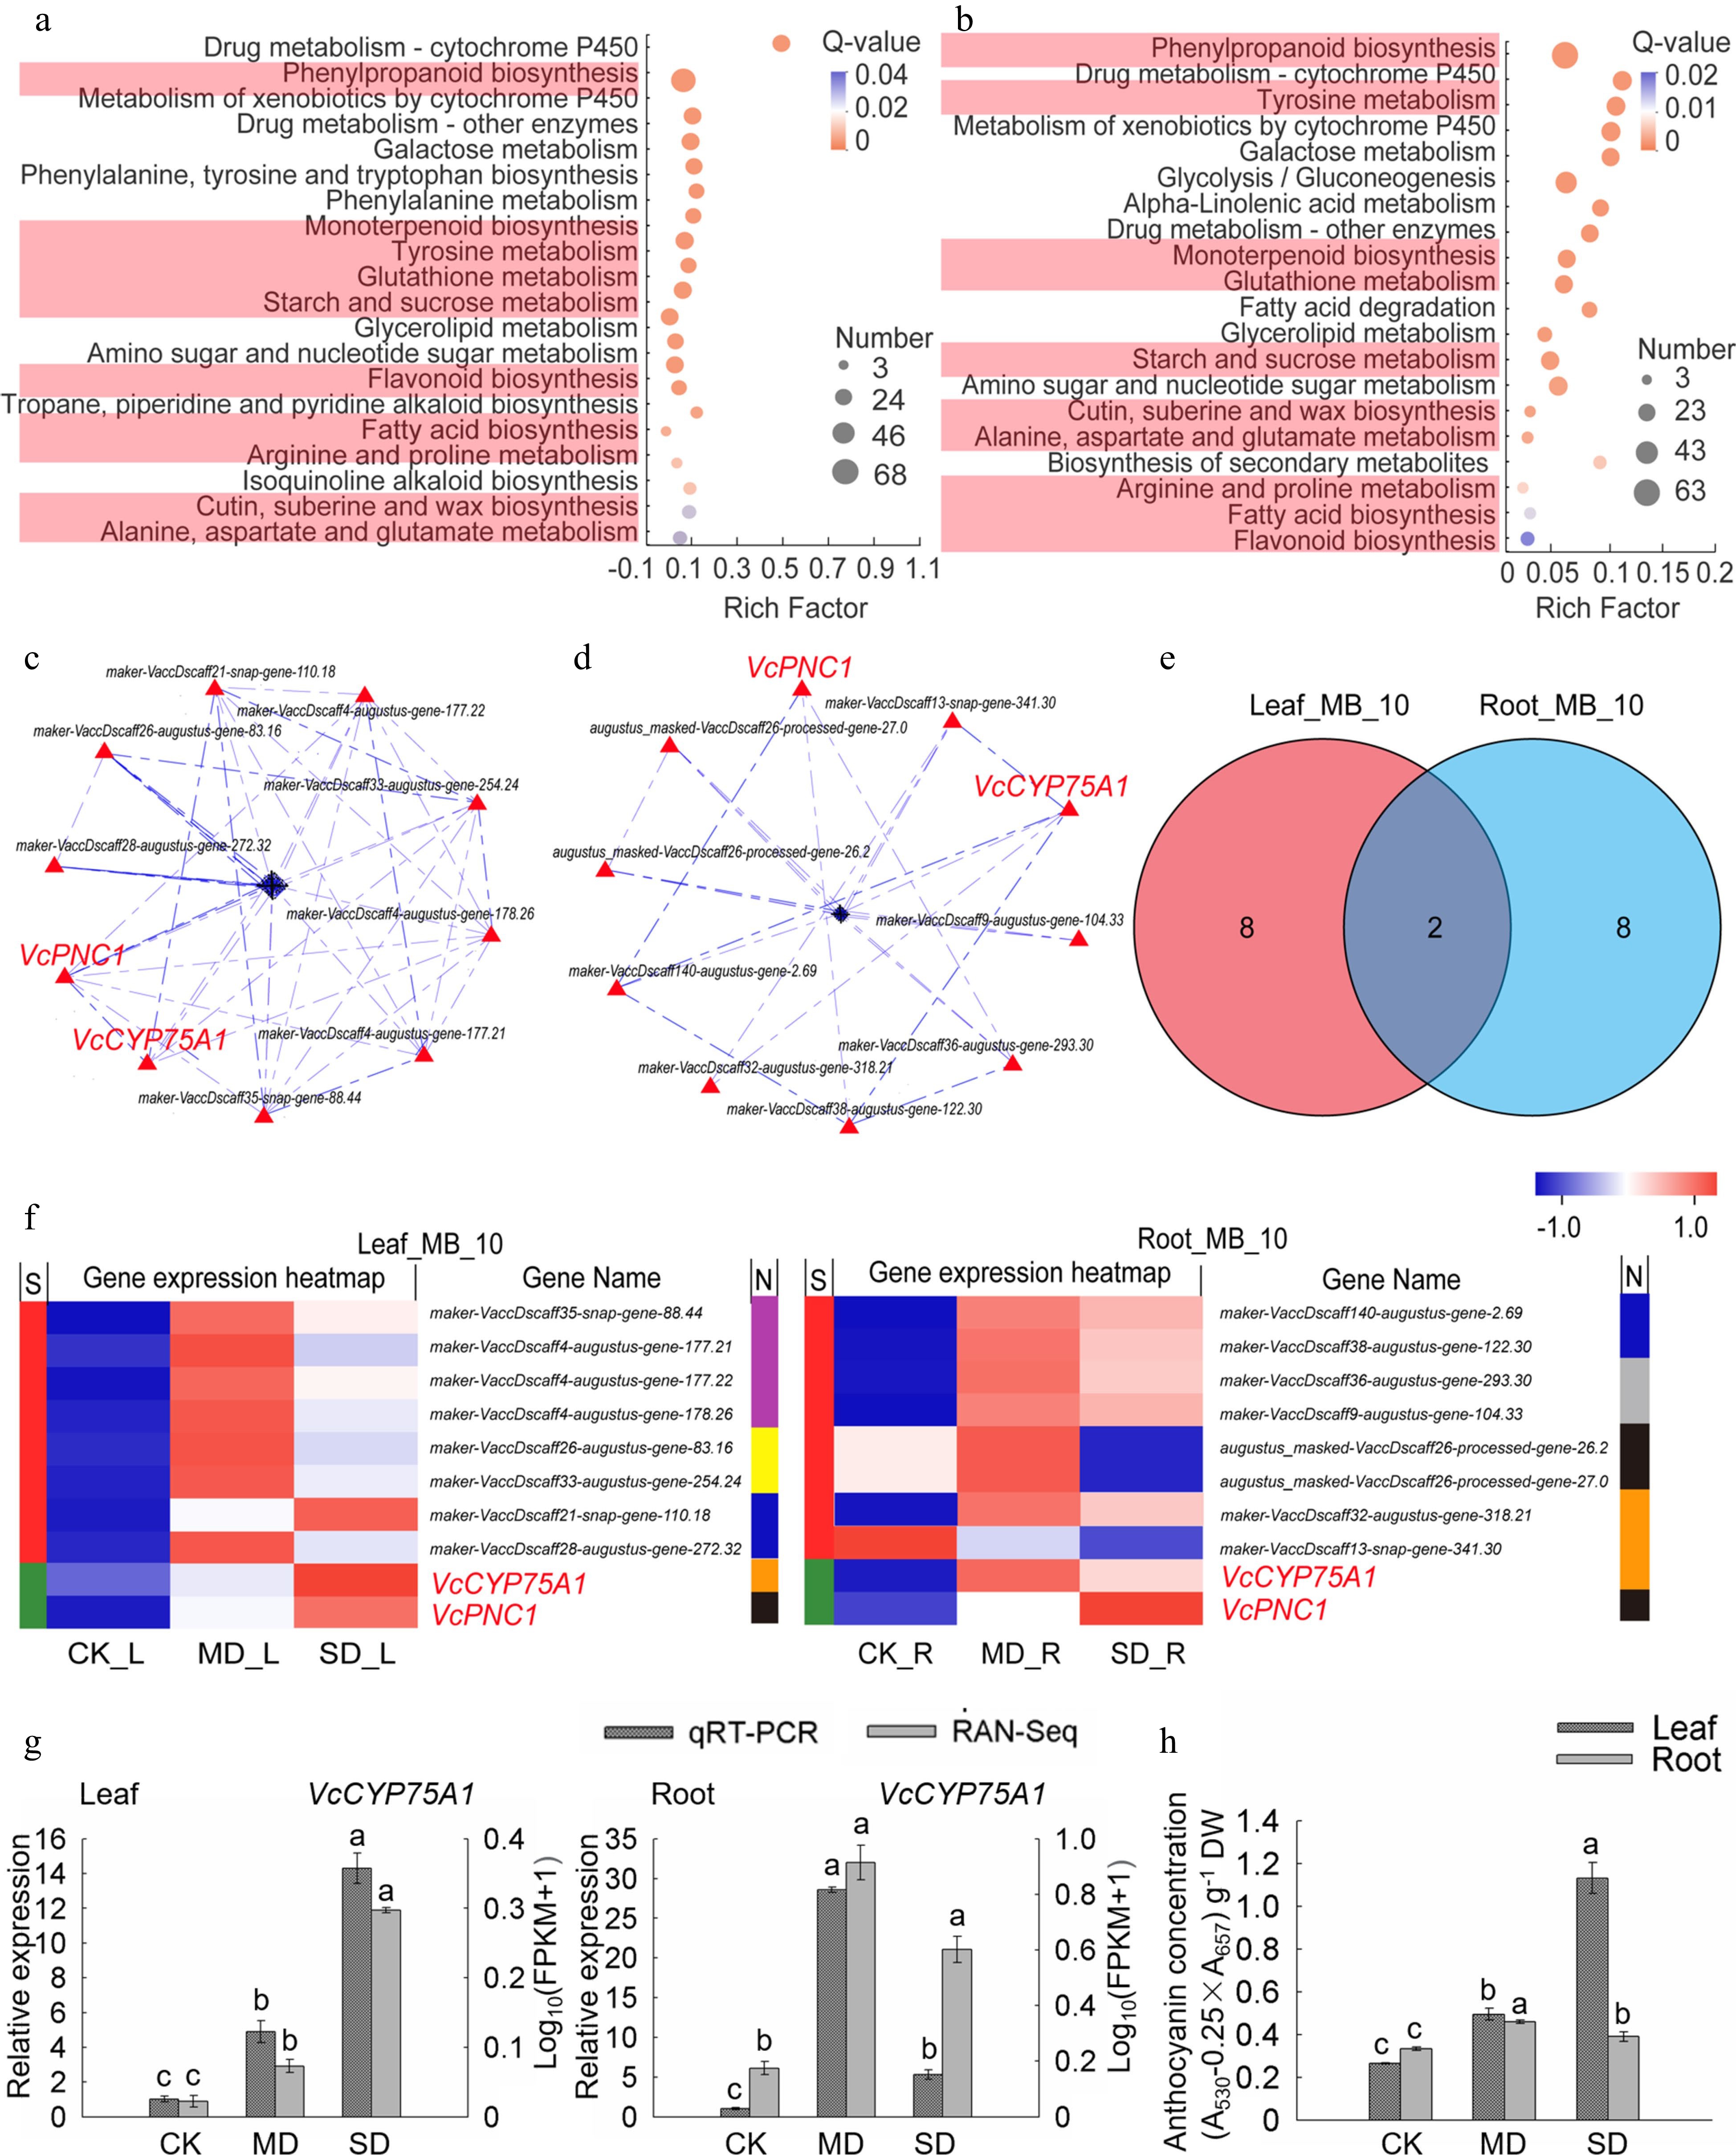
Figure 5.
Analysis of key genes of metabolism and biosynthesis in leaves and roots under drought stress. (a) KEGG enrichment analysis of the metabolism and biosynthesis-related DEGs in leaves. (b) KEGG enrichment analysis of the metabolism and biosynthesis-related DEGs in roots. (c) PPI analysis of 'All_Leaf_MB'. (d) PPI analysis of 'All_Root_MB'. (e) Venn analysis of 'Leaf_MB_10' and 'Root_MB_10'. (f) Hot map analysis of 'Leaf_MB_10' and 'Root_MB_10'. S indicates the difference between 'Leaf_MB_10' and 'Root_MB_10', Different genes between the two groups were represented by red color while those being the same are shown in green; metabolisms corresponding to each gene in two groups was shown in N line, purple, yellow, blue, brown, black, grey and indigo indicates monoterpenoid biosynthesis, starch and sucrose metabolism, cutin, submarine and wax biosynthesis, flavonoid biosynthesis, phenylpropanoid biosynthesis, fatty acid biosynthesis, and tyrosine metabolism, respectively. (g) Relative gene expression (VcCYP75A1) in blueberry leaf and root from plants exposed to drought stress as determined by qRT-PCR with VcUBC28 as the internal reference gene. (h) Anthocyanin concentration in blueberry under drought stress.
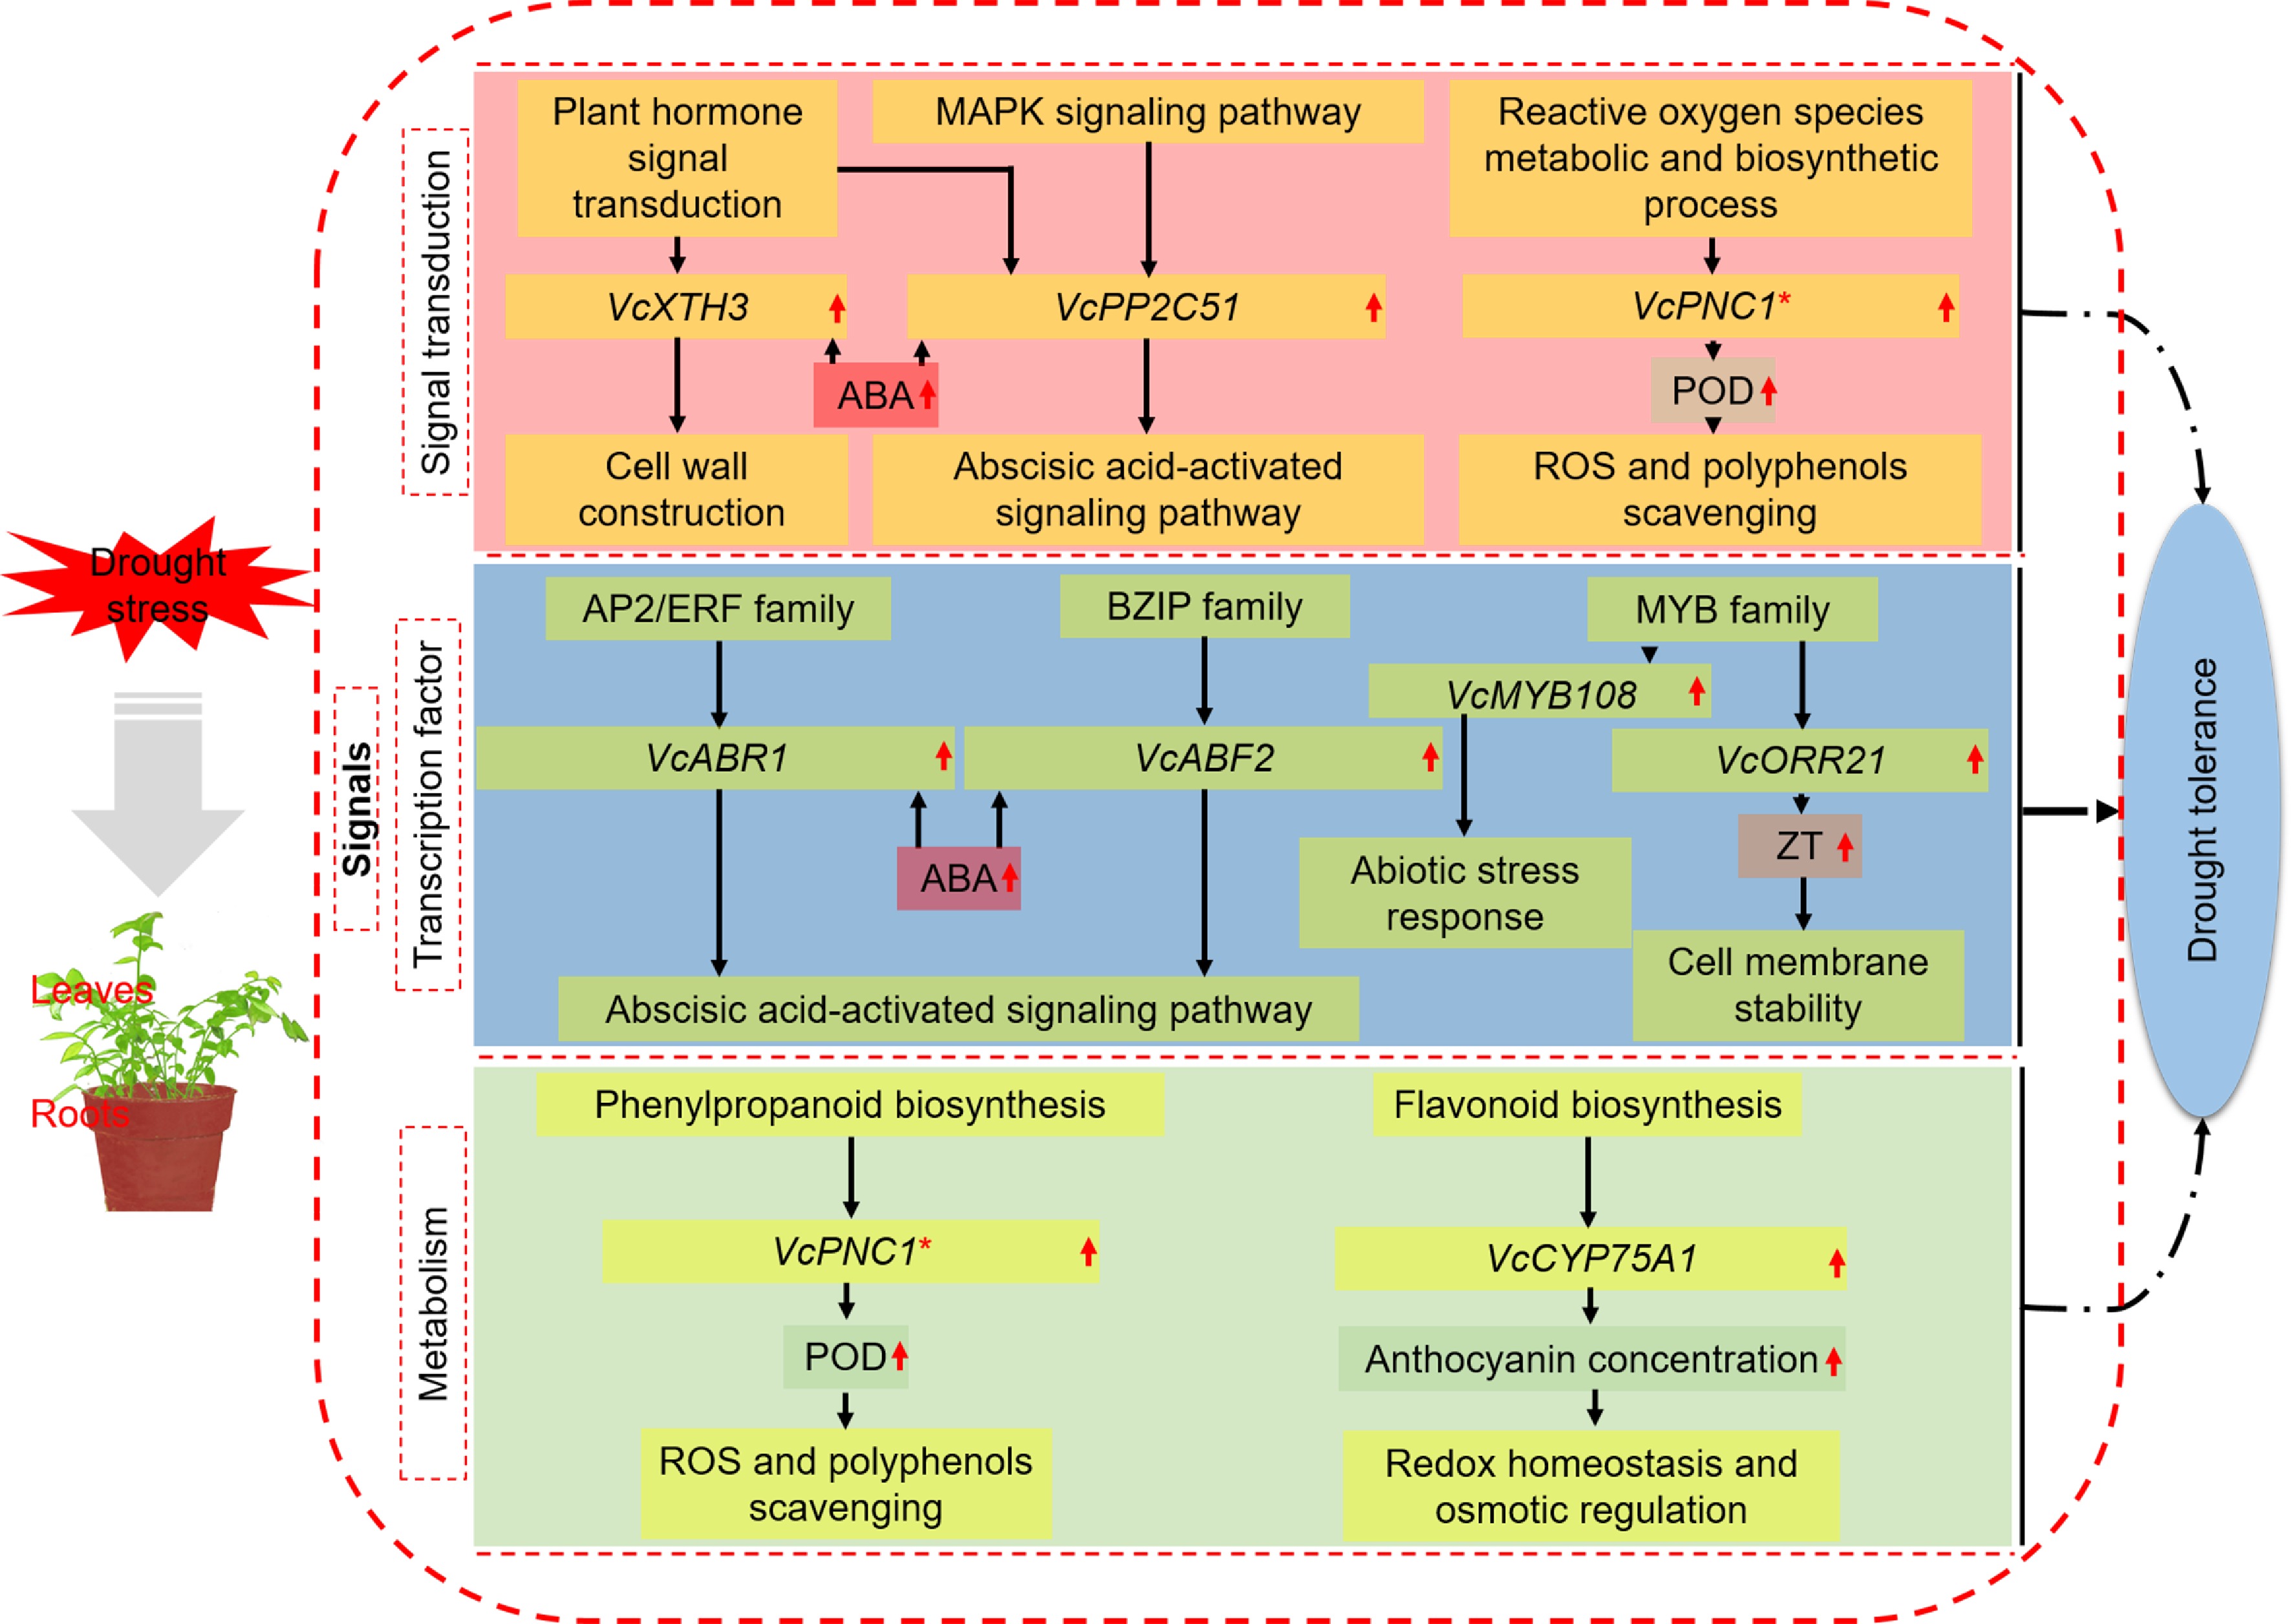
Figure 6.
A model for mechanisms underlying the enhanced drought tolerance shared by blueberry leaves and roots. * Important genes also identified in other categories.
The expression level of four key genes were consistent with the trends of RNA-seq results verified by qRT-PCR (Fig. 4e; Supplemental Table S4). Previous studies and KEGG annotation analysis revealed that the ethylene-responsive transcription factor ABR1 and ABA-INSENSITIVE 5-like protein 5 encoded by ABR1 and ABF2, respectively, were involved in the ABA-activated signaling pathway[24,25]. The transcription factor MYB108 encoded by homologous gene of VcMYB108 was involved in the abiotic stress response[26], and the two-component response regulator ORR21 encoded by VcMYB93 homologous gene was related to ZT biosynthesis[27,28]. We further detected ZT content and the results showed that ZT were significantly increased in both leaves and roots under MD and SD treatments compared with CK (P < 0.05) (Fig. 4f). It was noted that ZT content in leaves is higher than in root when plants are subjected to drought stress, which is consistent with the high expression of VcMYB93 in leaves compared to roots (Fig. 4e, f).
Metabolism and biosynthesis-related genes
-
Osmotic adjustment substances are beneficial to plants regulating the water balance and adapting to drought stress. The secondary KEGG pathway enrichment analysis of the first KEGG enrichment metabolic module resulted in the first 20 pathways of leaves and roots (Supplemental Table S5). Ten important drought-responsive pathways were enriched in both leaves and roots, including phenylpropanoid biosynthesis, monoterpenoid biosynthesis, tyrosine metabolism, glutathione metabolism, starch and sucrose metabolism, flavonoid biosynthesis, fatty acid biosynthesis, arginine and proline metabolism, cutin, submarine and wax biosynthesis and alanine, aspartate and glutamate metabolism. (Fig. 5a, b). Since these pathways played essential roles in plants resisting abiotic stress[29−32], genes of the 10 pathways mentioned above in 'Leaf_Drought_5M' and 'Root_Drought_5M' were further aggregated into two gene sets named as 'All_Leaf_MB' and 'All_Root_MB', of which there were 243 and 197 genes, respectively (Supplemental Table S5).
Moreover, 10 crucial genes in leaves and 10 in roots were obtained by PPI analysis, categorized 'Leaf_MB_10' and 'Root_MB_10', respectively (Fig. 5c, d). VcCYP75A1 and VcPNC1 were common key genes (core enriched genes) in leaves and roots (Fig. 5e, f). As mentioned in Fig. 3g, VcPNC1 was also the key gene in the part of signal transduction-related genes. The heat map and KEGG annotation analysis of the gene sets 'Leaf_MB_10' and 'Root_MB_10' showed that the pathway involving the largest number of genes in 'Leaf_MB_10' was monoterpenoid biosynthesis, while the pathways in 'Root_MB_10' were phenylpropanoid biosynthesis and flavonoid biosynthesis. Among them, VcPNC1 belongs to phenylpropanoid biosynthesis, and VcCYP75A1 belongs to flavonoid biosynthesis. Meanwhile, it was also found that the expression levels of two key genes in leaves and roots under MD and SD treatments were higher than those of CK (Fig. 5f).
The expression verification of qRT-PCR found that the expression trend of VcCYP75A1 is consistent with the RNA-seq results (Fig. 5g). Previous studies and KEGG annotation analysis revealed that the flavonoid 3',5'-hydroxylase (F3'5'H) encoded by the VcCYP75A1 homologous gene is related to the synthesis of anthocyanins[33,34]. Therefore, combined with the phenotype of blueberry leaves turning red under drought stress (Fig. 1), the anthocyanin content was determined in this study. The results showed that the anthocyanin concentration in the leaves and roots under MD and SD treatments was significantly higher than those of CK (P < 0.05) (Fig. 5h) and more anthocyanin accumulated in leaves especially under SD treatment. Surprisingly, VcCYP75A1 was induced to highly express in roots under MD. As the drought worsens, the expression level of VcCYP75A1 declined in roots and greatly increased in leaves under SD treatment (Fig. 5g).
-
When plants grown under adverse conditions, different signaling pathways and TFs jointly respond to the stress through a variety of complex metabolic responses, including osmotic regulation, membrane system regulation, cellular redox, primary metabolism and secondary metabolism[30,35]. In our study, the global transcriptome profile of the leaves and roots of blueberry under different drought treatments by RNA-seq were conducted and drought-related genes were screened and analyzed using WGCNA and KEGG enrichment. The expression of seven identified key genes were verified by qRT-PCR analysis and compared with RNA-seq data, and the results confirm the reliability of our transcriptome data. The leaves and roots of blueberry exhibited different expression patterns under drought treatment and differentially expressed genes (DEGs) was more enriched in leaves with 4670 than in roots with 2961, which is further confirmed by GO terms and KEGG enrichment. Similarly, in Poncirus trifoliate, the leaves and roots of tetraploids also exhibited different expression patterns of a variety of upregulated genes with enhanced salt tolerance[5].
Multiple signaling pathways involved in blueberry response to drought stress
-
Under abiotic stress, plants will trigger multiple signal transduction pathways and activate downstream regulatory genes to cope with stress[30]. In this study, based on GO and KEGG analysis, we found that multiple signal transduction pathway was involved in blueberry response to drought stress (Figs 4−6). A total of four pathways were enriched in both leaves and roots. The pathway with the highest proportion of core genes in blueberry leaves is plant hormone signal transduction, and in roots are MAPK signaling pathway and reactive oxygen species metabolic and biosynthetic process (Fig. 3). VcXTH3, VcPP2C51, and VcPNC1 were identified as common key genes (core enriched genes) in leaves and roots probably involved in blueberries responding to drought stress. Plant MAPK signaling pathway can be initiated by various abiotic stress stimulators and plays a key role in stress signal transduction[36]. Nine MAPK genes have been isolated from rice, and the protein kinases they encode can respond to drought stress. The mRNA of OsMSRMK2 accumulates significantly 15 min after drought stress[37]. In this study, 103 in leaves and 69 DEGs in root of MAPK signaling pathway were screened. Among them, five key genes in leaves and four in roots were identified, respectively, of which VcPP2C51 is the key gene in both the two tissues. VcPP2C51 encodes protein phosphatase 2C and participates in MAPK signaling pathway and plant hormone signal transduction. Protein phosphatase 2C is a critical component of ABA signaling pathway. When ABA is present, it promotes the formation of RCAR-PP2C complex, which activates SnRKs and acts on genes such as transcription factors, membrane proteins and ion channels, and finally causes the ABA regulatory pathway to function[38]. Here, we found that the expression level of VcPP2C51 and ABA content under MD and SD treatments were consistent and significantly higher than those of CK (Fig. 3g), suggesting that drought can increase ABA biosynthesis and accumulation both in leaves and roots, induce the expression of VcPP2C51 and trigger the ABA-activated signaling pathway, thereby promote drought tolerance.
Phytohormone play a key role in response to abiotic stress, effectively coordinating various signal transductions[39]. Previous studies have shown that the ABA-activated signaling pathway was the core of plant defense to drought stress[18]. In this study, 92 plant hormone signal transduction genes were screened from leaves, including seven key genes, and 61 from roots with two key genes, of which VcPP2C51 and VcXTH3 were common key genes. VcXTH3 encodes xyloglucan endotransglucosylase/hydrolase and participates in cell wall biogenesis, which plays an essential role in cell wall remodeling and cell elongation[40]. ABA and drought treatment can regulate the activity of the enzyme, then cause changes of cell permeability to improve plant stress tolerance[41].
Reactive oxygen species (ROS), a typical product of plant cell metabolism, usually accumulates in large amounts when plants are subjected to adversity stress, and causes oxidative damage to cells. ROS can also be used as a signal molecule to activate related active substances or defense systems to alleviate plant damage caused by stress[42]. In this study, 30 DEGs for ROS metabolic and biosynthetic processes were screened from leaves with one key gene, and 27 DEGs from roots with four key genes. Among them, VcPNC1 was identified, and its homologous genes were reported to encode POD and participate in the hydrogen peroxide catabolic process and phenylpropanoid biosynthesis[23]. Meanwhile, it was found that three key genes in roots including VcPER64, VcPER5-1 and VcPER5-2, and their homologous genes were related to the coding of a critical terminal oxidase POD[43], which were responsible for removing excess H2O2 and phenols in plants[23]. In the present study, the expression level of VcPNC1 and POD activities in leaves and roots both showed a significant upward trend as the degree of drought intensified (Fig. 3). These results suggest that drought stress induce the expression of VcPNC1 and probably participate in the regulation of POD activities, which is crucial for blueberry to remove ROS and phenols during drought stress.
Transcription factors involved in response to drought stress
-
TFs play essential roles in plant growth, development, and stress tolerance[30]. Under abiotic stress, TFs reduce the damage caused by stress to plants from multiple levels by initiating multiple pathways[44]. TFs families showed different transcriptional regulation modes under drought conditions among plant species with the change of drought intensity, drought time and development stage, etc. WRKY, NAC, MYB, bZIP, Homeobox, and HSF are the main TFs in response to drought in tomato[45]. In rice, 261 transcription factors showed differential express under drought stress and MYB and AP2/EREBP are the most involved families[46]. In our study, a total of 367 TFs in leaves involved 28 families, and 185 TFs in roots involved 21 families were screened (Fig. 4). Ten key genes were identified in leaves and roots through PPI analysis, mainly related to AP2/ERF, MYB, and bZIP TFs genes. In fact, similar results have been reported in other species. For instance, AP2/ERF, MYB, and bZIP TFs family genes were identified with the greatest expression variation in drought-tolerant transcriptome analysis of Populus euphratica[47]. In addition, four key genes including VcMYB93, VcMYB108, VcABF2 and VcABR1 shared by leaves and roots were obtained by Venn analysis combined with the TFs family which the key genes belong to. These results suggest that AP2/ERF, MYB, and bZIP are the key TFs families of blueberry in response to drought stress.
In this study, two key genes, VcABR1 and VcABF2, may be involved in the ABA-activated signaling pathway. Previous studies have shown that the expression of ABR1 in Arabidopsis and Capsicum can be induced by ABA and drought[25]. ABA-INSENSITIVE 5-like protein (ABF) encoding by ABF2 participated in the ABA-activated signaling pathway[48]. The AREB/ABF-SnRK2 pathway in plants can respond to drought through ABA-mediated osmotic stress. As a binding factor of ABA response elements (ABREs), ABF plays an essential role in resisting drought[49]. In this study, the expression levels of VcABR1 and VcABF2 under drought stress were significantly higher than CK. In addition, the expression levels of VcMYB108 in both leaves and roots were markedly induced under MD and SD treatments, suggesting the role of these TFs in blueberry tolerance to drought. It was reported that AtMYB93 encodes two-component response regulator ORR21 (ARR-B) and participates in plant hormone signal transduction and ZT biosynthesis[27,28]. ZT plays a role in response to drought stress via regulating the stability of plant cell membrane[50]. Here, we found that the homologous gene VcMYB93 of AtMYB93, whose expression increases significantly in blueberry leaves as the degree of drought aggravates, first increases and then decreases in root, suggesting that the response time of this gene is different in the roots and leaves. Interestingly, the accumulation of ZT showed the similar trend with VcMYB93 expression. Based on these results, we speculate that VcMYB93 is probably involved in ZT biosynthesis or signaling pathway under drought stress.
Metabolism and biosynthesis-related genes
-
Osmotic regulatory substances and secondary metabolites play important roles in plant defense. Under drought stress, plant cells rapidly accumulate affinity solutes and osmotic protection substances such as phenols, flavonoids, and fatty acids[51]. These substances can coordinate cell osmotic balance by affecting cell water potential, thus protecting cell and membrane homeostasis[52]. In this study, multiple pathways in the metabolism category are involved in blueberry drought response. The pathway with the highest proportion of core genes in leaves is monoterpenoid biosynthesis, and in roots are phenylpropanoid biosynthesis and flavonoid biosynthesis. Phenolic compounds are the main products of phenylpropane biosynthesis, playing an important role in abiotic stress[53]. Under drought stress, the phenylpropane biosynthesis pathway of C. korshinskii and Triticum is significantly enriched by GO or KEGG[31,54]. Here, we found that 68 DEGs for phenylpropanoid biosynthesis were screened from leaves with one key gene, and 63 DEGs from roots with three key genes. Among them, VcPNC1 is responsible for reactive oxygen species metabolic and biosynthetic process. All of the key genes of the phenylpropanoid biosynthesis pathway in leaves and roots can be annotated to be related to POD metabolism through KEGG analysis. POD can oxidize phenylpropane phenols, and plays a key role in removing phenols under adversity[30]
Flavonoids, mainly including flavonols and anthocyanins, have antioxidant and reactive oxygen species scavenging properties, which can prevent oxidative damage under abiotic stress[55]. Transcriptome analysis of Brassica juncea var. Varuna and Magnolia wufengensis revealed significant changes in genes related to flavonoid biosynthesis under adversity stress[30,56]. Flavonoid synthesis genes identified in Arabidopsis also play an important role in alleviating oxidation and resisting drought[57]. Cytochrome P450 (CYP) superfamily is the largest plant enzyme family in plant metabolism[58]. CYP plays a role in plant development and defense responses mainly by participating in the biosynthesis of phytoalexins, the synthesis of secondary metabolites and the regulation of phytohormone metabolism[59]. In our study, 23 DEGs related to flavonoid synthesis in leaves with one key gene and 11 in roots with three key genes were screened, respectively. Among them, VcCYP75A1 is a common key gene, which encodes flavonoid 3',5'-hydroxylase (F3'5'H) and its homologues were involved in drought stress response through redox homeostasis and osmotic adjustment[60,61]. F3'5'H is a key enzyme in the synthesis of dihydroquercetin in flavonoid biosynthesis, which is a key process for the synthesis of anthocyanins[33]. VcCYP75A1 was induced to highly express in roots under MD. As drought intensified, the expression level of VcCYP75A1 declined in roots and greatly increased in leaves under SD treatment (Fig. 5g). The anthocyanin content showed a similar trend as the change in expression level of VcCPY75A1 (Fig. 5h). In comparison, the anthocyanin content in the roots is relatively lower than in the leaves under SD treatments. Given the correlation between anthocyanin synthesis and the expression level of VcCYP5A1 in the leaves and roots of blueberry under drought stress, we speculate that VcCYP5A1 is likely involved in blueberry flavonoid synthesis that modulates the anthocyanin synthesis and regulation in response to drought stress, being highly expressed in the roots early, and in the leaves late.
The molecular regulation mechanism and network of blueberry to drought
-
In this study, the global transcription profiles of blueberry leaves and roots were analyzed using WGCNA and PPI analysis. The change trend of key genes was verified by qRT-PCR and consistent with the corresponding physiological indexes under drought stress. Eight key genes shared by leaves and roots were screened, including three signal transduction related genes named VcXTH3, VcPP2C51 and VcPNC1, four transcription factor-related genes named VcABR1, VcABF2, VcMYB108 and VcORR21, two metabolism and biosynthesis-related genes named VcPNC1 and VcCYP75A1. In the meantime, the key genes of leaves and roots were screened, and there were seven each in leaves and roots in the signal transduction response, six each in leaves and roots in the transcription factor response, and eight each in the two tissues in the metabolism and biosynthesis responses (Supplemental Table S6). These genes are also essential for understanding the mechanism of blueberries in response to drought stress, and it is worthy of further investigation.
Taken together, we proposed a potential working model to explore the mechanisms of blueberry in response to drought (Fig. 6). Under drought stress, the responsive pathways of leaves and roots of blueberry involved signal transduction, regulation of transcription factors, and metabolic response. The leaves and roots have their specific drought-resistant mechanisms due to their own characteristics since DEGs and GO terms or KEGG pathways were more enriched in leaves than those in roots under drought stress. VcXTH3 in the plant hormone signal transduction pathway may induce cell wall remodeling and cell elongation through the regulation of ABA. VcPP2C51 was annotated into both MAPK signaling pathway and ABA-activated signaling pathway, suggesting the two pathways may crosstalk at this gene site. VcPNC1 in ROS metabolic and biosynthetic process pathway is a POD regulatory gene and responsible for removing excess H2O2 and phenols in plants. VcABR1 of AP2/ERF family and VcABF2 of bZIP family in the regulation category of transcription factors are both key genes of the ABA-activated signaling pathway to resist drought stress. VcMYB108 in MYB family also likely participate in the abiotic stress response, but the specific mechanism of resisting drought stress needs further study. VcMYB93, another member of the MYB family, was annotated into ZT biosynthesis and function probably by improving cell membrane stability. VcCYP75A1 of the flavonoid biosynthesis pathway in the metabolism category can promote anthocyanin accumulation and resist drought by affecting cell redox homeostasis and osmotic regulation. Among them, VcPNC1 was a potential key gene in the two pathways of ROS and phenylpropanoid biosynthesis, indicating that it plays an essential role in blueberry response to drought stress. However, these potential regulation pathways and key genes needs further investigation.
-
In this study, the plants of blueberry variety 'Bluecrop' were used as experimental materials. The 3-month-old uniform seedlings with a height of about 18 cm were cultivated and transplanted into the soil for drought treatment. The soil constitution, available nutrients, and cultivation environment were performed as described in a previous study[62]. Plants with the same growth conditions were randomly selected for grouping, and each treatment group had three replicates, each replicate included nine pots with three plants in each pot. A total of three groups were set up in the following experiment: control group (CK), moderate drought (MD) and severe drought (SD) with the soil water contents (SWC) designated at 75%−80%, 55%−60% and 30%−35%, respectively. All pots were watered every 3 d with an equal amount of water. After all the seedlings were cultivated for 15 d, the soil water content of the control group and the experimental group was maintained at the predetermined soil water content by withholding irrigation. The SWC of the three groups reached the predetermined level after 10, 20 and 40 d of withholding irrigation[62,63]. The SWCs of the three groups were controlled by the gravimetric method[64]. Samples for RNA transcriptome sequencing were collected when soil water content in each of the three groups reached predetermined levels. The plants used for the physiological indexes need to maintain the corresponding SWC for 10 d after the SWC of the three groups reaches the predetermined level.
The leaves (L) and roots (R) of blueberry seedlings were taken, respectively, rinsed with distilled water and dried, immediately placed in liquid nitrogen for quick freezing, and then stored at −80 °C. For RNA-seq and qRT-PCR experiments, each treatment included three biological replicates, each biological replicate included one seedling. For physiological and biochemical analysis, six plants were randomly selected as a biological replicate, and each group was set up with three biological replicates.
Measurement of morphological and physiological indexes
-
The Peroxidase (POD) activity was detected using a kit from Jiancheng Bioengineering Institute (Nanjing, China). The concentration of anthocyanin was quantified by (A530 − 0.25 × A657) g−1 dry weight (DW) using a recorded absorbance method with modification. The endogenous phytohormones ZT and ABA were measured by high-performance liquid chromatography (HPLC). The detection wavelength was 254 nm of ABA and 270 nm of ZT, with an injection volume of 10 μL. The specific methods, experimental operations, and other settings were performed as described in previous studies[63]. All experiments were performed for three technical replicates and three biological replicates.
RNA sequencing and transcriptome analysis
-
The library construction and sequencing (Illumina HiSeqxten system) of the samples of the three treatments were conducted by Shanghai Majorbio Bio-pharm Biotechnology Co., Ltd. (Shanghai, China)[62]. The total RNA isolation, construction of RNA-seq transcriptome library, trim and quality control of raw reads, and other settings were performed as described in our previous studies[62]. The clean reads of our obtained were individually aligned with the reference genome (
http://gigadb.org/dataset/100537 ) using Hisat2 software (version2.0.0) with default parameters.The comparison of genes and database are as follows: using software DIAMOND, NR and Swiss-Prot compared to EggNOG database, and BLAST2GO, HMMER and KOBAS2.1[65] was compared to GO, Pfam and KEGG database, respectively. All the above transcriptome data analysis and the sample PCA analysis were performed on the Majorbio online cloud platform with default parameters (
https://cloud.majorbio.com/ ).Differential expression analysis, functional enrichment and data analysis
-
RSEM was used to quantify gene and isoform abundances (
http://deweylab.biostat.wisc.edu/rsem/ )[66], and the DESeq2 (a R statistical package software) was used for the differential expression analysis (http://bioconductor.org/packages/stats/bioc/DESeq2/ )[67]. The DEGs between two different samples were identified by expression level, and the expression level of each gene was calculated according to FPKM. Genes with P-adjust < 0.05 and fold change ≥ 5 were defined as DEGs. Venn analysis of DEGs were performed at 'Majorbio' Cloud Platform. Functional-enrichment analysis including KEGG and GO was performed on DEGs to identify which DEGs significantly enriched in metabolic pathways and GO terms in the background of Bonferroni-corrected P-value ≤ 0.05 whole-transcriptome. Heatmaps were generated using the log10 fold changes values at MD_R/SD_R/MD_L/SD_L compared with CK_R and CK_L. WGCNA was constructed using the online tools[68] on the Majorbio Cloud Platform. Module recognition (network Type = signed, soft power = 6, minimum module size = 30, minKME to Stay = 0.3, mergeCutHeight = 0.25), and genomes with similar expression patterns ('modules') were identified. The module eigengenes (i.e., the first principal component of the module) were associated with the related variables of the main drought stress treatment (as dummy variable) using linear regression[69]. Drought data included SWC and RWC. Finally, the gene PPI was constructed by the 'Majorbio' Cloud Platform[63]. All analysis settings were set at their default values unless previously mentioned.Quantitative real-time PCR
-
Total RNA extraction was conducted from leaves and roots according to TRIzol® Reagent Plant RNA Kit (Invitrogen). The first-strand cDNA was synthesized according to FastQuant cDNA First-Strand Synthesis Kit (Tiangen Biotechnology, Beijing). The instruments and reagents used in the qRT-PCR assay were StepOnePlusTM (ABI, USA) and real-time PCR kit (Tiangen Biotechnology, Beijing), respectively. The primer sequences of eight DEGs and other genes used in this study are shown in Supplemental Table S4. Expression data were analyzed using VcUBC28 as the reference gene[62,70]. The RNA-seq data were displayed by log10 (FPKM + 1). In qRT-PCR experiments, all samples were conducted in three replicates.
Statistical analyses of data
-
The IBM-SPSS Statistics v23 was used for statistical analysis. Statistical differences were analyzed using Dunnett's test, and P < 0.05 was considered a significant difference.
Data availability
-
All data and materials used in this study are publicly available. Illumina sequencing raw data was uploaded to the NCBI repository (
www.ncbi.nlm.nih.gov/bioproject/PRJNA737006/ ) with Bio project number PRJNA737006. The other datasets supporting the conclusions of this article are included within the article (see Supplementary Information section).Ethical statement
-
This article does not contain any studies with human participants or animals performed by any of the authors.
-
In this study, the transcriptome profile of blueberry under different degrees of drought stress were conducted, the key genes and pathways associated with drought tolerance were screened by WGCNA and Venn analysis. Eight key pathways and eight DEGs (VcXTH3, VcPP2C51, VcPNC1, VcCYP75A1, VcABR1, VcABF2, VcMYB108 and VcMYB93) were shared both in leaves and roots were identified though GO terms and KEGG pathways analysis. The pathway with the most core genes in leaves is the plant hormone signal transduction pathway, and in roots are the MAPK signaling pathway and reactive oxygen species metabolism. In conclusion, our study revealed the synergistic and distinct defense pathways and mechanisms in leaves and roots of blueberry and explored the potential regulatory network in blueberry response to drought stress.
This study was funded by the grant from the Natural Science Foundation of Beijing (grant number 6222041 to L.Y.Z), National Natural Science Foundation of China (grant number 31872942 to L.Y.Z) and China Postdoctoral Science Foundation (grant number 2021T140060 to Y.B.C).
-
The authors declare that they have no conflict of interest.
-
# These authors contributed equally: Aibin Wang, Lei Wang
- Supplementary Table S1 Analysis of transcriptional sequence assembly and alignment of blueberry under drought stress.
- Supplemental Table S2 Summary of genes related to signal transduction.
- Supplemental Table 3 Summary of genes related to transcription factors.
- Supplemental Table S4 Summary of the key genes and their primer for qRT-PCR.
- Supplementary Table S5 Summary of genes related to metabolism and biosynthesis.
- Supplemental Table S3
- Supplementary Table S6 The common and specific key genes detected by RNA-seq under drought stress.
- Supplemental Fig. S1 Weighted gene co-expression network analysis in response to drought.
- Supplemental Fig. S2 Identification of differentially expressed genes.
- Supplemental Table S6
- Copyright: © 2022 by the author(s). Published by Maximum Academic Press, Fayetteville, GA. This article is an open access article distributed under Creative Commons Attribution License (CC BY 4.0), visit https://creativecommons.org/licenses/by/4.0/.
-
About this article
Cite this article
Wang A, Wang L, Liu K, Liang K, Yang S, et al. 2022. Comparative transcriptome profiling reveals the defense pathways and mechanisms in the leaves and roots of blueberry to drought stress. Fruit Research 2:18 doi: 10.48130/FruRes-2022-0018 

Comparative transcriptome profiling reveals the defense pathways and mechanisms in the leaves and roots of blueberry to drought stress
- Received: 29 August 2022
- Accepted: 18 November 2022
- Published online: 29 November 2022
Abstract: Blueberry is an important horticultural plant that is very susceptible to drought. However, the molecular regulation mechanisms of blueberry tolerance to drought remain elusive. In this study, the transcriptome profile of blueberry by RNA-seq under different degrees of drought treatment were conducted and drought-related genes and pathways were screened using weighted gene co-expression network analysis (WGCNA) and Venn analysis. Interestingly, the leaves and roots of blueberry exhibited different expression patterns under drought treatment and differentially expressed genes (DEGs), GO terms and KEGG pathways were more enriched in leaves than in roots. The majority of DEGs were associated with signal transduction, transcriptional regulation, and metabolism. Eight key pathways and eight DEGs were shared both in leaves and roots. Notably, the pathway with the most core genes in leaves is the plant hormone signal transduction pathway, and in roots are the MAPK signaling pathway, reactive oxygen species metabolism and the key genes such as VcXTH3, VcPP2C51, and VcPNC1 were identified. For transcription factors, VcABR1, VcABF2, VcMYB108 and VcMYB93 are likely involved in drought response. In the metabolism category, VcCYP75A1 was likely involved in anthocyanin biosynthesis, and VcPNC1 in the monoterpenoid biosynthesis pathway. The eight DEGs markedly induced under drought exhibited differential expression in leaves and roots. Correspondingly, physiological assays showed that POD activity, ABA content, and anthocyanin biosynthesis in leaves and roots were significantly increased. Collectively, our study revealed the synergistic and distinct defense pathways and mechanisms in leaves and roots of blueberry and explored the potential regulatory network in blueberry response to drought stress.
-
Key words:
- Vaccinium corymbosum /
- RNA sequencing /
- Drought stress /
- Molecular mechanism /
- Transcription factors