-
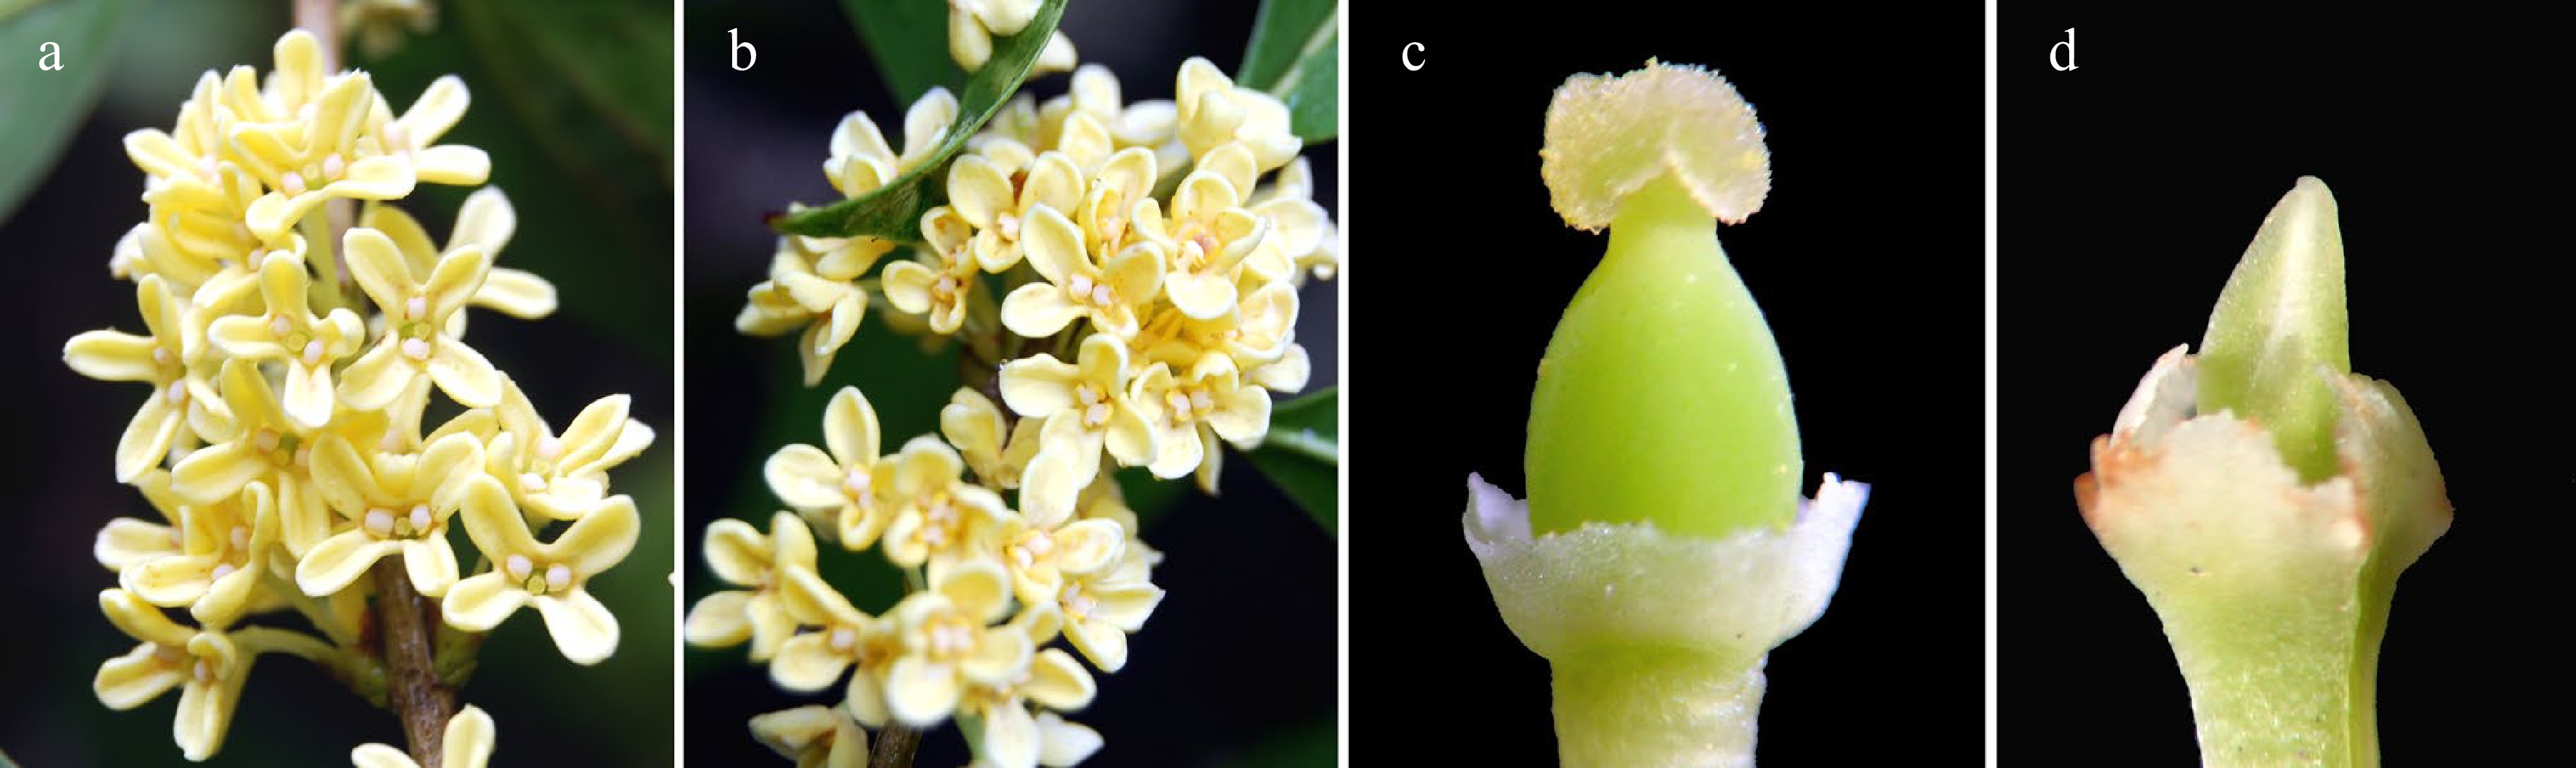
Figure 1.
Males and hermaphrodites of O. fragrans. (a) Hermaphrodite flowers; (b) Male flowers; (c) Pistil of hermaphrodite flower; (d) Pistillode of male flower.
-
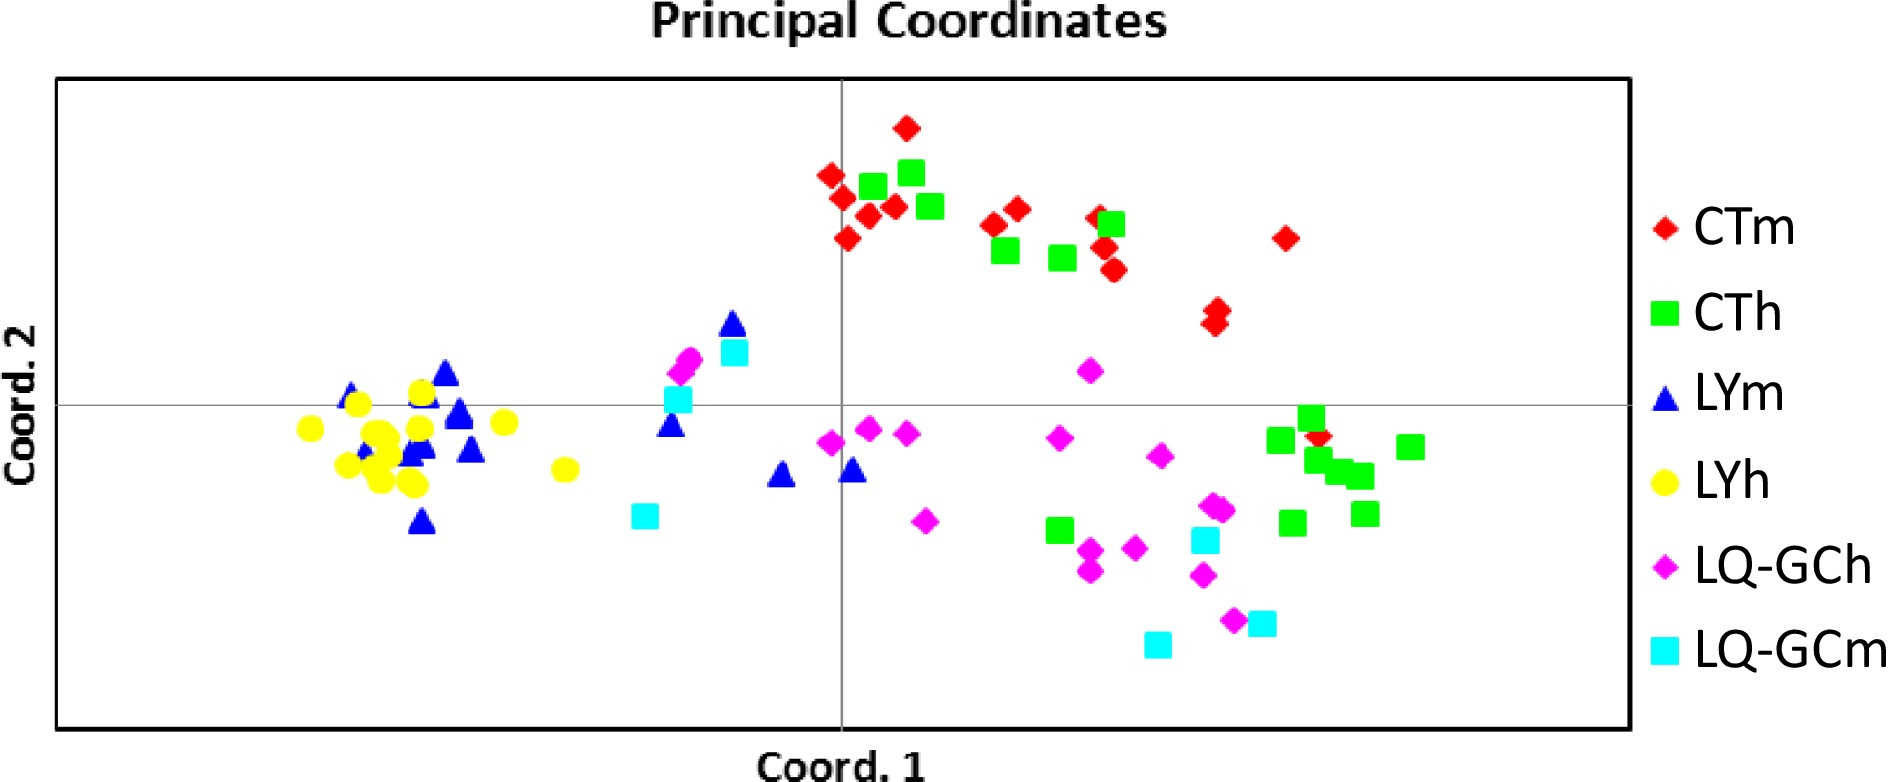
Figure 2.
Principal coordinate analysis (PCA) of genetic differences among 72 wild individuals.
-
Population Locality Description Males Hermaph-rodites Male frequency * χ2 CT Guanfang, Changting, Fujian Isolated island of limestone mountains 100 61 0.620 9.96273 LY Guihuaxia, Zhouluo, Liuyang, Hunan Along a stream, mainly east-facing 35 33 0.515 ns 0.01470 QDH Guihua island, Thousand-isle Lake, Jiande, Zhejiang Isolated island of limestone mountains 26 21 0.553 ns 0.34042 LQ-GC Gongcun, Longquan, Zhejiang Along a stream, west-facing 35 48 0.422 ns 1.73494 LQ-MYC Maoyucun, Longquan, Zhejiang Along a stream, west-facing 19 13 0.594 ns 0.78125 Total 189 172 0.524 ns 0.89751 Sex ratio and male frequency of O. fragrans in different populations were firstly stated by Hao et al.[25]. Here, we cite the part of data and newly add the results of QDH population and make further statistics analysis in this paper. 'ns' means sex ratio does not significantly deviate from 1:1. Table 1.
Locality, the number of males, hermaphrodites, non-flowering plants and male frequency within five populations of O. fragrans.
-
Stage Stage description Day Males Hermaphrodites 1 Bracts dropped and florets appeared gradually. 1 2 2 All florets appeared. 2 3 3 The pedicels of florets elongated gradually. 3 4 4 Florets opened gradually while the petals have not expanded completely. 4 5 5 Florets opened completely while anthers have not dehisced. (However, if the weather was sunny and temperature was high, anthers would dehisce at several hours after flowering.) 5 6−7 6 Anthers dehisced gradually and pollen grains dispersed. (If anthers have dehisced last day, they would brown gradually.) 6 7−8 7 Anthers browned gradually. 7 8−9 8 Florets dropped gradually. 8−9 − 9 The petals of florets browned and wilted gradually but not dropped. − 9−11 Table 2.
Flower blooming process of males and hermaphrodites from CT, LY and LQ-GC population.
-
Populations Gender Sample size No. of
flowering nodeFlower number
per nodeFlower diameter Petal length Petal width Anther width CT M 34 3.73 ± 0.64A 15.47 ± 4.90a 7.00 ± 1.81A 4.05 ± 0.74A 2.49 ± 0.56a 1.28 ± 0.21A H 26 3.17 ± 1.18B 13.73 ± 4.69a 5.81 ± 1.01B 3.48 ± 0.48B 2.49 ± 0.42a 1.11 ± 0.11B LY M 31 4.00 ± 0.83A 15.93 ± 5.32A 6.13 ± 0.52B 3.01 ± 0.67a 2.05 ± 0.31a 1.19 ± 0.08A H 33 3.47 ± 1.07B 13.33 ± 3.62B 6.69 ± 0.61A 3.05 ± 0.54a 2.05 ± 0.28a 1.06 ± 0.10B LQ-GC M 33 4.30 ± 0.88A 18.77 ± 8.94A 6.52 ± 1.47a 3.48 ± 0.43B 2.60 ± 0.43A 1.38 ± 0.14A H 34 3.37 ± 0.81B 14.50 ± 5.97B 6.87 ± 1.86a 3.65 ± 0.63A 2.42 ± 0.43B 1.24 ± 0.19B Males* M 98 4.01 ± 0.81A 16.7 ± 6.73A 6.55 ± 1.41a 3.51 ± 0.76a 2.38 ± 0.50a 1.28 ± 0.17A Hermaphrodites H 93 3.33 ± 1.03B 13.9 ± 4.83B 6.46 ± 1.34a 3.40 ± 0.60b 2.32 ± 0.43a 1.14 ± 0.16B CT** 60 3.45 ± 0.98b 14.60 ± 4.83b 6.42 ± 1.57b 3.77 ± 0.68A 2.49 ± 0.49a 1.19 ± 0.19B LY 64 3.73 ± 0.99a 14.63 ± 4.70b 6.41 ± 0.63b 3.03 ± 0.60C 2.05 ± 0.30b 1.12 ± 0.11C LQ-GC 67 3.83 ± 0.96Aa 16.63 ± 7.84a 6.69 ± 1.67a 3.56 ± 0.54B 2.51 ± 0.44a 1.31 ± 0.18A M: male; H: hermaphrodite. Different upper case letters mean significant differences at p < 0.01 and different lowercase letters mean significant differences at p < 0.05. * Comparison between genders, populations pooled; ** comparison among populations, genders pooled. Table 3.
Floral morphology variations of O. fragrans within three different populations (CT, LY and LQ-GC).
-
Populations Sample size Ovary length Ovary width Stigma length Stigma width CT 26 2.01 ± 0.17a 1.21 ± 0.11a 0.99 ± 0.10a 0.84 ± 0.17a LY 33 1.91 ± 0.26a 1.26 ± 0.11a 0.95 ± 0.10ab 0.85 ± 0.19a LQ-GC 34 1.99 ± 0.16a 1.27 ± 0.14a 0.94 ± 0.12b 0.78 ± 0.10a The different letters indicate significant differences at p < 0.05. Table 4.
Pistil variations of O. fragrans in hermaphrodite genders among populations.
-
Population No. individuals sampled PPL (%) Na Ne I He UHe Br CT 30 67.62 1.399 ± 0.023 1.287 ± 0.009 0.274 ± 0.007 0.175 ± 0.005 0.178 ± 0.005 1.293 LY 30 72.75 1.503 ± 0.022 1.266 ± 0.008 0.265 ± 0.006 0.166 ± 0.005 0.169 ± 0.005 1.290 LQ-GC 22 71.24 1.472 ± 0.022 1.289 ± 0.009 0.282 ± 0.007 0.179 ± 0.005 0.183 ± 0.005 1.313 Mean — 70.54 1.458 ± 0.013 1.280 ± 0.005 0.274 ± 0.004 0.174 ± 0.003 0.177 ± 0.003 — CTm 15 58.74 1.252 ± 0.024 1.273 ± 0.009 0.257 ± 0.007 0.166 ± 0.005 0.172 ± 0.005 1.290 CTh 15 56.83 1.206 ± 0.025 1.267 ± 0.009 0.250 ± 0.007 0.162 ± 0.005 0.168 ± 0.005 1.285 LYm 15 62.77 1.326 ± 0.024 1.264 ± 0.009 0.257 ± 0.007 0.164 ± 0.005 0.169 ± 0.005 1.296 LYh 15 57.31 1.219 ± 0.025 1.243 ± 0.008 0.236 ± 0.007 0.150 ± 0.005 0.156 ± 0.005 1.278 LQ-GCm 6 50.48 1.080 ± 0.025 1.265 ± 0.009 0.245 ± 0.007 0.160 ± 0.005 0.175 ± 0.005 1.336 LQ-GCh 16 64.55 1.368 ± 0.023 1.275 ± 0.009 0.265 ± 0.007 0.169 ± 0.005 0.174 ± 0.005 1.304 Mean — 58.45 1.242 ± 0.010 1.265 ± 0.004 0.252 ± 0.003 0.162 ± 0.002 0.169 ± 0.002 — M 36 78.83 1.606 ± 0.020 1.305 ± 0.009 0.300 ± 0.006 0.190 ± 0.005 0.192 ± 0.005 1.326 H 46 84.29 1.709 ± 0.018 1.301 ± 0.008 0.300 ± 0.006 0.188 ± 0.005 0.191 ± 0.005 1.327 Mean — 81.56 1.362 ± 0.012 1.288 ± 0.004 0.275 ± 0.003 0.177 ± 0.002 0.190 ± 0.003 — CTm and CTh represent male and hermaphrodite gender respectively in Changting population; LYm and LYh represent male and hermaphrodite gender respectively in Liuyang population; LQ-GCm and LQ-GCh represent male and hermaphrodite gender respectively in Longquan population; M and H represent male and hermaphrodite gender respectively from all three populations. Table 5.
Percentage of Polymorphic Loci (PPL), band frequency, estimated allele frequency with number of different alleles (Na), number of effective alleles (Ne), Shannon's information index (I), expected and unbiased expected heterozygosity (He and UHe) and band richness (Br) among different populations.
-
Source df MS Est. Var. % Phi p-value AMOVA analysis 1 Among populations 2 759.002 20.962 13 0.125 0.001 Among genders/
populations3 186.594 3.354 2 0.023 0.006 Within gender 76 143.296 143.296 85 0.145 0.001 AMOVA analysis 2 Among sex groups 1 215.540 0.000 0 0.042 1.000 Among genders/sex groups 4 465.561 24.252 14 0.145 0.001 Within gender 76 143.296 143.296 86 0.109 0.001 p-value estimates are based on 999 permutations. df = degree of freedom and MS = mean squared deviations. Table 6.
Nested analysis of molecular variance (AMOVA) based on 1456 polymorphic loci among different populations.
-
Population CT LY LQ-GC CT — 1.256 2.624 LY 0.166 — 1.536 LQ-GC 0.087 0.140 — Table 7.
Pairwise Population PhiPT Values (below diagonal) and gene flow (Nm) (above diagonal).
-
Sub-population CTm CTh LYm LYh LQ-GCh LQ-GCm CTm — 6.893 1.498 1.073 1.943 2.177 CTh 0.035 — 1.247 0.935 2.559 3.481 LYm 0.143 0.167 — 12.908 1.549 2.354 LYh 0.189 0.211 0.019 — 1.162 1.719 LQ-GCh 0.114 0.089 0.139 0.177 — 27.528 LQ-GCm 0.103 0.067 0.096 0.127 0.009 — Table 8.
Pairwise gender PhiPT Values (below diagonal) and gene flow (Nm) (above diagonal).
Figures
(2)
Tables
(8)