-
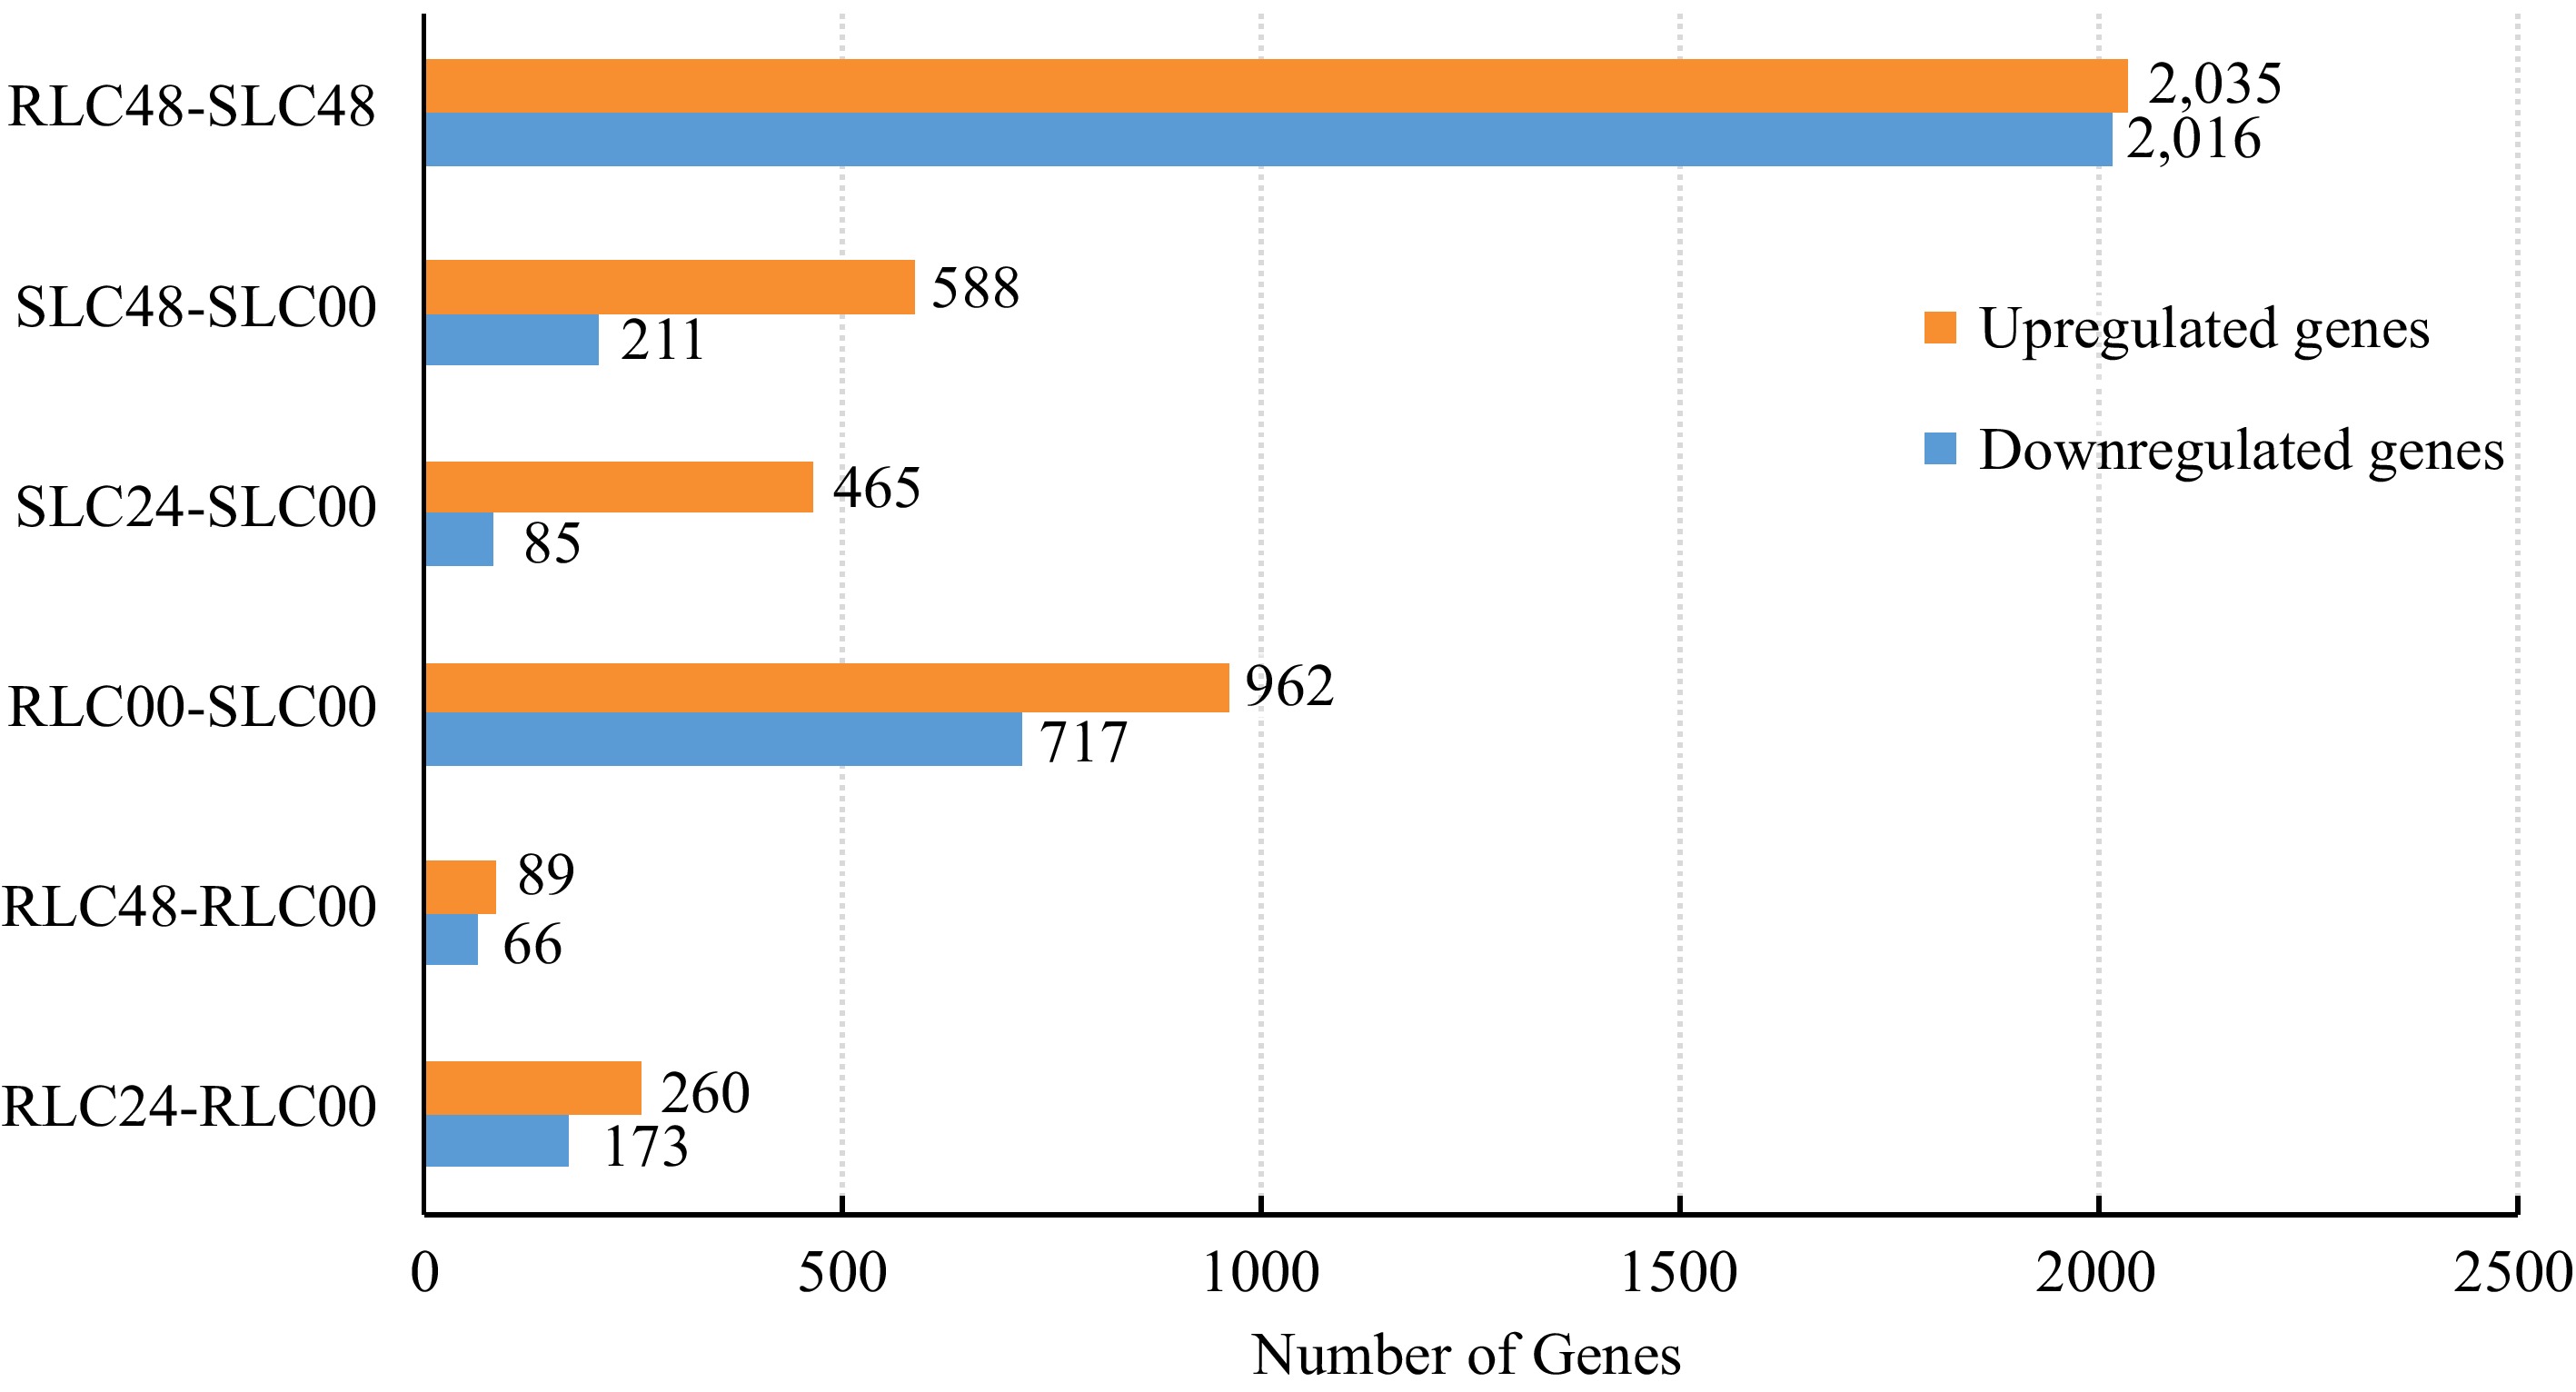
Figure 1.
DEGs identified between different resistant and susceptible lily clones.
-
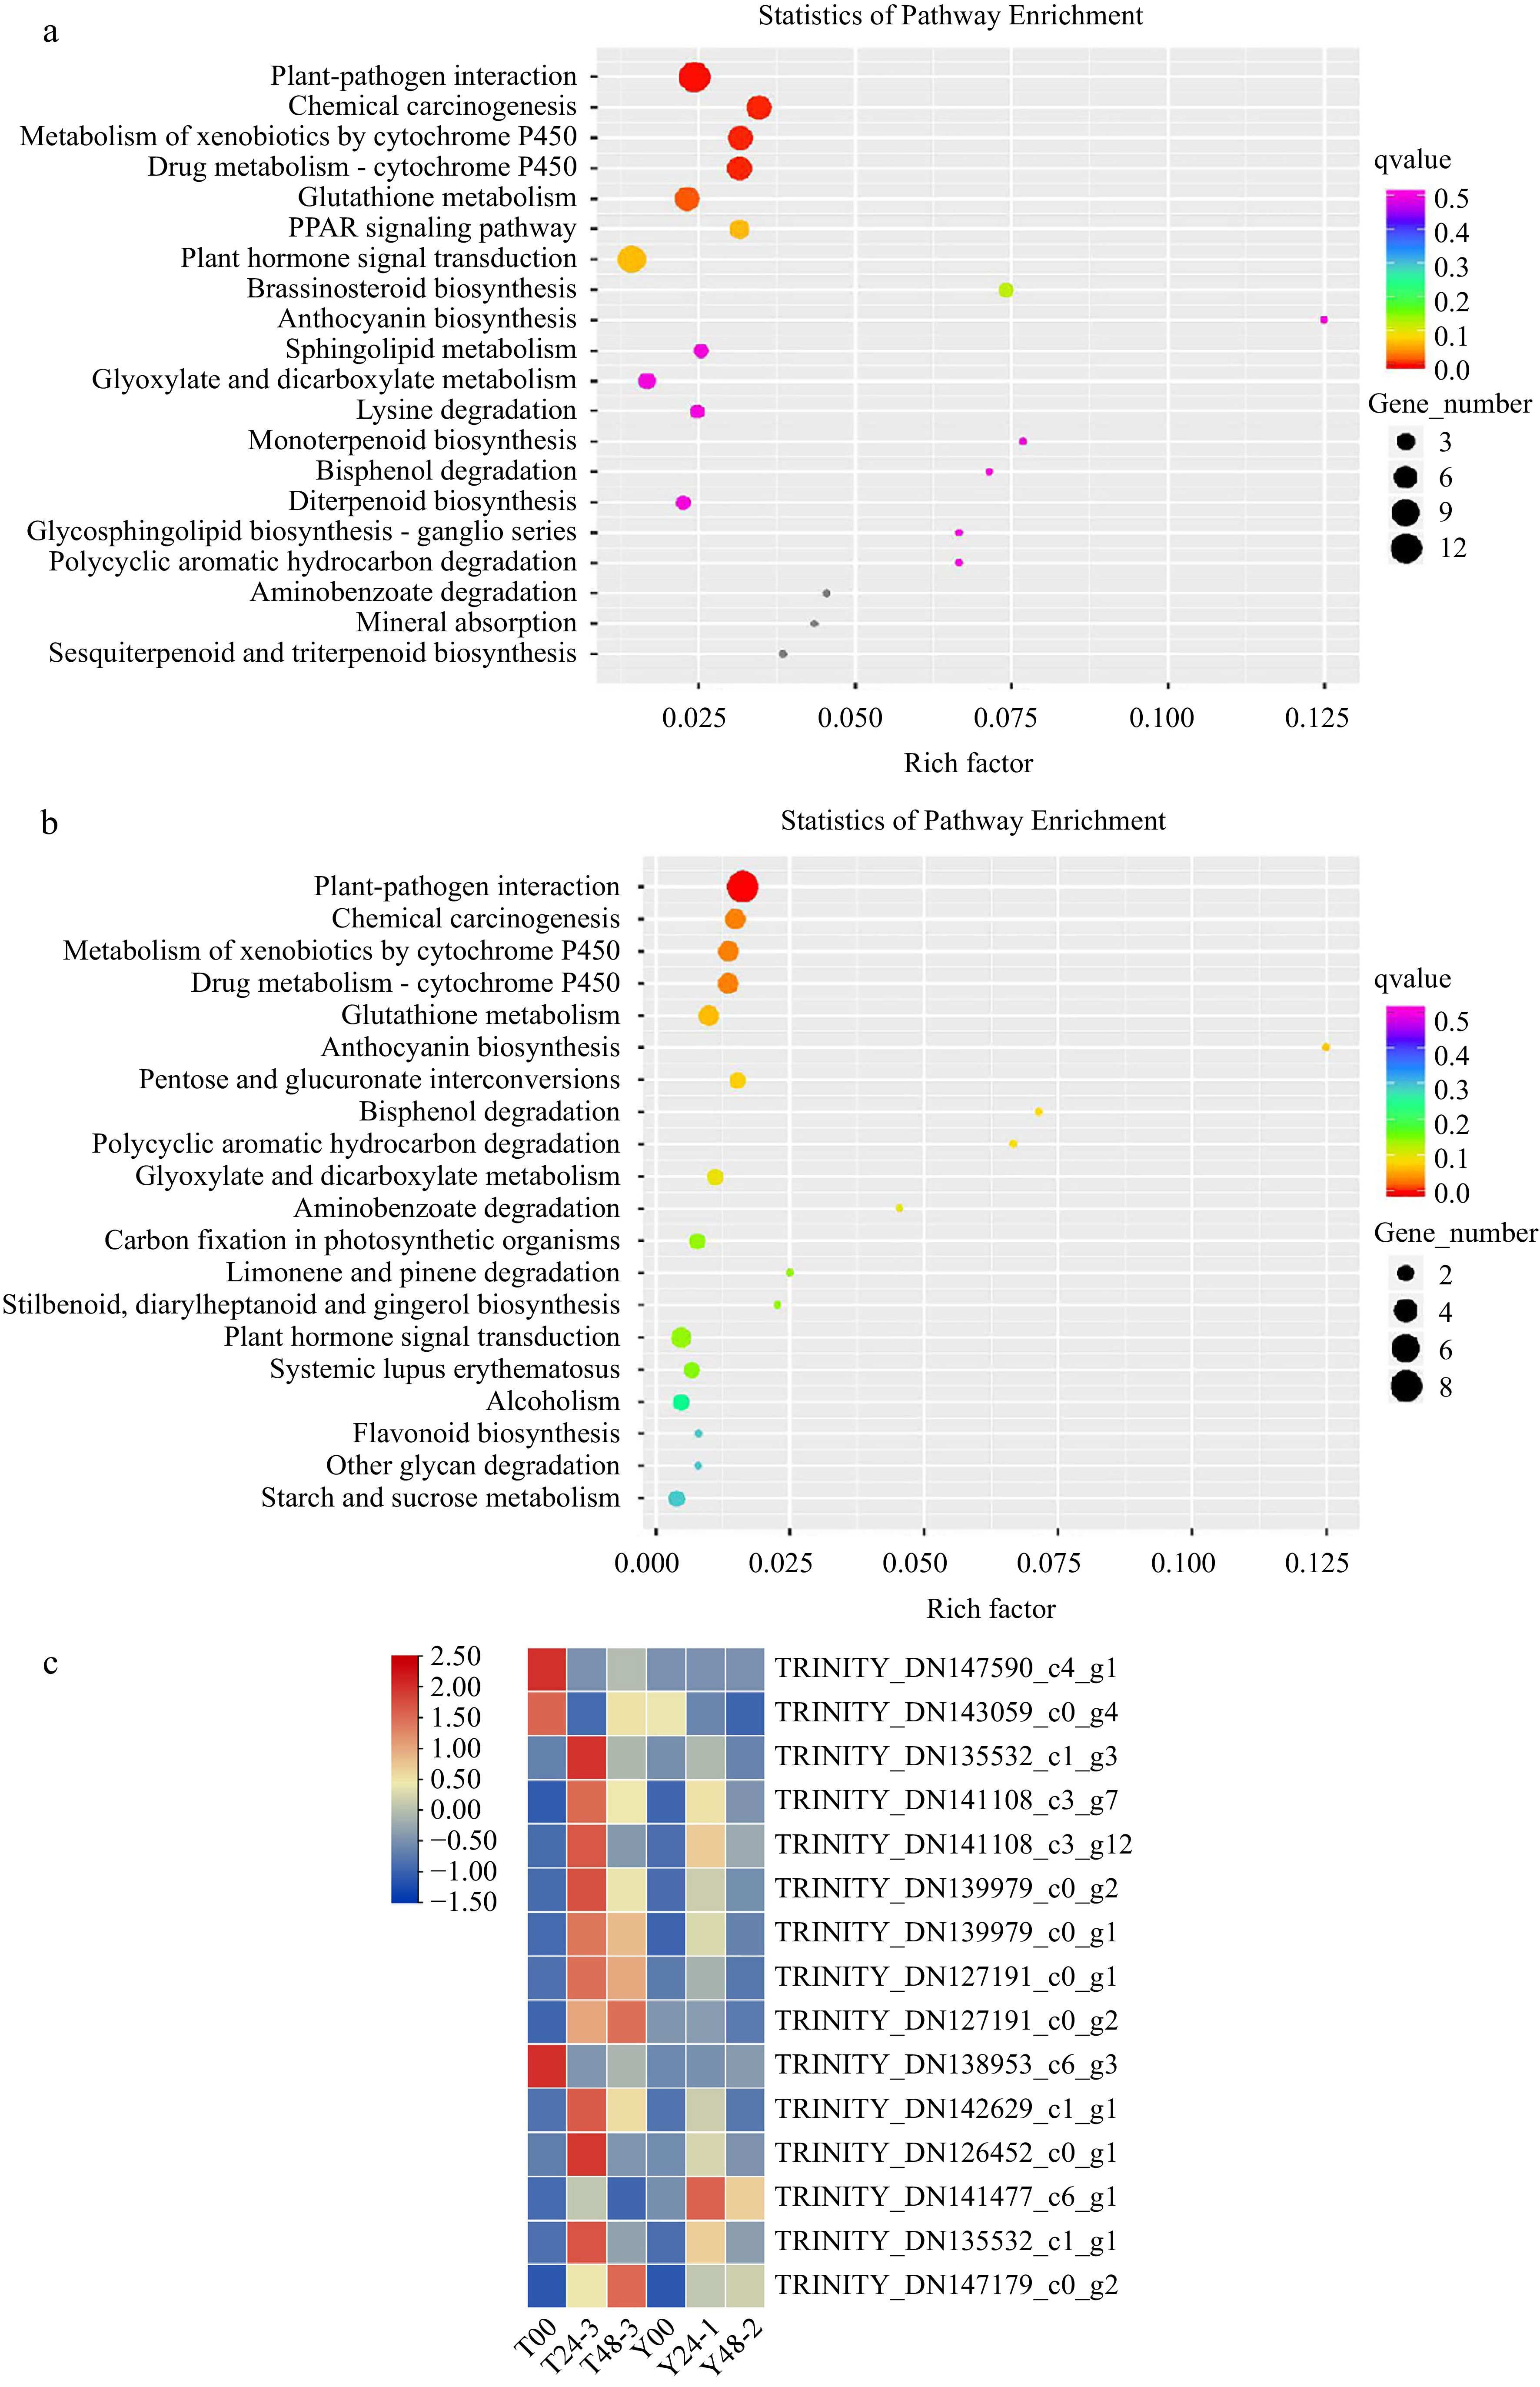
Figure 2.
DEGs isolated from RLC00-RLC24 and RLC00-RLC48 samples were enriched. (a) Gene number were enriched in the profile RLC-00 vs RLC-24; (b) Gene number were enriched in the profile RLC-00 vs RLC-48; (c) DEGs isolated from samples were enriched.
-
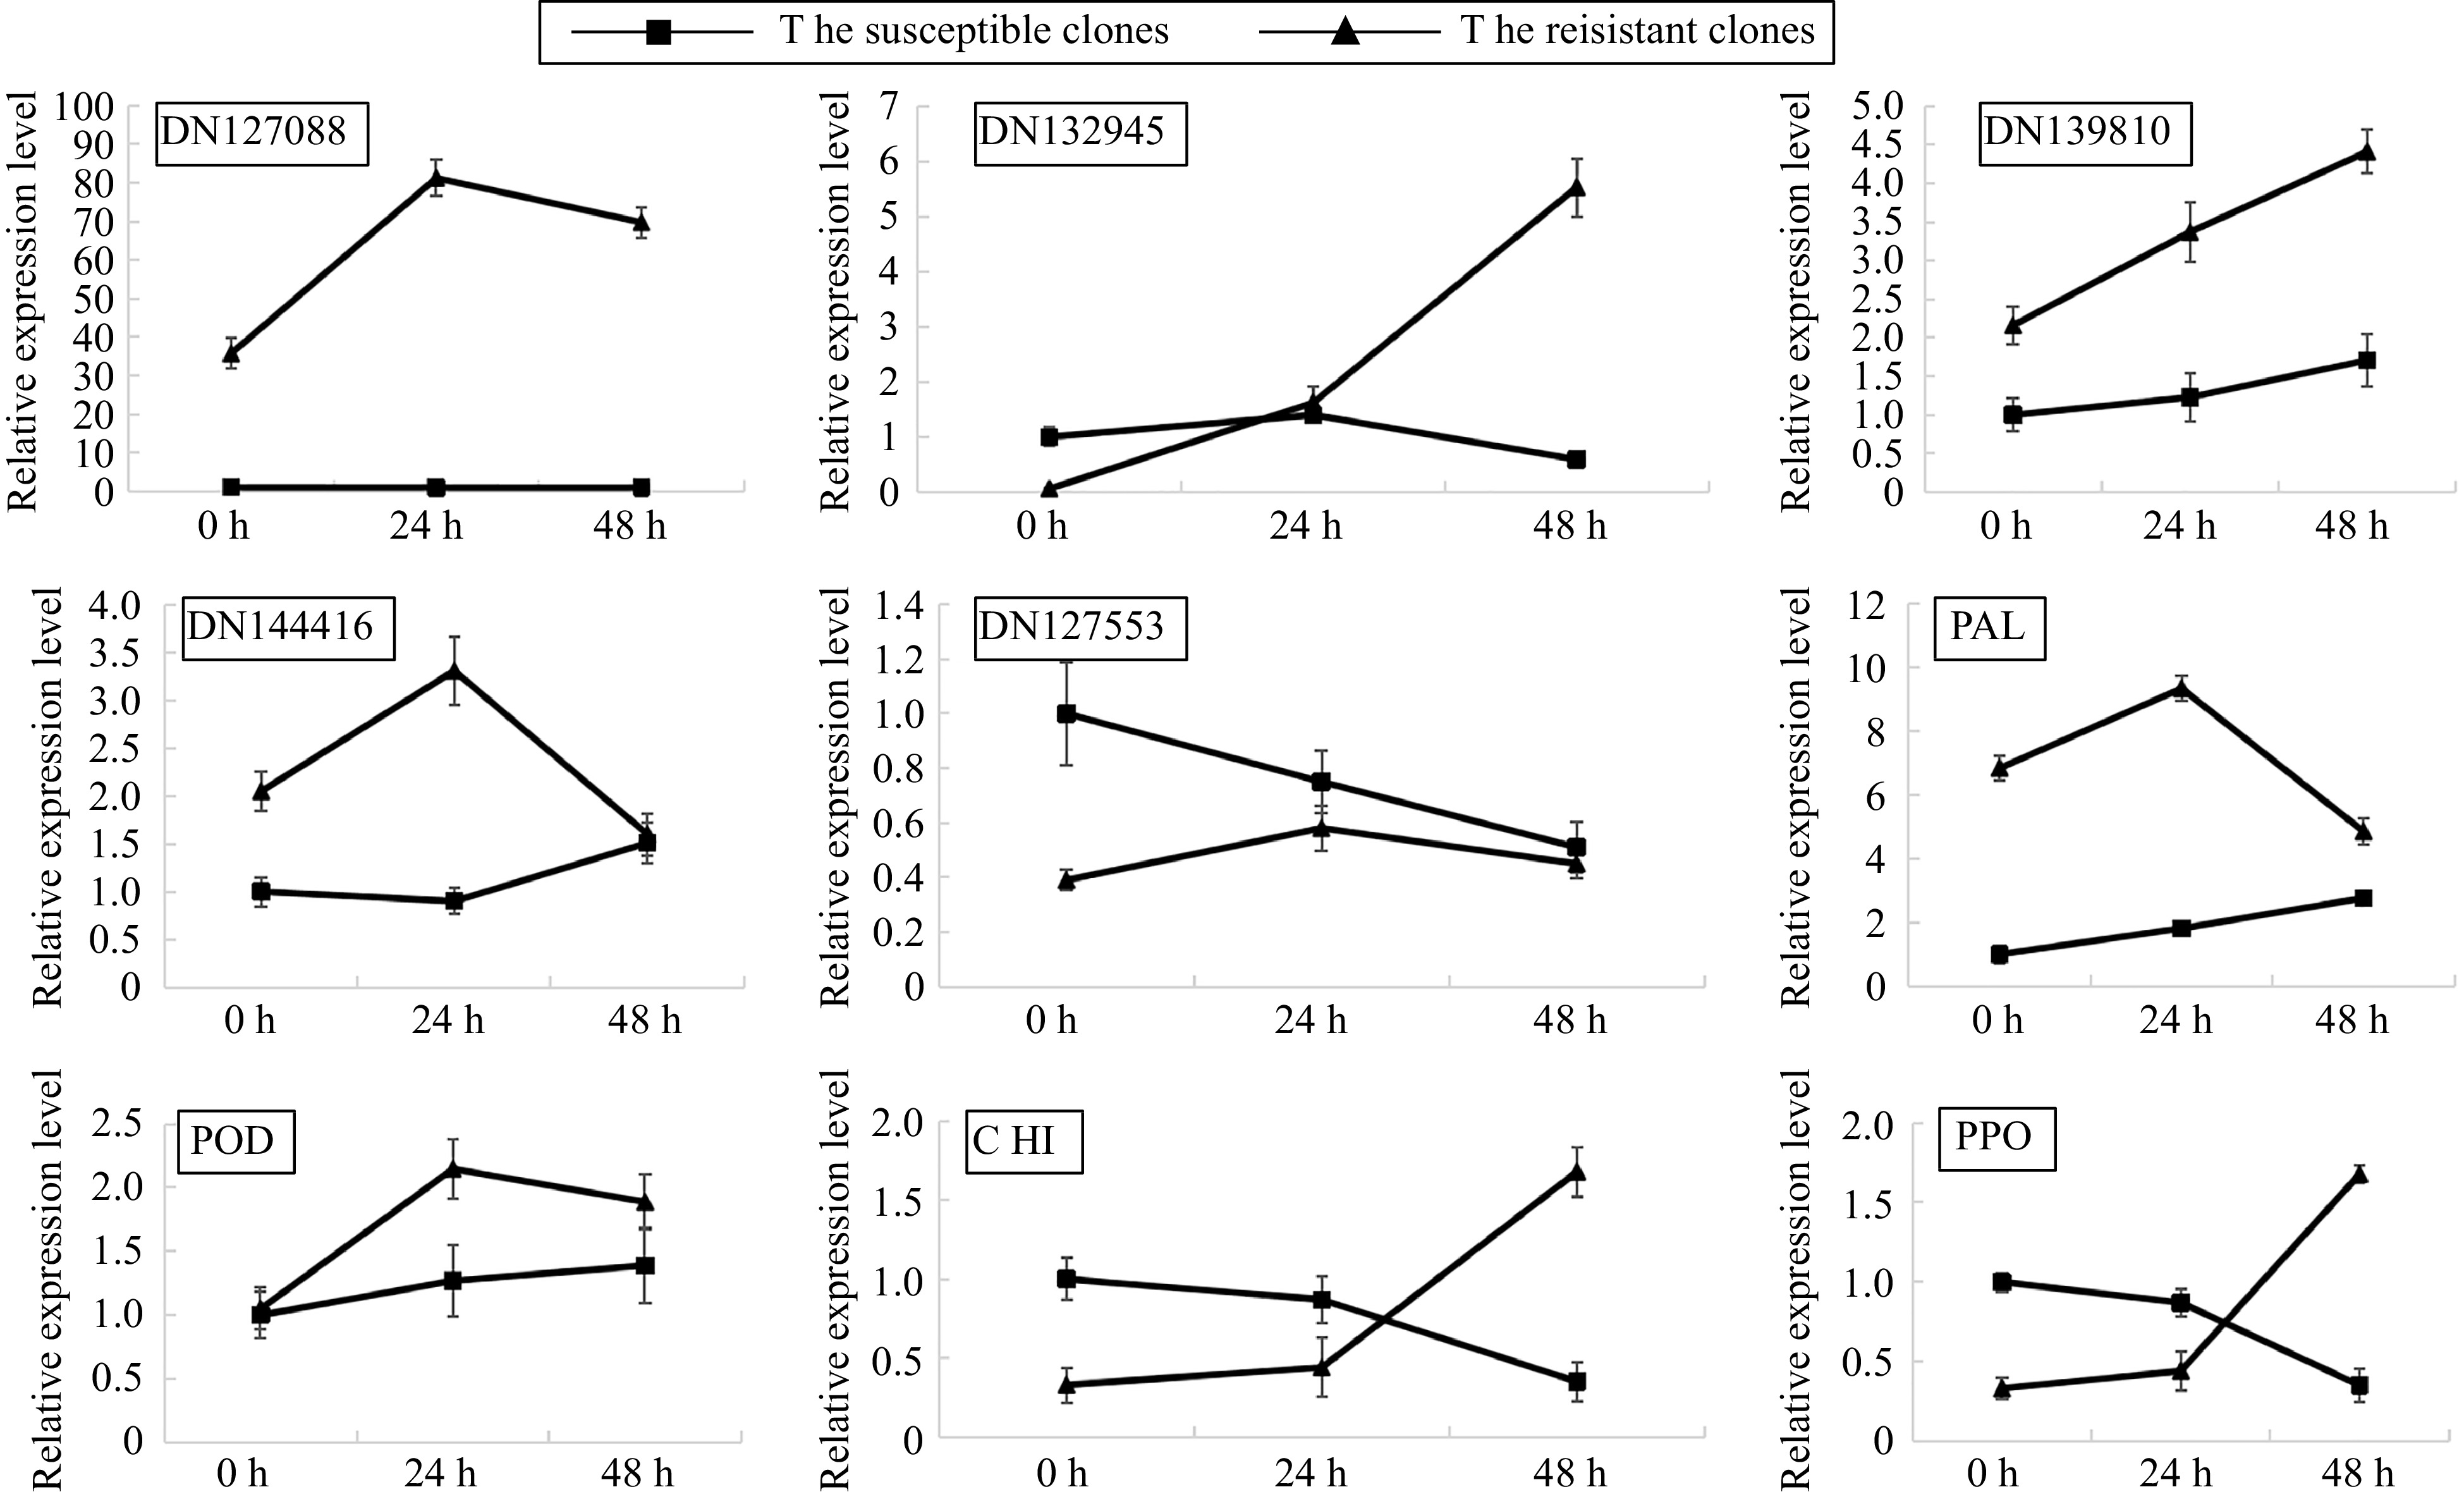
Figure 3.
Quantitative real-time PCR (qRT-PCR) analysis of the relative expression levels.
-
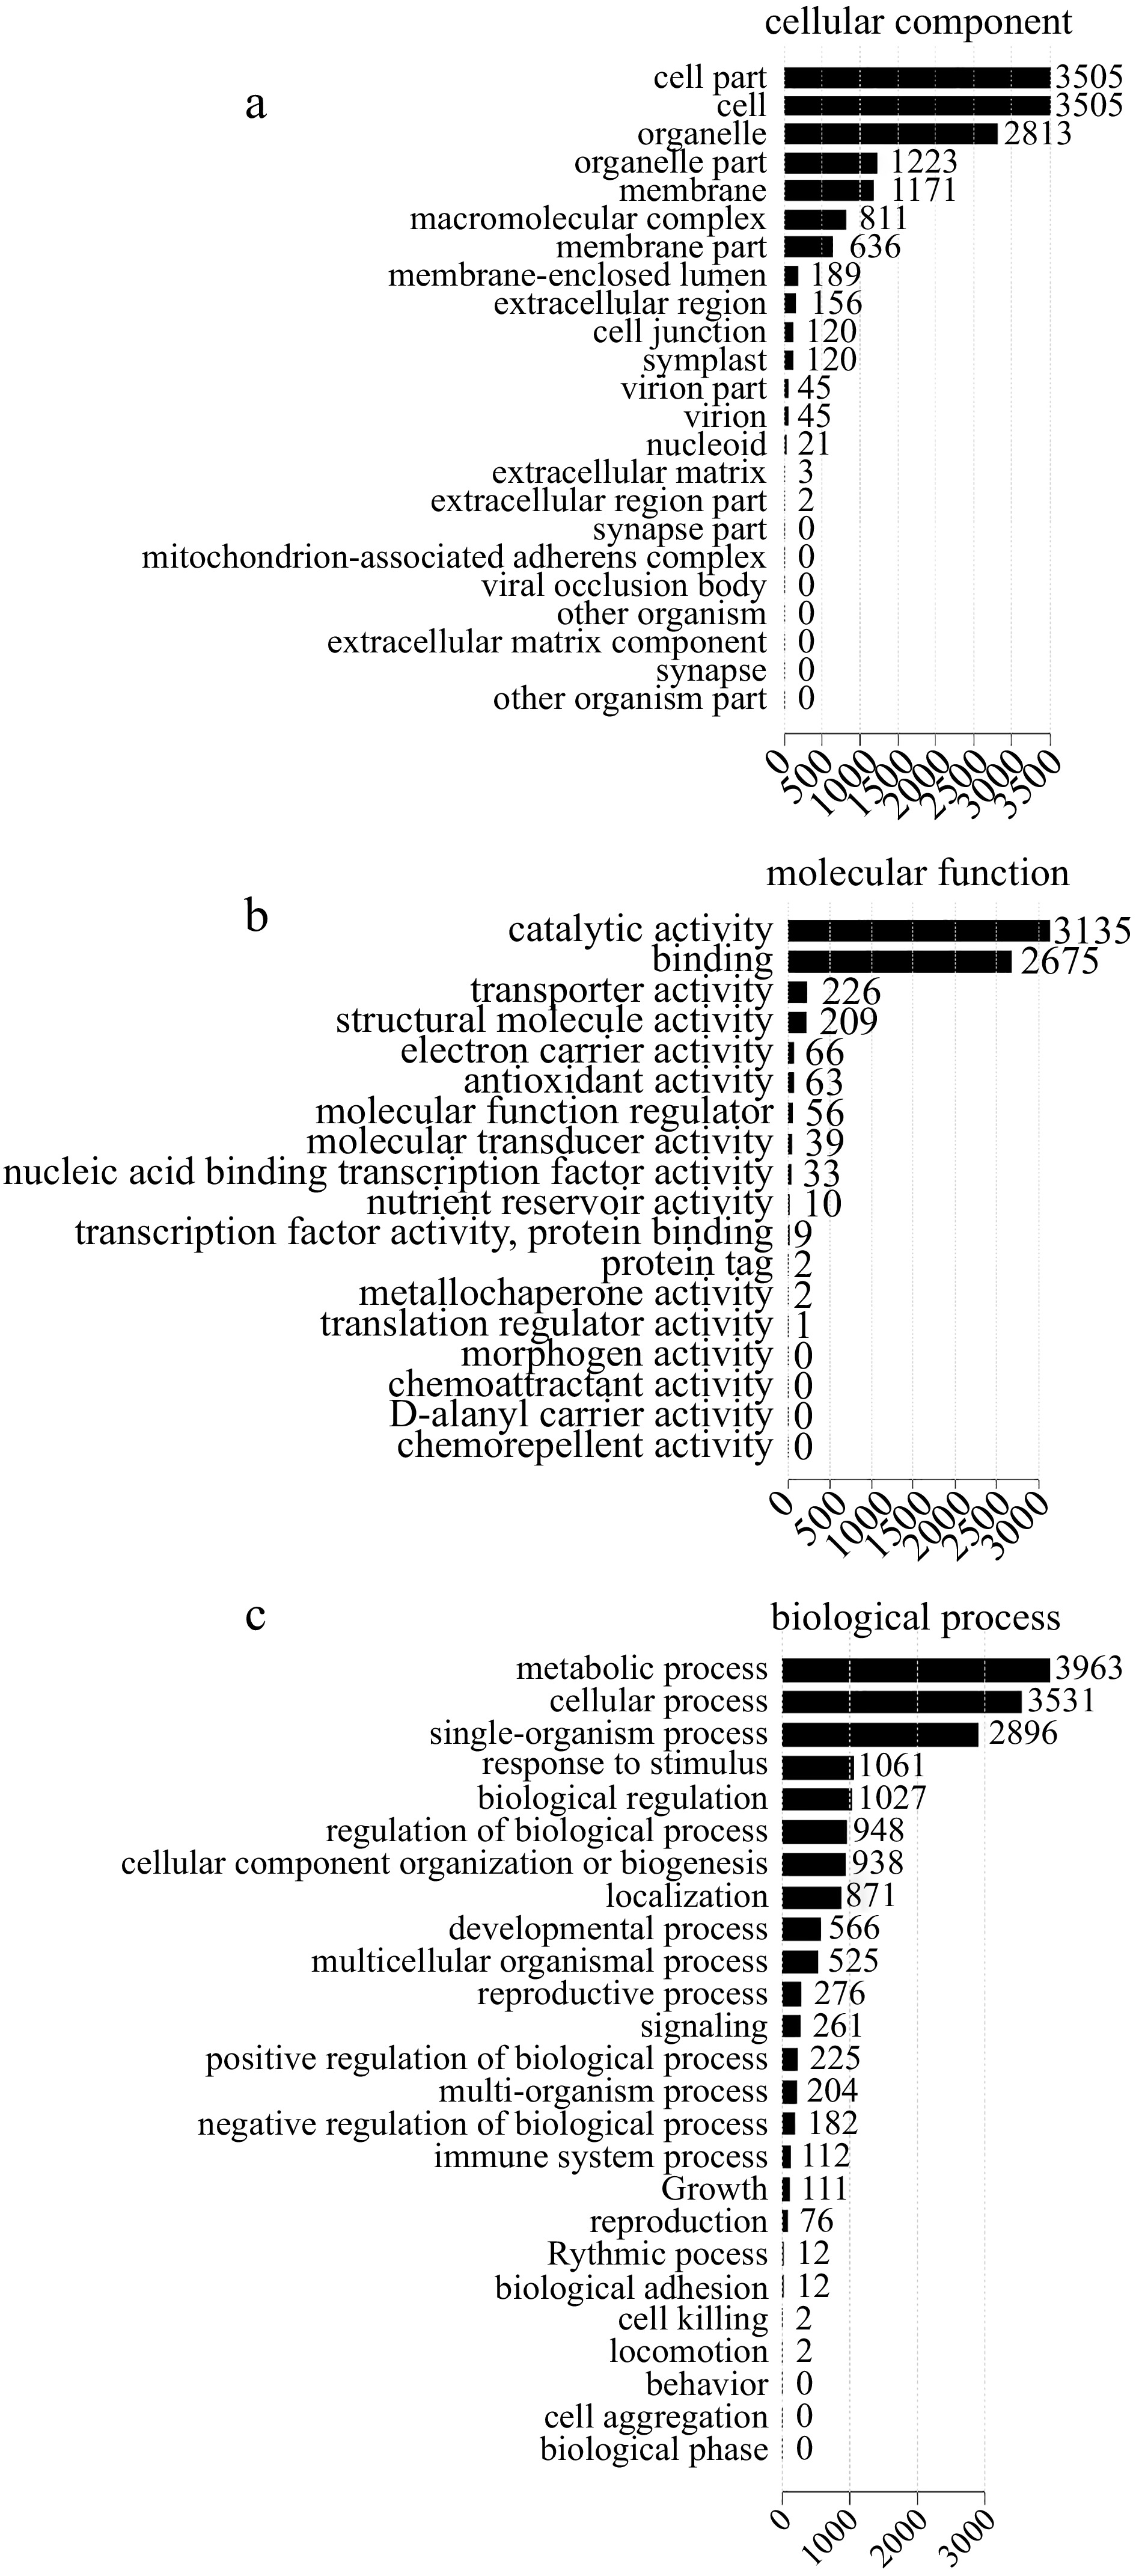
Figure 4.
GO classification of differentially expressed proteins (DEPs). (a) Cellular component. (b) Molecular function. (c) Biological process.
-
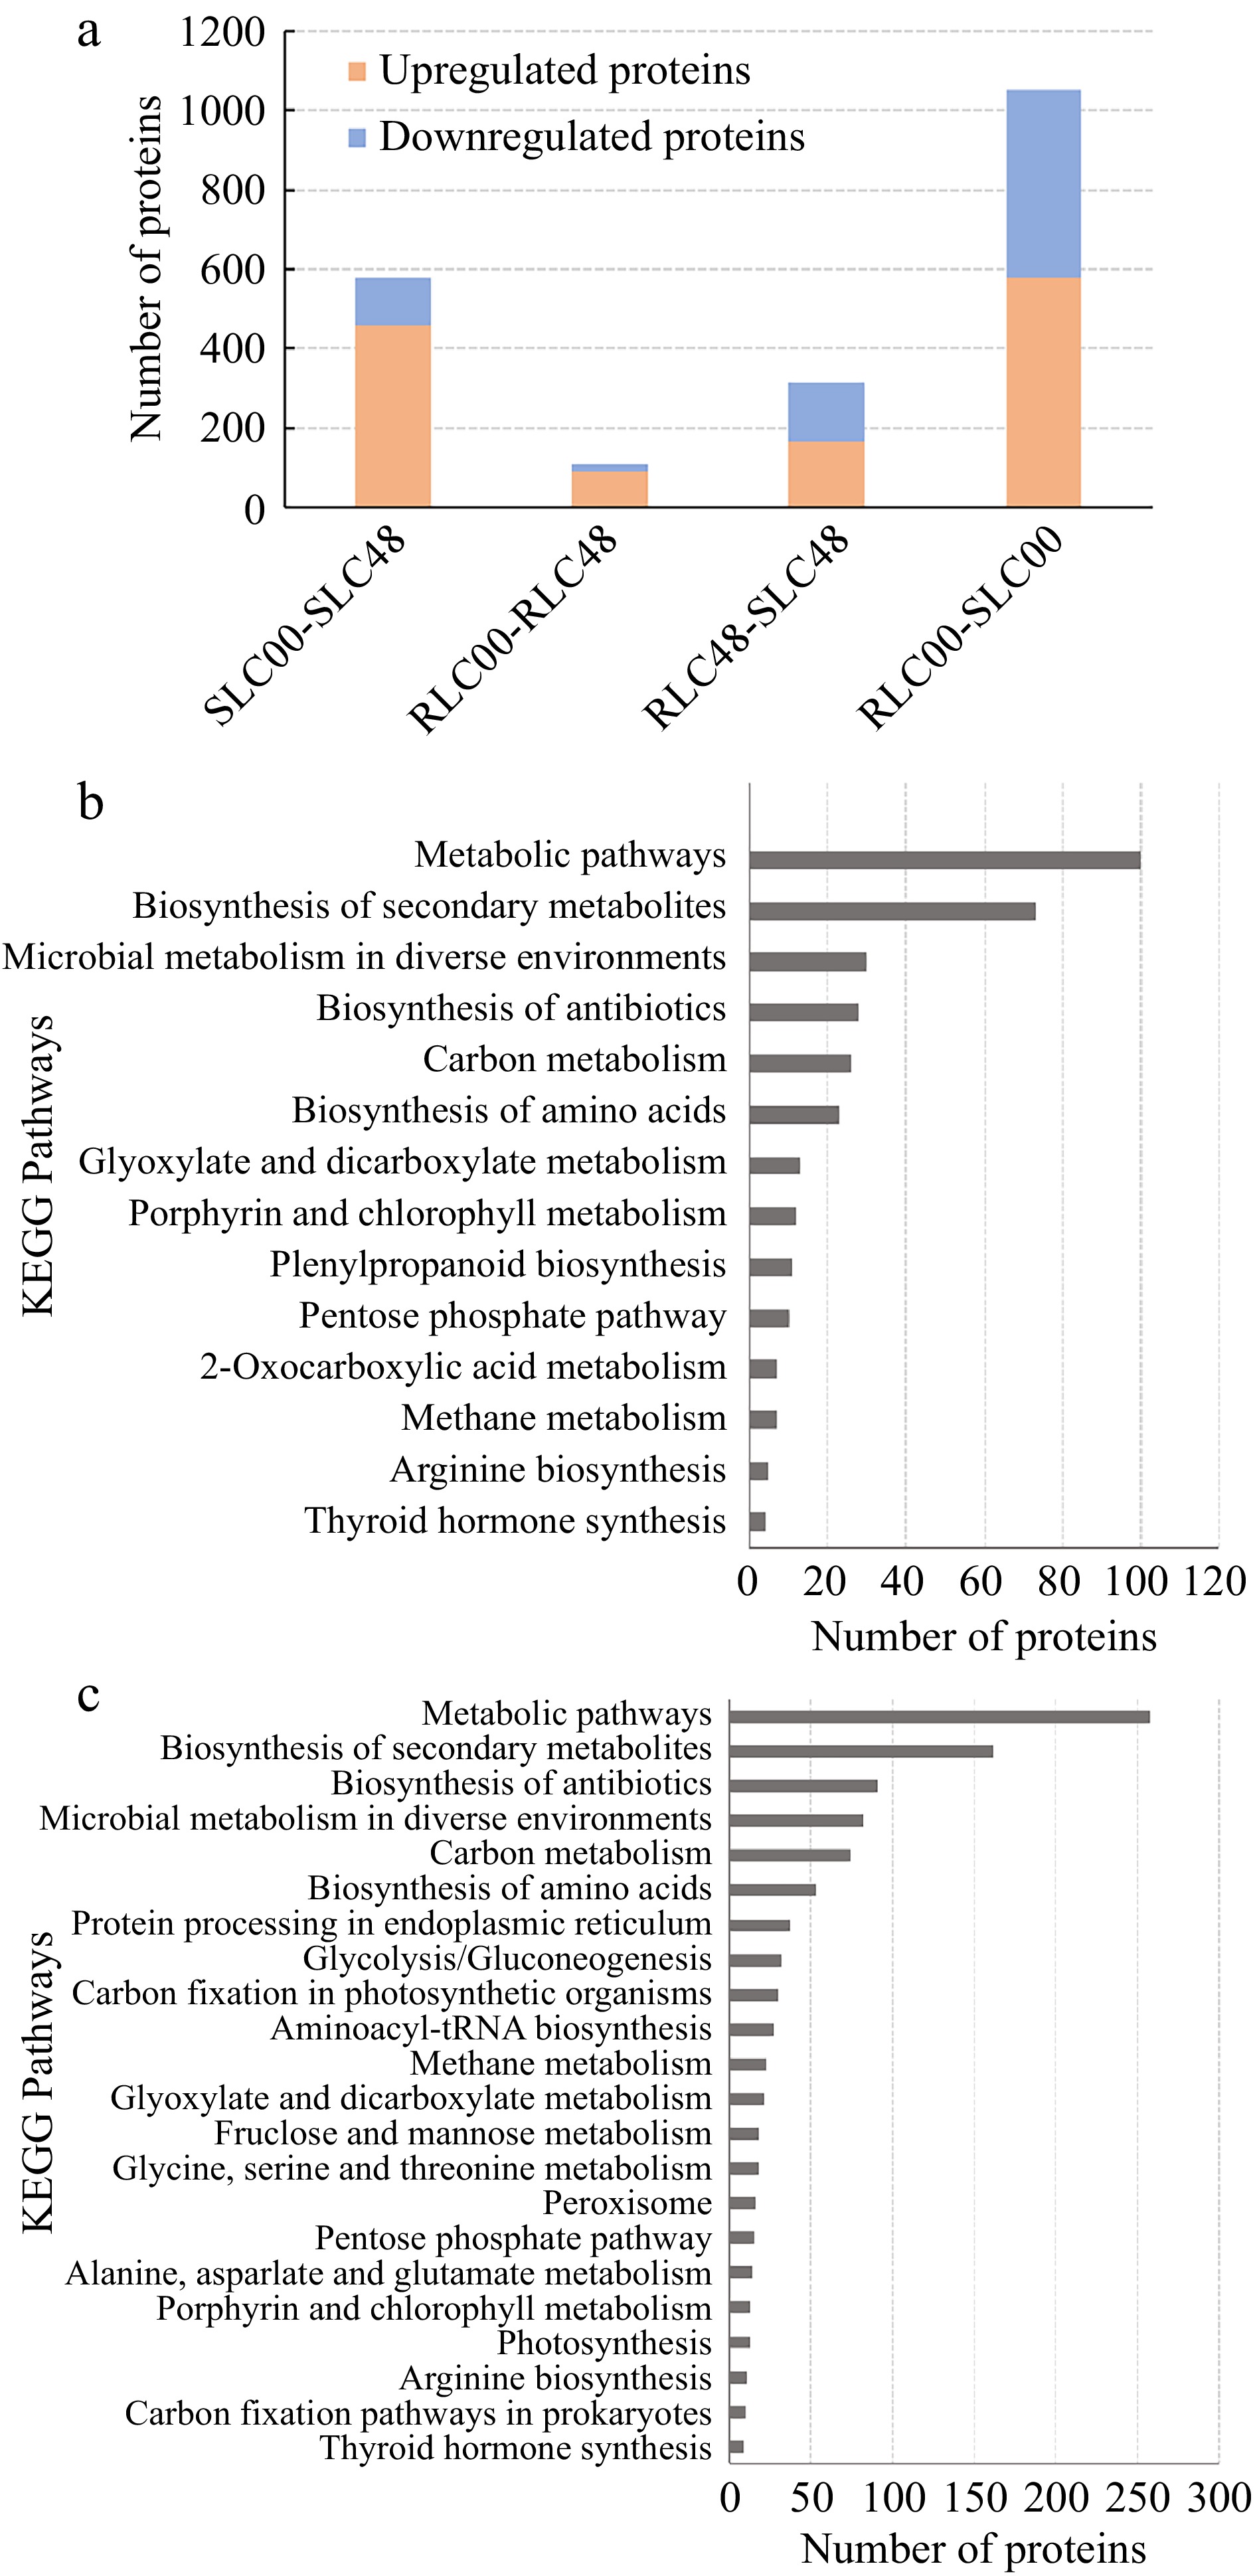
Figure 5.
DEPs identified between different lily samples. (a) numbers of DEPs. (b) Numbers of DEPs. between SLC00 and RLC00 samples. (c) Numbers of DEPs. between SLC48 and RLC48 samples.
-
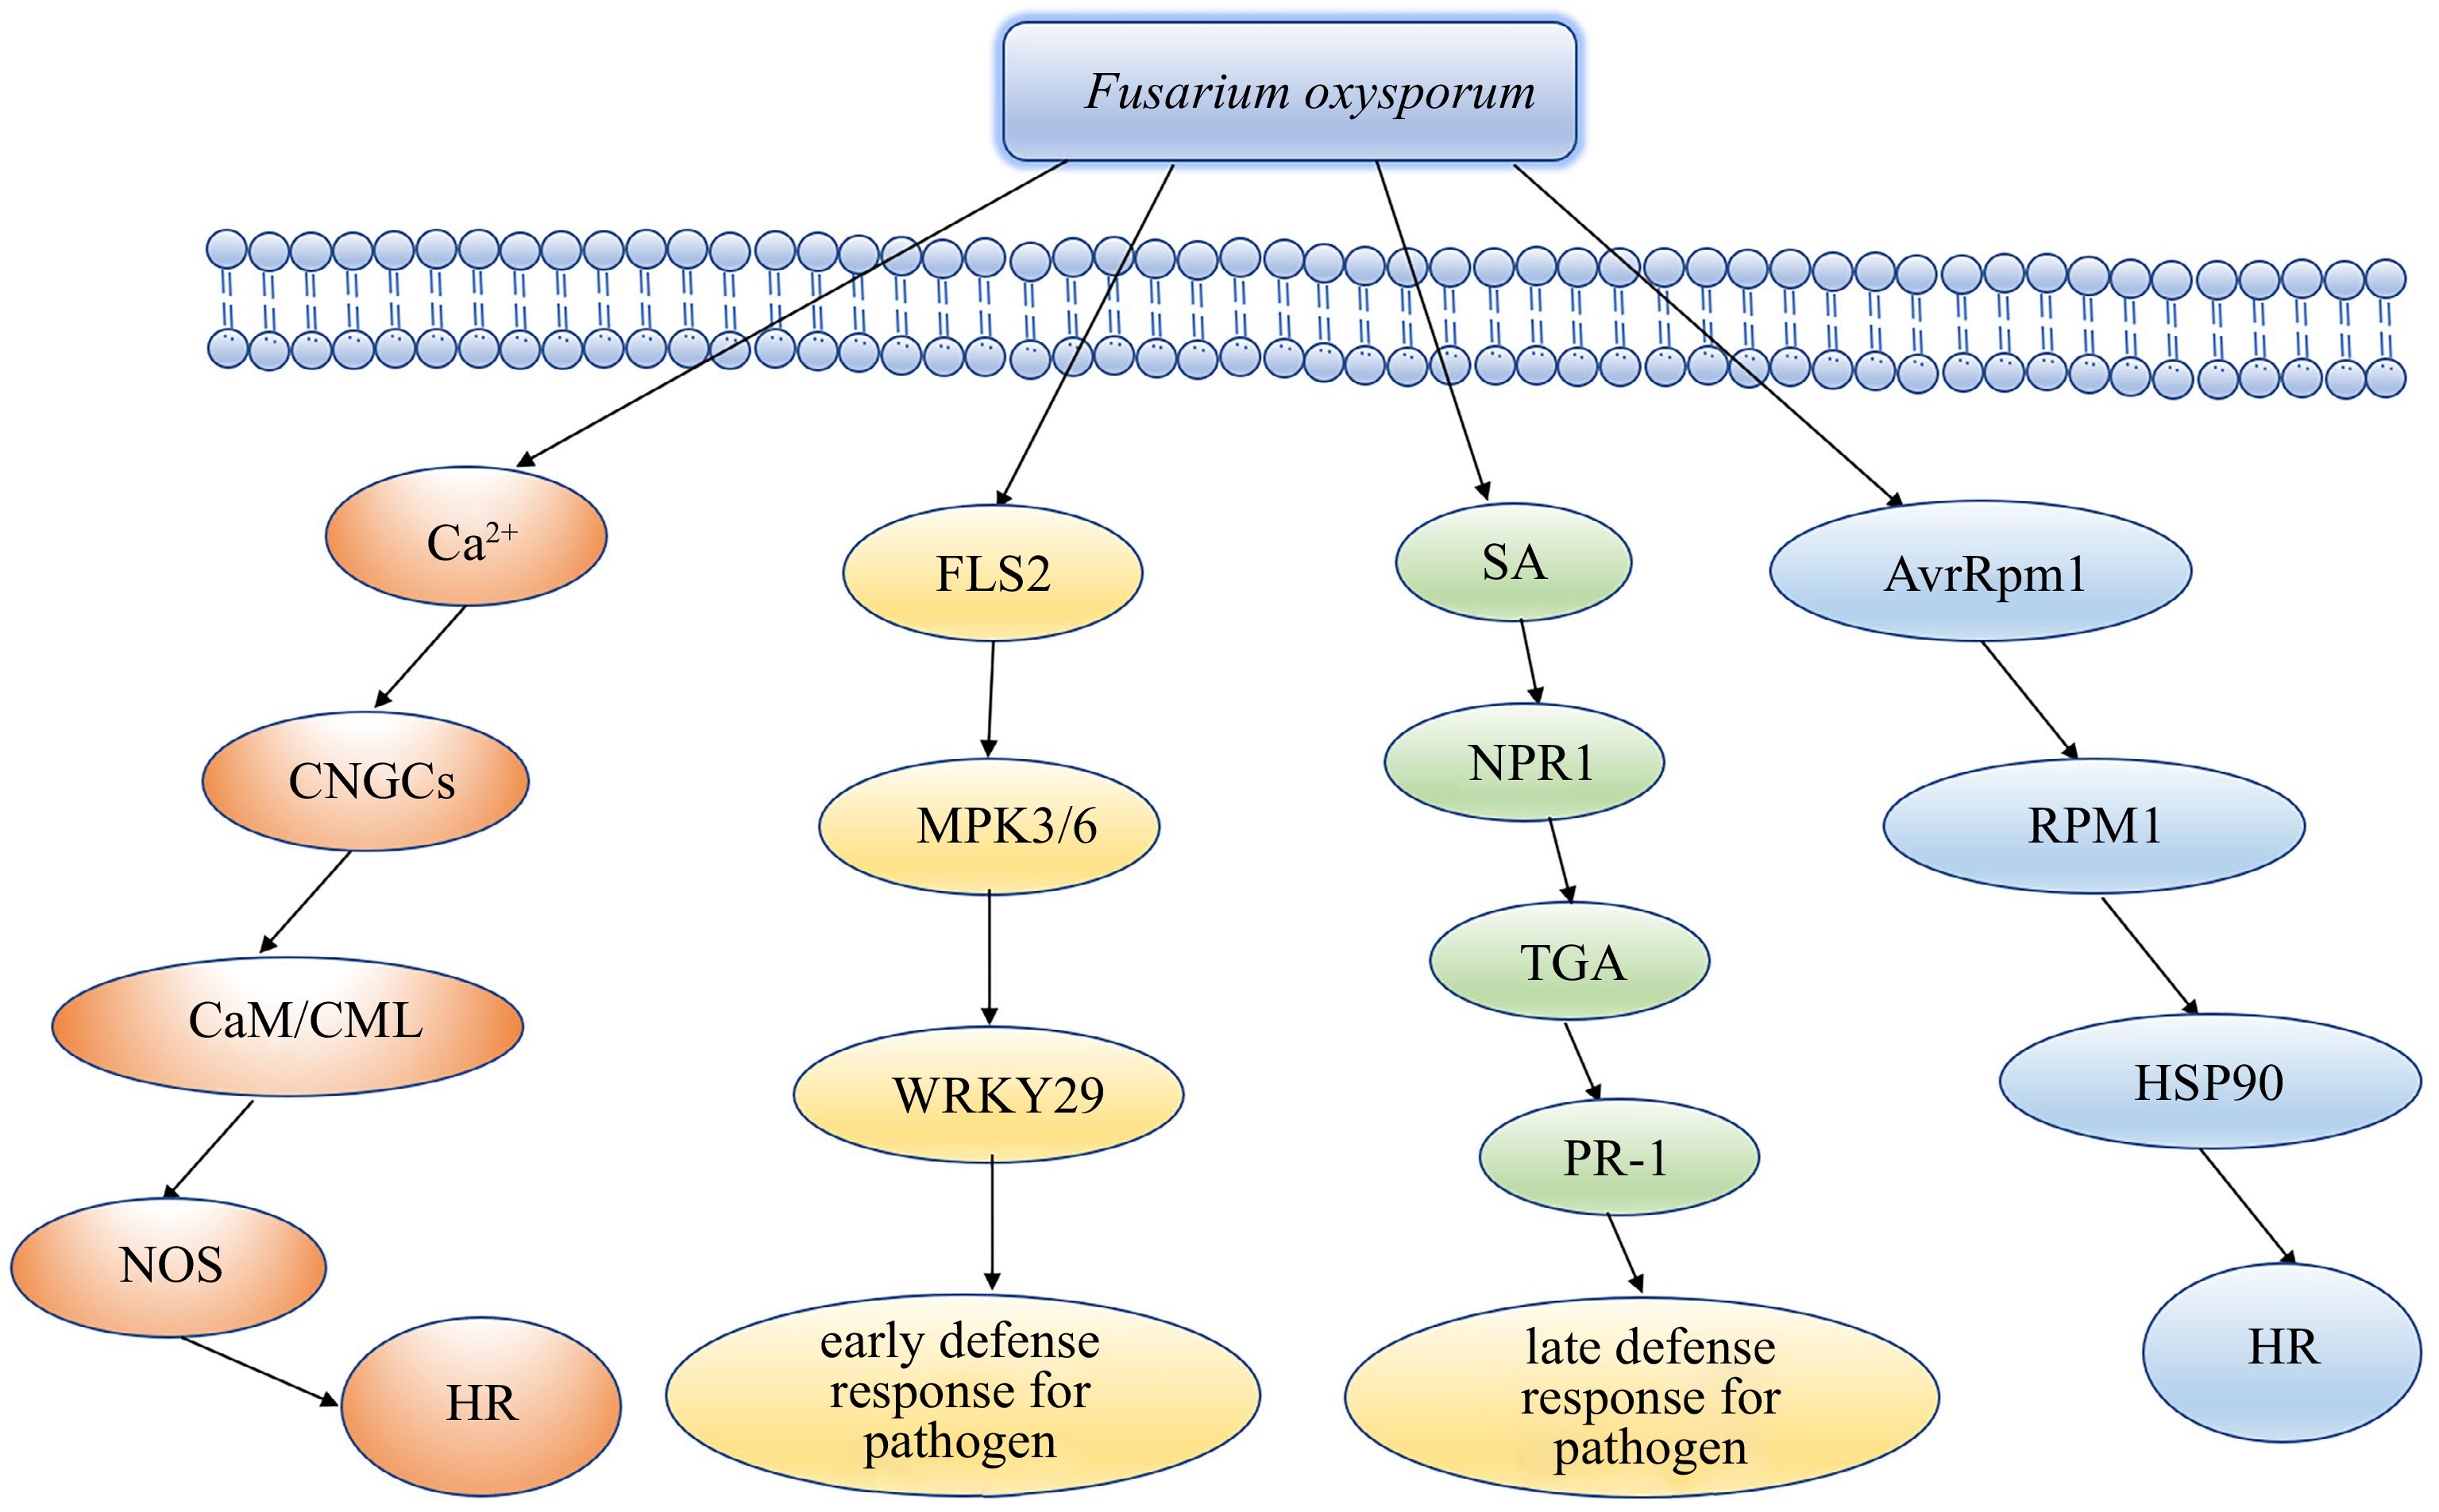
Figure 6.
Hypothetical model of the mechanism of lily resistant clone tolerance to Fusarium oxysporum.
-
RNA-Seq sample Raw- reads Read1-Q20 Read2-Q20 Read1-GC Read2-GC Clean reads Clean-rates RLC-00 34,134,751 0.912 0.970 0.497 0.507 32469458 95.12% RLC24-1 59,345,127 0.965 0.973 0.563 0.552 59227682 99.80% RLC24-2 40,575,087 0.926 0.954 0.519 0.523 40574457 100.00% RLC24-3 35,961,565 0.972 0.968 0.471 0.490 35718139 99.32% RLC48-1 41,690,524 0.953 0.958 0.491 0.502 41509375 99.57% RLC48-2 36,600,145 0.974 0.965 0.500 0.508 34849248 95.22% RLC48-3 36,075,814 0.909 0.962 0.534 0.540 34203976 94.81% SLC-00 34,363,628 0.908 0.962 0.474 0.497 32609673 94.90% SLC24-1 41,369,602 0.952 0.957 0.475 0.498 41203396 99.60% SLC24-2 78,356,000 0.927 0.952 0.492 0.505 78354289 100.00% SLC24-3 31,787,483 0.905 0.963 0.491 0.503 30140824 94.82% SLC48-1 37,014,173 0.943 0.956 0.479 0.499 36919334 99.74% SLC48-2 33,129,082 0.972 0.976 0.475 0.486 32971144 99.52% SLC48-3 33,289,280 0.970 0.970 0.465 0.484 33042165 99.26% Table 1.
Statistics of RNA-seq results of inoculated lily clones.
-
KEGG DEGs of group SLC-00 vs SLC-48 RLC-00 vs RLC-48 RLC-48 vs SLC-48 RLC-00 vs SLC-00 Cysteine and methionine metabolism 9 16 6 Glycine, serine and threonine metabolism 3 1 16 6 Arginine biosynthesis 2 11 5 Alanine, aspartate and glutamate metabolism 7 1 14 5 Peroxisome 8 1 15 6 Tyrosine metabolism 1 1 4 Phenylalanine metabolism 1 1 5 4 Phenylalanine, tyrosine and tryptophan biosynthesis 1 1 4 2 Valine, leucine and isoleucine biosynthesis 2 3 2 PPAR signaling pathway 5 5 2 Tryptophan metabolism 3 3 3 Arginine and proline metabolism 3 6 2 Apoptosis 2 1 1 AMPK signaling pathway 5 1 7 1 Plant hormone signal transduction 2 1 Lysine biosynthesis 2 2 1 Valine, leucine and isoleucine degradation 2 1 8 1 Plant-pathogen interaction 9 1 10 3 MAPK signaling pathway - yeast 4 4 2 Endocytosis 12 1 15 1 Calcium signaling pathway 3 3 Pathogenic Escherichia coli infection 3 1 Cutin, suberine and wax biosynthesis 1 2 Oocyte meiosis 8 1 6 TGF-beta signaling pathway 2 1 2 Endocrine and other factor-regulated calcium reabsorption 6 5 cGMP-PKG signaling pathway 3 2 Ubiquitin mediated proteolysis 7 1 8 Protein processing in endoplasmic reticulum 19 3 26 9 alpha-Linolenic acid metabolism 8 1 6 3 Table 2.
DEGs of KEGG in different groups.
Figures
(6)
Tables
(2)