


-
Lily (Lilium spp.) is a floricultural crop with great ornamental value, playing a vital role in global flower markets. Lily basal bulb rot, caused by the soil-borne fungal pathogen Fusarium oxysporum f. sp. Lilii, is one of the most severe diseases of lily plants worldwide[1]. Chemical pesticide control is one of the main methods to prevent and control this disease whereas the cultivation of Fusarium resistant varieties is more economical and effective as shown by numerous field practices. The resistant cultivar, such as oriental lily hybrid 'Casa Blanca', has been achieved by screening lily clones with the toxin of F. oxysporum[2]. However, the mechanism underlying F. oxysporum f. sp. lilii resistance of the resistant clones remains unknown.
Plants recognize F. oxysporum infection by detecting endogenous signals originating from the cell wall[3,4]. Disease-resistant enzymes, cell wall proteins, pathogenesis-related (PR) proteins and phytoalexin biosynthetic enzymes play a key role in pathogen defense in host plants[5−8]. Pathogen/microbe-associated molecular patterns (PAMPs/MAMPs) released from the microbial surface can bind to pattern recognition receptors (PRRs) present in plant cells and activate them[9,10]. Plants also employ chemical defense pathways to resist pathogen infection. For example, melon plants induce genes encoding chitinases (CHIs), β-1,3-glucanases, thaumatin-like proteins and peroxidases (PODs) upon the infection of F. oxysporum[4]. Phytohormones such as salicylic acid (SA) and jasmonic acid (JA), as well as other antioxidants are also induced during the pathogen infection as a defense mechanism[6,11]. In addition to the above factors, sugar was also reported to be involved in the plant disease signaling pathways[12,13].
To date, only limited studies have been published about the F. oxysporum f. sp. Lilii resistance mechanism. A transcriptome study on Lilium regale Wilson with the infection of F. oxysporum revealed that genes encoding PR proteins, signal transduction proteins, antioxidative stress enzymes and secondary metabolism enzymes were involved in the F. oxysporum response[14]. Further study of L. regale identified a novel basic leucine-zipper (bZIP) transcription factor LrbZIP1, which could be important for F. oxysporum resistance in L. regale as the transgenic tobacco plants overexpressing LrbZIP1 showed increased resistance to F. oxysporum[15]. Besides, PR10 family genes related to defense responses to F. oxysporum f. sp. lilii were also identified in L. regale[16].
Transcriptional analysis has been applied to investigate the mechanism underlying plant disease-resistance[17−19]. The iTRAQ technology enables high-throughput analysis of proteins with high sensitivity, providing highly reliable results[20]. Thus, the successful application of RNA-seq and iTRAQ technologies offers a great opportunity to isolate genes responsible for F. oxysporum resistance in lily[21].
In this study, we sequenced six RNA-seq libraries prepared from F. oxysporum resistant and susceptible lily clones sampled at 0, 24 and 48 h post-inoculation (hpi) with F. oxysporum by the Illumina sequencing platform, and analyzed four proteome libraries of these clones sampled at 0 and 48 hpi using ITRAQ technology. Additionally, qRT-PCR was used to verify the RNA-seq data and to evaluate the transcriptional variation between the lily resistant and susceptible clones. The results of this study reinforce the understanding of lily molecular mechanism resistance to F. oxysporum.
-
Lily resistant and susceptible clones were obtained by screening oriental lily hybrid 'Casa Blanca' with the toxin of F. oxysporum. The resistant and susceptible clones were grown in the same culture chamber at 25 °C with the 14 h light/10 h dark photoperiod and robust tissue culture rooted seedlings were selected for further analysis; rooted seedlings are 8 cm high, with a root length of 5 cm.
Cultivation and inoculation of Fusarium oxysporum f. sp. lilii
-
Fusarium oxysporum f. sp. lilii was isolated from the infected lily. The isolated pathogen was purified and identified according to the spore and mycelium morphology. The verified strain was then cultured iteratively using potato sucrose liquid medium every 15 d on a shaker (25 °C, 100 rpm). The cultured spores were filtered by gauze and resuspended, then diluted to a final concentration at approximately 1.0 × 10⁶ spores mL−1 by microscopic count. The root tips of in vitro lily clones were cut off 2 cm and inoculated by the spore suspension. The inoculated clones were then transferred to climate chambers at 25 °C with the 14 h light/10 h dark photoperiod.
Sample collection
-
Based on our previous results[1], plant samples were collected from regions surrounding the inoculation spots at 0, 24 and 48 hpi for transcriptomic analysis and at 0 and 48 hpi for proteomic analysis. Three independent biological replicates were assayed at 24 and 48 hpi. Total RNA was extracted with Trizol and was treated with DNase. The quality of total RNA was identified by 2100 Bioanalyzer. Library construction and sequencing was carried out in accordance with Hao et al.[22]
RNA-seq data analysis and de novo assembly
-
Raw sequence reads were removed to obtain clean reads. Then, de novo transcriptome assembly was carried out[23]. RNA-Seq by RSEM software was used to analyze the gene expression level[24,25].
Functional annotation of unigenes
-
The identified unigene sequences were aligned and annotated using the following databases (E-value ≤ 10−5): NCBI nonredundant protein sequences, NCBI nucleotide sequences, Swiss-Prot[26], Gene Ontology[27], Kyoto Encyclopedia of Genes and Genomes[28], Cluster of Orthologous Groups of proteins and euKaryotic Ortholog Groups[29], Protein family (Pfam).
Analysis of differential expression of Unigenes
-
The Unigene expression level of the samples were compared, and the generalized chi-square test was performed using IDEG6 software, and the P value obtained was corrected by multiple hypothesis test (FDR). Then, the Unigenes whose FDR value is less than 0.01 and the RPKM ratio between samples is more than 2 times as the differentially expressed gene.
Identification of RNA-seq data by qRT-PCR
-
To identify the reliability of RNA-seq data, the expression of nine genes, including five genes upregulated in lily resistant clones and four PR genes (encoding CHI [gi691193462], POD [gi636022329], polyphenol oxidase [PPO; gi767859558] and PAL [gi393793951]) was analyzed by qRT-PCR. The Actin gene was used as an internal control gene. Primers were designed by Primer Premier 5 software (Supplemental Table S1). The qRT-PCR was made by SYBR Premix Ex Taq II according to the following program: initial denaturation at 95 °C for 2 min, followed by 40 cycles of 95 °C for 10 s and 60 °C for 30 s. Relative mRNA levels were calculated by the 2−ΔΔCᴛ method[30].
Protein extraction and iTRAQ labeling
-
Protein extraction was conducted by the trichloroacetic acid (TCA)/acetone method. Protein concentration was determined by the Bradford method[31]. Then, 200 μg of protein solution was accurately absorbed by pipette into the centrifuge tube. Add 4 μl reducing reagent, reaction at 60 °C for 1 h; Add 2 μl cysteine-blocking reagent, room temperature for 10 min; it was then transfered to a 10-K ultrafiltration tube and centrifuged at 12,000 g for 20 min. The 100 μl dissolution buffer in iTRAQ® kit was added and centrifuged at 12,000 g for 20 min. Trypsin was added into the ultrafiltration tube, the volume of 50 μl, 37 °C reaction overnight; The next day, the solution at the bottom of the tube was collected after centrifugation. A total of 100 μl samples were obtained after enzymolysis.
iTRAQ® reagent was taken from the refrigerator, balanced to room temperature, centrifuge the iTRAQ® reagent to the tube bottom; Add 150 μl ethanol to each iTRAQ® reagent, centrifuge it to the bottom of each tube. The 50 μl sample (100 μg enzymolysis product) was transferred to a new centrifuge tube with a pipette. The iTRAQ® reagent was added to the sample, vortexed, and centrifuge to the bottom of the tube, at room temperature for 2 h. The reaction was terminated by adding 100 μl water. The mixed labeled samples were centrifuged to the bottom of the tube; Vacuum freezing and centrifugal drying; The drained samples are preserved under frozen conditions for later use.
High pH reverse-phased chromatography
-
High pH separation was performed according to the method of Zhang et al.[32]
Protein analysis by Eksigent Nano LC upgraded REVERSE phase chromatography -TripleTOFTM 5600
-
The peptides were resuspended and protein analysis was carried out according to the method by Tatusov et al.[31]
Proteomics data analysis
-
ProteinPilot4.5 software (AB SCIEX, Foster City, California, USA) was used for protein identification and quantitative analysis. The database was downloaded from the NCBI website. Paragon algorithm was used for database retrieval. Proteinpilot software was used to carry out FDR analysis, and protein ratios and P values are calculated automatically by Proteinpilot software.
Bioinformatics analysis
-
Enrichment analysis of the GO functional classification of differentially expressed proteins (DEPs) was mainly conducted according to the enrichment analysis of the GO functional classification of the transcriptome. Statistical analysis of the GO primary functions of all proteins with a GO number was performed. KEGG pathway enrichment analysis of the DEPs was conducted according to the results of the Lilium transcriptome.
-
RNA-seq analysis of 14 samples including resistant lily clone (RLC) and susceptible lily clone (SLC) collected at 0 hpi, referred to as RLC-00 and SLC-00, RLC and SLC samples collected at 24 and 48 hpi (three biological repeats for every set), referred to as RLC-24, RLC-48, SLC-24 and SLC-48, yielded 573,692,261 raw reads, 284,383,013 reads from RLC profiles and 289,309,248 reads from SLC profiles, contributing to 563,793,160 clean reads after filtration in total. GC content of all the profiles was approximately 50%. The percentage of reads conformed to Q20 was over 90% for all profiles whereas the clean rates of the reads were no less than 94%, indicating the RNA-seq libraries had good qualities suitable for further analyses (Table 1).
Table 1. Statistics of RNA-seq results of inoculated lily clones.
RNA-Seq sample Raw- reads Read1-Q20 Read2-Q20 Read1-GC Read2-GC Clean reads Clean-rates RLC-00 34,134,751 0.912 0.970 0.497 0.507 32469458 95.12% RLC24-1 59,345,127 0.965 0.973 0.563 0.552 59227682 99.80% RLC24-2 40,575,087 0.926 0.954 0.519 0.523 40574457 100.00% RLC24-3 35,961,565 0.972 0.968 0.471 0.490 35718139 99.32% RLC48-1 41,690,524 0.953 0.958 0.491 0.502 41509375 99.57% RLC48-2 36,600,145 0.974 0.965 0.500 0.508 34849248 95.22% RLC48-3 36,075,814 0.909 0.962 0.534 0.540 34203976 94.81% SLC-00 34,363,628 0.908 0.962 0.474 0.497 32609673 94.90% SLC24-1 41,369,602 0.952 0.957 0.475 0.498 41203396 99.60% SLC24-2 78,356,000 0.927 0.952 0.492 0.505 78354289 100.00% SLC24-3 31,787,483 0.905 0.963 0.491 0.503 30140824 94.82% SLC48-1 37,014,173 0.943 0.956 0.479 0.499 36919334 99.74% SLC48-2 33,129,082 0.972 0.976 0.475 0.486 32971144 99.52% SLC48-3 33,289,280 0.970 0.970 0.465 0.484 33042165 99.26% Identification of DEGs among different profiles of RLC and SLC
-
To further investigate putative genes associated with F. oxysporum response, the DEGs between different profiles were analyzed. 1,679 genes were differentially expressed between RLC-00 and SLC-00 profiles, with 962 upregulated and 717 downregulated. There were 433 genes differentially expressed (260 upregulated and 173 downregulated) between RLC-00 and RLC-24 profiles whereas the number of DEGs was 550 (465 upregulated and 85 downregulated) between SLC-00 and SLC-24. The largest number of DEGs, 4,051 (2,035 upregulated and 2,016 downregulated) was presented between profiles RLC-48 and SLC-48 while the numbers of DEGs were 799 (558 upregulated and 211 downregulated) between profiles SLC-00 and SLC-48. Interestingly, the DEGs between profiles RLC-00 and RLC-48 were limited to 155 (89 upregulated and 66 downregulated) (Fig. 1).
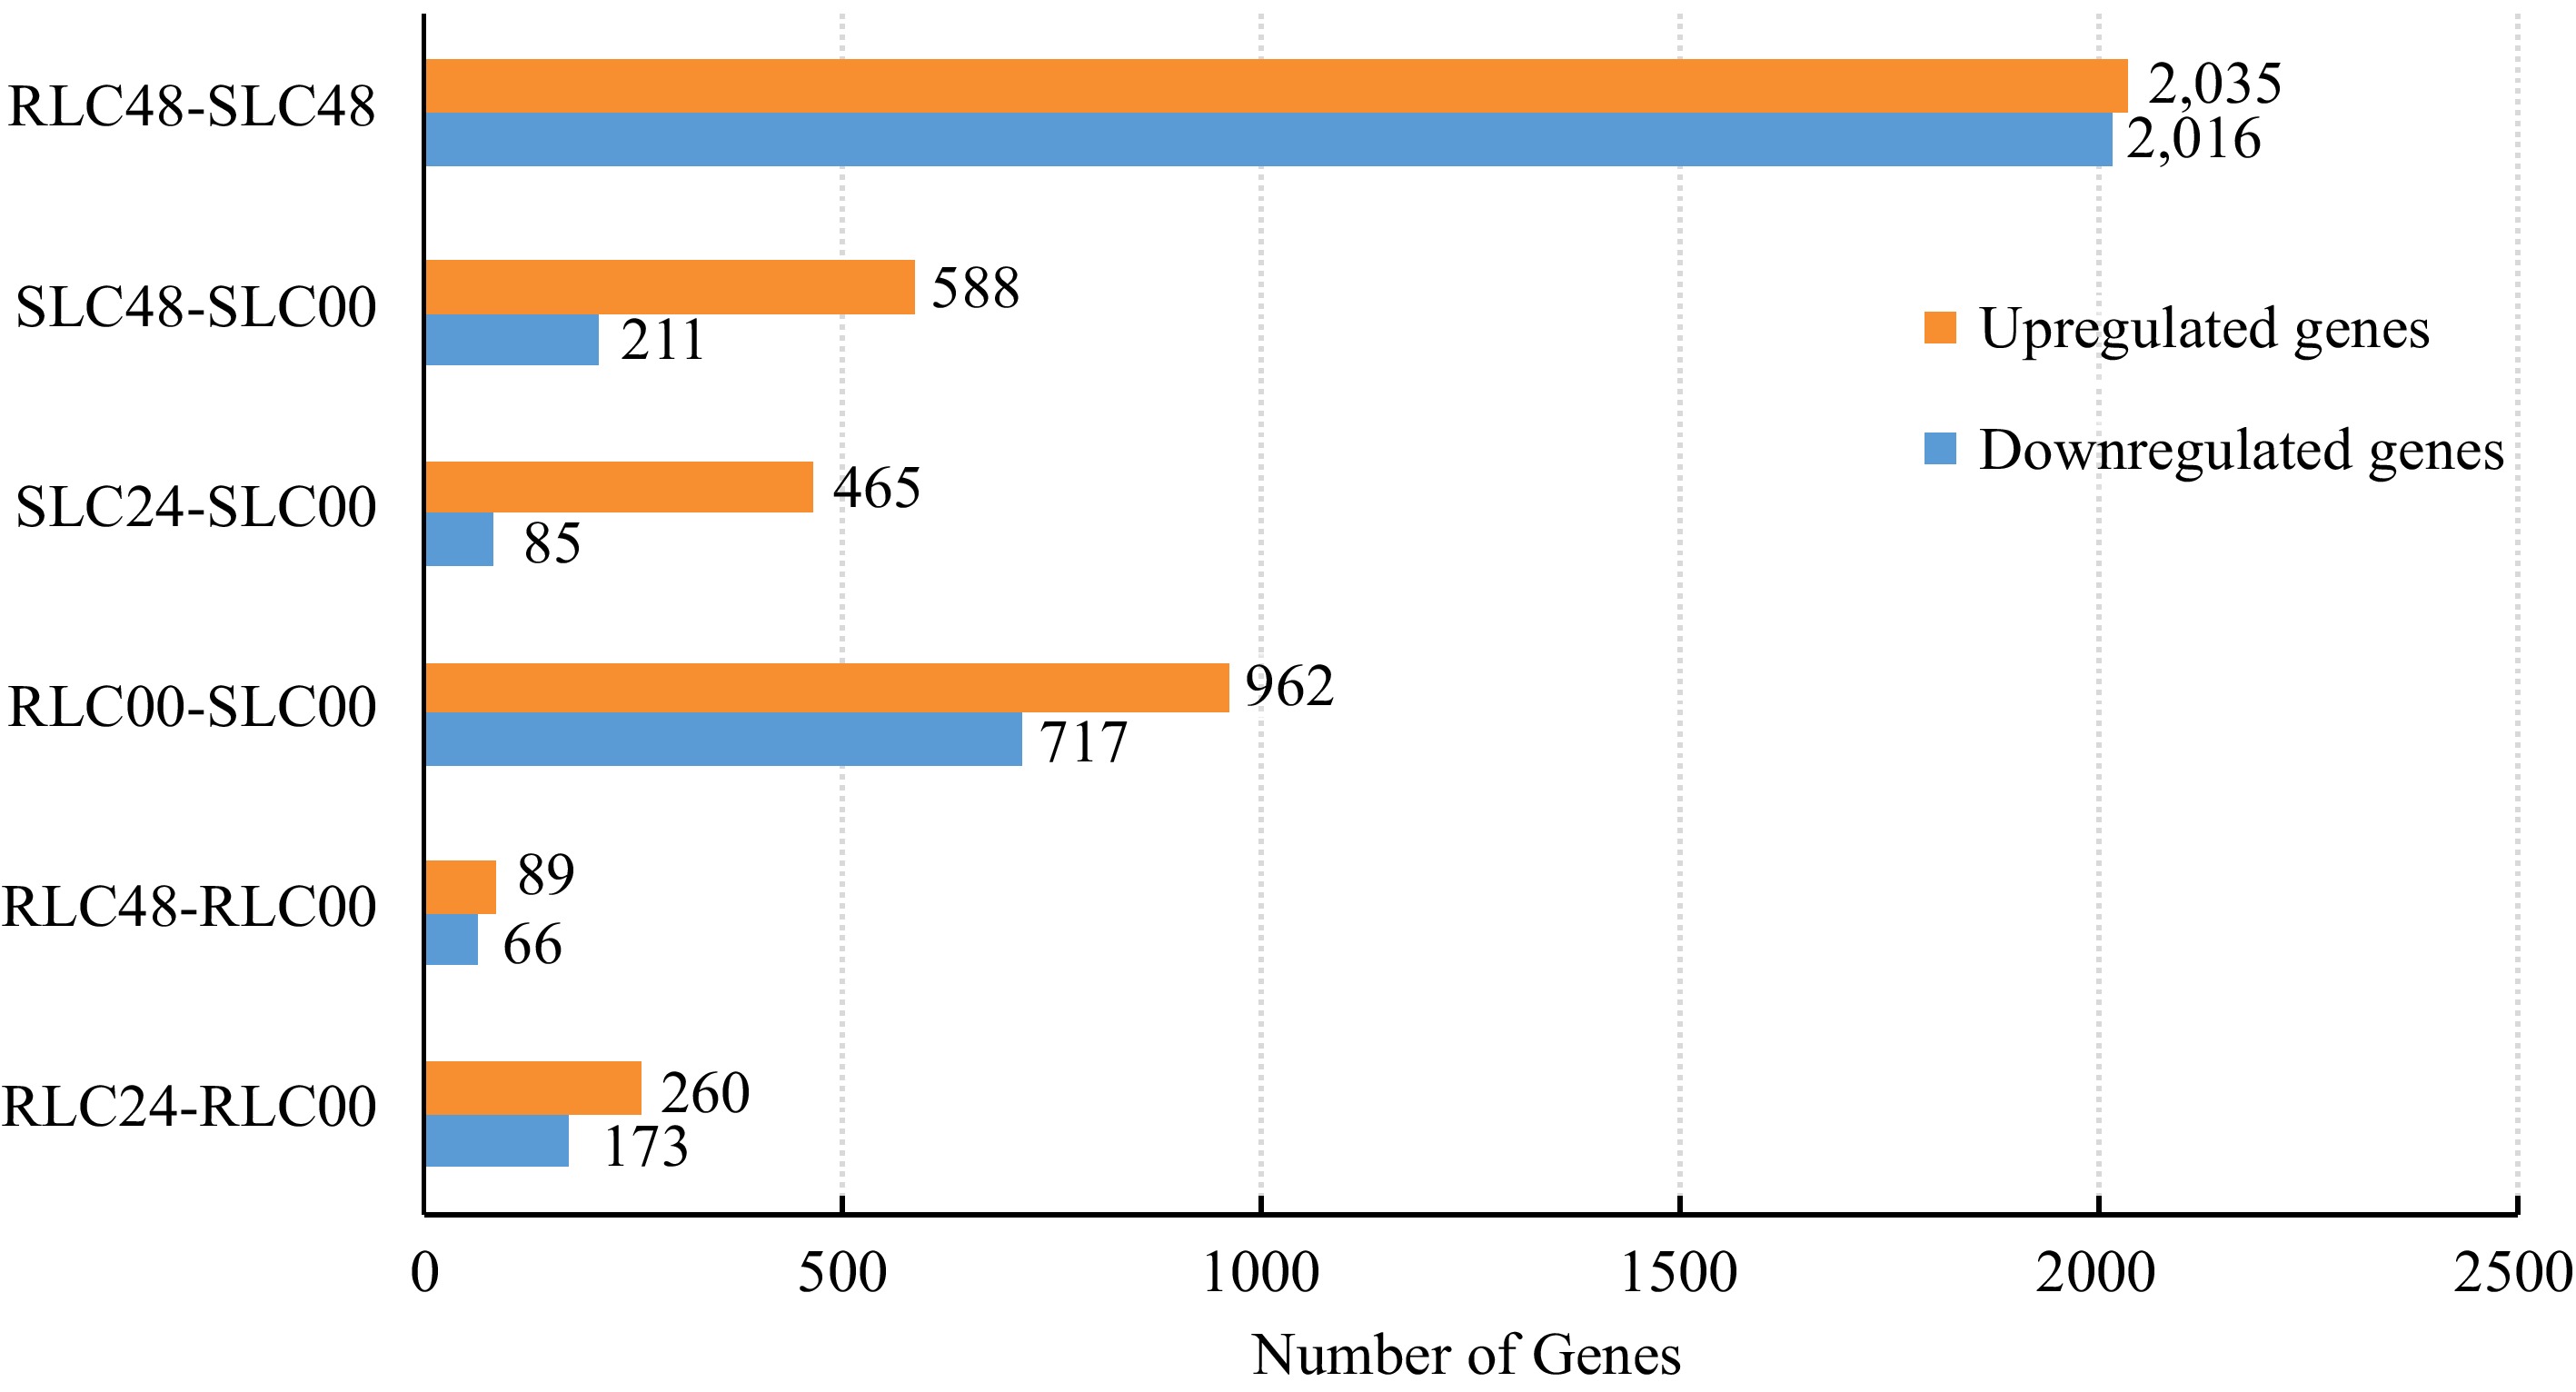
Figure 1.
DEGs identified between different resistant and susceptible lily clones.
GO and KEGG enrichment analysis of DEGs
-
The huge variations in the number of DEGs between different samples implied diverse defense responses upon F. oxysporum infection, leading us to a further investigation of the putative biological functions of the identified DEGs. Those DEGs could be summarized into three major functional categories by GO annotation, meaning 'biological process', 'molecular function' and 'cellular component'. The top three subcategories in profile RLC-00 vs RLC-24 were 'DNA binding', 'monooxygenase activity' belonging to 'molecular function', and 'cell wall' belonging to 'cellular component'. Similarly, 'DNA binding' and 'cell wall' ranked in the top two subcategories in profile RLC-00 vs RLC-48, and the third subcategory was 'sequence-specific DNA binding'. Differing from RLC samples, the top three subcategories in the profile SLC-00 vs SLC-24 were 'chloroplast', 'oxidoreductase activity' and translation whereas 'structure constituent of ribosome', 'translation' and 'ribosome' were the top three in profile SLC-00 vs SLC-48. The top three subcategories in profile RLC-48 vs SLC-48 were 'cytoplasmic membrane-bounded vesicle', 'oxidoreductase activity' and 'carbohydrate metabolic process' (Supplemental Fig. S1).
Pathways involved in plant disease-resistant were revealed by KEGG pathway analysis, including 'plant hormone signal transduction', 'cutin, suberine and wax biosynthesis', 'phenylpropanoid biosynthesis' and 'phenylalanine metabolism'. Interestingly, the 'plant-pathogen interaction' pathway was ranked first both in the profile RLC-00 vs RLC-24 and profile RLC-00 vs RLC-48 whereas this pathway was absent in SLC samples (Fig. 2a& b). The expression patterns of genes involved in this pathway were illustrated in FPKM heat map (Fig. 2c). Most of the genes were upregulated in the RLC-24 samples but remained unchanged in SLC samples, indicating that genes involved in this pathway could contribute to the resistant capacity of RLC. DEGs of KEGG was showed in RLC-00 vs RLC-48, SLC-00 vs SLC-48, RLC-00 vs SLC-00, RLC-48 vs SLC-48 (Table 2). Cysteine and methionine metabolism, protein processing in endoplasmic reticulum, ubiquitin mediated proteolysis, alpha-Linolenic acid metabolism, phenylalanine metabolism were key process in ET, SA, JA signal transduction, there were 16, 26, 8, 6, 5 DEGs respectively in the RLC-48 vs SLC-48.
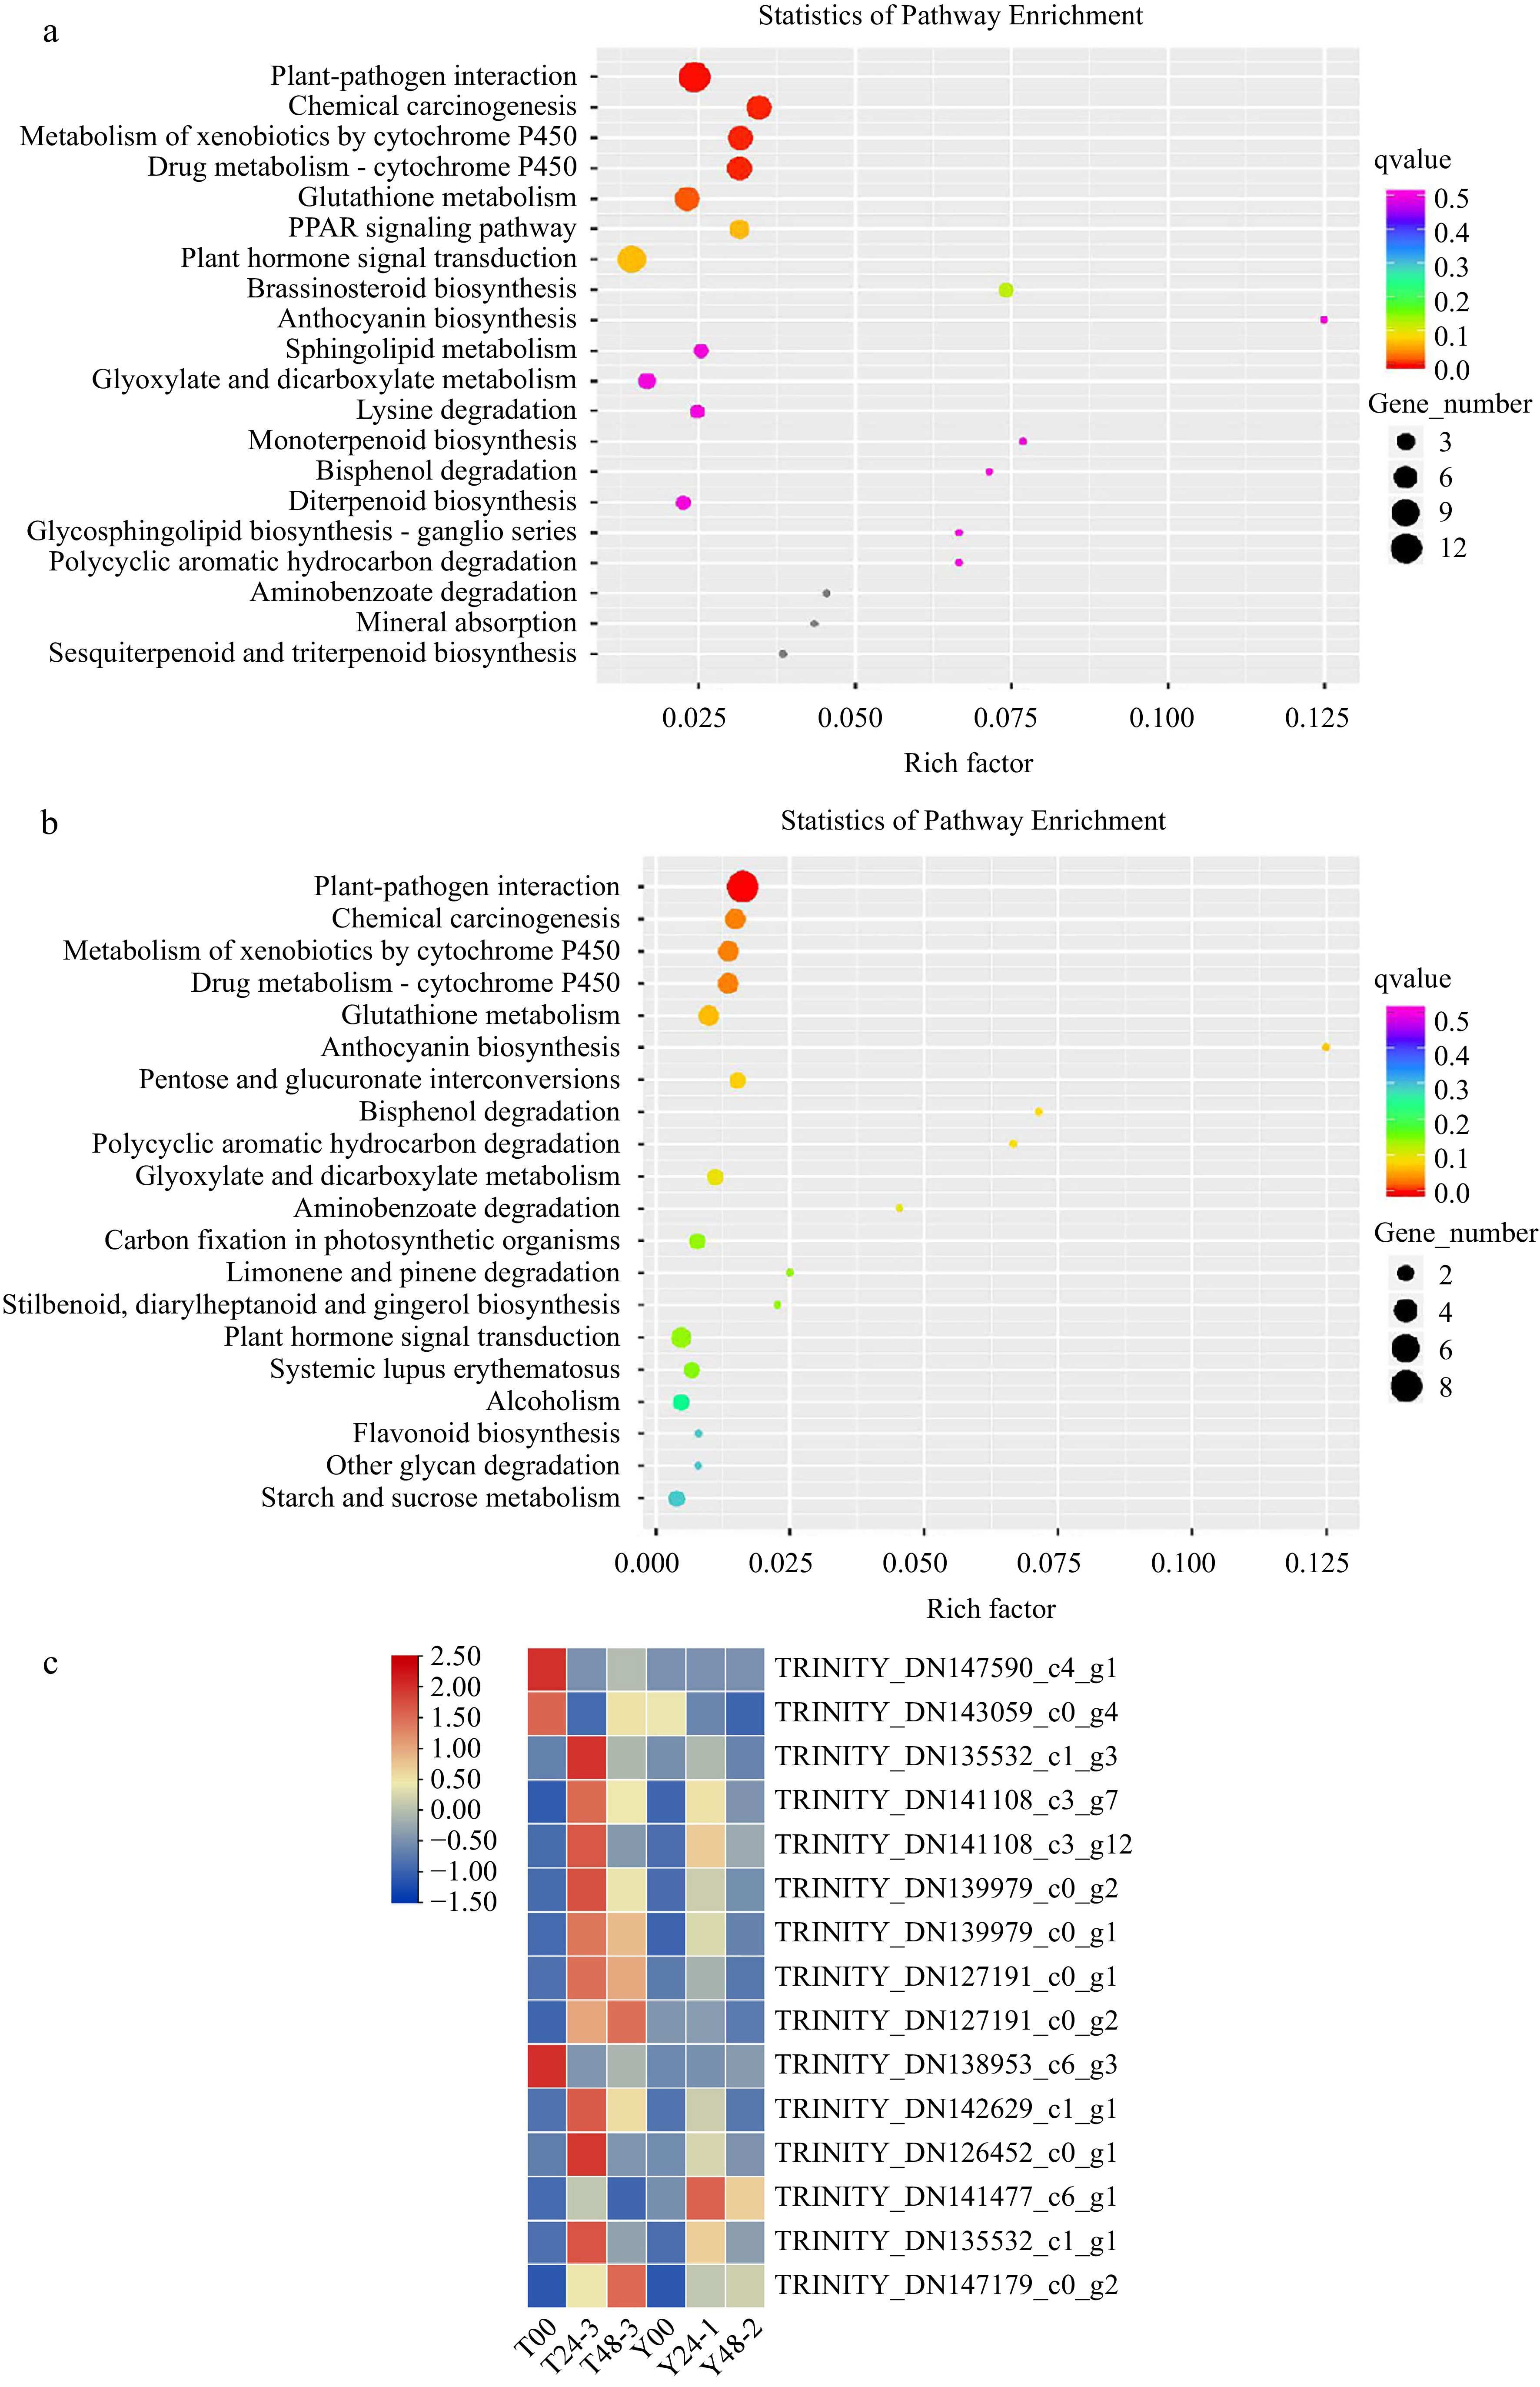
Figure 2.
DEGs isolated from RLC00-RLC24 and RLC00-RLC48 samples were enriched. (a) Gene number were enriched in the profile RLC-00 vs RLC-24; (b) Gene number were enriched in the profile RLC-00 vs RLC-48; (c) DEGs isolated from samples were enriched.
Table 2. DEGs of KEGG in different groups.
KEGG DEGs of group SLC-00 vs SLC-48 RLC-00 vs RLC-48 RLC-48 vs SLC-48 RLC-00 vs SLC-00 Cysteine and methionine metabolism 9 16 6 Glycine, serine and threonine metabolism 3 1 16 6 Arginine biosynthesis 2 11 5 Alanine, aspartate and glutamate metabolism 7 1 14 5 Peroxisome 8 1 15 6 Tyrosine metabolism 1 1 4 Phenylalanine metabolism 1 1 5 4 Phenylalanine, tyrosine and tryptophan biosynthesis 1 1 4 2 Valine, leucine and isoleucine biosynthesis 2 3 2 PPAR signaling pathway 5 5 2 Tryptophan metabolism 3 3 3 Arginine and proline metabolism 3 6 2 Apoptosis 2 1 1 AMPK signaling pathway 5 1 7 1 Plant hormone signal transduction 2 1 Lysine biosynthesis 2 2 1 Valine, leucine and isoleucine degradation 2 1 8 1 Plant-pathogen interaction 9 1 10 3 MAPK signaling pathway - yeast 4 4 2 Endocytosis 12 1 15 1 Calcium signaling pathway 3 3 Pathogenic Escherichia coli infection 3 1 Cutin, suberine and wax biosynthesis 1 2 Oocyte meiosis 8 1 6 TGF-beta signaling pathway 2 1 2 Endocrine and other factor-regulated calcium reabsorption 6 5 cGMP-PKG signaling pathway 3 2 Ubiquitin mediated proteolysis 7 1 8 Protein processing in endoplasmic reticulum 19 3 26 9 alpha-Linolenic acid metabolism 8 1 6 3 Verification of RNA-seq data
-
To verify the RNA-seq data, the expression of nine genes possibly involved in the plant defense system, including NADH dehydrogenase (ubiquinone) activity gene, ATP synthesis coupled electron transport gene, chitin-binding gene, mitochondrial respiratory chain complex I gene, response to salicylic acid gene, PPO, POD, PAL and CHI were detected by qRT-PCR. The qRT-PCR results were consistent with the RNA-seq data (Fig. 3), thus verifying that our RNA-seq data were credible. DN139810, DN144416 and PAL were expressed higher in the RLC than SLC. Notably, the expression of most of the tested genes was upregulated by F. oxysporum inoculation in RLC after 24 h rather than in SLC, implying that those genes were possibly associated with the resistance of RLC.
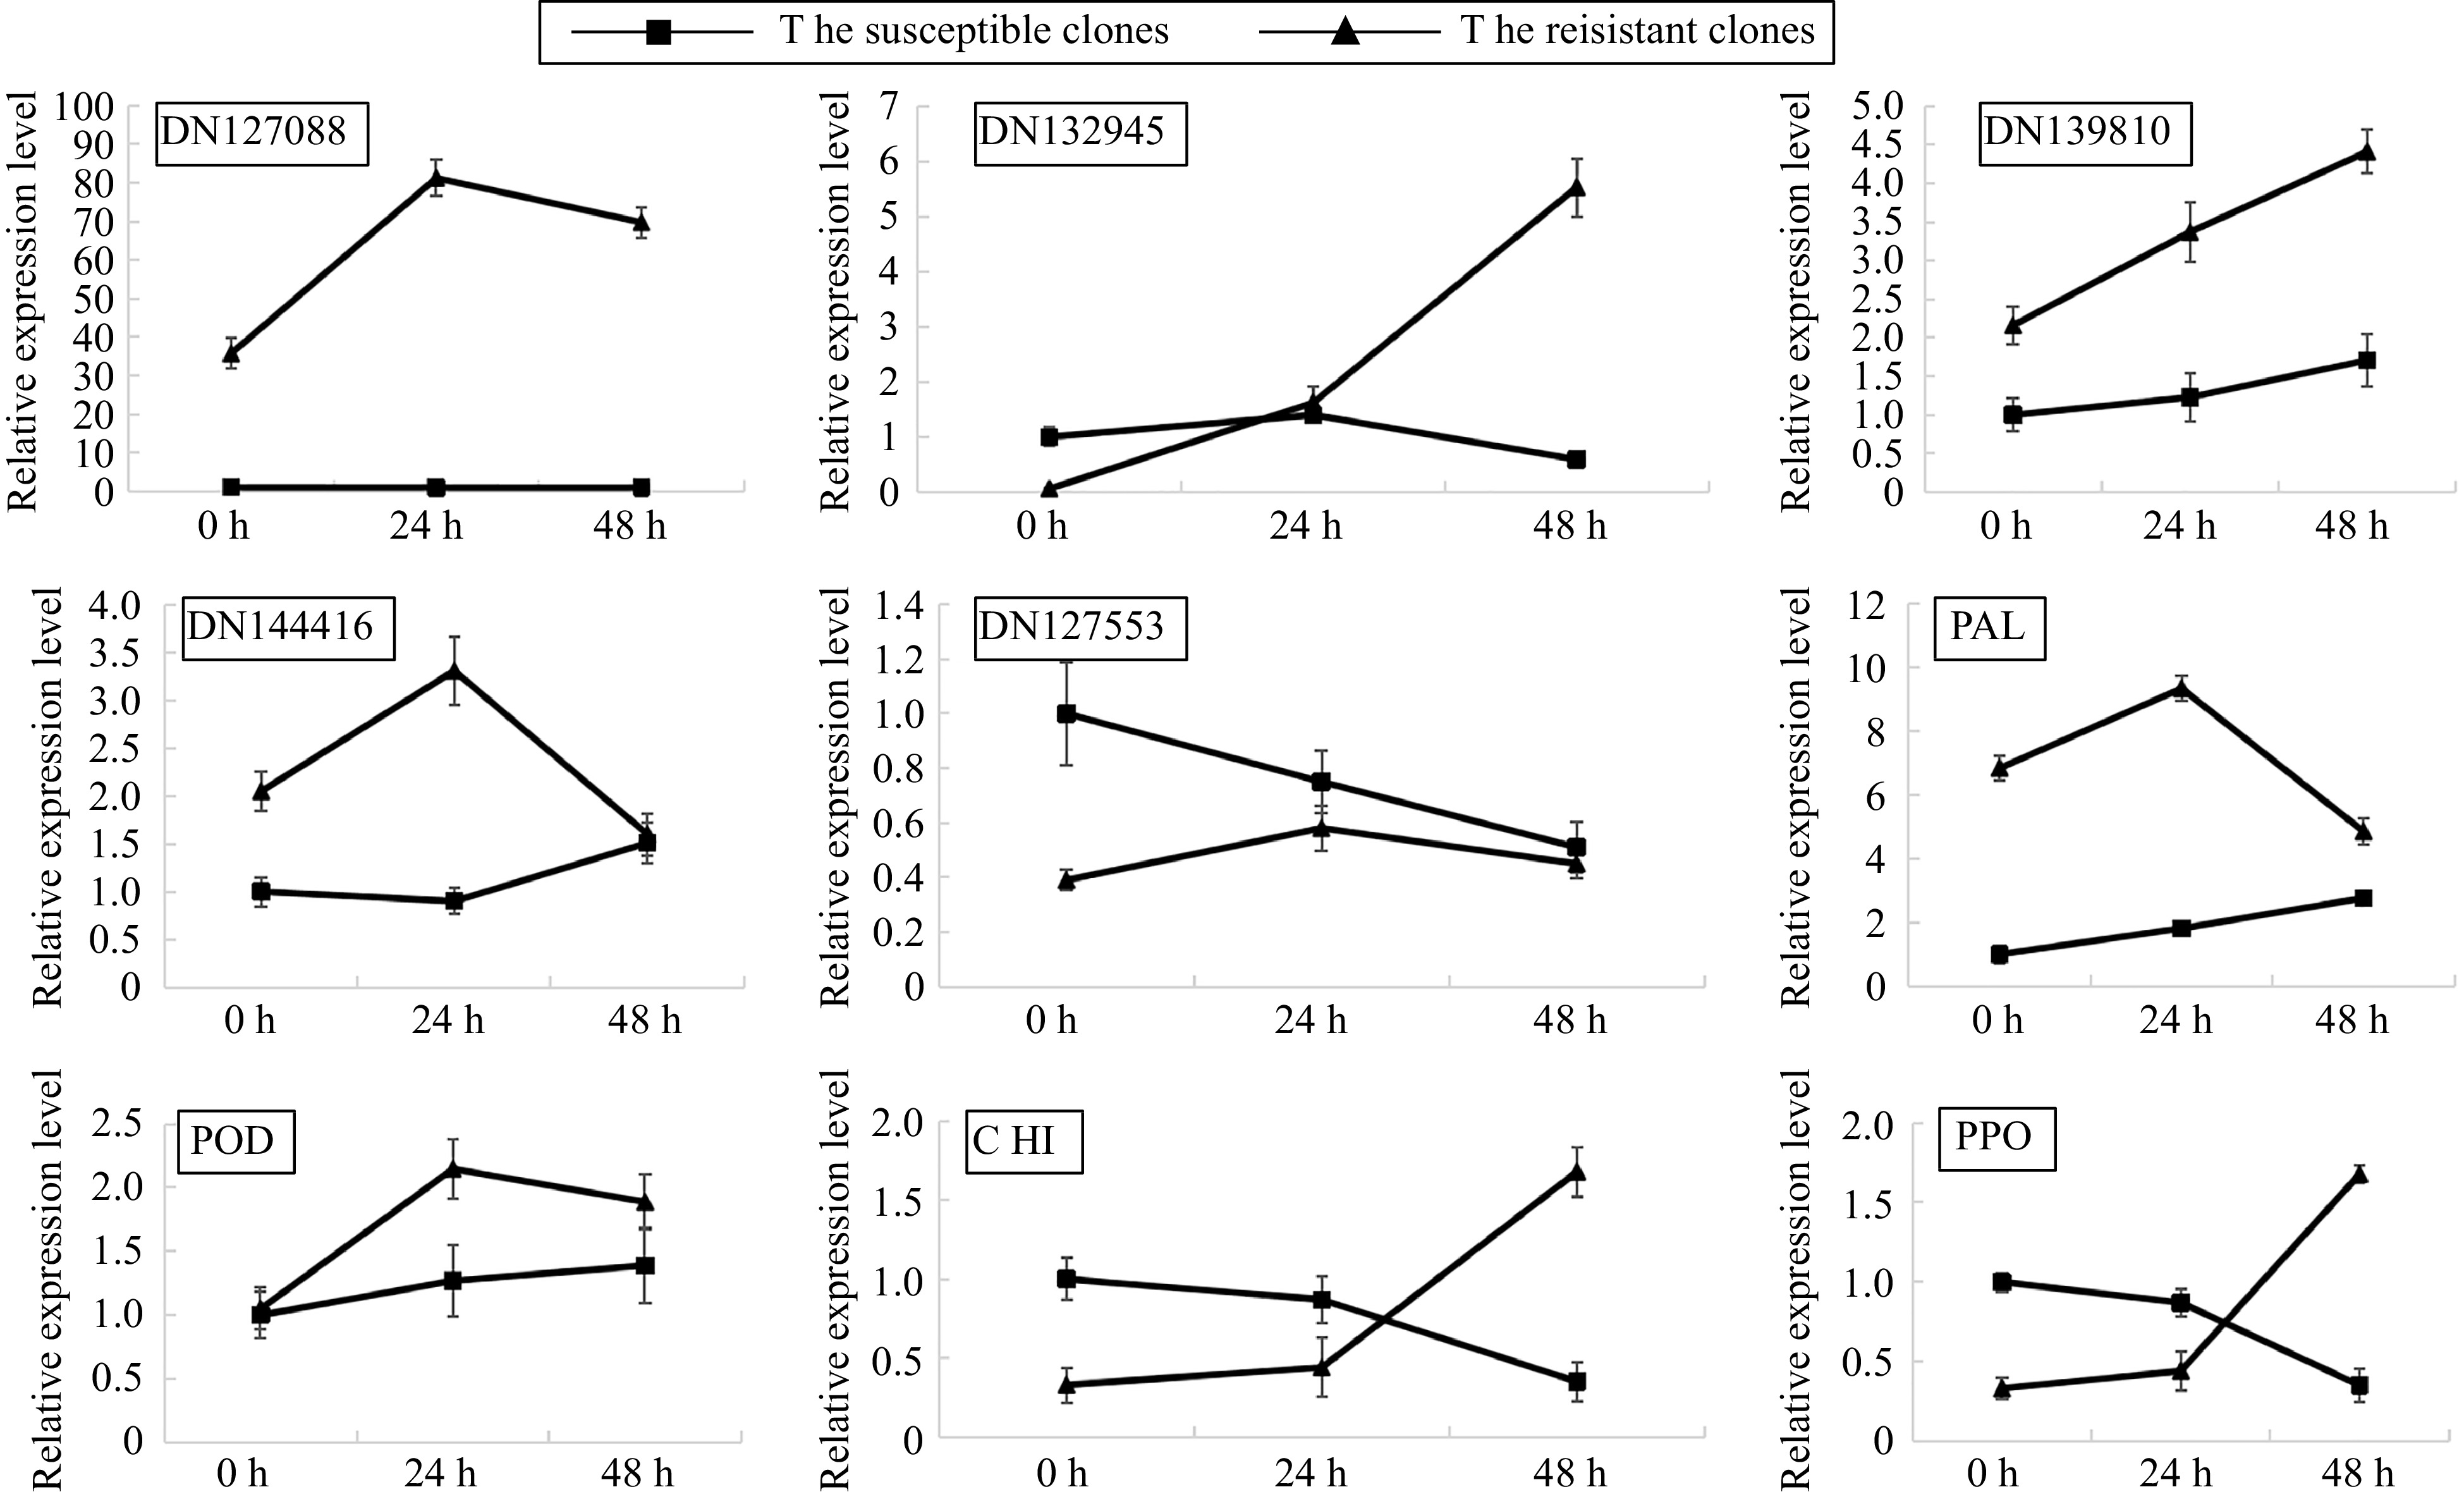
Figure 3.
Quantitative real-time PCR (qRT-PCR) analysis of the relative expression levels.
Protein function annotation and DEP analysis
-
Quantitative proteome analysis identified 7,482 proteins in total, 5,735 (76.65%) and 3,888 (51.96%) of which were annotated using the GO and KEGG databases, respectively. GO terms such as 'metabolic process' (3,963), 'cellular process' (3,531), 'single-organism process' (2,896), 'response to stimulus' (1,061) and 'immune system process' (112) were enriched in the biological process category; 'cell part' (3,505) and 'cell' (3,505) were enriched in the cellular component category; 'catalytic activity' (3,135) and 'binding' (2,675) were enriched in the molecular function category (Fig. 4).
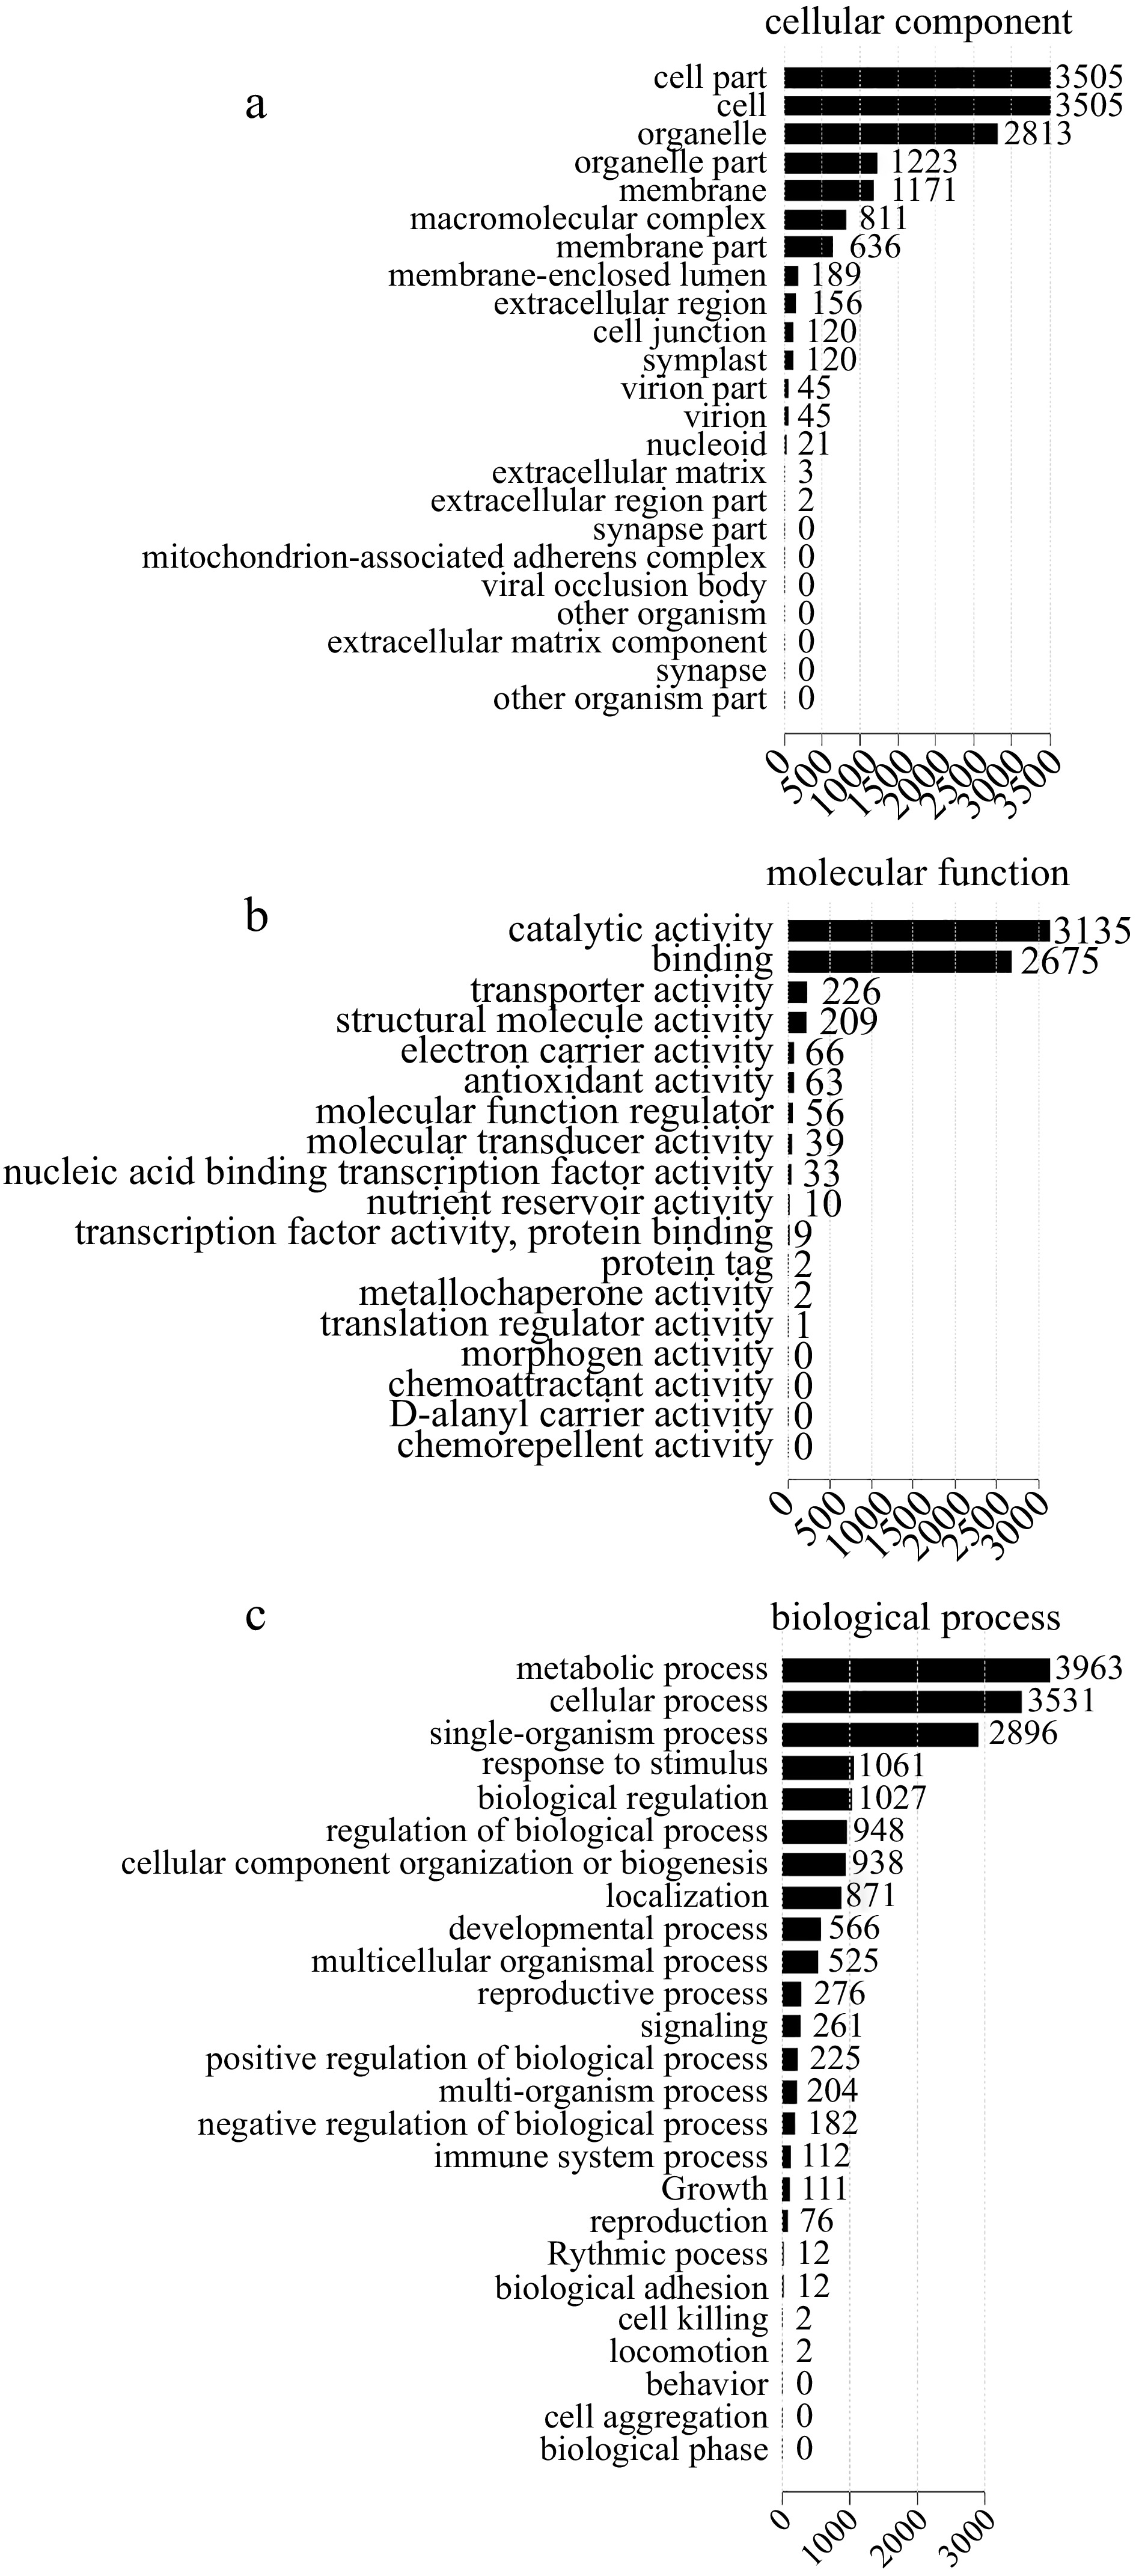
Figure 4.
GO classification of differentially expressed proteins (DEPs). (a) Cellular component. (b) Molecular function. (c) Biological process.
A total of 2,055 DEPs with fold-change (FC) ≥ 2.0 and p-value ≤ 0.05 were screened. 316 DEPs (166 upregulated and 150 downregulated) were identified between RLC and SLC while 1,052 DEPs (579 upregulated and 473 downregulated) were verified between RLC-48 and SLC-48 (Fig. 5a). KEGG pathway enrichment analysis revealed DEPs enriched in different pathways. Pathways with p-values < 0.05 and < 0.01 were defined as significantly enriched pathways and very significantly enriched pathways, respectively. One hundred and fifty seven DEPs were significantly enriched in six pathways between SLC00 and RLC00 samples, including 'metabolic pathways', 'glyoxylate and dicarboxylate metabolism', 'porphyrin and chlorophyll metabolism', 'pentose phosphate pathway' and 'phenylpropanoid biosynthesis' (Fig. 5b ). Five hundred and fourteen DEPs were significantly enriched in seven pathways between SLC48 and RLC48 samples, including 'metabolic pathways', 'glyoxylate and dicarboxylate metabolism', 'carbon fixation in photosynthetic organisms', 'glycine, serine and threonine metabolism' and 'alanine, aspartate and glutamate metabolism' (Fig. 5c).
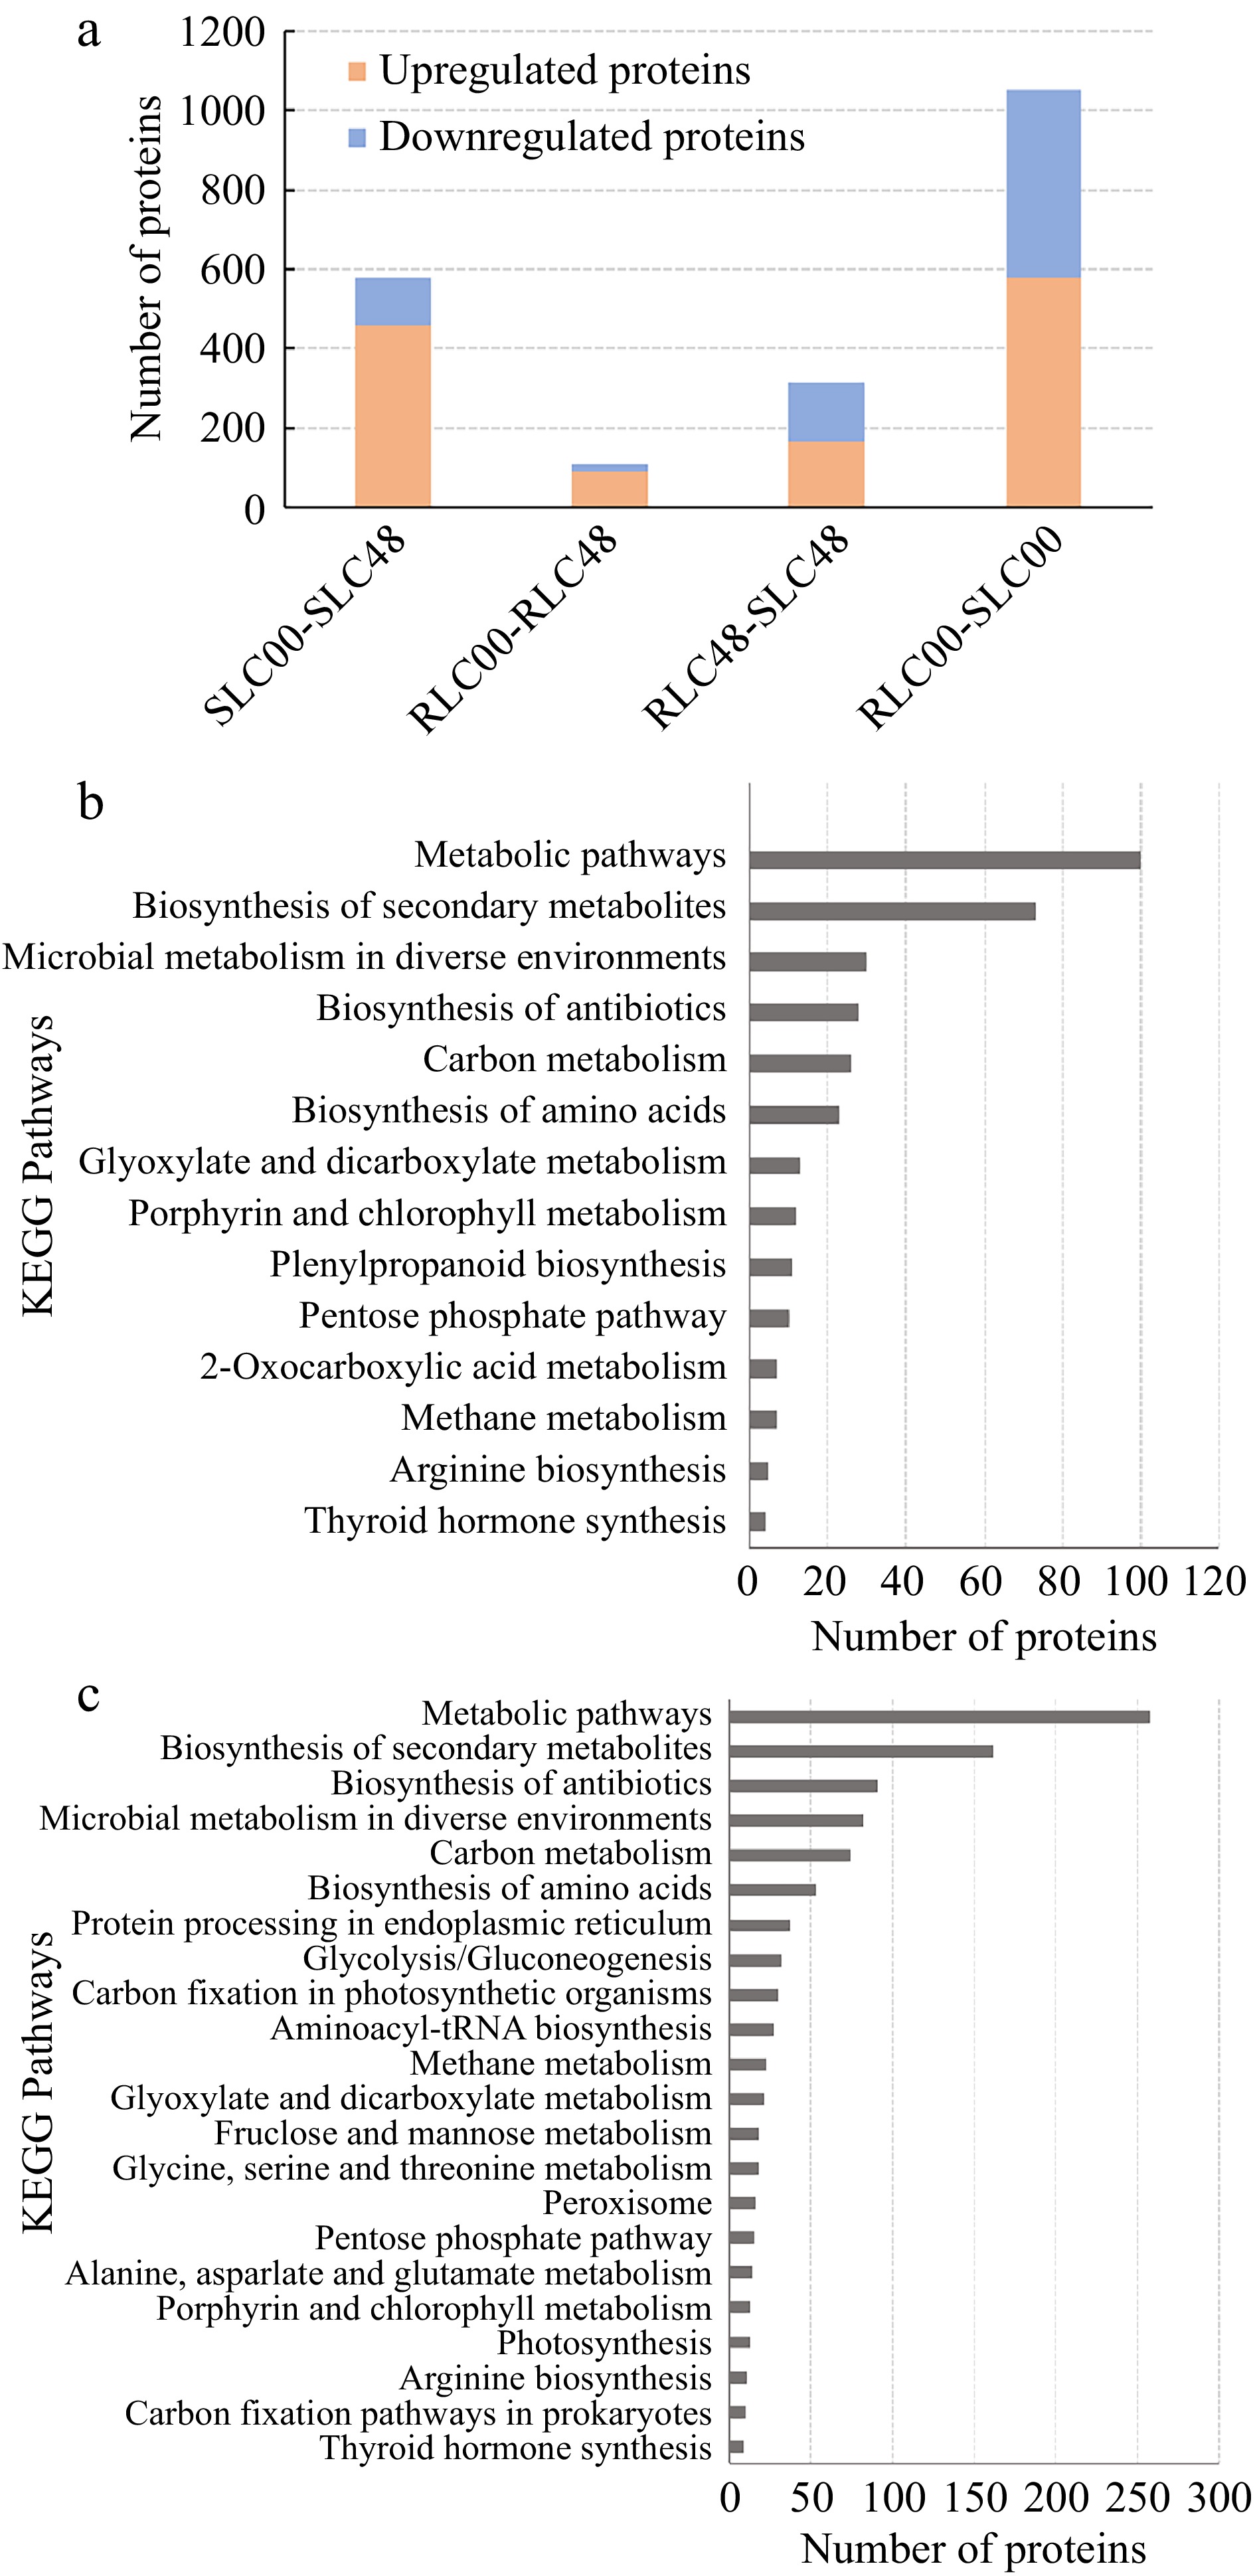
Figure 5.
DEPs identified between different lily samples. (a) numbers of DEPs. (b) Numbers of DEPs. between SLC00 and RLC00 samples. (c) Numbers of DEPs. between SLC48 and RLC48 samples.
-
Oriental lily is a highly heterozygous flowering plant with a genome size of approximately 36 Gb[21]. To fully explore the mechanism of disease resistance in Fusarium resistant lily mutant clones, we carried out comparative studies of transcriptome and proteome simultaneously to achieve complementarity and integration, which can better analyze the disease-resistance mechanism. In this study, 137,715 unigenes were identified and annotated. GO enrichment analysis indicated that these genes are involved in signal transduction mechanism, energy production and conversion, inorganic ion transport mechanism and defense mechanisms. Simultaneously, a protein search library was constructed based on transcriptome data. KEGG pathway enrichment analysis shows that DEGs and DEPs are involved in plant hormone signal transduction, oxidative phosphorylation, phenylalanine metabolism, ribosome pathway, glycine, serine and threonine metabolism, alanine, aspartate and glutamate metabolism and other resistance-related metabolic pathways. These disease resistance processes involve all aspects of plant activities, indicating that lily–F. oxysporum interaction is regulated by a multigene network[33,34].
Different mechanisms are underlying the plant-pathogen interaction conferring the plant resistance upon infection by various pathogens. The primary difference between the resistant and susceptible hosts upon pathogen invading is their performance at the key time points, also the responding speed and defense efficiency[35]. The defense response of a susceptible host is slow and weak, which allows the pathogen to colonize the plant rapidly and induce disease[8,36]. In this study, both resistant and susceptible clones were inoculated with F. oxysporum, which induced DEGs and DEPs involved in disease resistance-related metabolic pathways. Therefore, our research focuses on metabolic pathways associated with disease resistance and the DEGs and DEPs involved in these pathways.
Phytohormone signaling pathways
-
Plant hormones are active substances produced by plant cells in response to certain environmental factors. These include auxin, gibberellic acid (GA), cytokinin (CK), abscisic acid (ABA), ethylene (ET), ethephon (ETH), salicylic acid (SA), jasmonic acid (JA), brassinosteroid (BR) and polyamines. Plant hormones function at low concentrations by acting alone or in a synergistic manner to regulate various physiological processes such as cell division, cell elongation, tissue and organ differentiation, seed dormancy and germination, flowering, fruit production, maturation, senescence and in vitro culture[37]. Plant hormones such as SA, JA and ET, are involved in defense response against various pathogens[38,39]. Studies indicate that SA, JA and ET form a highly ordered regulatory network to regulate abiotic stress response. SA dominantly responds to biological stress by inducing the host plant system to acquire disease resistance[40], whereas JA and ET respond to biological stress by triggering induced systemic resistance (ISR)[41,42]. Many DEGs and DEPs verified in this study were involved in signal transduction and plant hormone (JA and ET) metabolic pathways. Our RNA-seq and iTRAQ data indicated that DEGs and DEPs on response to SA and SA metabolic process were upregulated, suggesting that the response to SA in lily resistant clones might be much stronger than that in lily susceptible clones.
Plant–pathogen interactions
-
During the long-term exposure to pathogens, plants employ a series of defense mechanisms such as HR, change in defense-related enzyme levels (such as PAL and POD), production of phytoalexins (PAs) and accumulation of PR proteins[43−45]. PR proteins are induced not only after pathogen infection but also in answer to different abiotic stresses, such as drought, wounding and freezing. Among these, CHI (PR3, PR4, PR8 and PR11), either alone or in combination with beta-1,3-glucanase (PR2), can effectively enhance disease resistance in plants[46]. CHI is a typical PR protein that plays a very important role in preventing fungal pathogens from invading host plants. In general, CHI expression level in host plants is very low, but when host plants are invaded by pathogenic fungi, the level of CHI protein increases in plant cells. To date, CHI has been detected in approximately 100 plant species, and the CHI gene of many host plants has been cloned. To enhance disease resistance, foreign CHI genes have been introduced into many crop plants, such as wheat, rice and tobacco[47,48]. In this study, we found that several genes upregulated in response to F. oxysporum infection were related to the chitin catabolic process, chitin binding and CHI activity pathway. This suggests that PR genes function cooperatively to induce resistance against F. oxysporum in resistant lily clones.
A large number of studies show that POD enzymes play an important role in biotic and abiotic stress responses[49−51]. In this study, the DEGs and DEPs on POD metabolic process were induced in lily resistant clones upon inoculation with F. oxysporum. This implies that lily resistant clones may combat the attack by F. oxysporum. Phenylpropanoid compounds, such as lignin, flavonoids and anthocyanins, play a key role in plant disease-resistance. The data showed that genes and proteins upregulated after inoculation with F. oxysporum were involved in the phenylpropanoid pathway. POD not only acts as a key antioxidant enzyme but also regulated the biosynthesis of G-, S- and H-lignin monomers[39,52]. In this study, genes encoding POD enzymes were upregulated in response to F. oxysporum inoculation.
Role of the cell wall in disease resistance
-
Plant cells are encompassed by a thick cell wall, which provides mechanical support to cells, maintains cell morphology and is involved in various physiological activities such as extracellular signal recognition. The cell wall is the first physical barrier of plant cells against invading pathogens[33,53,54]. When host plants are infected by a pathogen, the cell wall damage signal is activated, which further activates the defense response. This leads to the production of phenolic substances and accumulation of callose and lignin in cells surrounding the infection site, thus strengthening the thickness of the cell wall to resist pathogen invasion[55]. In this study, inoculation of lily resistant clones with F. oxysporum spore suspension upregulated the expression of many genes and proteins involved in enhancing cell wall thickness.
Regulation mechanism of resistance to Fusarium oxysporum
-
Based on our work, we put forword a hypothetical model to illuminate the resistance of lily resistant clones to F. oxysporum. In this model, the plants recognize PAMPs through their innate recognition receptors, resulting in a series of cellular responses. The plant RPM1 protein recognizes HSP90 to activates ETI to induce plant hypersensitive response (HR), at the same time, Ca2+ activates CNGCs to induce plant hypersensitive response (HR), which result in cell death and hinders further infection. The expression of cutin, suberine, wax, phenylpropanoid biosynthesis and plant hormone signal transduction pathway-related genes is activated. The expression of SA-induced disease resistance-related genes TGA increased. Glycine, serine, threonine chitin metabolism increased significantly. In summary, we supposed that the PPAR, MAPK-plant signalling pathway, SA resistance pathway, SOD metabolism pathway are involved in the defence of lily resistant clones against F. oxysporum(Fig. 6).
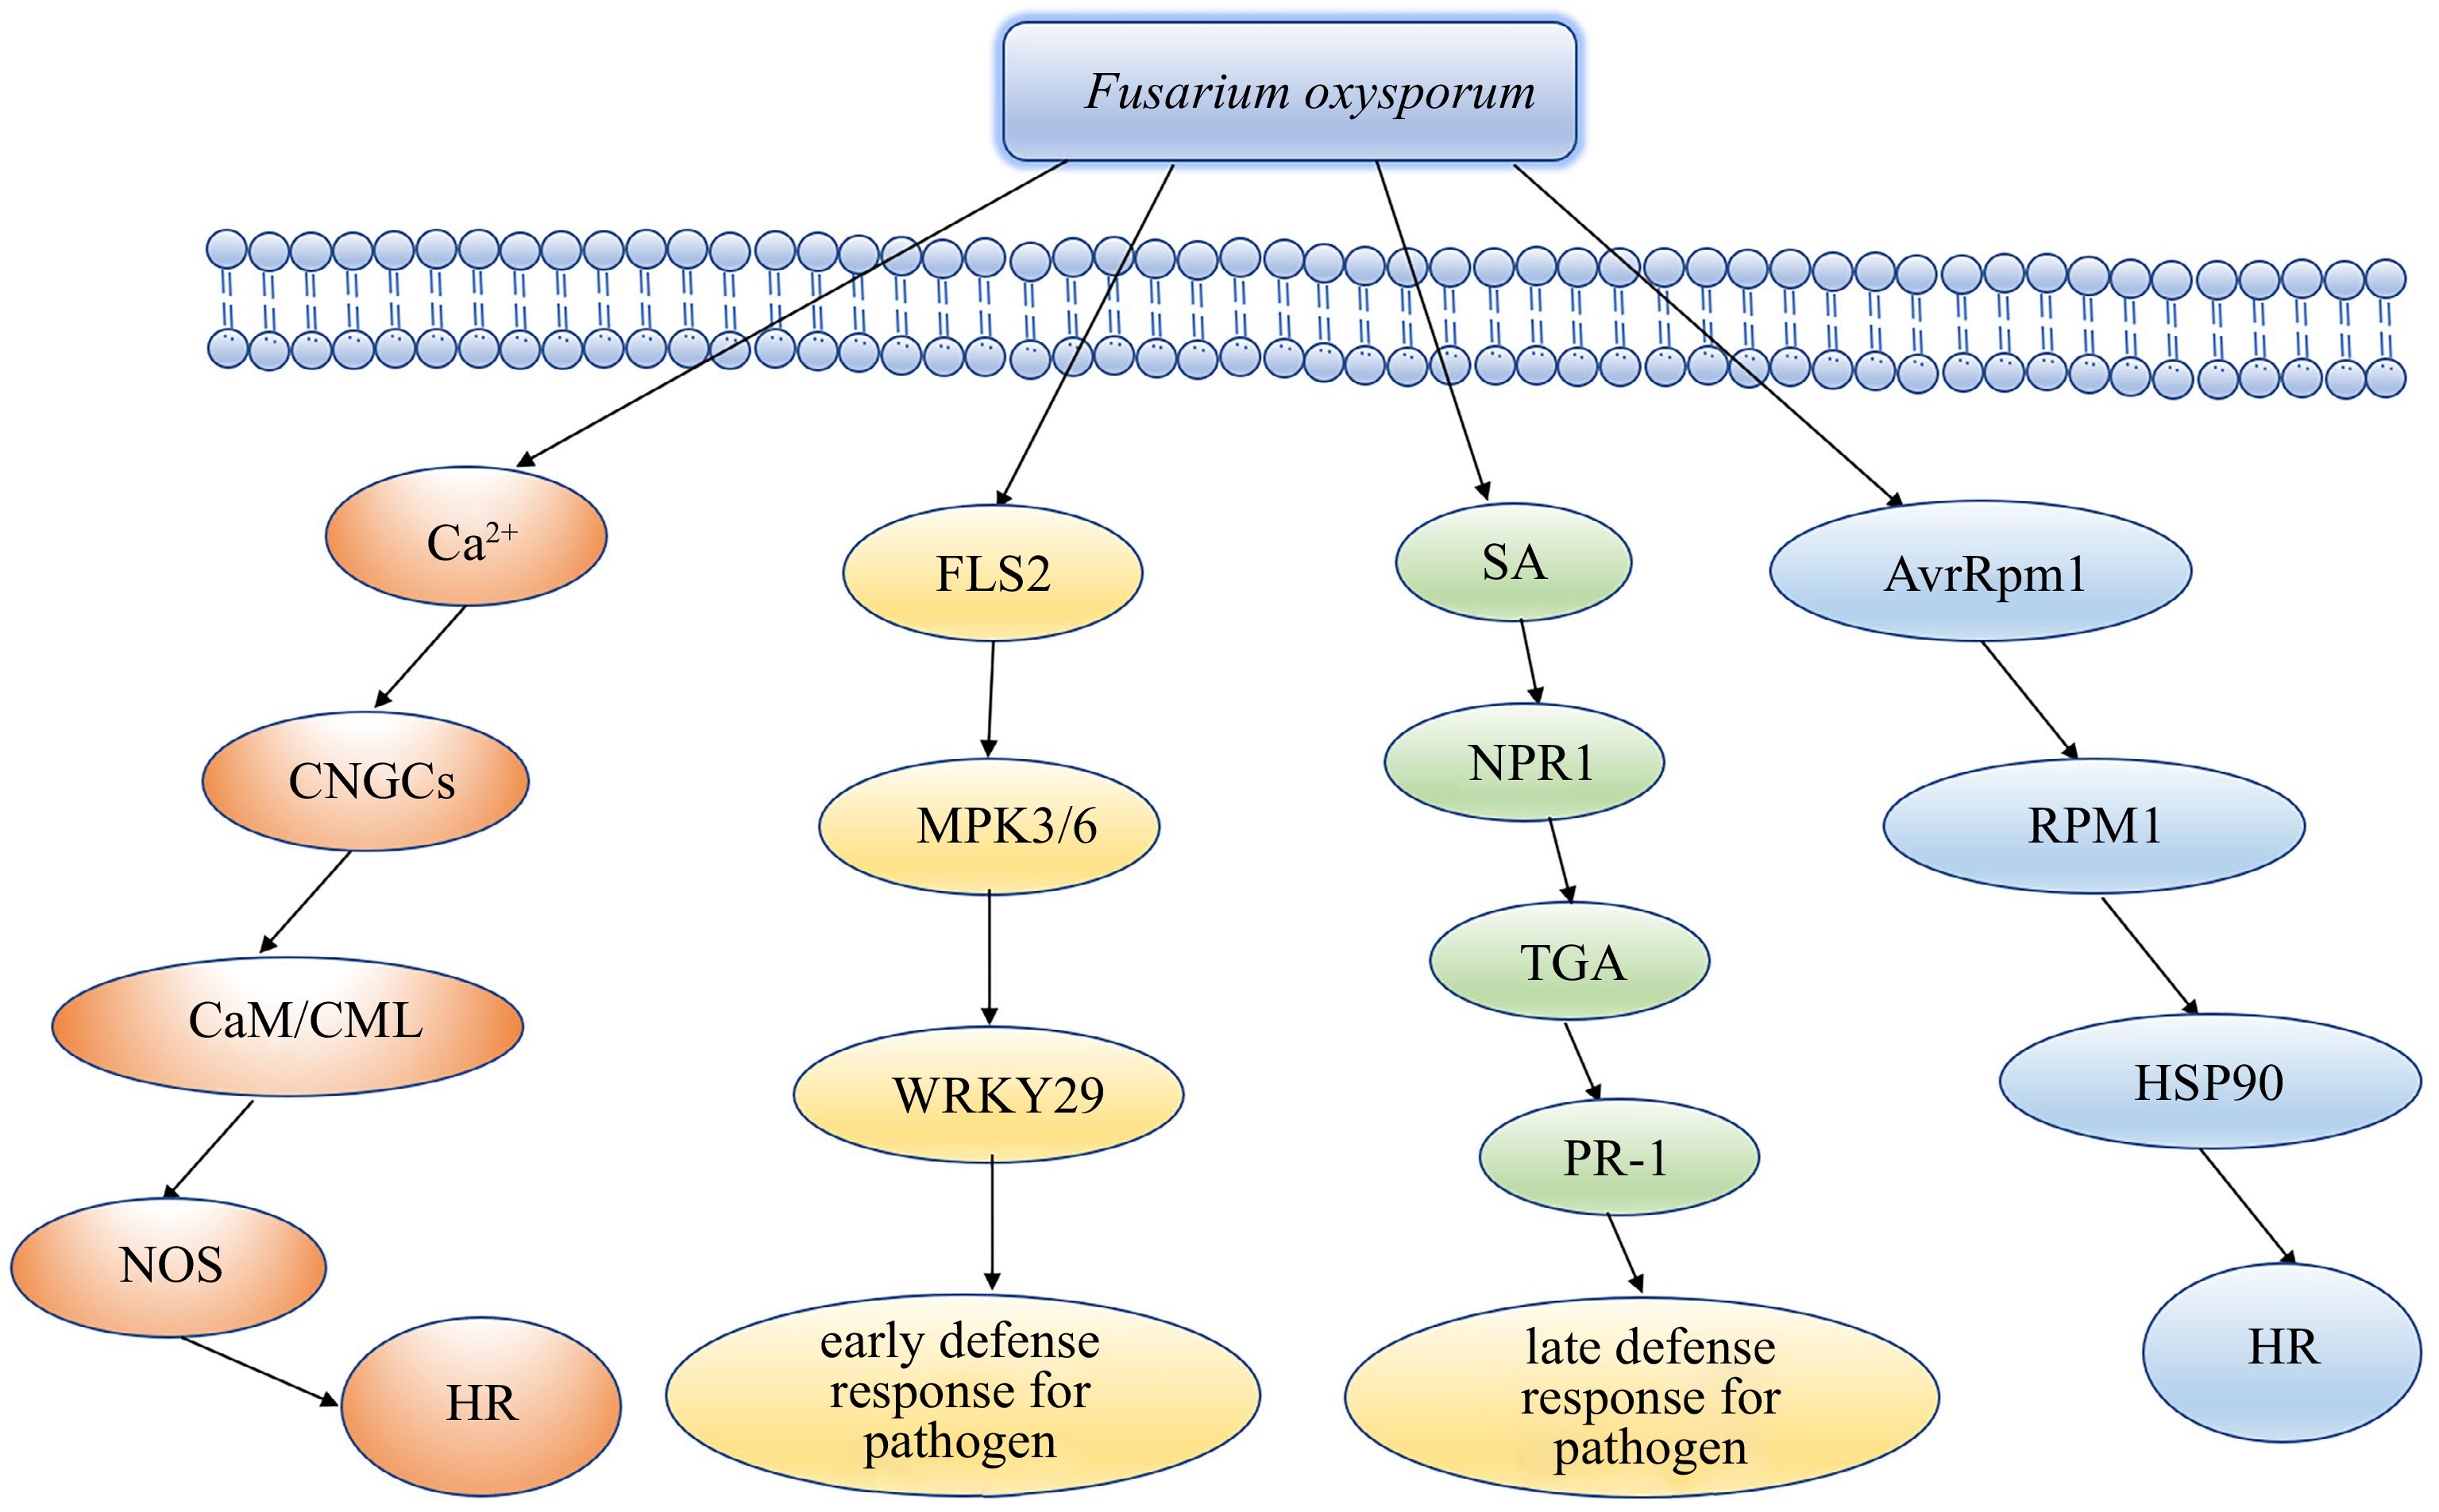
Figure 6.
Hypothetical model of the mechanism of lily resistant clone tolerance to Fusarium oxysporum.
Overall, in this study, we obtained information on the transcriptomic and proteomic responses of lily to F. oxysporum infection. Our results indicated that a large number of DEGs and DEPs conferring resistance to F. oxysporum were refered to SA and phenylpropanoid metabolic pathways. The DEGs and DEPs related to for defense responses also involved antioxidant enzymes, POD, PPO and PR proteins pertaining to various families. These results suggest the molecular mechanism potential of the defense response of lily against F. oxysporum and provide potential candidate gene targets for cultivar improvement by genetic engineering. Additionally, our results provide new and key sequence data for analyzing gene functions and further analyzing disease resistance mechanisms in lily.
This work was supported by National Key R&D Program of China (Grant No. 2019YFD1000400, 2020YFD10004), Kunming Comprehensive test station of national Flower Industry system (CARS-23-G56), National Natural Science Foundation of China (No. 31260484), Yunnan Provincial Science and Technology Department (Grant No. 2016BB009), the Green Food Brand-Build a Special Project (Floriculture) supported by Yunnan Provincial Finance Department (530000210000000013742).
-
The authors declare that they have no conflict of interest.
-
# These authors contributed equally: Yiping Zhang, Xin Wang
- Supplemental Table S1 Primers used for Q-PCR.
- Supplemental Fig. S1 Gene Ontology (GO) enrichment analysis of differentially expressed genes. A, GO enrichment analysis in profile SLC-00 vs RLC-00; B, GO enrichment analysis in profile SLC-48 vs RLC-48; C, GO enrichment analysis in profile SLC-00 vs SLC-24; D, GO enrichment analysis in profile SLC-00 vs SLC-48; E, GO enrichment analysis in profile RLC-00 vs RLC-24; F, GO enrichment analysis in profile SLC-00 vs RLC-48.
- Copyright: © 2022 by the author(s). Published by Maximum Academic Press, Fayetteville, GA. This article is an open access article distributed under Creative Commons Attribution License (CC BY 4.0), visit https://creativecommons.org/licenses/by/4.0/.
-
About this article
Cite this article
Zhang Y, Wang X, Jin C, Xu F, Yang X, et al. 2022. Comparative transcriptome and proteome analysis of lily clones inoculated with Fusarium oxysporum f. sp. lilii. Ornamental Plant Research 2:23 doi: 10.48130/OPR-2022-0023 

Comparative transcriptome and proteome analysis of lily clones inoculated with Fusarium oxysporum f. sp. lilii
- Received: 22 August 2022
- Accepted: 07 November 2022
- Published online: 28 December 2022
Abstract: Basal bulb rot is the major factor restricting the production of lily, caused by Fusarium oxysporum f. sp. lilii. To systematically analyze the transcriptomic and proteomic responses of lily clones to F. oxysporum, we constructed six RNA-seq libraries and four iTRAQ proteomic libraries using lily resistant and susceptible clones sampled at 0, 24 and 48 h post-inoculation (hpi) with F. oxysporum respectively. 137,715 unigenes were generated, of which 7,667 were differentially expressed. 1,679 and 4,051 differentially expressed genes (DEGs) between resistant and susceptible clones were isolated from samples collected at 0 and 48 hpi. Four hundred and thirty three and 155 DEGs were identified in resistant clones sampled at 24 and 48 hpi separately while 550 and 799 DEGs were isolated in the susceptible clones sampled at 24 and 48 hpi respectively. The results of iTRAQ analysis revealed 7,482 proteins in resistant and susceptible clones. Data analysis of transcriptome and proteome indicated that 5,735 proteins corresponded to mRNAs. Three hundred and sixteen and 1,052 DEGs had corresponding DEPs. At 48 hpi, the resistant clones showed 155 DEGs and 108 corresponding DEPs, while the susceptible clones showed 799 DEGs and 316 corresponding DEPs. In general, these results enhance comprehension of the defense response of lily resistant clones to F. oxysporum infection and provide valuable sequence data for studying the resistance mechanism.