-
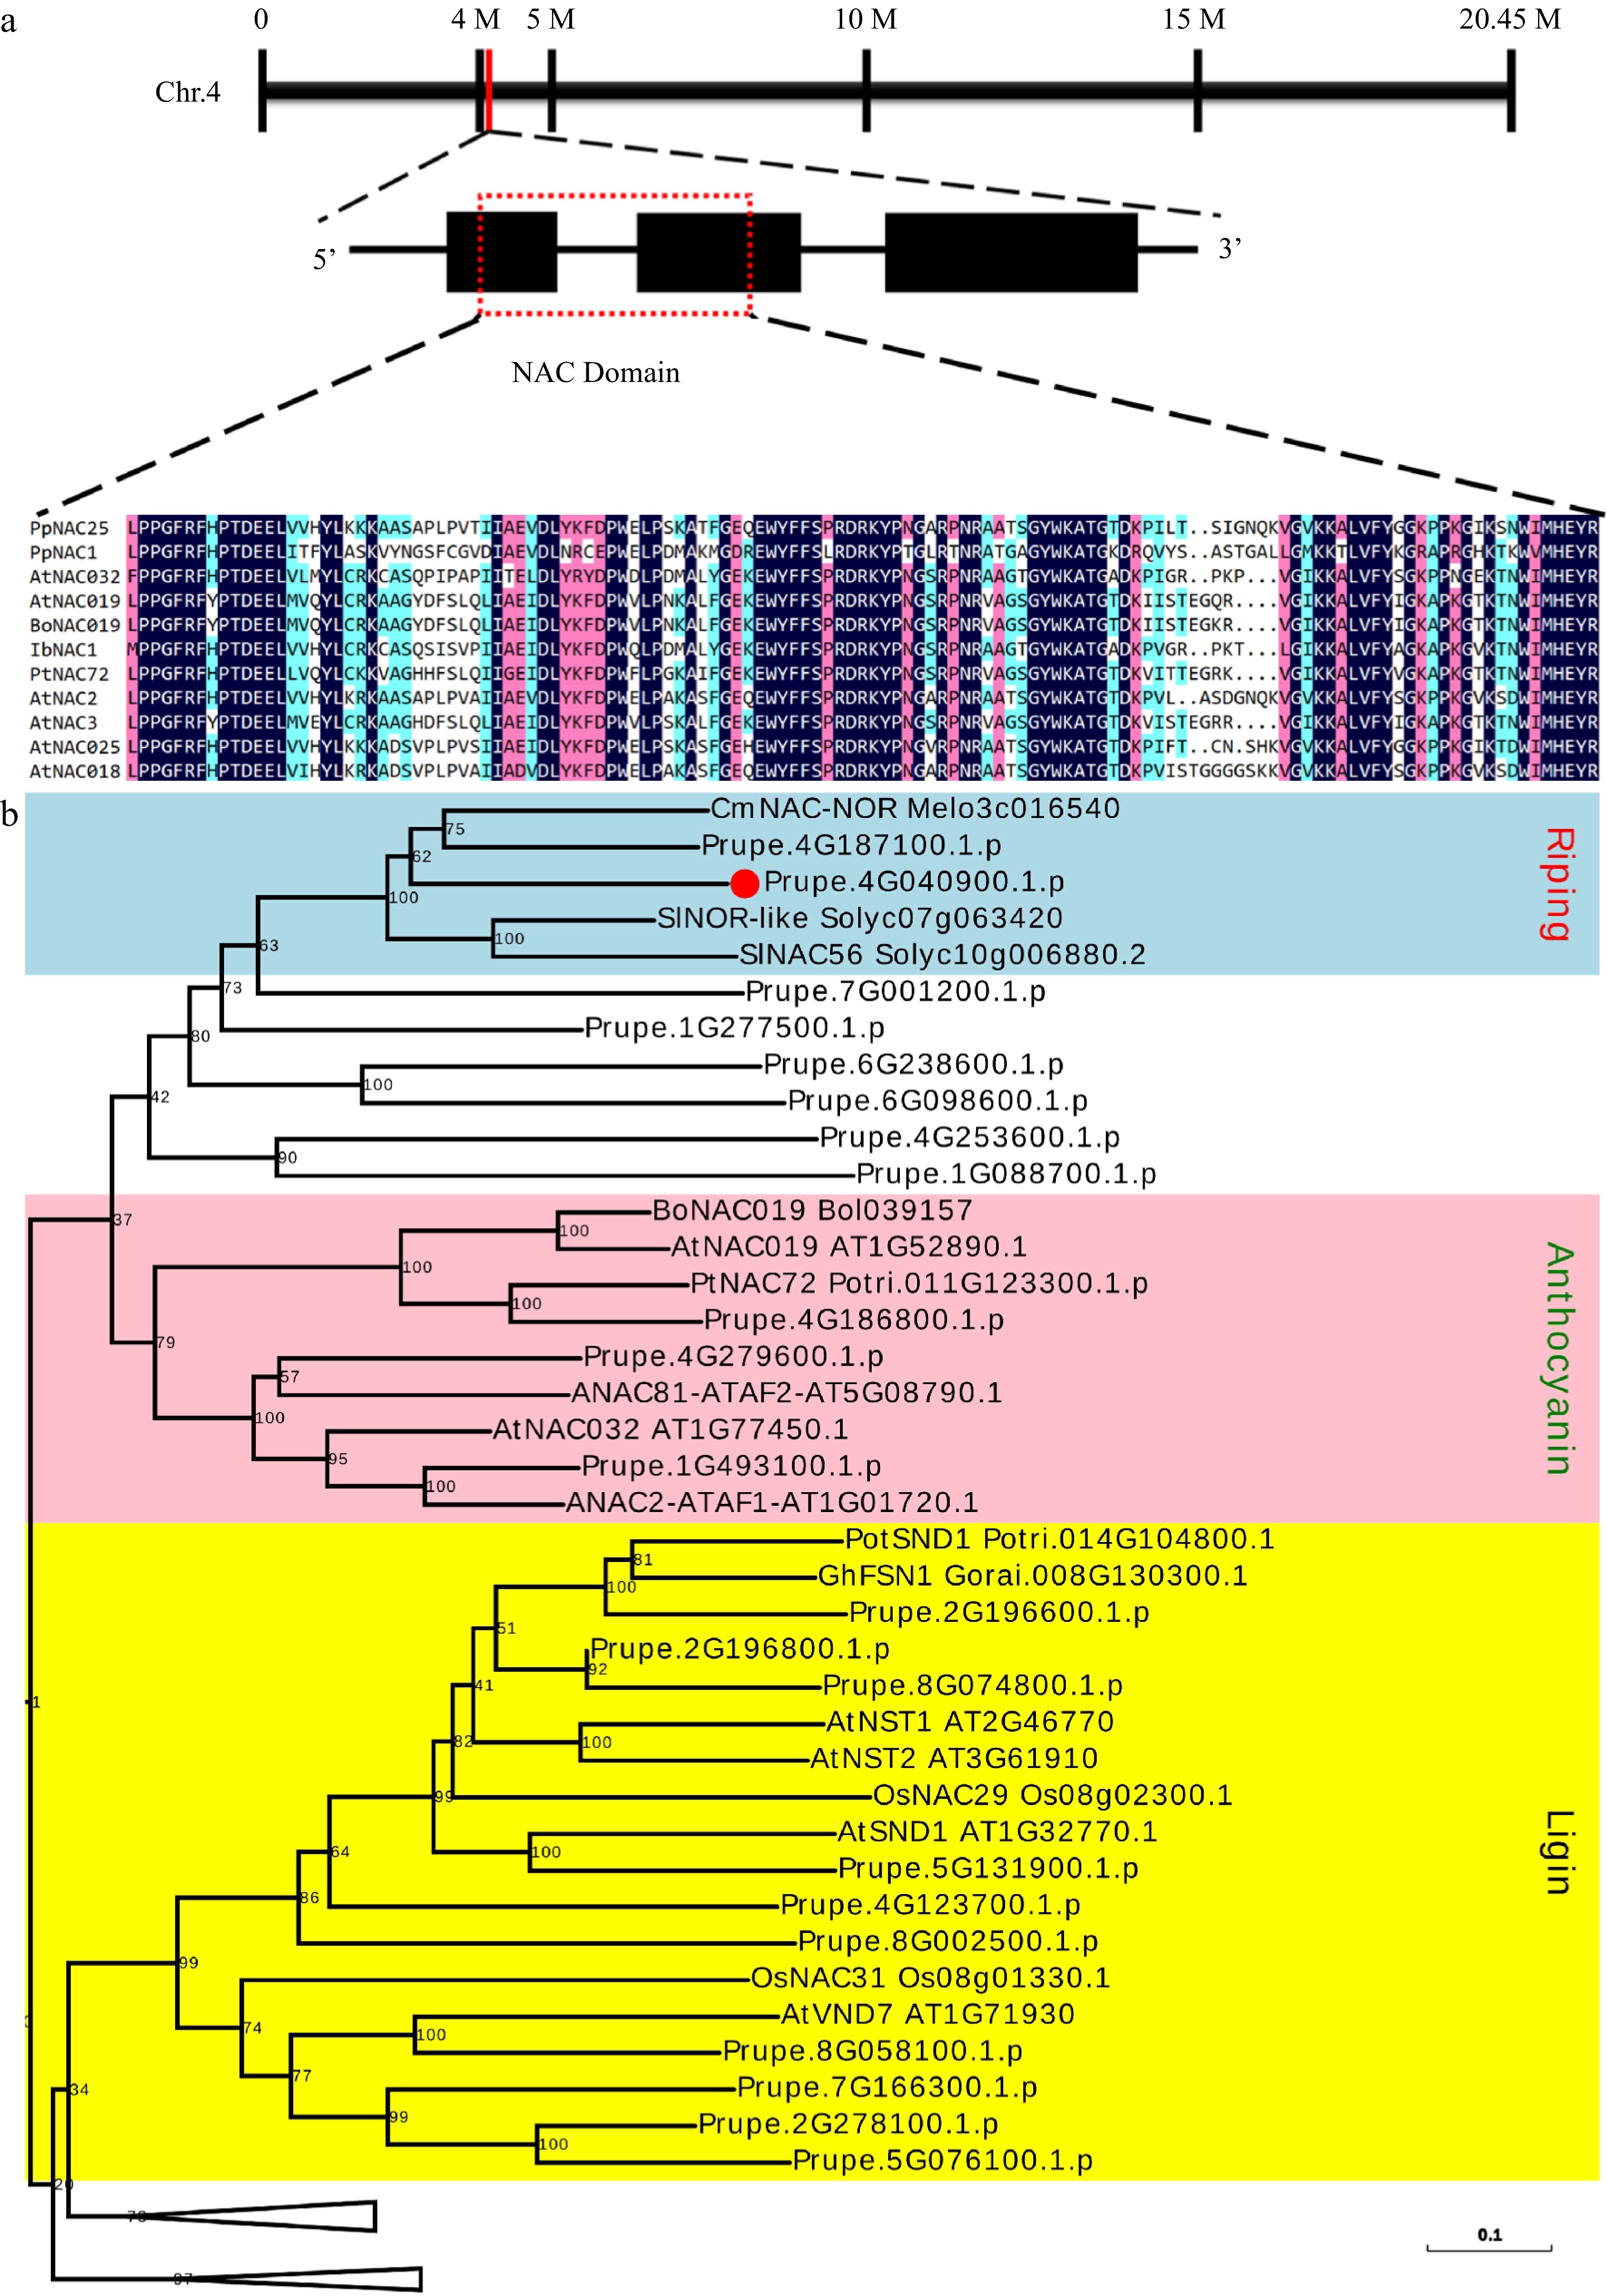
Figure 1.
Gene location and sequence analysis of PpNAC25. (a) Gene location, structure and multiple sequence alignment of NAC domain. (b) A branch of the phylogenetic tree is constructed using NACs in peach and NACs involved in anthocyanin, second cell wall, and ripening from different plants. PpNAC25 was highlighted in bold. The intact phylogenetic tree can be found in Supplemental Fig. S1.
-
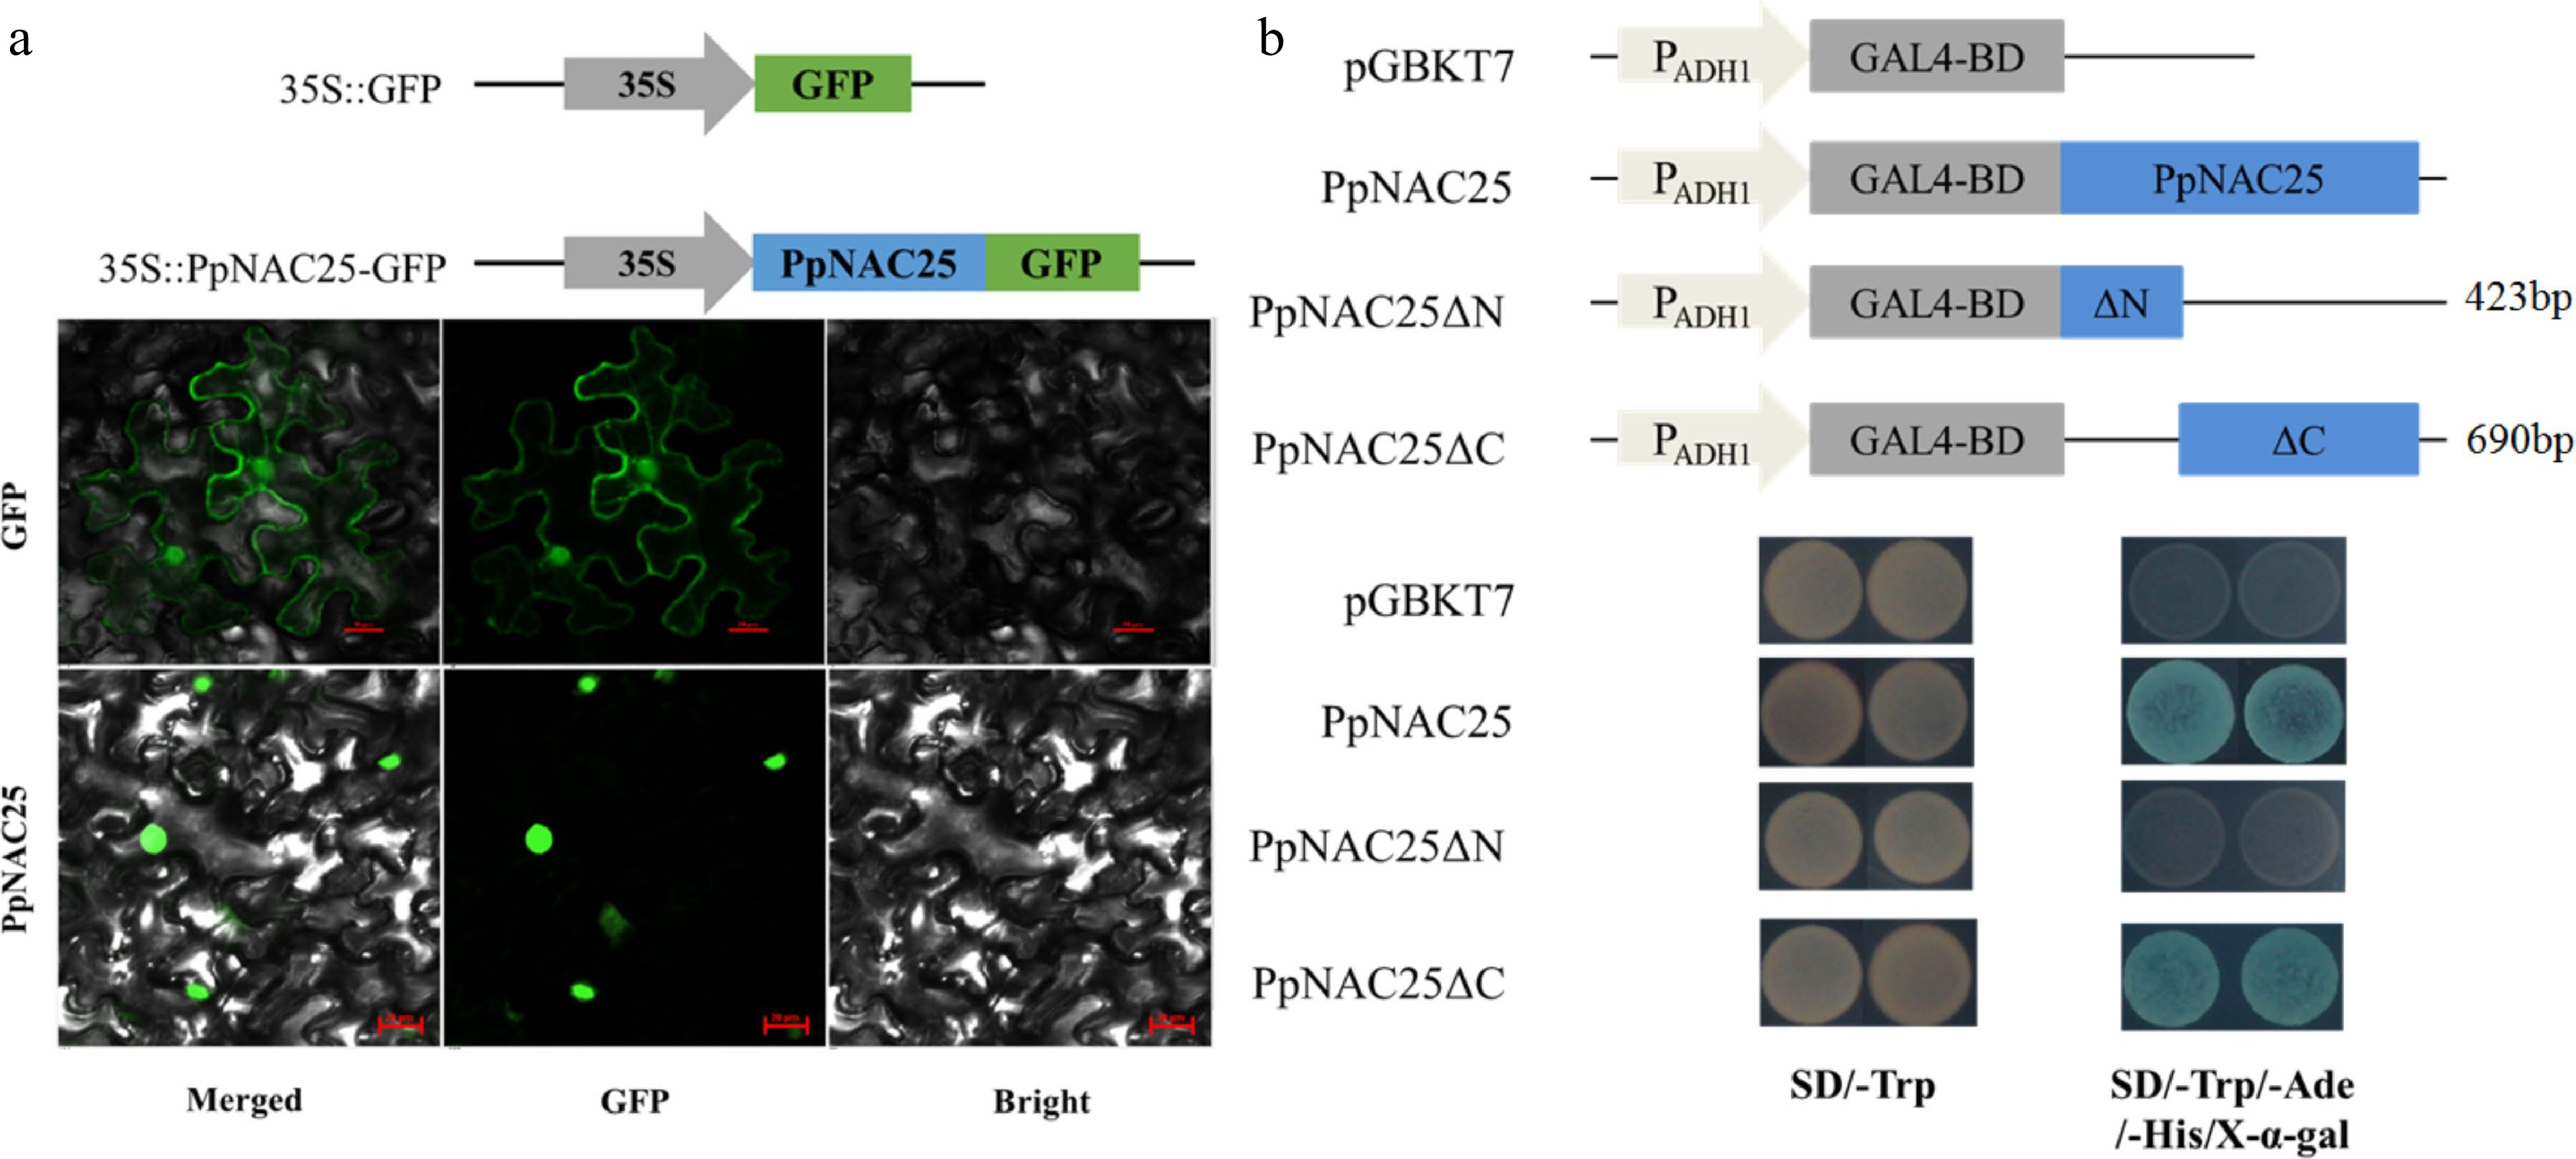
Figure 2.
(a) Subcellular location and (b) transcriptional activation activity of PpNAC25.
-
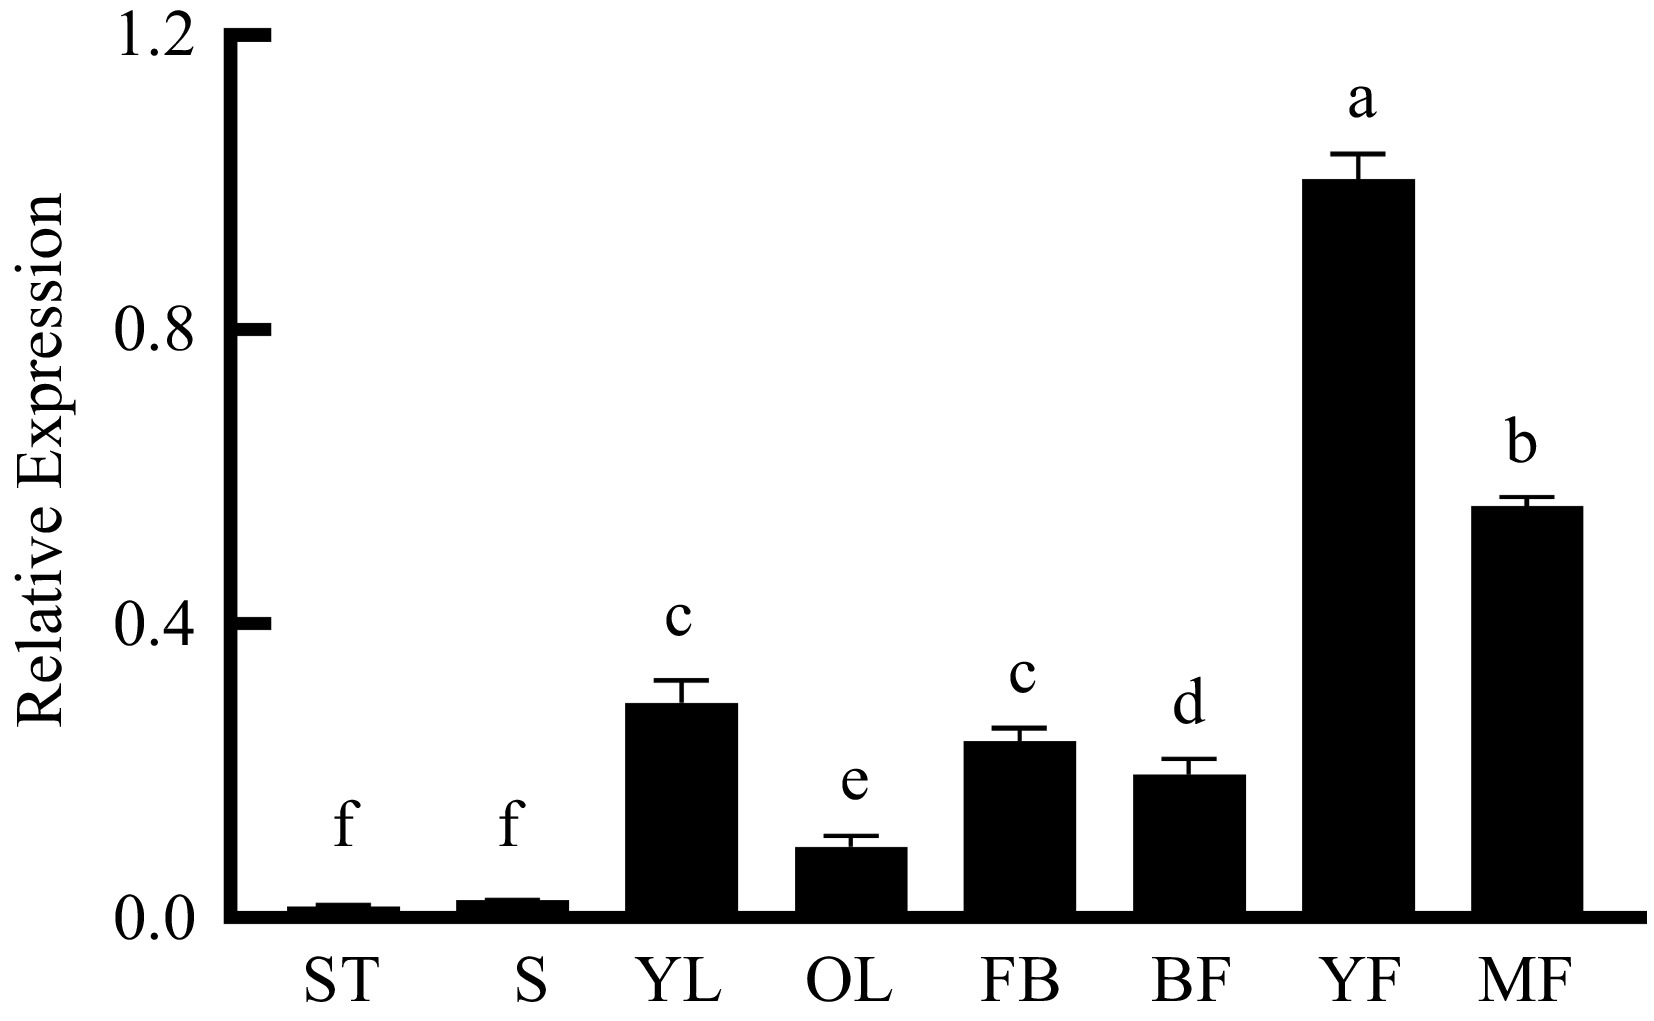
Figure 3.
Tissue specific expressions of PpNAC25. Expression of PpNAC25 in shoot tips (ST), stems (S), young leaves (YL), old leaves (OL), flower buds (FB), bloom flowers (BF), young fruit (YF) and mature fruit (MF).
-
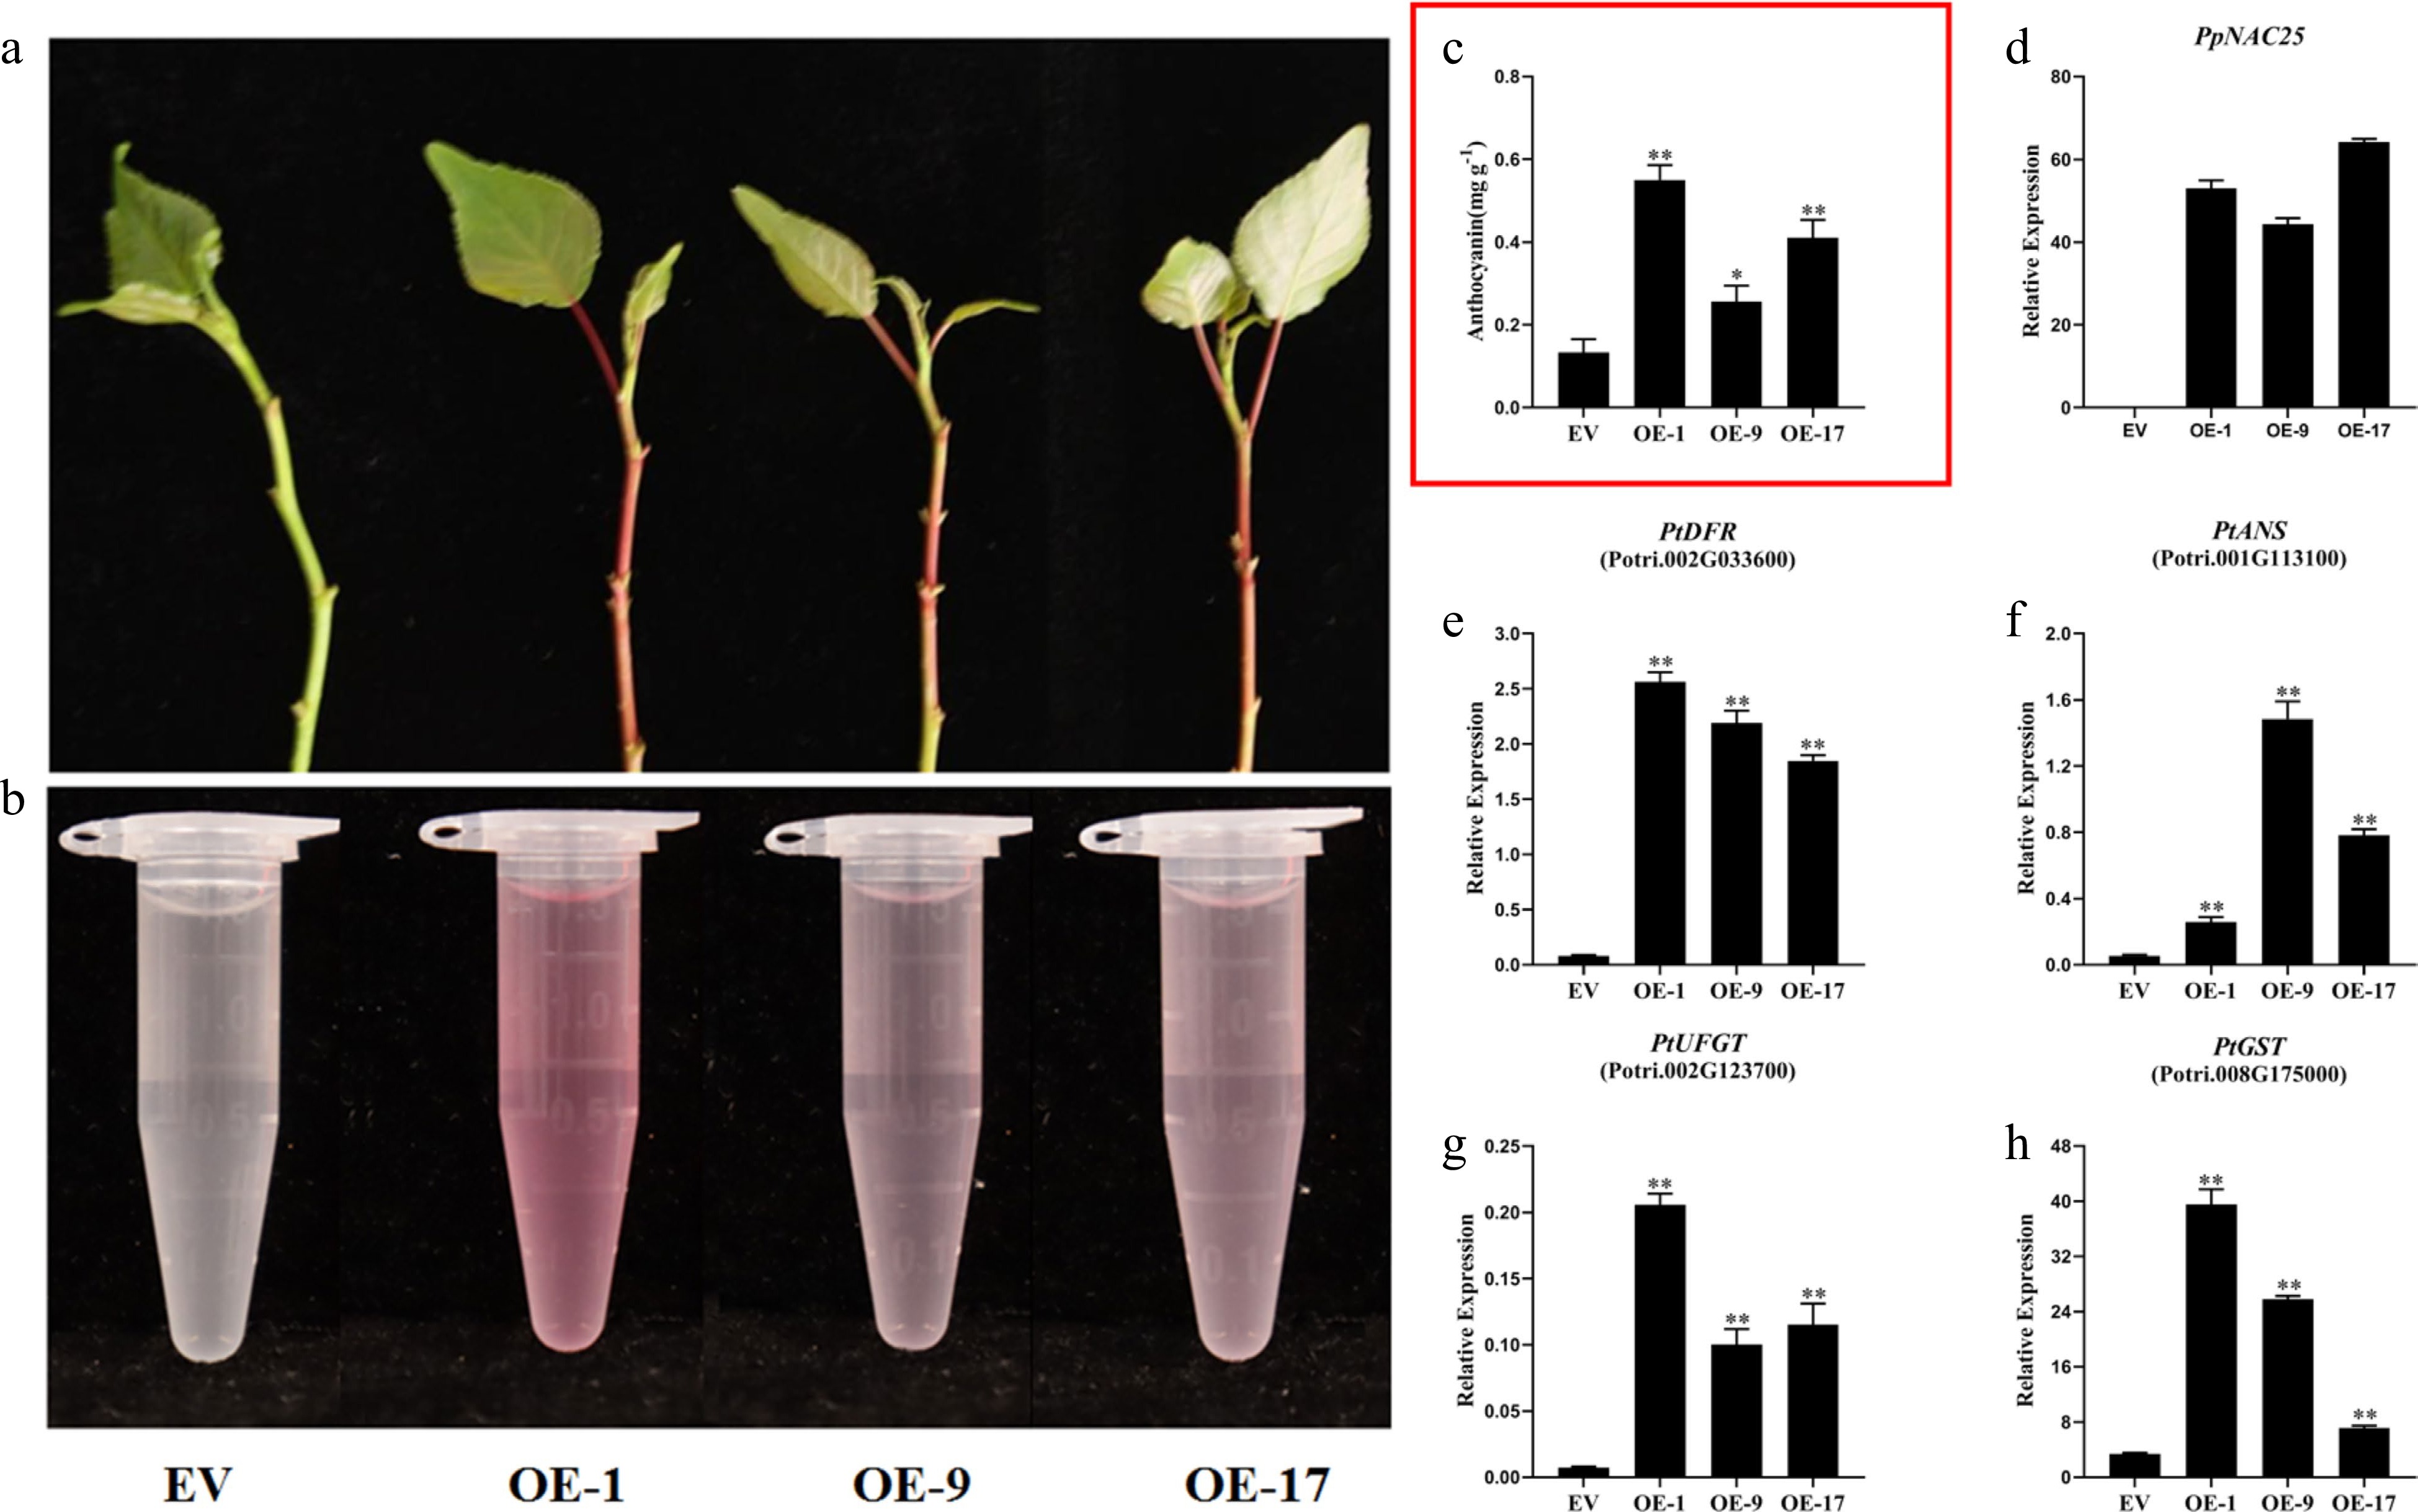
Figure 4.
Effect of PpNAC25 on the anthocyanin biosynthesis of poplar. (a), (b) the pigment of shoot tips from GFP and three transgenic lines. (c) The anthocyanin content of GFP and three transgenic lines. (d) The transcript levels of PpNAC25 in GFP and three transgenic lines. Anthocyanin biosynthetic gene (e) PtDFR, (f) PtANS, (g) PtUFGT and (h) PtGST in GFP and three transgenic lines. Error bars represent ± SD of three replicates (* P < 0.05, ** P < 0.01, *** P < 0.001).
-
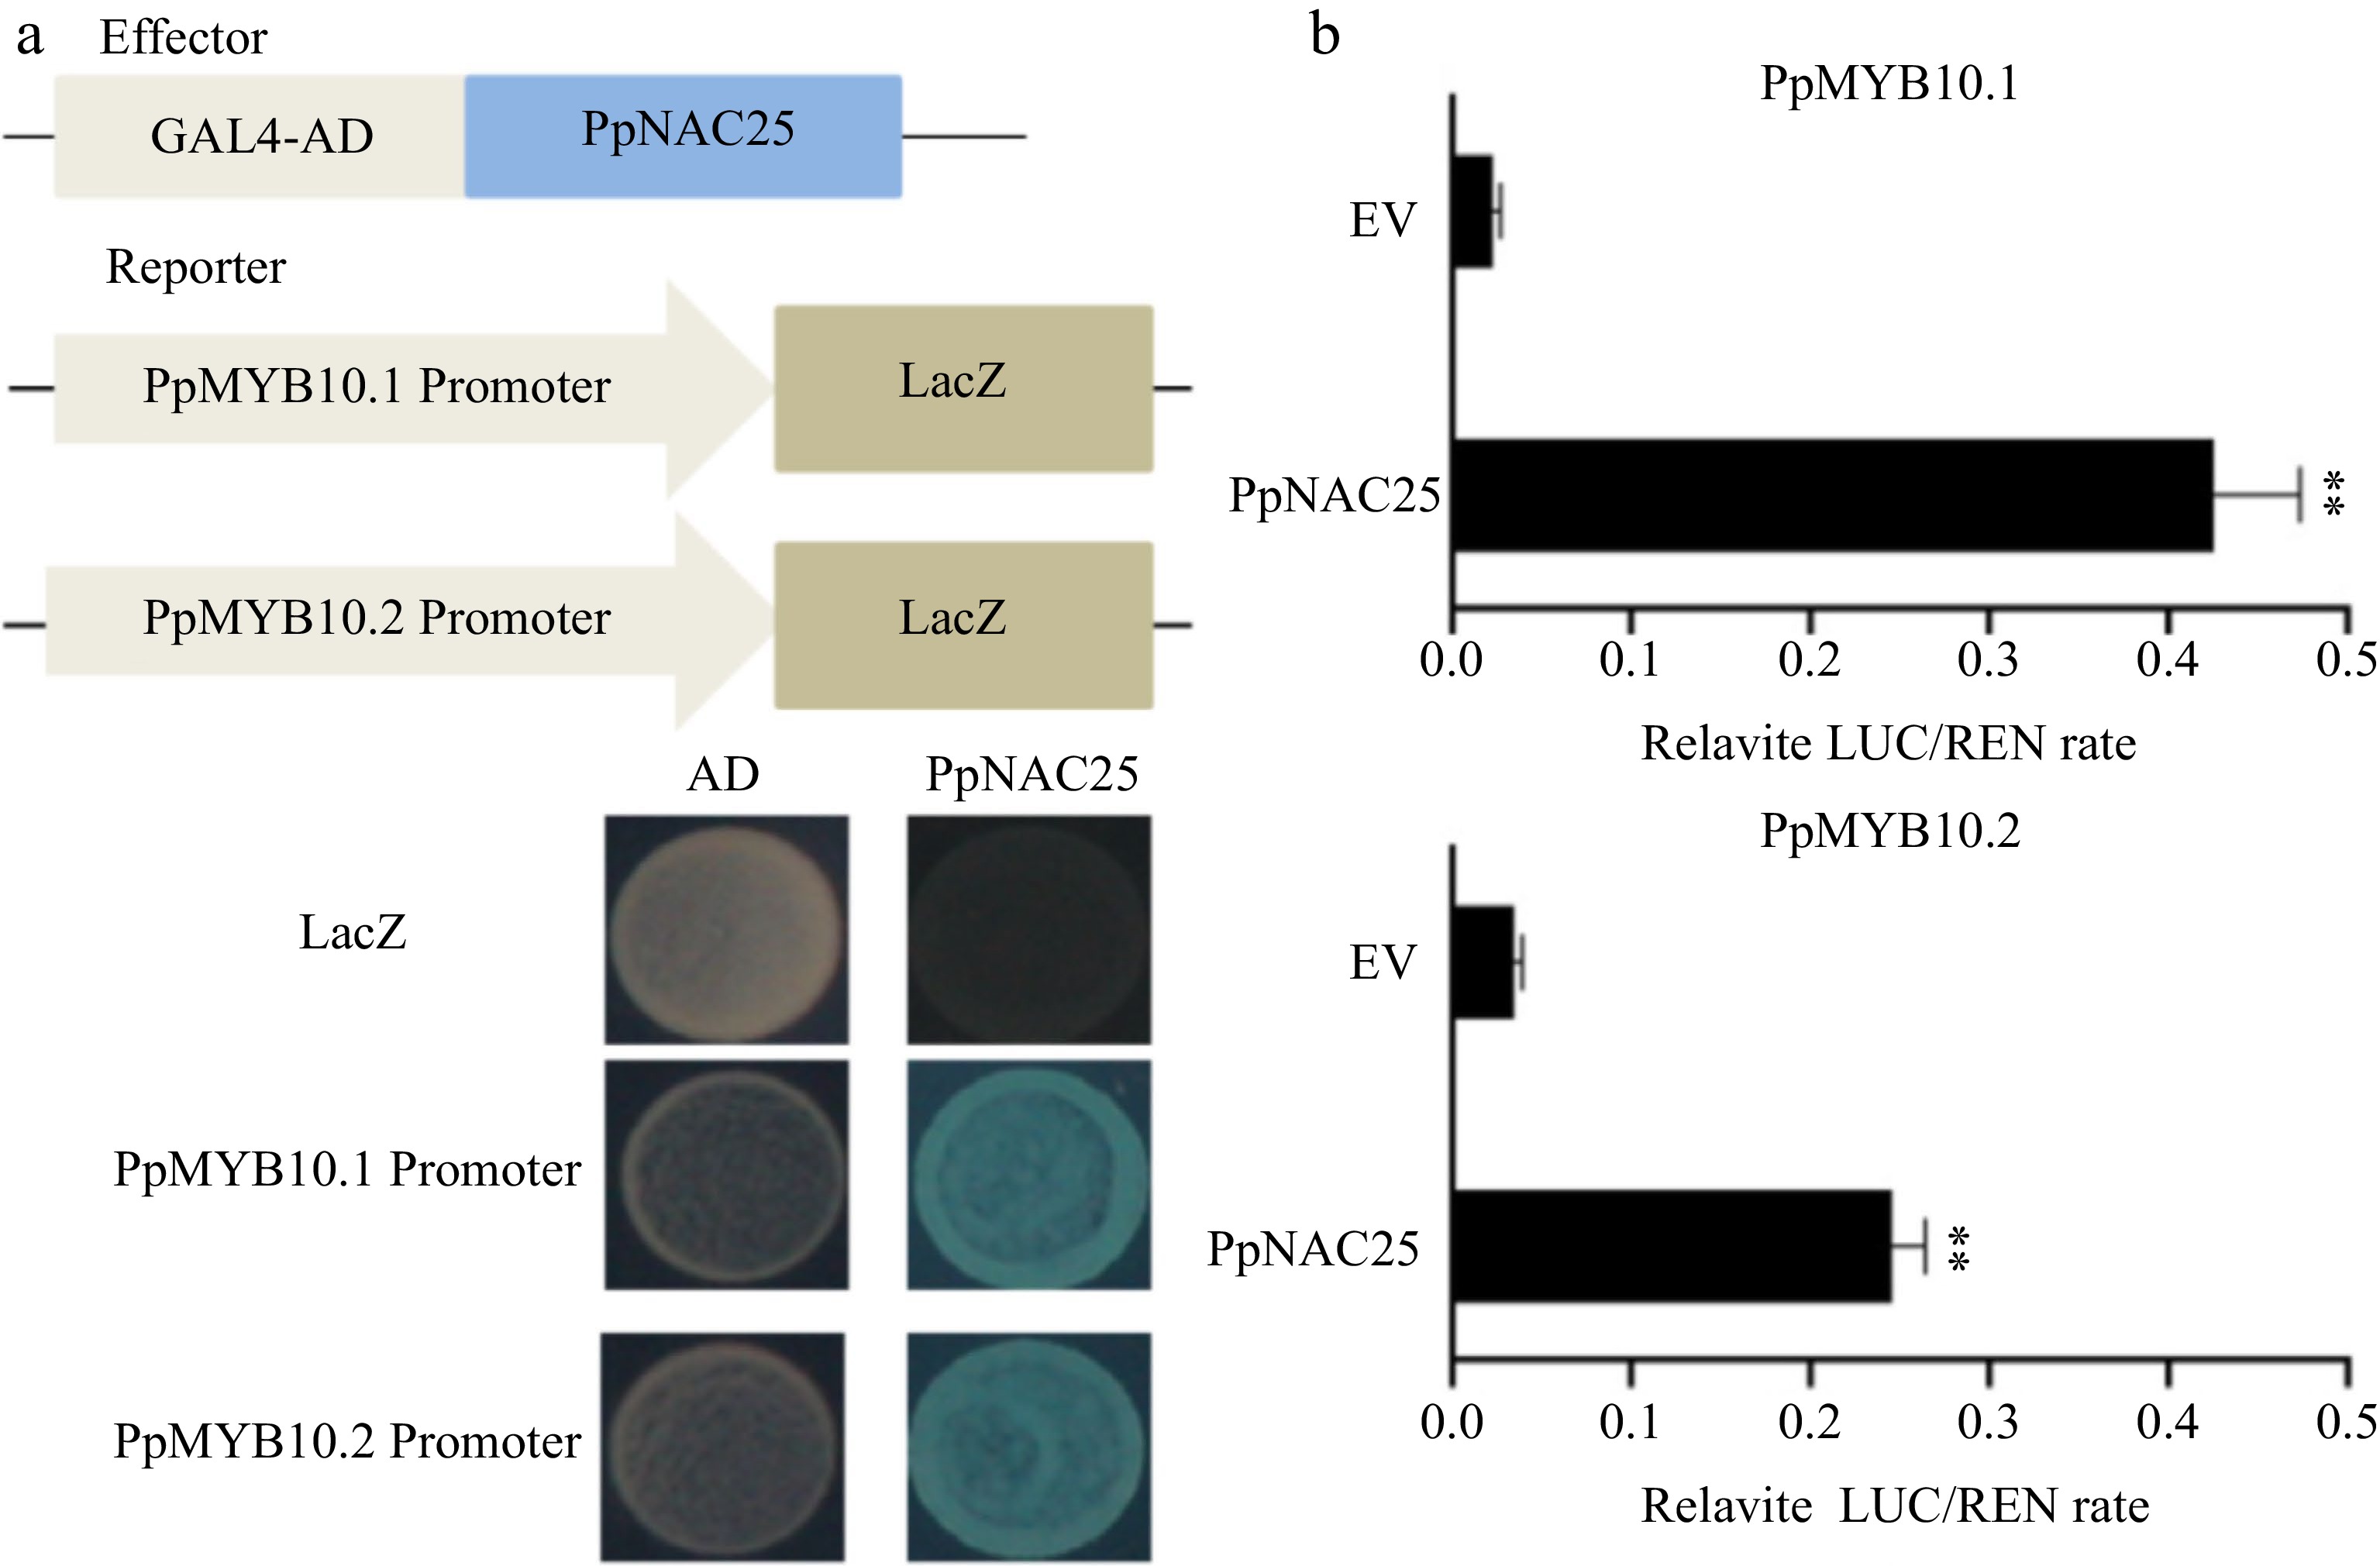
Figure 5.
PpMYB10.1 and PpMYB10.2 are targeted genes of PpNAC25. (a) The binding ability of PpNAC25 to the promoters of PpMYB10.1 and PpMYB10.2 using yeast one-hybrid assays. (b) Determination of PpMYB10.1 and PpMYB10.2 promoter activity induced by PpNAC25 using luciferase (LUC)/Renilla Luciferase (REN) assay. Asterisks indicate statistically significant differences (** P < 0.01, Student's t test, n ≥ 3).
-
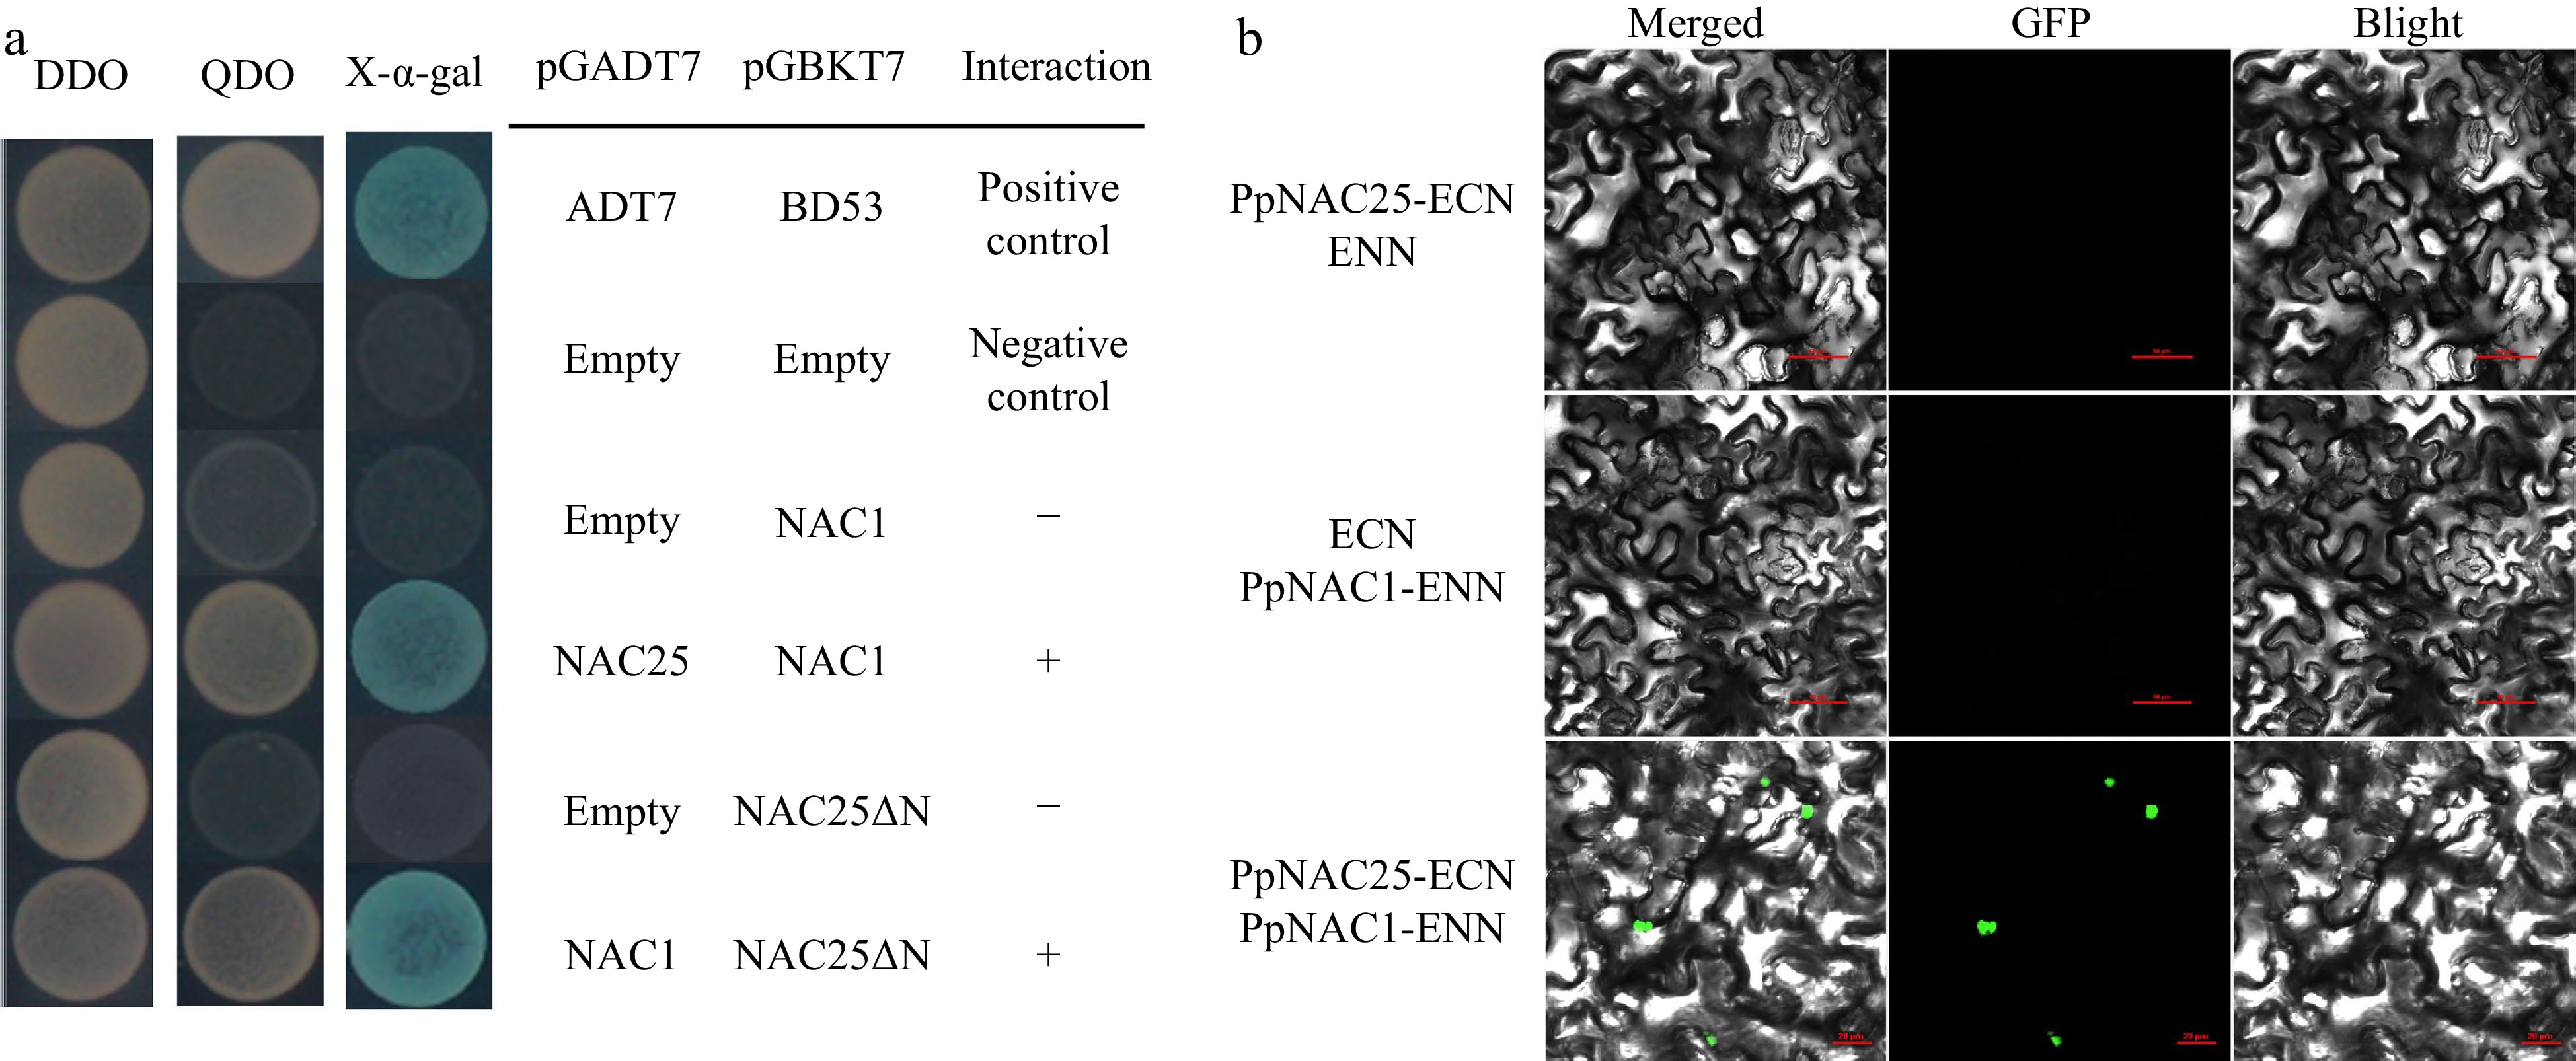
Figure 6.
Protein interactions of PpNAC25 and PpNAC1 were analyzed using (a) Y2H and (b) BiFC assay. DDO = SD/−TL. QDO = SD/−THLA.
Figures
(6)
Tables
(0)