-
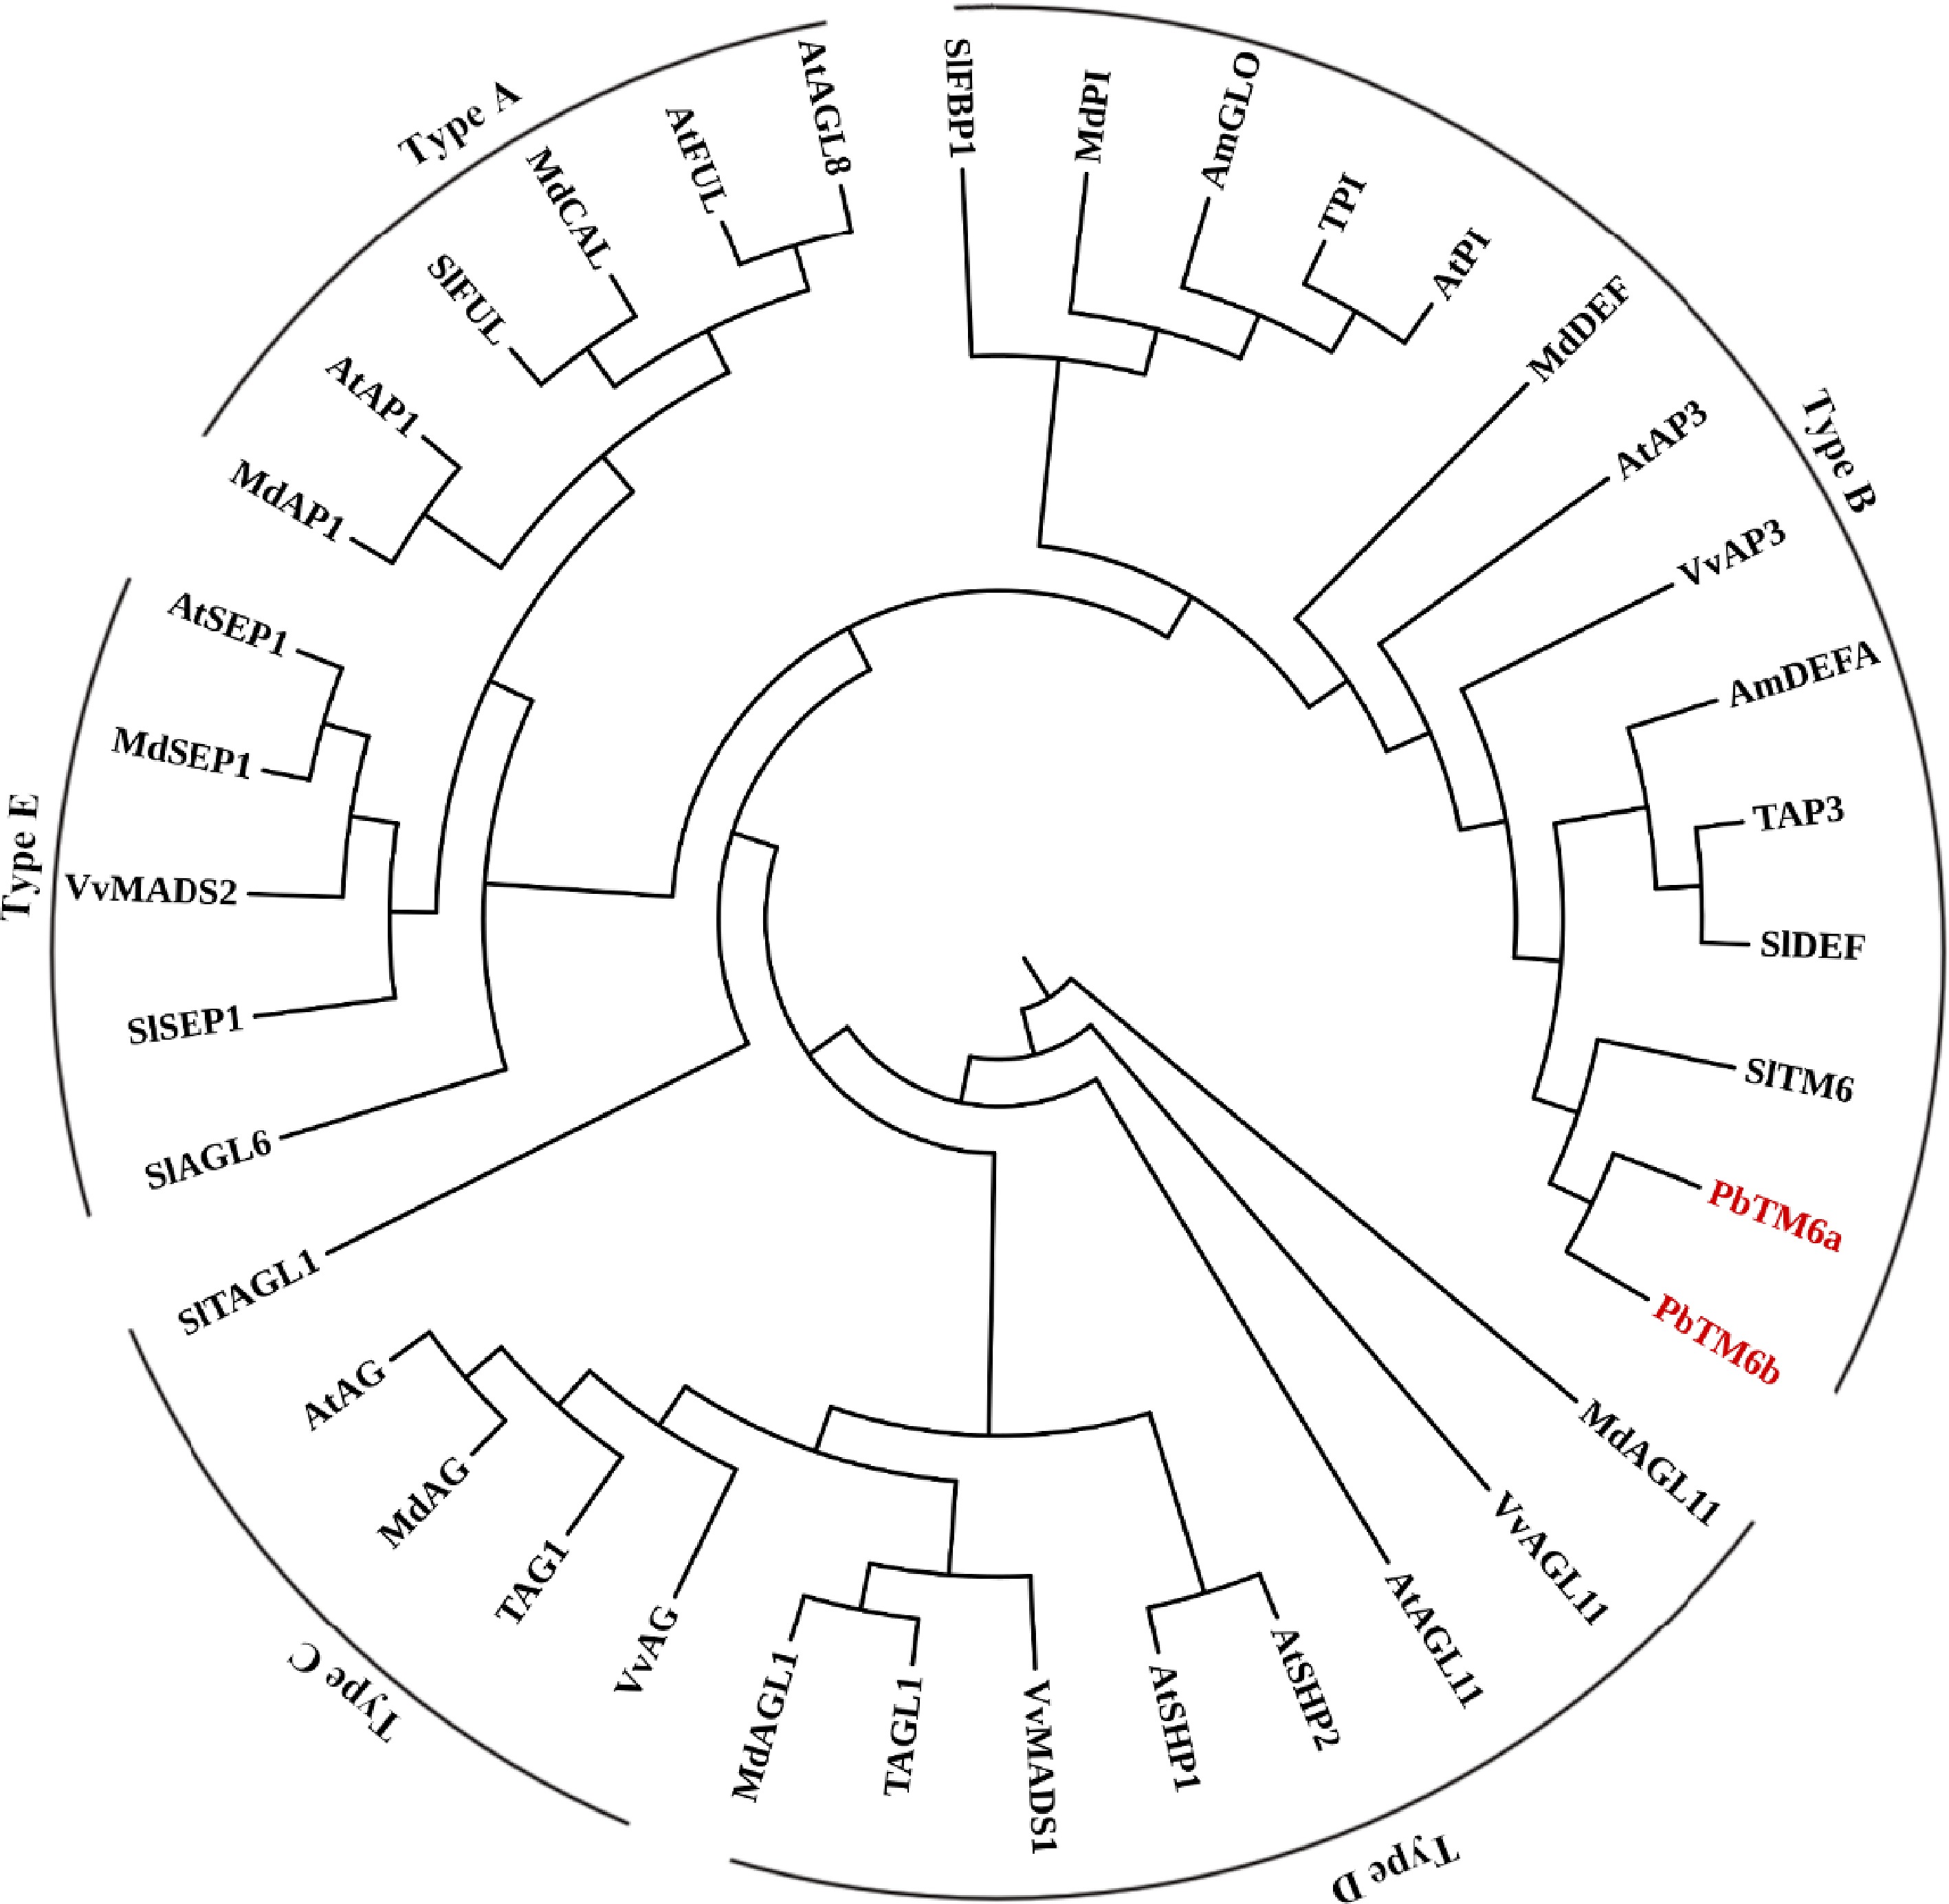
Figure 1.
Phylogenetic analysis of PbTM6 and other MADS box proteins involved in the classic ABCDE model.
-
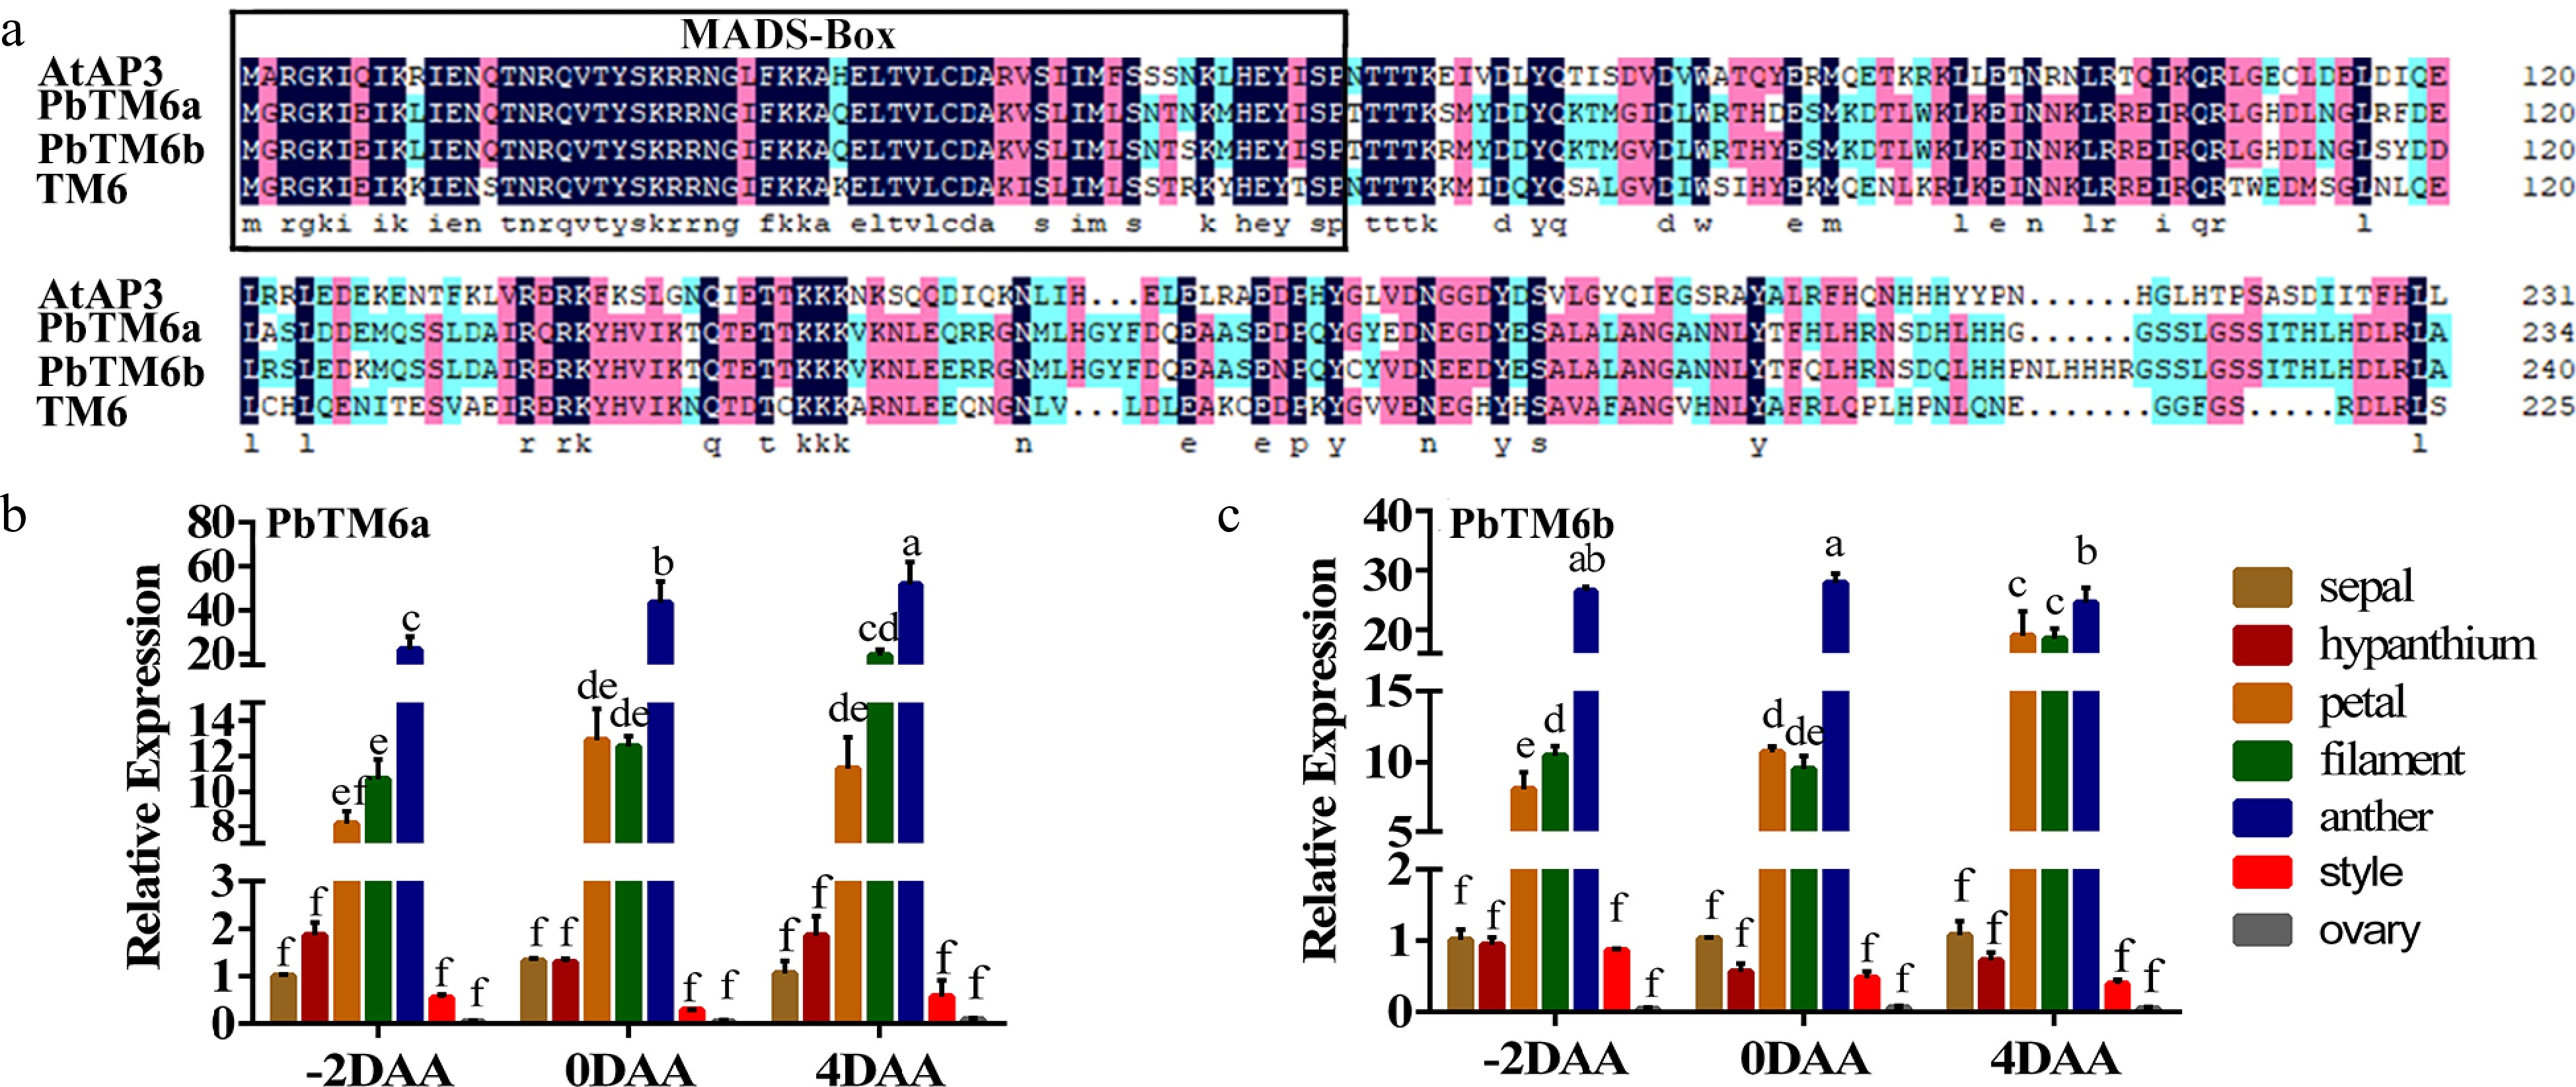
Figure 2.
(a) Amino acid sequence alignment of AtAP3, PbTM6a, PbTM6b, and TM6. MADS-box conserved domains are outlined in black. Expression of (b) PbTM6a and (c) PbTM6b in different floral organs of pear at different developmental stages. −2 DAA, 2 d before anthesis; 0 DAA, anthesis; 4 DAA, 4 d after anthesis. Data represents mean (± standard deviation (SD). Significant differences (P < 0.05) among treatments are determined by one-way analysis of variance (ANOVA), indicated with different lowercase letters.
-
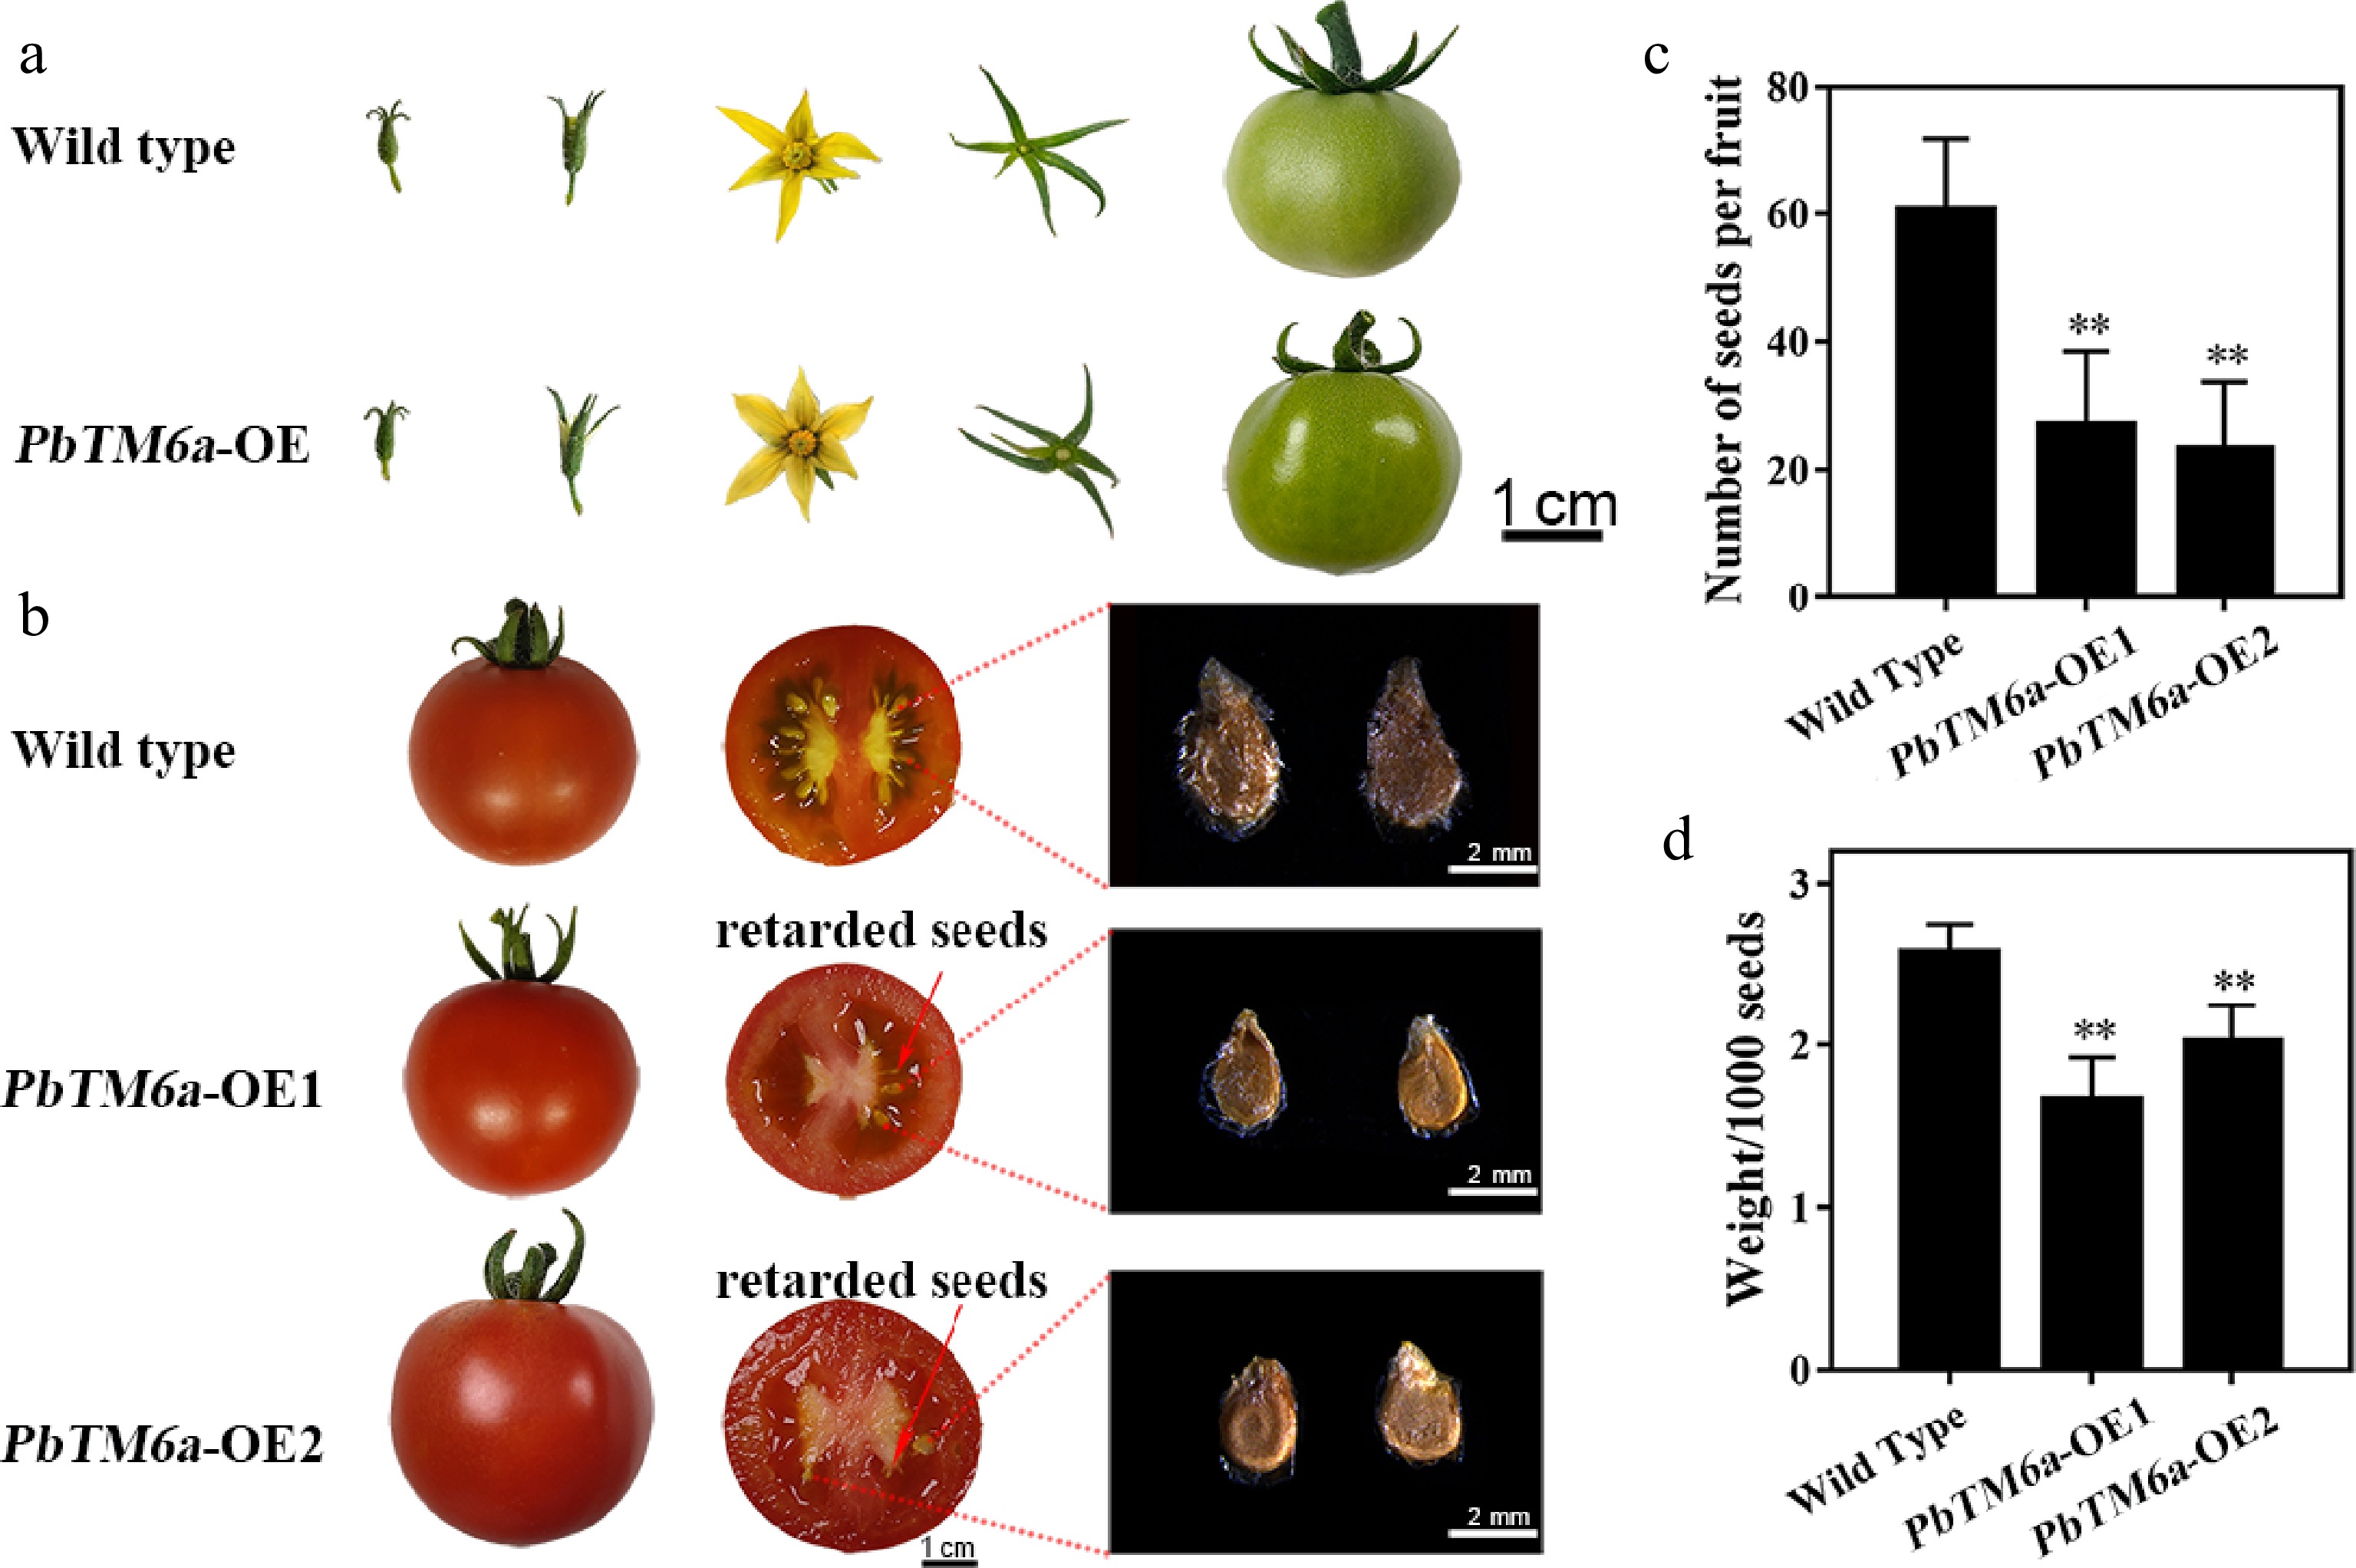
Figure 3.
Phenotypic analysis of wild type and transgenic tomato plants. (a) Comparison of the growth and development of tomato fruits and the structure of floral organs between the wild type and PbTM6a overexpression (PbTM6a-OE) lines. (b) Heterologous overexpression of PbTM6a decreases the number and size of tomato seeds. (c) Number of wild-type tomato plants and PbTM6a-OE lines. (d) Thousand seed weight of wild-type plants and PbTM6a-OE lines. Data represents mean (± standard deviation (SD). Significant differences (P < 0.05) among treatments are determined by one-way analysis of variance (ANOVA), indicated with different lowercase letters.
-
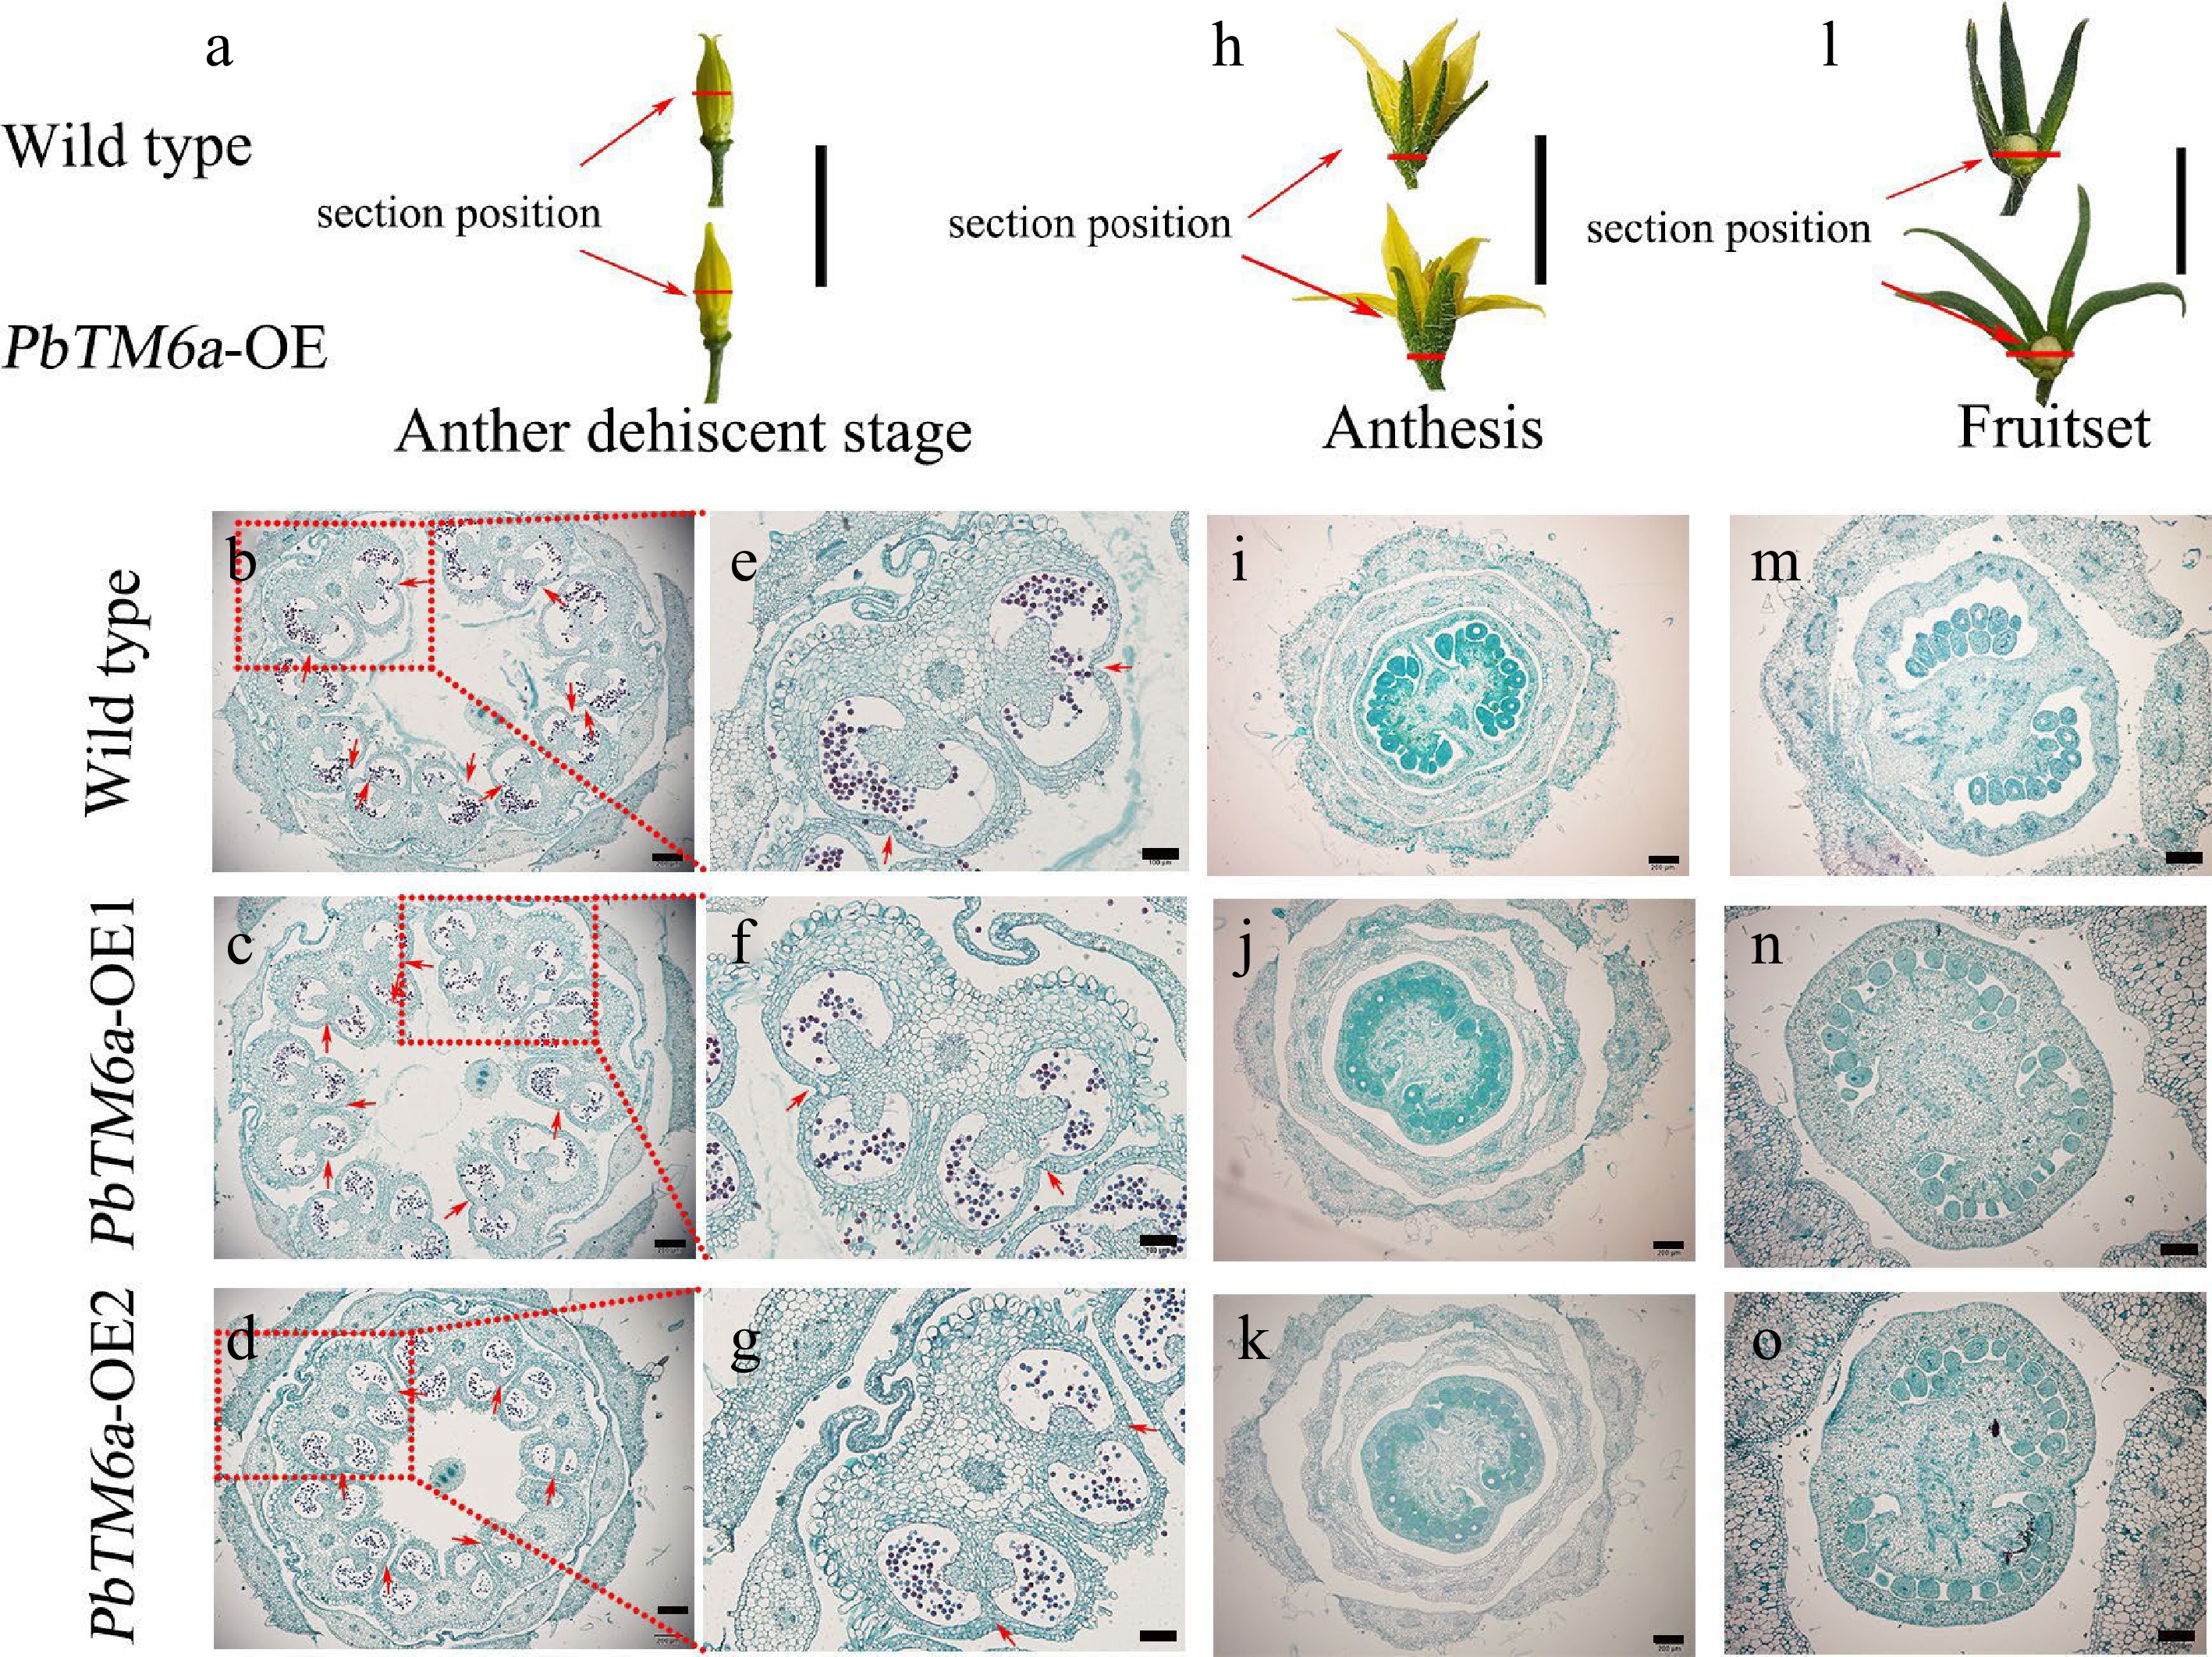
Figure 4.
Morphological and histological observations of floral organs collected from wild type plants and PbTM6a-OE lines. Red lines indicate the section position. (a) Stamens of wild type plants and PbTM6a-OE lines after sepals removed at the anther dehiscence stage. (b)−(d) Histological analysis of anthers of the wild type plants and PbTM6a-OE lines. (e)−(g) Further analysis of anthers shown in (b)−(d). Arrows indicate the position of stomium. (h) Morphology of wild type and PbTM6a-OE flowers at anthesis. (i)−(k) Histological analysis of the cross-section of flowers shown in (h). (l) Analysis of the small tomato fruit of wild-type plants and PbTM6a-OE lines after fruit set. (m)−( o) Histological analysis of the cross-section of ovary shown in (l). Scale bars: 2 cm in (a), (h),( l); 200 µm in (b), (c), (d), (i), (j), (k), (m), (n), (o); 100 µm in (e), (f), (g).
-
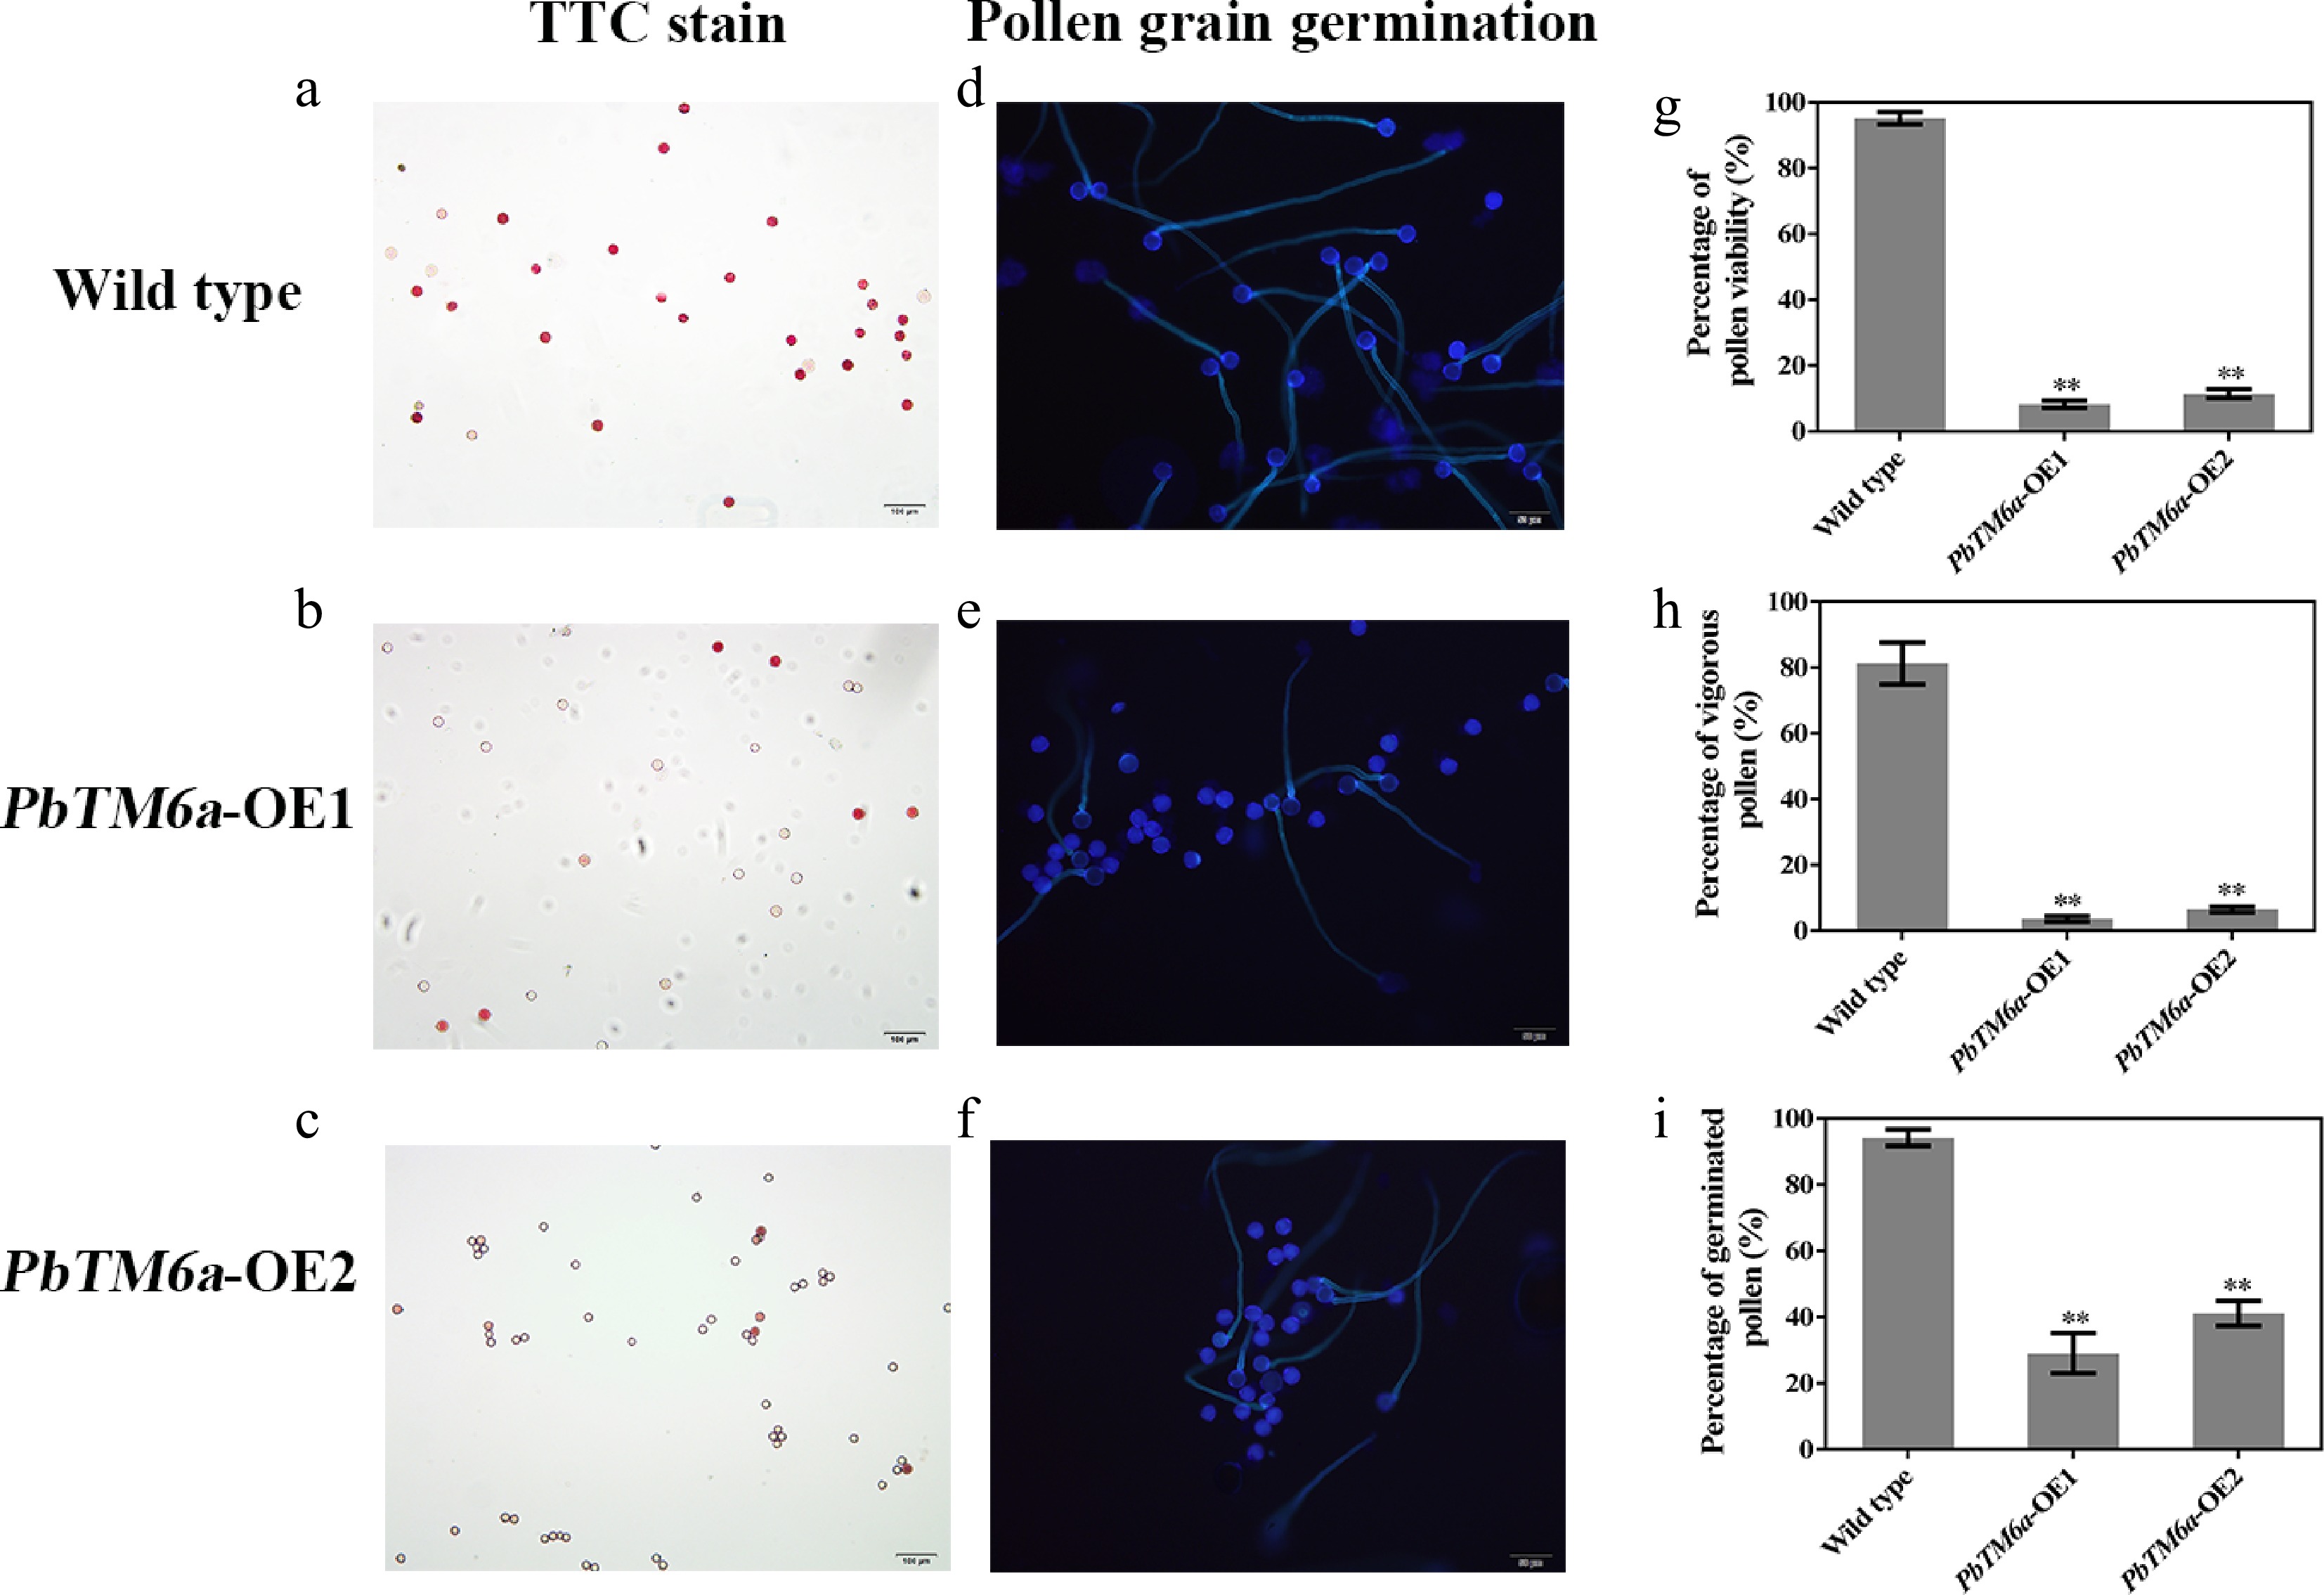
Figure 5.
Assessment of pollen vigor via the viability evaluated by TTC staining and germination in vitro. (a)−(c) Visualization of pollen viability of PbTM6a-OE lines and wild-type plants in vitro by TTC staining. (d)−(f) Evaluation of PbTM6a-OE and wild-type pollen germination in vitro under a fluorescence microscope. Statistics of the percentage of (g) pollen viability, (h) vigorous pollen and (i) pollen germination rate (i) in PbTM6a-OE lines and wild-type plants. Data represents mean (± standard deviation (SD). Significant differences (P < 0.05) among treatments as determined by one-way analysis of variance (ANOVA), are indicated with different lowercase letters.
-
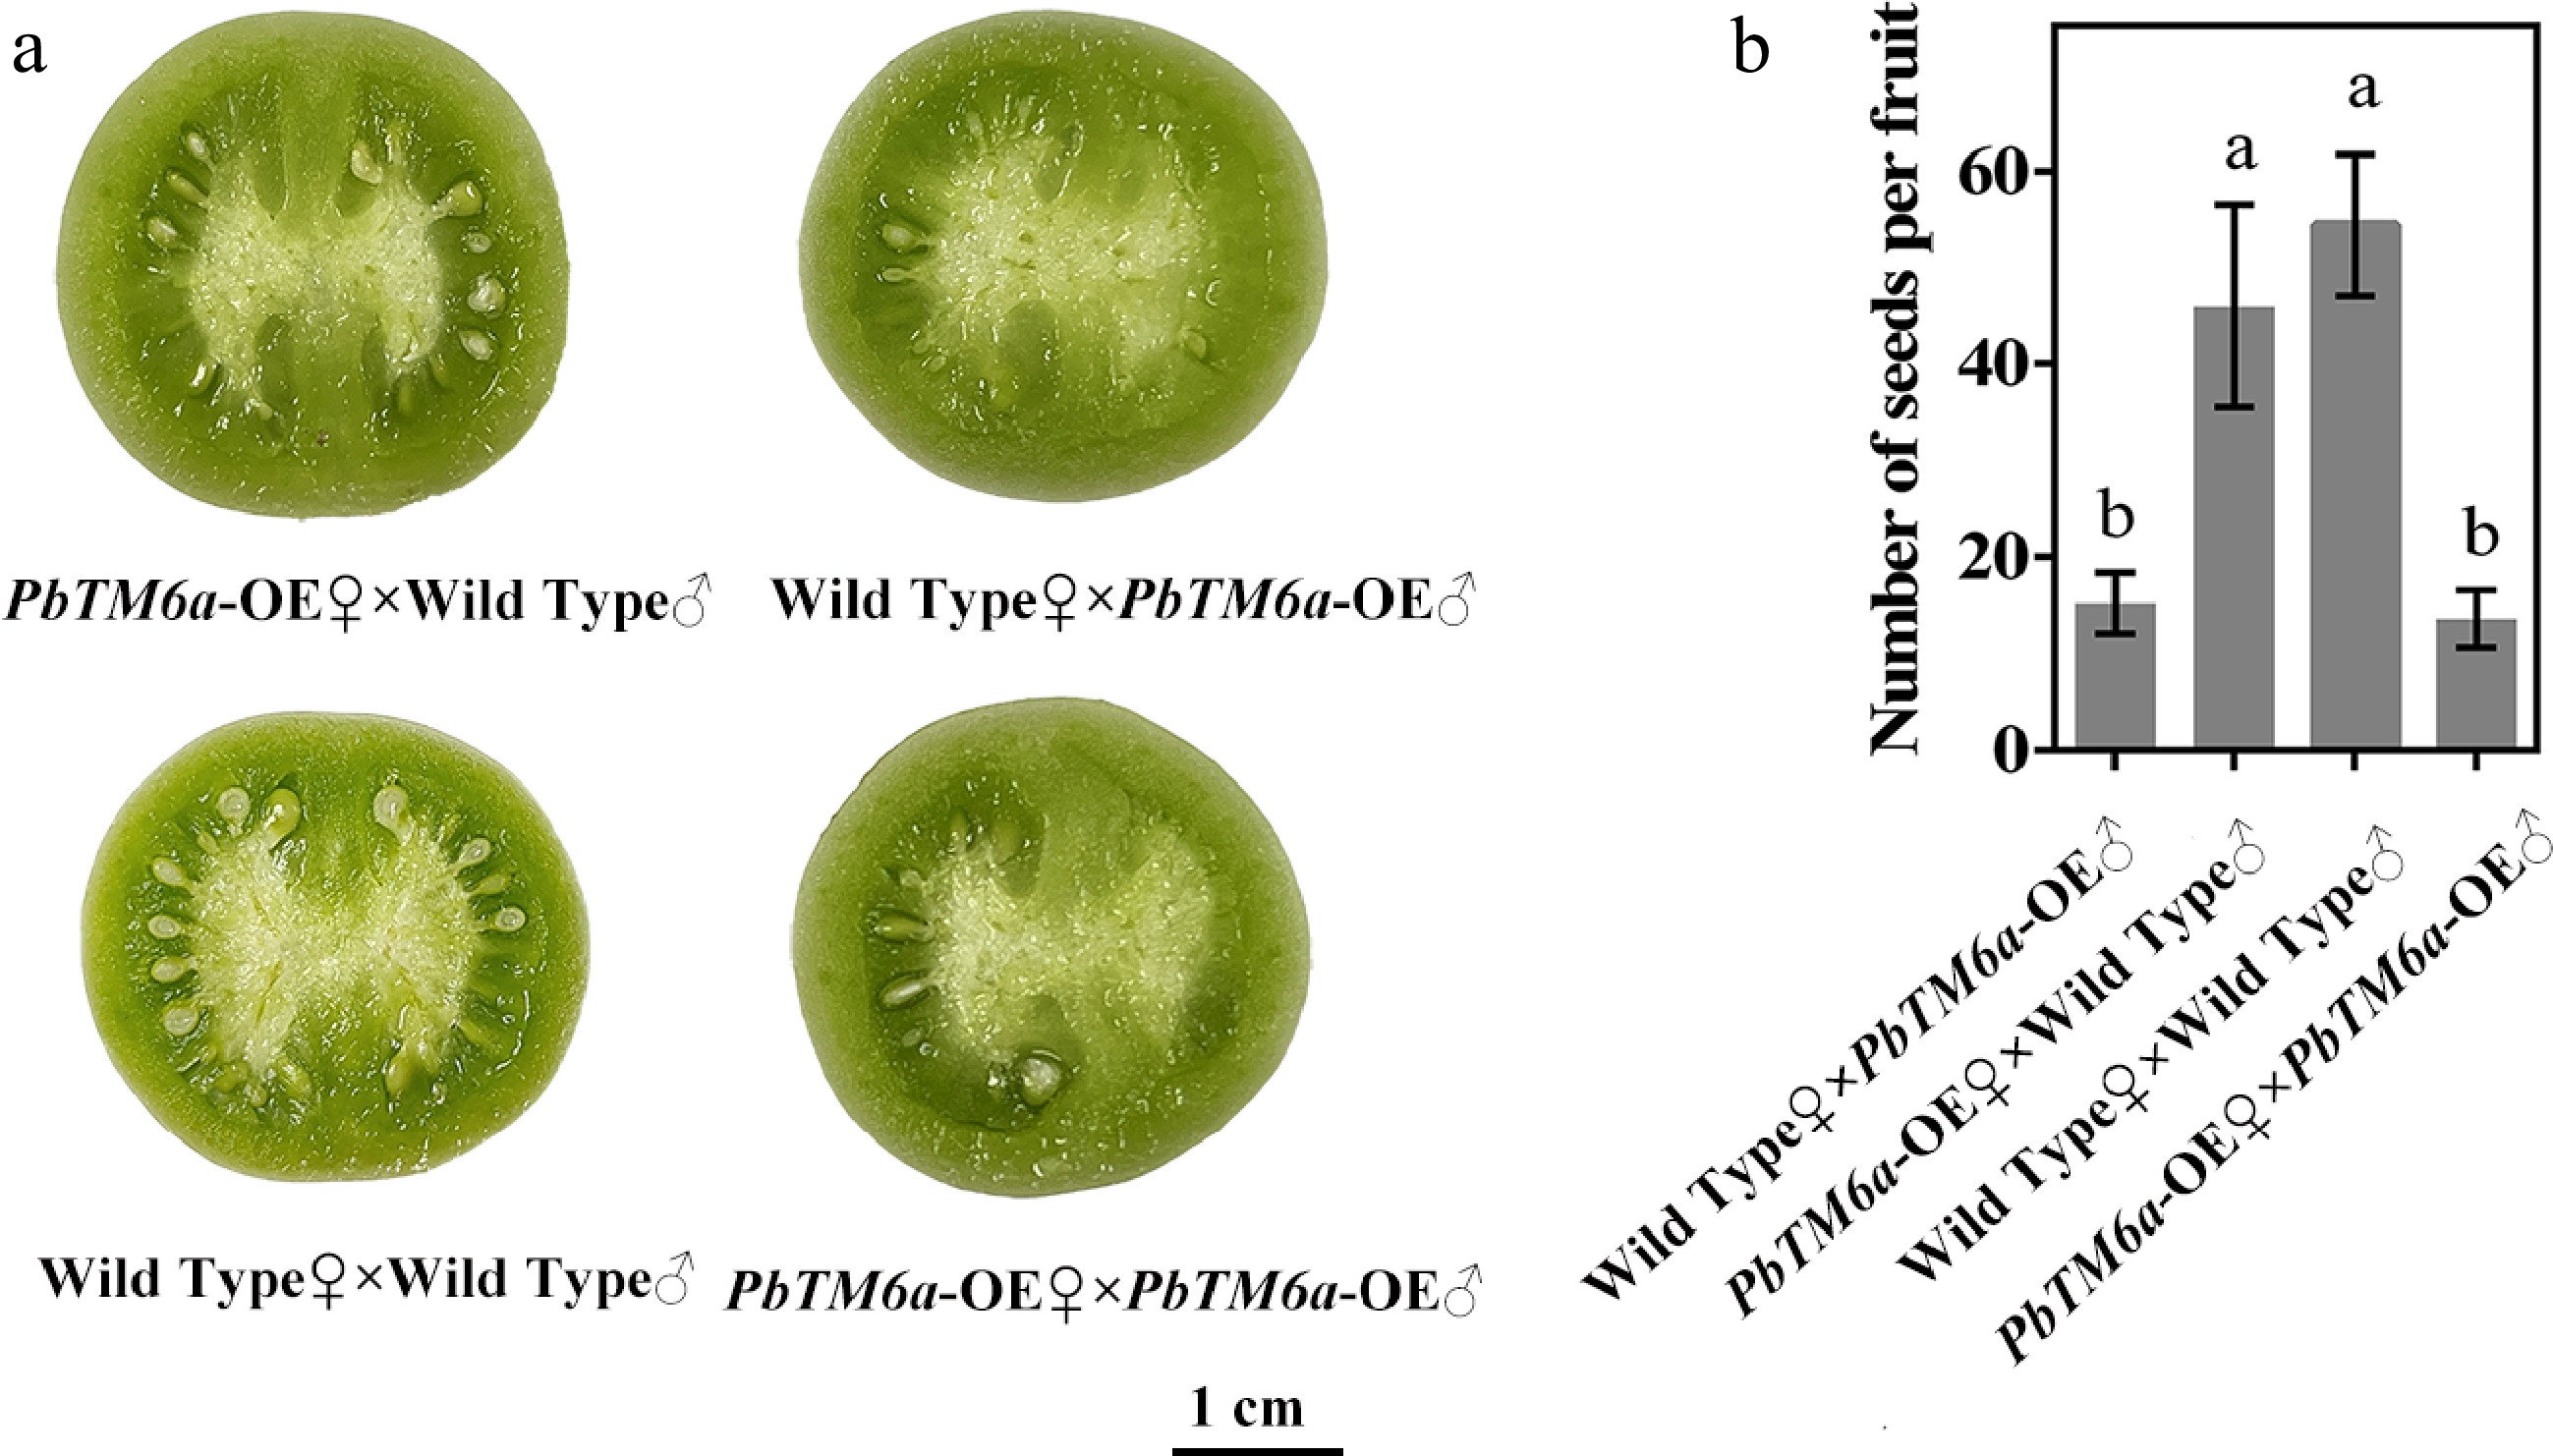
Figure 6.
Comparison of seed formation and seed number among the progeny of reciprocal crosses and self-pollinations. (a) Seed formation and (b) seed number per fruit produced by PbTM6a-OE (♀) × wild Type (♂) and wild Type (♀) × PbTM6a-OE (♂) reciprocal crosses and wild-type and PbTM6a-OE self-pollinationas. Data represents mean (± standard deviation (SD). Significant differences (P < 0.05) among treatments are determined by one-way analysis of variance (ANOVA), indicated with different lowercase letters.
-
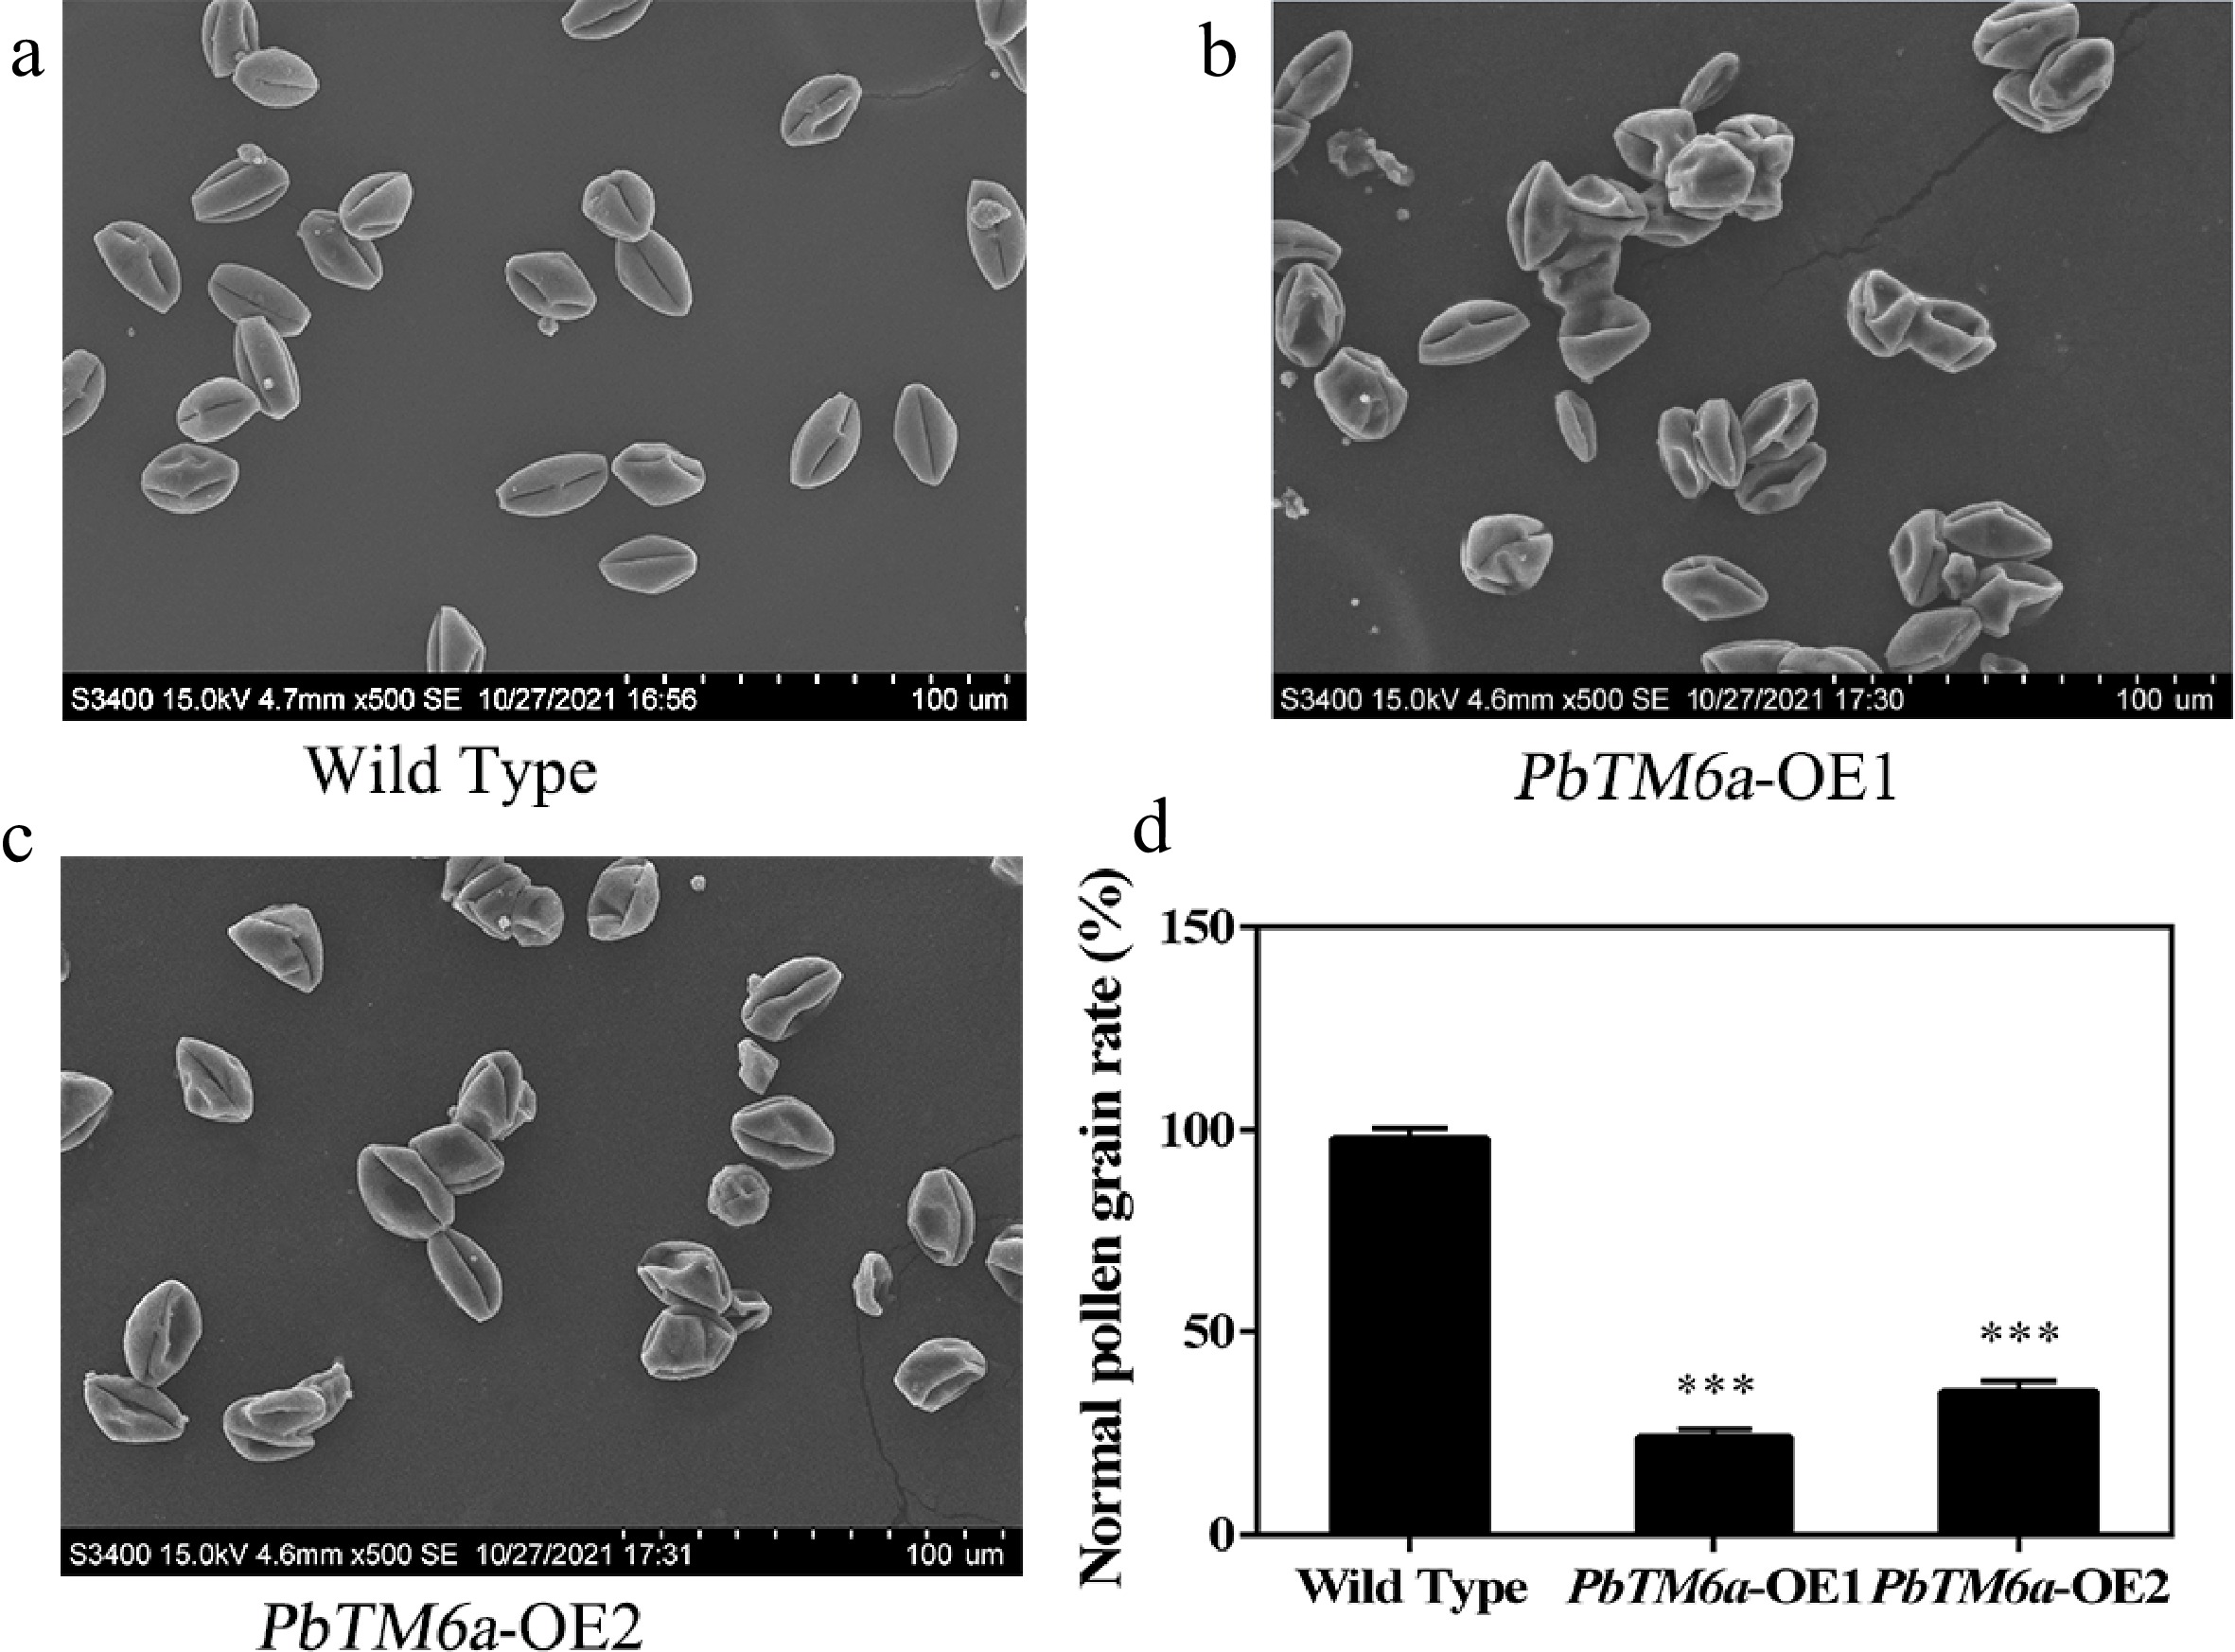
Figure 7.
Analysis of the morphology of wild-type and PbTM6a-OE pollen by scanning electron microscopy. (a) Overview of plump pollen grains of wild type. (b) Overview of plump pollen grains of PbTM6a-OE1. (c) Overview of plump pollen grains of PbTM6a-OE2. (d) Statistics of the percentage of pollen grain with normal surface in wild-type and PbTM6a-OE lines. Data represents mean (± standard deviation (SD) and asterisks represents significant differences (P < 0.01) as determined by one-way ANOVA.
-
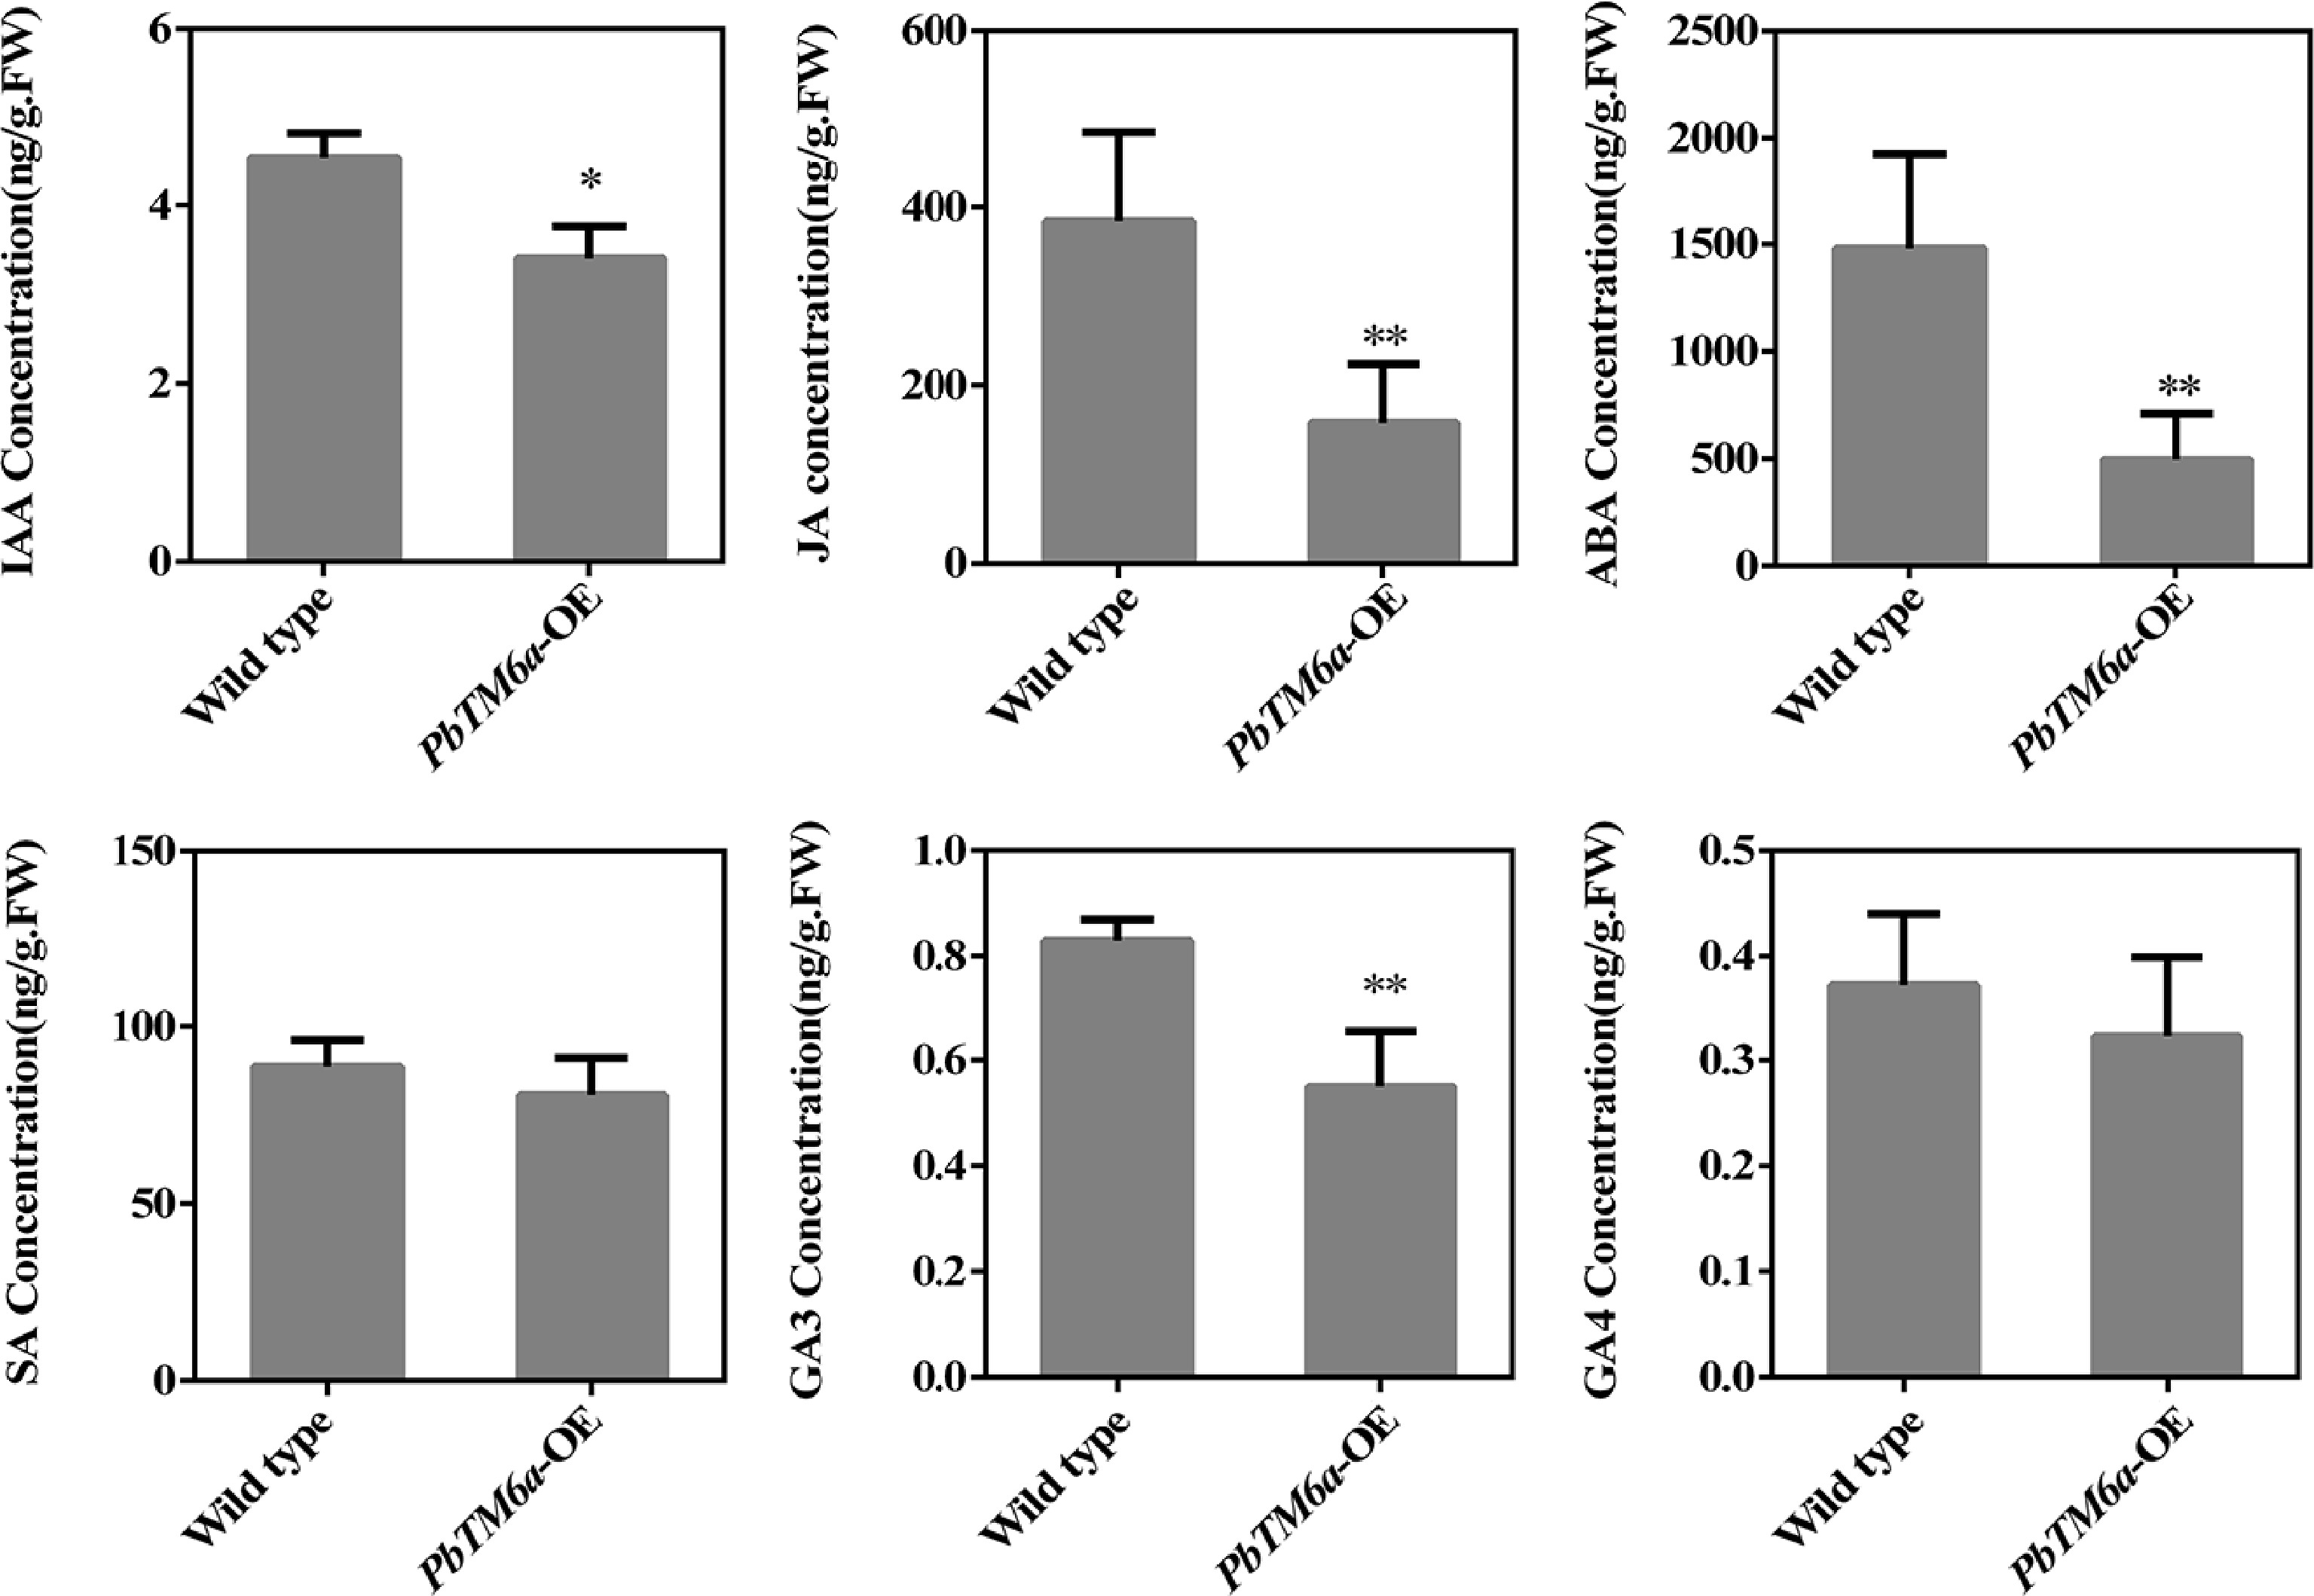
Figure 8.
Levels of IAA, JA, SA, ABA, SA, GA3, and GA4 in wild-type and PbTM6a-OE stamens. Data represents mean (± standard deviation (SD). Asterisks represents significant differences (P < 0.05) as determined by one-way ANOVA.
Figures
(8)
Tables
(0)