-
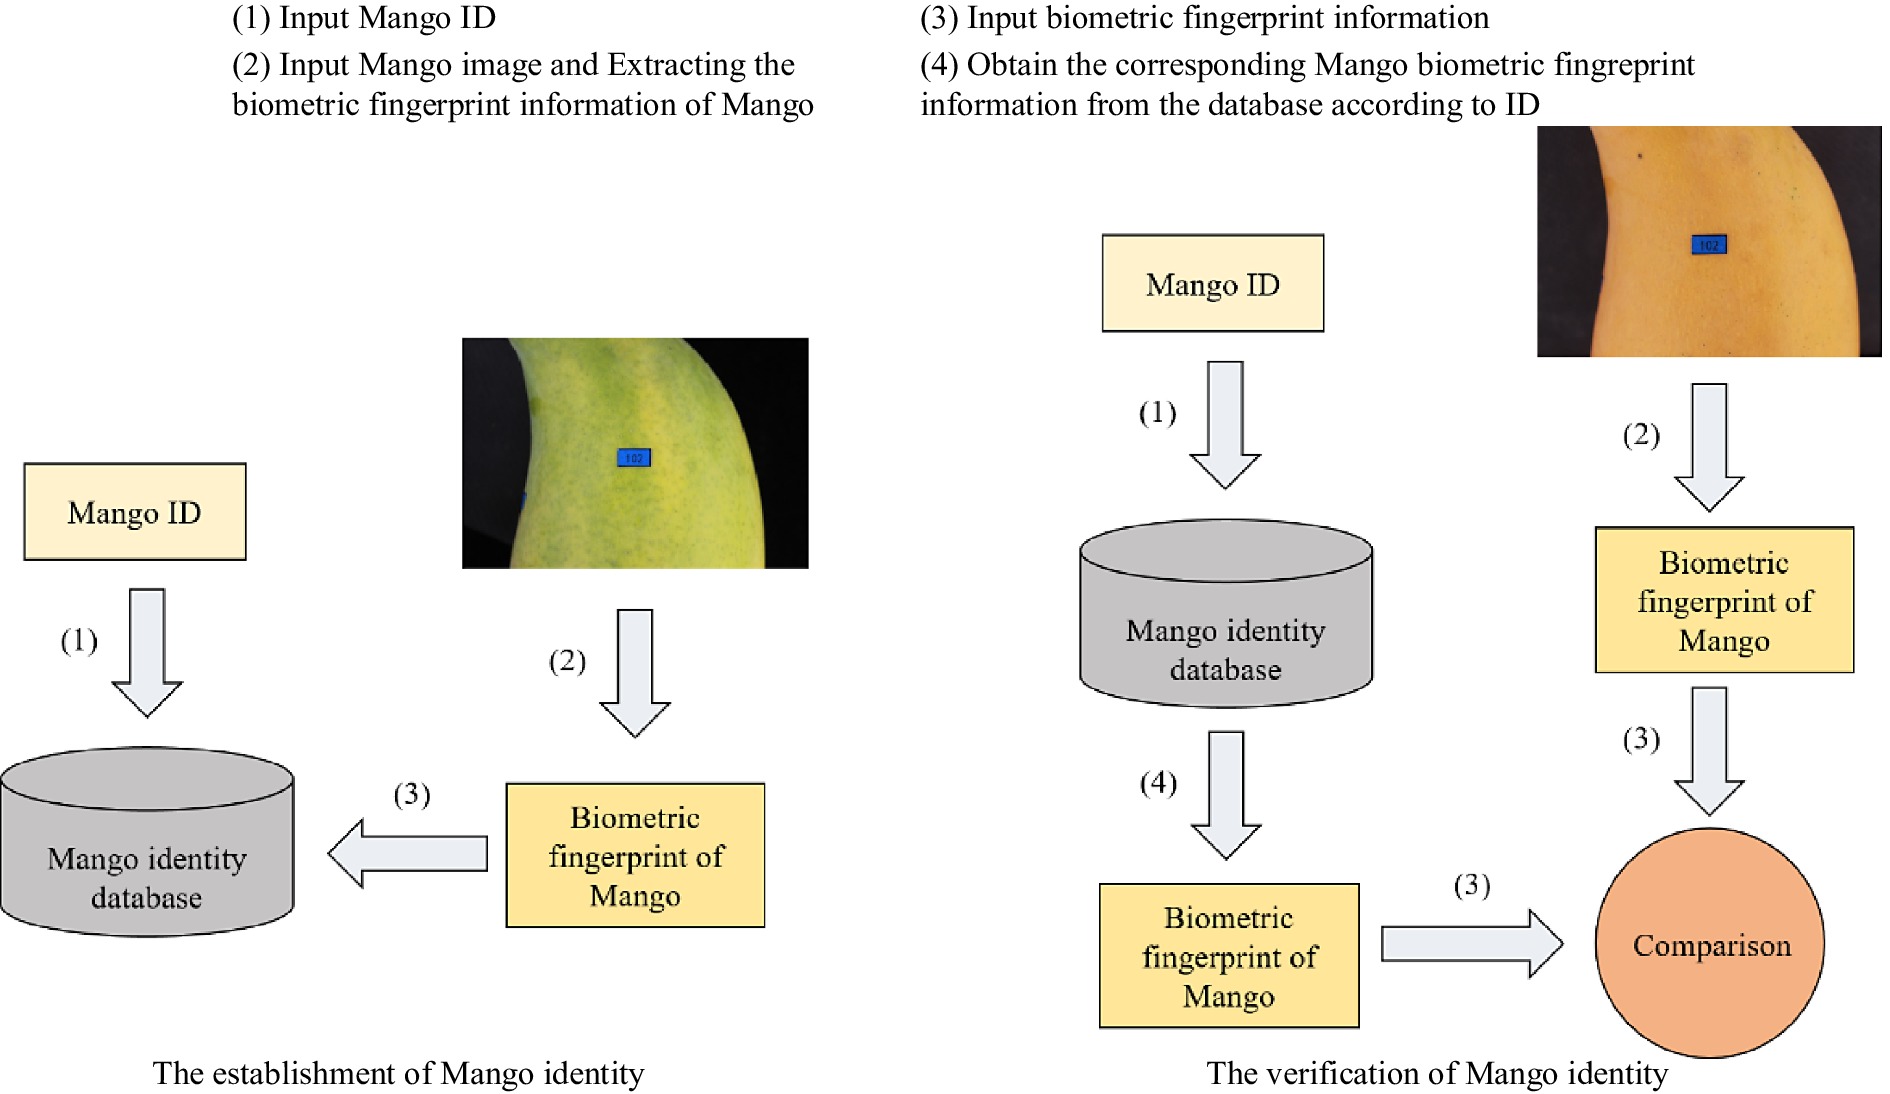
Figure 1.
Mango individual identity anti-counterfeiting system based on biometric fingerprints.
-
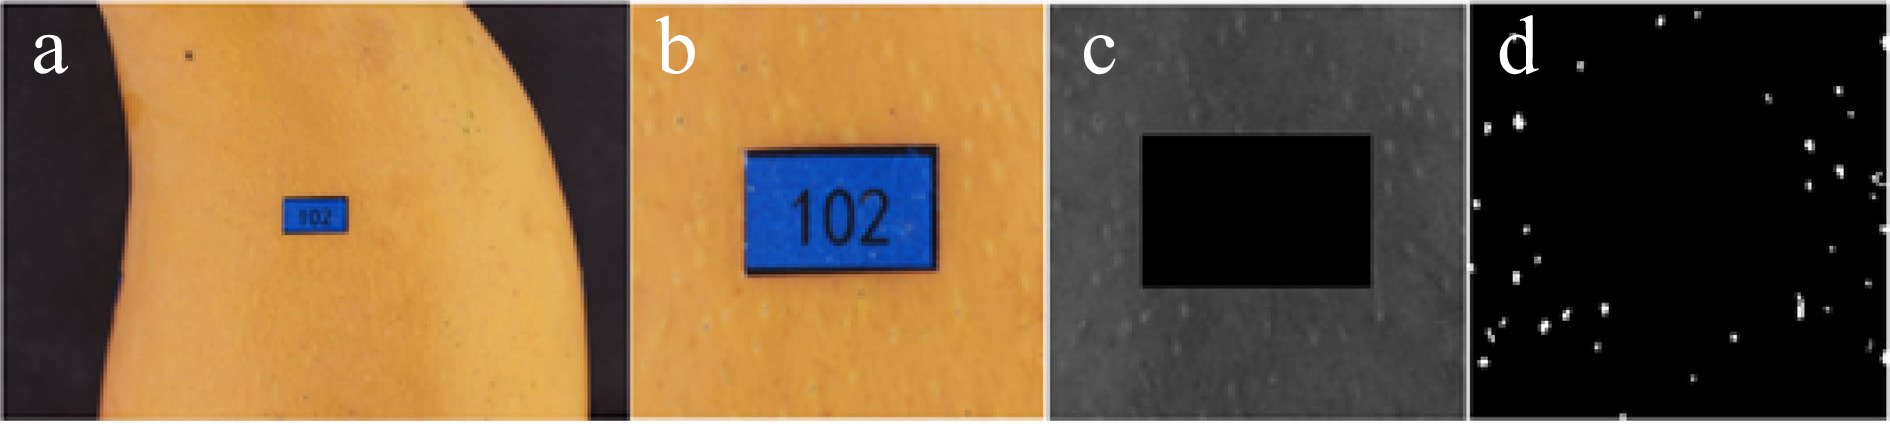
Figure 2.
Image processing. (a) Original image. (b) Scale normalized image. (c) Gray normalized image. (d) Binary image.
-
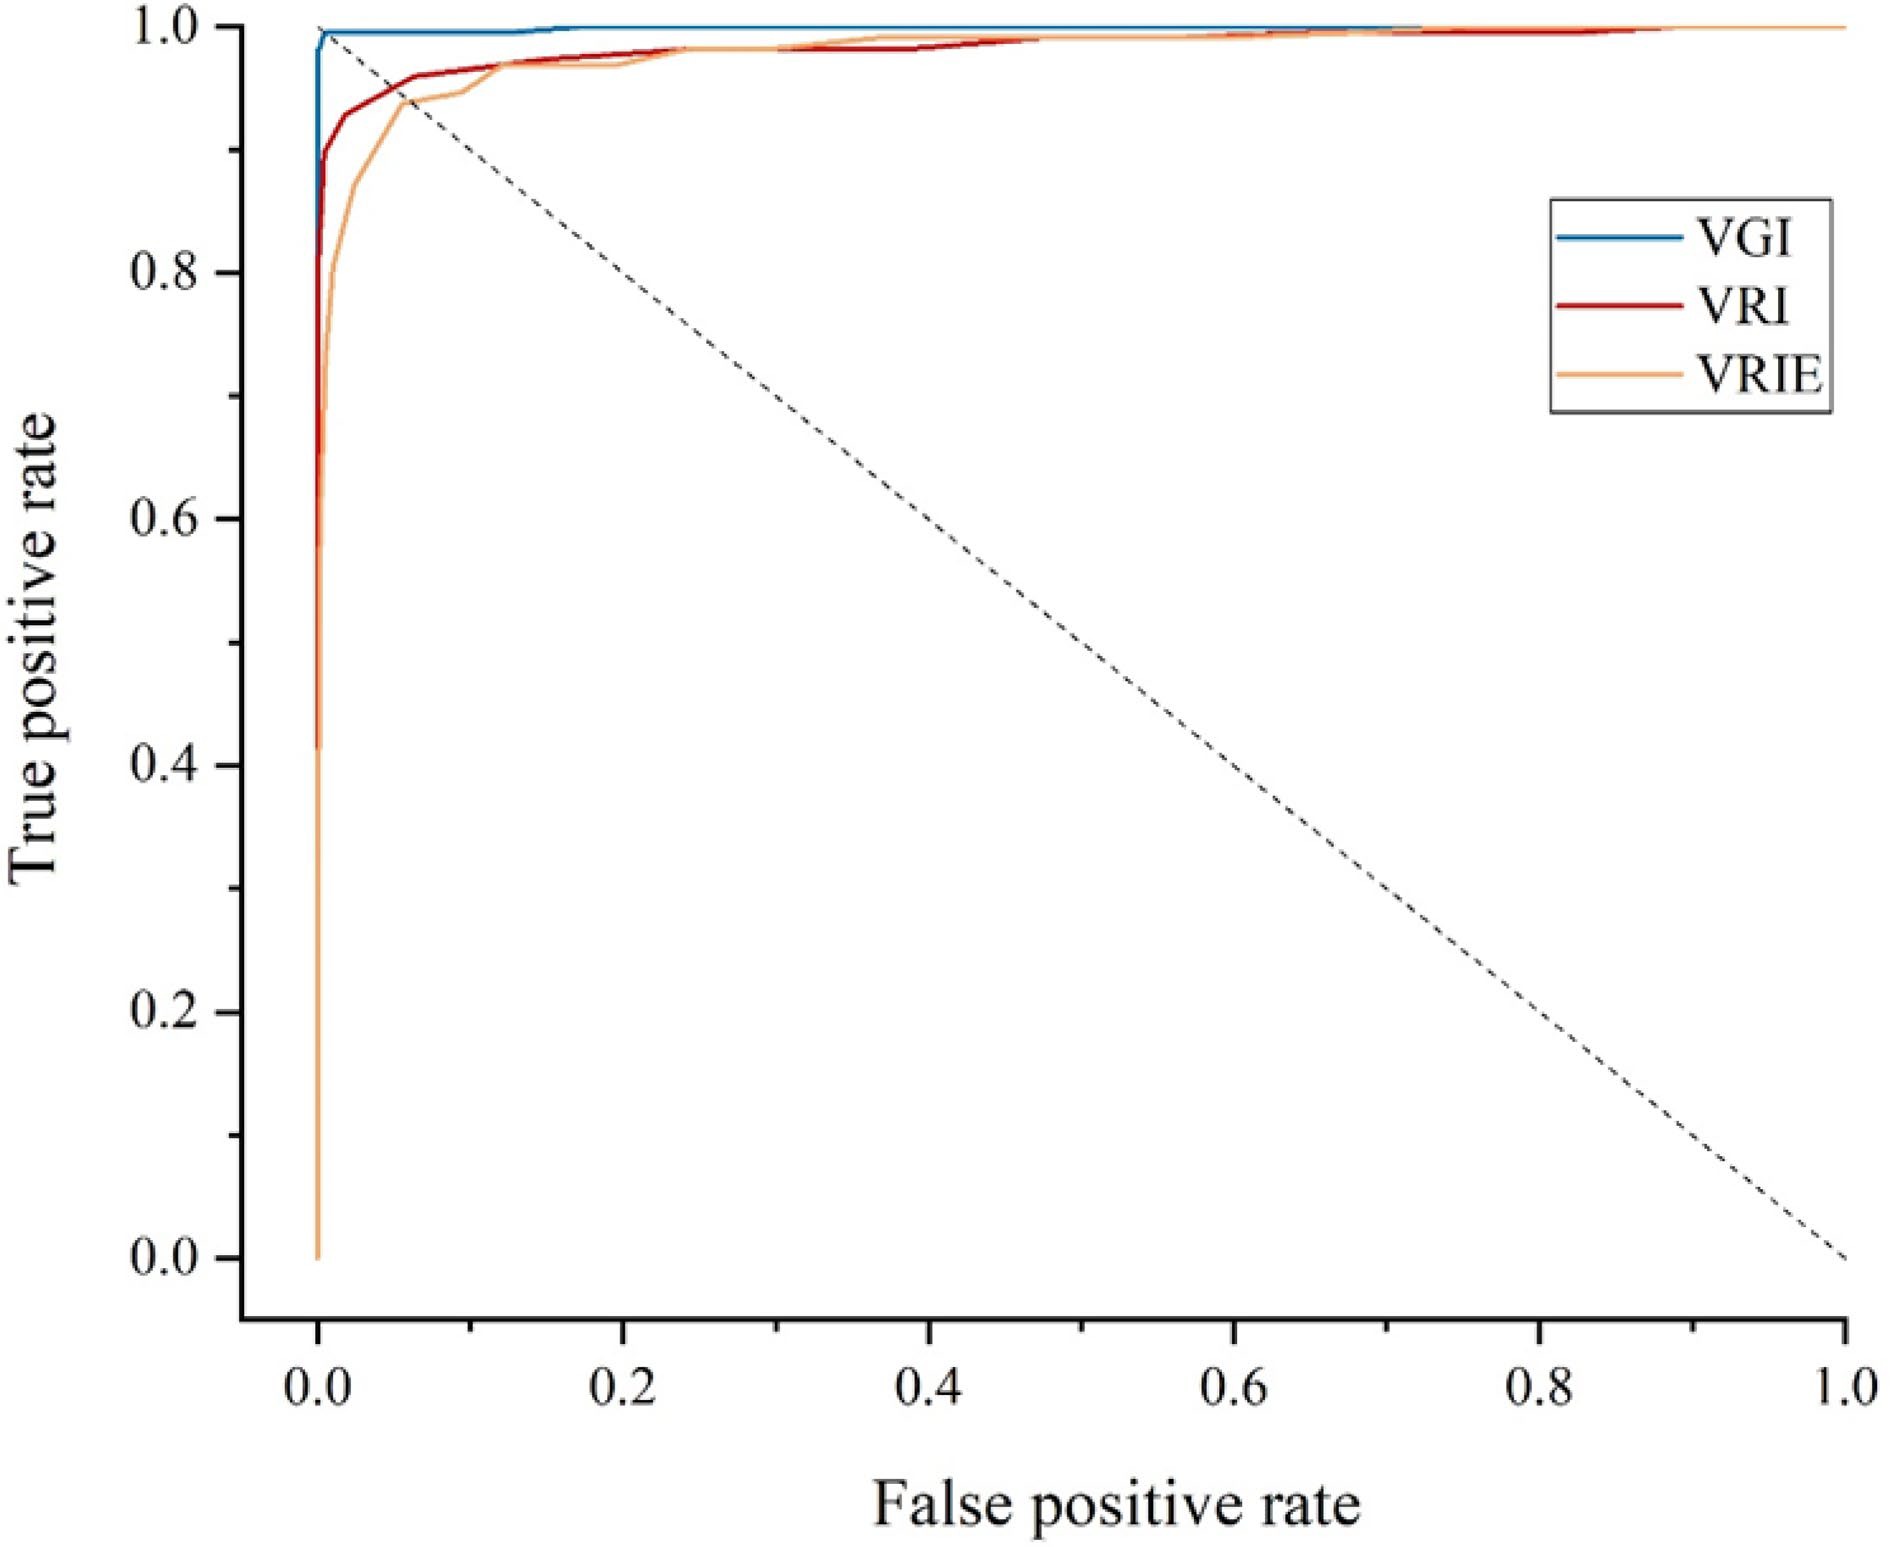
Figure 3.
The ROC curves of conventional mango identification methods.
-
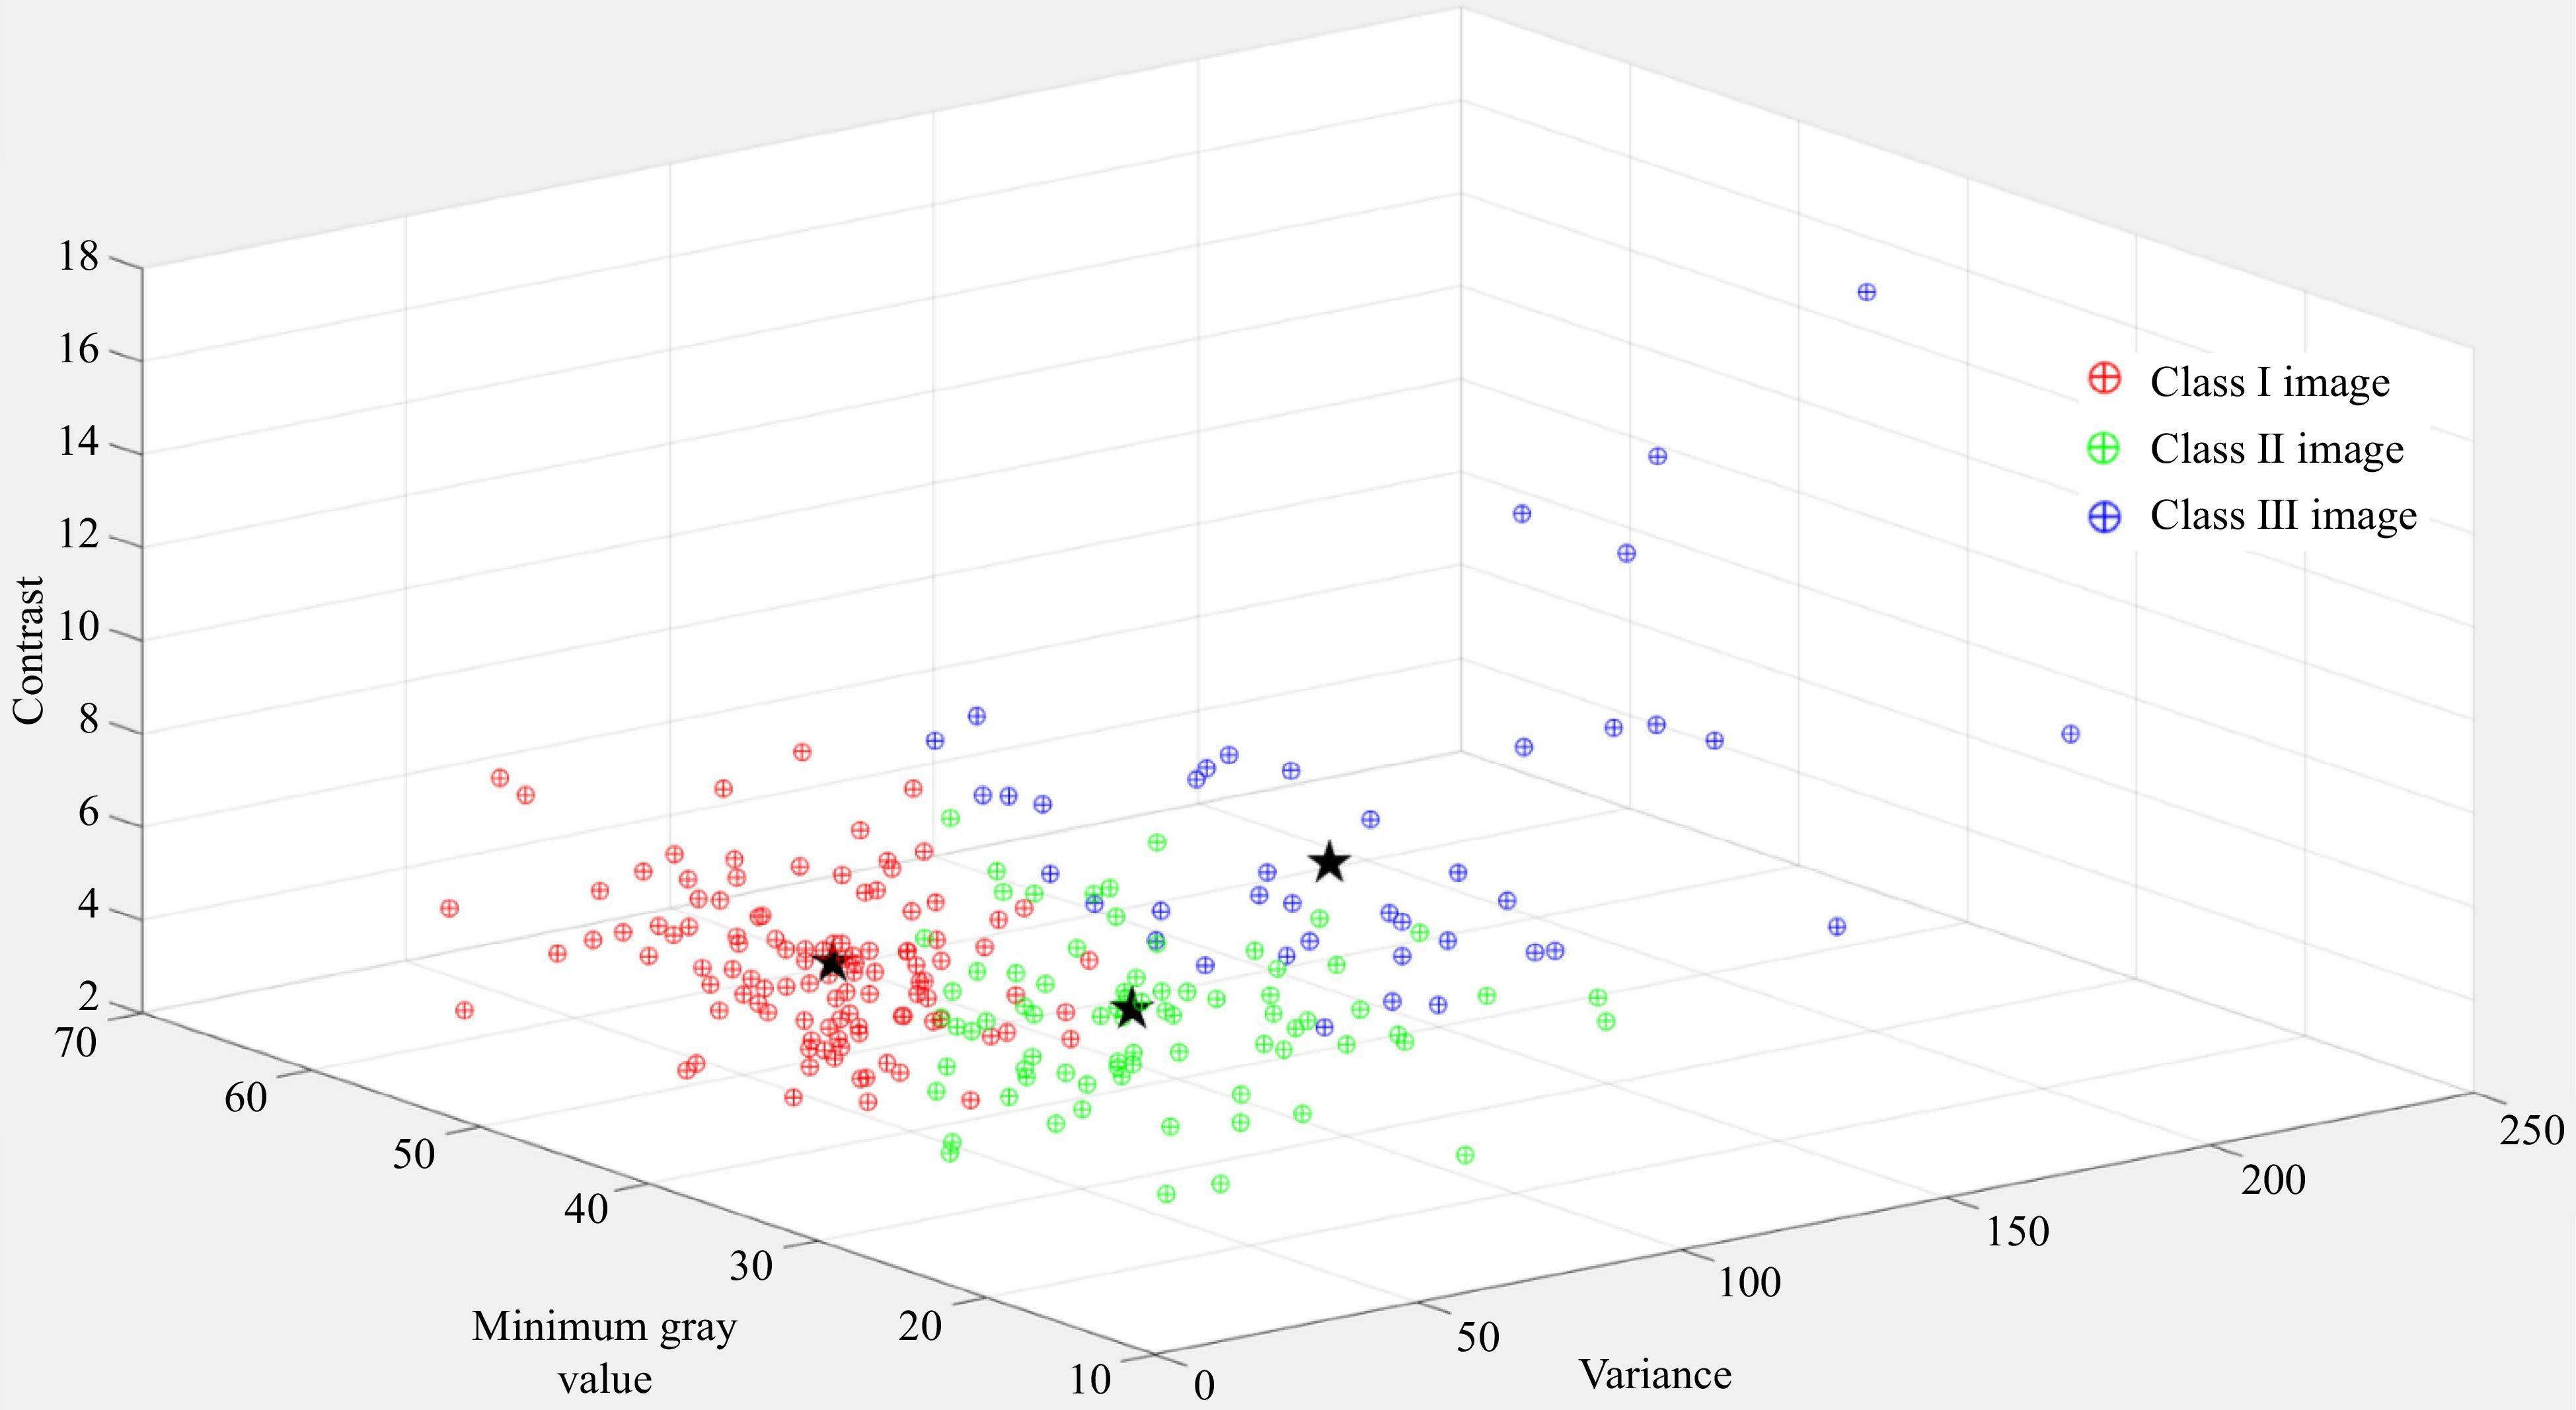
Figure 4.
Fuzzy C-means clustering and clustering center of 350 normalized images.
-
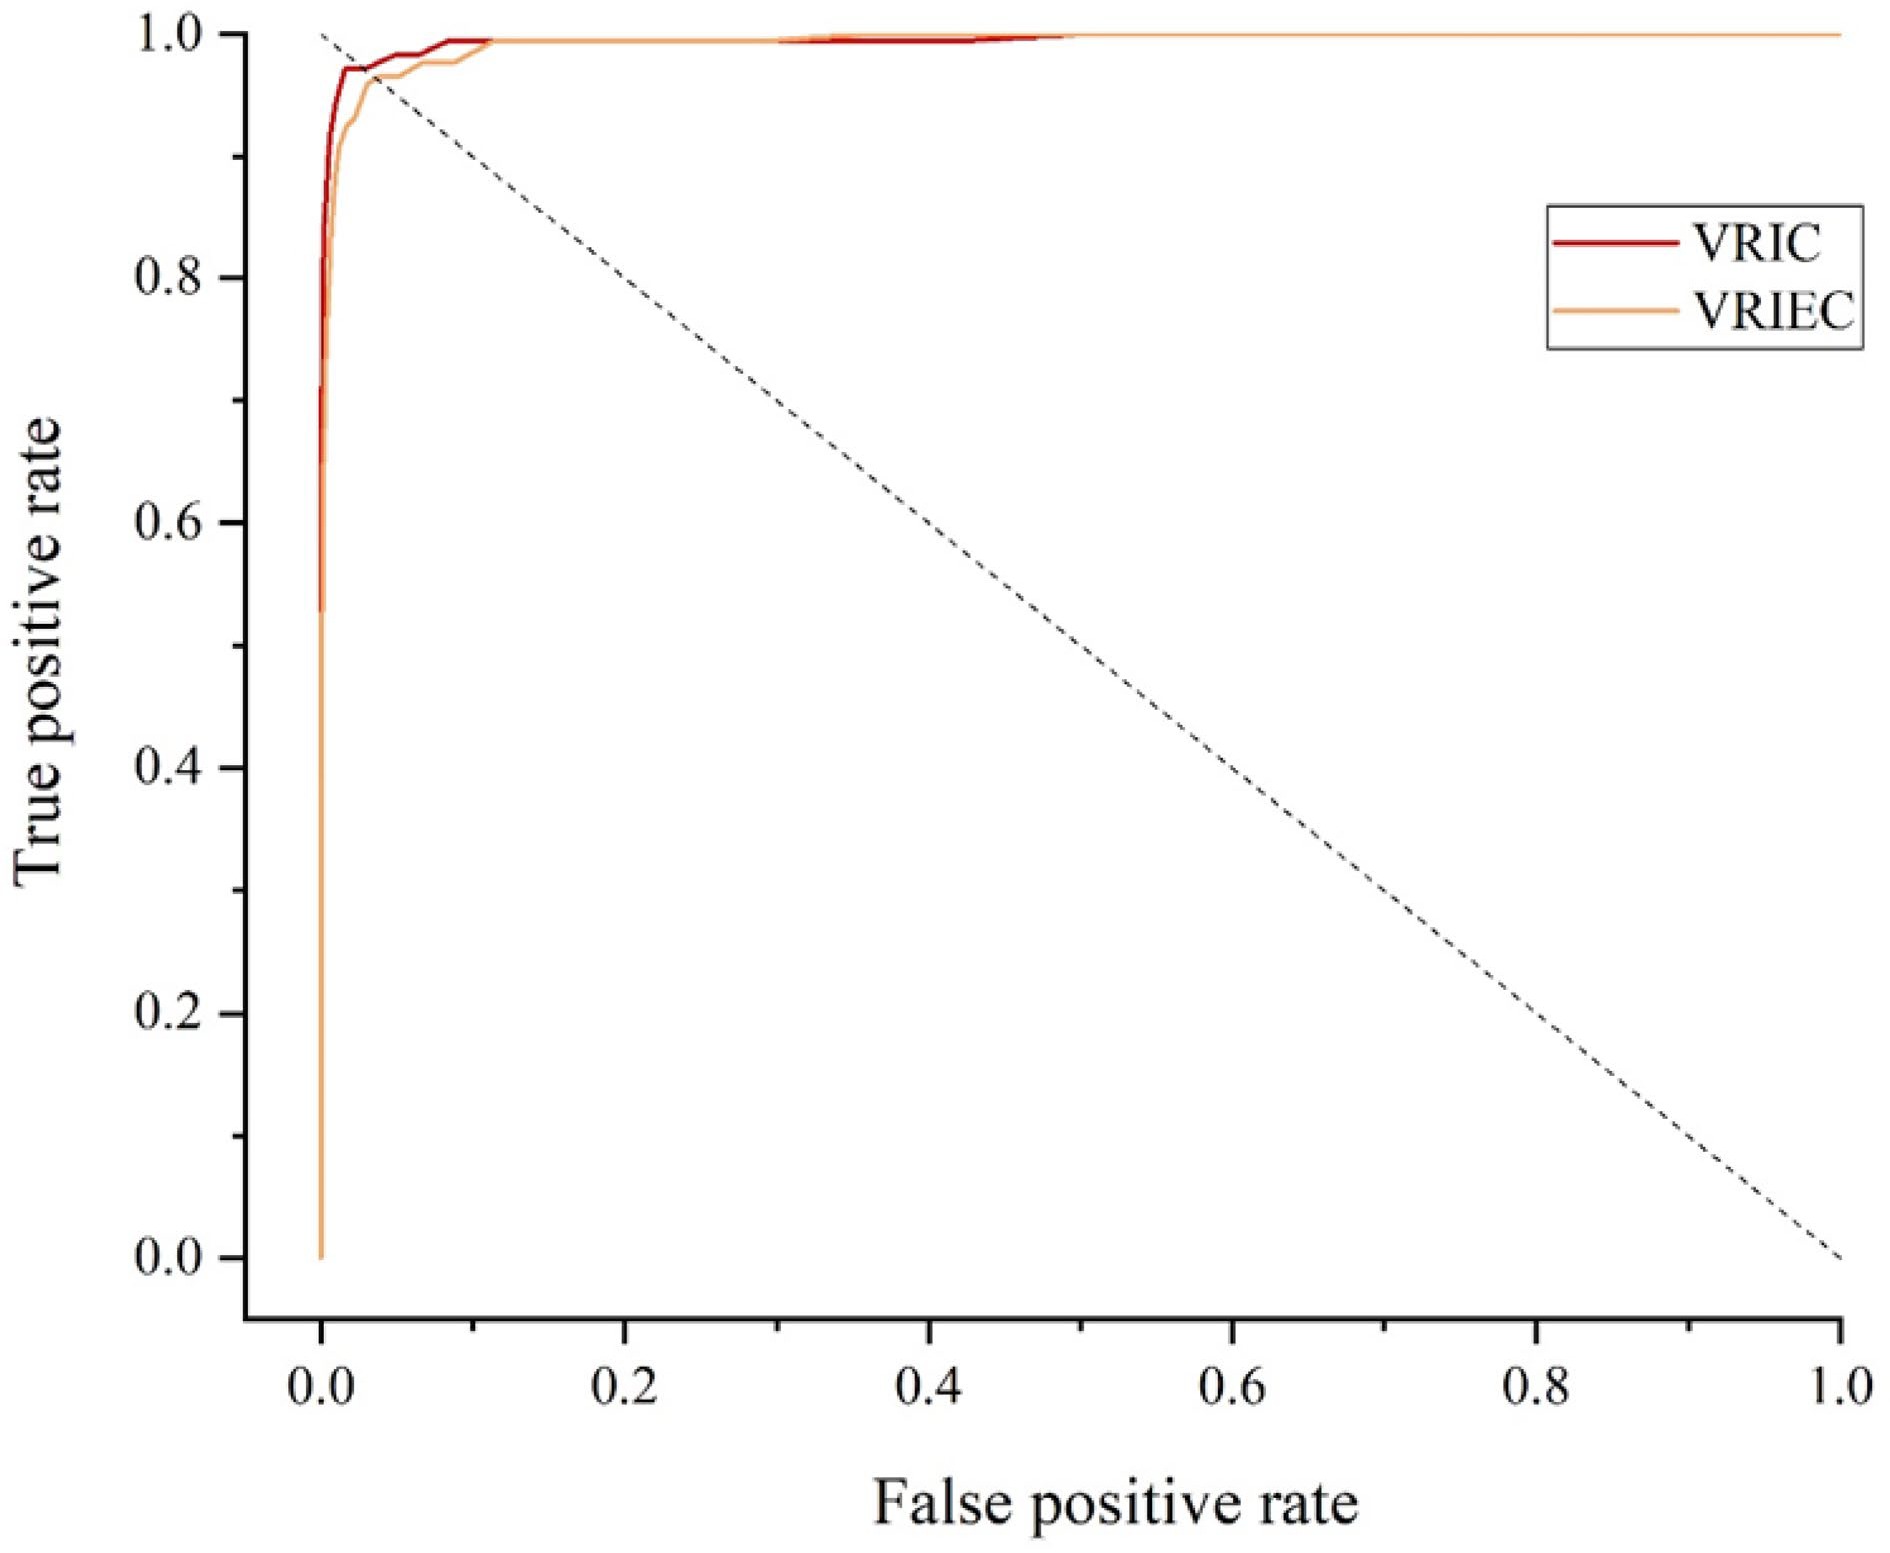
Figure 5.
ROC curves of the mango identification method based on Fuzzy C-means clustering.
-
Positive sample Negative sample Correct identification TP (True positive) FP (False positive) Error identification FN (False negative) TN (True negative) Table 1.
Prediction results of the identification method.
-
Verification time (s) AUC EER (%) VGI 0.6195 0.9993 0.43 VRI 0.6058 0.9853 4.80 VRIE 0.3993 0.9805 6.23 Table 2.
Performance of conventional mango identification methods.
-
Verification time (s) AUC EER (%) VRIC 0.6326 0.9950 2.86 VRIEC 0.4212 0.9930 3.43 Table 3.
Performance of the mango identification method based on Fuzzy C-means clustering.
Figures
(5)
Tables
(3)