ARTICLE   Open Access    

A mango biological fingerprint anti-counterfeiting method based on Fuzzy C-means clustering

More Information
  • The anti-counterfeiting of agricultural products plays an important role in protecting the rights and interests of consumers and maintaining the healthy development of the food market. Traditional anti-counterfeiting technology mainly relies on anti-counterfeiting features of packaging or labeling, which has the risk of being copied and reused. Biological fingerprint anti-counterfeiting is a method of anti-counterfeiting that takes the biological fingerprint of agricultural products as the anti-counterfeiting feature. This paper aims to take the distribution of lenticels on the surface of mango as a biological fingerprint, and propose a mango biological fingerprint anti-counterfeiting method. As the mango ripens, the peel color of mango will change significantly, which will affect the accuracy of anti-counterfeiting identification. In this paper, the images of ripe mangoes are classified by Fuzzy C-means clustering, and appropriate image enhancement technology is used to highlight the features. The results show that the mango biological fingerprint anti-counterfeiting method based on Fuzzy C-means clustering has good accuracy and robustness, and effectively reduces the impact of peel color change on anti-counterfeiting identification during mango ripening. These results support that it is feasible to use the lenticels distribution of mango as a biological fingerprint. In this paper, a computer vision anti-counterfeiting method based on lenticels distribution is proposed.
  • Aquaporin’s (AQPs) are small (21–34 kD) channel-forming, water-transporting trans-membrane proteins which are known as membrane intrinsic proteins (MIPs) conspicuously present across all kingdoms of life. In addition to transporting water, plant AQPs act to transport other small molecules including ammonia, carbon dioxide, glycerol, formamide, hydrogen peroxide, nitric acid, and some metalloids such as boron and silicon from the soil to different parts of the plant[1]. AQPs are typically composed of six or fewer transmembrane helices (TMHs) coupled by five loops (A to E) and cytosolic N- and C-termini, which are highly conserved across taxa[2]. Asparagine-Proline-Alanine (NPA) boxes and makeup helices found in loops B (cytosolic) and E (non-cytosolic) fold back into the protein's core to form one of the pore's two primary constrictions, the NPA region[1]. A second filter zone exists at the pore's non-cytosolic end, where it is called the aromatic/arginine (ar/R) constriction. The substrate selectivity of AQPs is controlled by the amino acid residues of the NPA and ar/R filters as well as other elements of the channel[1].

    To date, the AQP gene families have been extensively explored in the model as well as crop plants[39]. In seed plants, AQP distributed into five subfamilies based on subcellular localization and sequence similarities: the plasma membrane intrinsic proteins (PIPs; subgroups PIP1 and PIP2), the tonoplast intrinsic proteins (TIPs; TIP1-TIP5), the nodulin26-like intrinsic proteins (NIPs; NIP1-NIP5), the small basic intrinsic proteins (SIPs; SIP1-SIP2) and the uncategorized intrinsic proteins (XIPs; XIP1-XIP3)[2,10]. Among them, TIPs and PIPs are the most abundant and play a central role in facilitating water transport. SIPs are mostly found in the endoplasmic reticulum (ER)[11], whereas NIPs homologous to GmNod26 are localized in the peribacteroid membrane[12].

    Several studies reported that the activity of AQPs is regulated by various developmental and environmental factors, through which water fluxes are controlled[13]. AQPs are found in all organs such as leaves, roots, stems, flowers, fruits, and seeds[14,15]. According to earlier studies, increased AQP expression in transgenic plants can improve the plants' tolerance to stresses[16,17]. Increased root water flow caused by upregulation of root aquaporin expression may prevent transpiration[18,19]. Overexpression of Tamarix hispida ThPIP2:5 improved osmotic stress tolerance in Arabidopsis and Tamarix plants[20]. Transgenic tomatoes having apple MdPIP1;3 ectopically expressed produced larger fruit and improved drought tolerance[21]. Plants over-expressing heterologous AQPs, on the other hand, showed negative effects on stress tolerance in many cases. Overexpression of GsTIP2;1 from G. soja in Arabidopsis plants exhibited lower resistance against salt and drought stress[22].

    A few recent studies have started to establish a link between AQPs and nanobiology, a research field that has been accelerating in the past decade due to the recognition that many nano-substances including carbon-based materials are valuable in a wide range of agricultural, industrial, and biomedical activities[23]. Carbon nanotubes (CNTs) were found to improve water absorption and retention and thus enhance seed germination in tomatoes[24,25]. Ali et al.[26] reported that Carbon nanoparticles (CTNs) and osmotic stress utilize separate processes for AQP gating. Despite lacking solid evidence, it is assumed that CNTs regulate the aquaporin (AQPs) in the seed coats[26]. Another highly noticed carbon-nano-molecule, the fullerenes, is a group of allotropic forms of carbon consisting of pure carbon atoms[27]. Fullerenes and their derivatives, in particular the water-soluble fullerols [C60(OH)20], are known to be powerful antioxidants, whose biological activity has been reduced to the accumulation of superoxide and hydroxyl[28,29]. Fullerene/fullerols at low concentrations were reported to enhance seed germination, photosynthesis, root growth, fruit yield, and salt tolerance in various plants such as bitter melon and barley[3032]. In contrast, some studies also reported the phytotoxic effect of fullerene/fullerols[33,34]. It remains unknown if exogenous fullerene/fullerol has any impact on the expression or activity of AQPs in the cell.

    Garden pea (P. sativum) is a cool-season crop grown worldwide; depending on the location, planting may occur from winter until early summer. Drought stress in garden pea mainly affects the flowering and pod filling which harm their yield. In the current study, we performed a genome-wide identification and characterization of the AQP genes in garden pea (P. sativum), the fourth largest legume crop worldwide with a large complex genome (~4.5 Gb) that was recently decoded[35]. In particular, we disclose, for the first time to our best knowledge, that the transcriptional regulations of AQPs by osmotic stress in imbibing pea seeds were altered by fullerol supplement, which provides novel insight into the interaction between plant AQPs, osmotic stress, and the carbon nano-substances.

    The whole-genome sequence of garden pea ('Caméor') was retrieved from the URGI Database (https://urgi.versailles.inra.fr/Species/Pisum). Protein sequences of AQPs from two model crops (Rice and Arabidopsis) and five other legumes (Soybean, Chickpea, Common bean, Medicago, and Peanut) were used to identify homologous AQPs from the garden pea genome (Supplemental Table S1). These protein sequences, built as a local database, were then BLASTp searched against the pea genome with an E-value cutoff of 10−5 and hit a score cutoff of 100 to identify AQP orthologs. The putative AQP sequences of pea were additionally validated to confirm the nature of MIP (Supplemental Table S2) and transmembrane helical domains through TMHMM (www.cbs.dtu.dk/services/TMHMM/).

    Further phylogenetic analysis was performed to categorize the AQPs into subfamilies. The pea AQP amino acid sequences, along with those from Medicago, a cool-season model legume phylogenetically close to pea, were aligned through ClustalW2 software (www.ebi.ac.uk/Tools/msa/clustalw2) to assign protein names. The unaligned AQP sequences to Medicago counterparts were once again aligned with the AQP sequences of Arabidopsis, rice, and soybean. Based on the LG model, unrooted phylogenetic trees were generated via MEGA7 and the neighbor-joining method[36], and the specific name of each AQP gene was assigned based on its position in the phylogenetic tree.

    By using the conserved domain database (CDD, www.ncbi.nlm.nih.gov/Structure/cdd/cdd.shtml), the NPA motifs were identified from the pea AQP protein sequences[37]. The software TMHMM (www.cbs. dtu.dk/services/TMHMM/)[38] was used to identify the protein transmembrane domains. To determine whether there were any alterations or total deletion, the transmembrane domains were carefully examined.

    Basic molecular properties including amino acid composition, relative molecular weight (MW), and instability index were investigated through the online tool ProtParam (https://web.expasy.org/protparam/). The isoelectric points (pI) were estimated by sequence Manipulation Suite version 2 (www.bioinformatics.org/sms2)[39]. The subcellular localization of AQP proteins was predicted using Plant-mPLoc[40] and WoLF PSORT (www.genscript.com/wolf-psort.html)[ 41] algorithms.

    The gene structure (intron-exon organization) of AQPs was examined through GSDS ver 2.0[42]. The chromosomal distribution of the AQP genes was illustrated by the software MapInspect (http://mapinspect.software.informer.com) in the form of a physical map.

    To explore the tissue expression patterns of pea AQP genes, existing NGS data from 18 different libraries covering a wide range of tissue, developmental stage, and growth condition of the variety ‘Caméor’ were downloaded from GenBank (www.ncbi.nlm.nih.gov/bioproject/267198). The expression levels of the AQP genes in each tissue and growth stage/condition were represented by the FPKM (Fragments Per Kilobase of transcript per Million fragments mapped) values. Heatmaps of AQPs gene were generated through Morpheus software (https://software.broadinstitute.org/morpheus/#).

    Different solutions, which were water (W), 0.3 M mannitol (M), and fullerol of different concentrations dissolved in 0.3 M mannitol (MF), were used in this study. MF solutions with the fullerol concentration of 10, 50, 100, and 500 mg/L were denoted as MF1, MF2, MF3, and MF4, respectively. Seeds of 'SQ-1', a Chinese landrace accession of a pea, were germinated in two layers of filter paper with 30 mL of each solution in Petri dishes (12 cm in diameter) each solution, and the visual phenotype and radicle lengths of 150 seeds for each treatment were analyzed 72 h after soaking. The radicle lengths were measured using a ruler. Multiple comparisons for each treatment were performed using the SSR-Test method with the software SPSS 20.0 (IBM SPSS Statistics, Armonk, NY, USA).

    Total RNA was extracted from imbibing embryos after 12 h of seed soaking in the W, M, and MF3 solution, respectively, by using Trizol reagent (Invitrogen, Carlsbad, CA, USA). The quality and quantity of the total RNA were measured through electrophoresis on 1% agarose gel and an Agilent 2100 Bioanalyzer respectively (Agilent Technologies, Santa Rosa, USA). The TruSeq RNA Sample Preparation Kit was utilized to construct an RNA-Seq library from 5 µg of total RNA from each sample according to the manufacturer's instruction (Illumina, San Diego, CA, USA). Next-generation sequencing of nine libraries were performed through Novaseq 6000 platform (Illumina, San Diego, CA, USA).

    First of all, by using SeqPrep (https://github.com/jstjohn/SeqPrep) and Sickle (https://github.com/najoshi/sickle) the raw RNA-Seq reads were filtered and trimmed with default parameters. After filtering, high-quality reads were mapped onto the pea reference genome (https://urgi.versailles.inra.fr/Species/Pisum) by using TopHat (V2.1.0)[43]. Using Cufflinks, the number of mapped reads from each sample was determined and normalised to FPKM for each predicted transcript (v2.2.1). Pairwise comparisons were made between W vs M and W vs M+F treatments. The DEGs with a fold change ≥ 1.5 and false discovery rate (FDR) adjusted p-values ≤ 0.05 were identified by using Cuffdiff[44].

    qPCR was performed by using TOROGGreen® qPCR Master Mix (Toroivd, Shanghai, China) on a qTOWER®3 Real-Time PCR detection system (Analytik Jena, Germany). The reactions were performed at 95 °C for 60 s, followed by 42 cycles of 95 °C for 10 s and 60 °C for 30 s. Quantification of relative expression level was achieved by normalization against the transcripts of the housekeeping genes β-tubulin according to Kreplak et al.[35]. The primer sequences for reference and target genes used are listed in Supplemental Table S3.

    The homology-based analysis identifies 41 putative AQPs in the garden pea genome. Among them, all but two genes (Psat0s3550g0040.1, Psat0s2987g0040.1) encode full-length aquaporin-like sequences (Table 1). The conserved protein domain analysis later validated all of the expected AQPs (Supplemental Table S2). To systematically classify these genes and elucidate their relationship with the AQPs from other plants' a phylogenetic tree was created. It clearly showed that the AQPs from pea and its close relative M. truncatula formed four distinct clusters, which represented the different subfamilies of AQPs i.e. TIPs, PIPs, NIPs, and SIPs (Fig. 1a). However, out of the 41 identified pea AQPs, 4 AQPs couldn't be tightly aligned with the Medicago AQPs and thus were put to a new phylogenetic tree constructed with AQPs from rice, Arabidopsis, and soybean. This additional analysis assigned one of the 4 AQPs to the XIP subfamily and the rest three to the TIP or NIP subfamilies (Fig. 1b). Therefore, it is concluded that the 41 PsAQPs comprise 11 PsTIPs, 15 PsNIPs, 9 PsPIPs, 5 PsSIPs, and 1 PsXIP (Table 2). The PsPIPs formed two major subgroups namely PIP1s and PIP2s, which comprise three and six members, respectively (Table 1). The PsTIPs formed two major subgroups TIPs 1 (PsTIP1-1, PsTIP1-3, PsTIP1-4, PsTIP1-7) and TIPs 2 (PsTIP2-1, PsTIP2-2, PsTIP2-3, PsTIP2-6) each having four members (Table 2). Detailed information such as gene/protein names, accession numbers, the length of deduced polypeptides, and protein structural features are presented in Tables 1 & 2

    Table 1.  Description and distribution of aquaporin genes identified in the garden pea genome.
    Chromosome
    S. NoGene NameGene IDGene length
    (bp)
    LocationStartEndTranscription length (bp)CDS length
    (bp)
    Protein length
    (aa)
    1PsPIP1-1Psat5g128840.32507chr5LG3231,127,859231,130,365675675225
    2PsPIP1-2Psat2g034560.11963chr2LG149,355,95849,357,920870870290
    3PsPIP1-4Psat2g182480.11211chr2LG1421,647,518421,648,728864864288
    4PsPIP2-1Psat6g183960.13314chr6LG2369,699,084369,702,397864864288
    5PsPIP2-2-1Psat4g051960.11223chr4LG486,037,44686,038,668585585195
    6PsPIP2-2-2Psat5g279360.22556chr5LG3543,477,849543,480,4042555789263
    7PsPIP2-3Psat7g228600.22331chr7LG7458,647,213458,649,5432330672224
    8PsPIP2-4Psat3g045080.11786chr3LG5100,017,377100,019,162864864288
    9PsPIP2-5Psat0s3550g0040.11709scaffold0355020,92922,63711911191397
    10PsTIP1-1Psat3g040640.12021chr3LG589,426,47389,428,493753753251
    11PsTIP1-3Psat3g184440.12003chr3LG5393,920,756393,922,758759759253
    12PsTIP1-4Psat7g219600.12083chr7LG7441,691,937441,694,019759759253
    13PsTIP1-7Psat6g236600.11880chr6LG2471,659,417471,661,296762762254
    14PsTIP2-1Psat1g005320.11598chr1LG67,864,8107,866,407750750250
    15PsTIP2-2Psat4g198360.11868chr4LG4407,970,525407,972,392750750250
    16PsTIP2-3Psat1g118120.12665chr1LG6230,725,833230,728,497768768256
    17PsTIP2-6Psat2g177040.11658chr2LG1416,640,482416,642,139750750250
    18PsTIP3-2Psat6g054400.11332chr6LG254,878,00354,879,334780780260
    19PsTIP4-1Psat6g037720.21689chr6LG230,753,62430,755,3121688624208
    20PsTIP5-1Psat7g157600.11695chr7LG7299,716,873299,718,567762762254
    21PsNIP1-1Psat1g195040.21864chr1LG6346,593,853346,595,7161863645215
    22PsNIP1-3Psat1g195800.11200chr1LG6347,120,121347,121,335819819273
    23PsNIP1-5Psat7g067480.12365chr7LG7109,420,633109,422,997828828276
    24PsNIP1-6Psat7g067360.12250chr7LG7109,270,462109,272,711813813271
    25PsNIP1-7Psat1g193240.11452chr1LG6344,622,606344,624,057831831277
    26PsNIP2-1-2Psat3g197520.1669chr3LG5420,092,382420,093,050345345115
    27PsNIP2-2-2Psat3g197560.1716chr3LG5420,103,168420,103,883486486162
    28PsNIP3-1Psat2g072000.11414chr2LG1133,902,470133,903,883798798266
    29PsNIP4-1Psat7g126440.11849chr7LG7209,087,362209,089,210828828276
    30PsNIP4-2Psat5g230920.11436chr5LG3463,340,575463,342,010825825275
    31PsNIP5-1Psat6g190560.11563chr6LG2383,057,323383,058,885867867289
    32PsNIP6-1Psat5g304760.45093chr5LG3573,714,868573,719,9605092486162
    33PsNIP6-2Psat7g036680.12186chr7LG761,445,34161,447,134762762254
    34PsNIP6-3Psat7g259640.12339chr7LG7488,047,315488,049,653918918306
    35PsNIP7-1Psat6g134160.24050chr6LG2260,615,019260,619,06840491509503
    36PsSIP1-1Psat3g091120.13513chr3LG5187,012,329187,015,841738738246
    37PsSIP1-2Psat1g096840.13609chr1LG6167,126,599167,130,207744744248
    38PsSIP1-3Psat7g203280.12069chr7LG7401,302,247401,304,315720720240
    39PsSIP2-1-1Psat0s2987g0040.1706scaffold02987177,538178,243621621207
    40PsSIP2-1-2Psat3g082760.13135chr3LG5173,720,100173,723,234720720240
    41PsXIP2-1Psat7g178080.12077chr7LG7335,167,251335,169,327942942314
    bp: base pair, aa: amino acid.
     | Show Table
    DownLoad: CSV
    Figure 1.  Phylogenetic analysis of the identified AQPs from pea genome. (a) The pea AQPs proteins aligned with those from the cool-season legume Medicago truncatual. (b) The four un-assigned pea AQPs in (a) (denoted as NA) were further aligned with the AQPs of rice, soybean, and Arabidopsis by using the Clustal W program implemented in MEGA 7 software. The nomenclature of PsAQPs was based on homology with the identified aquaporins that were clustered together.
    Table 2.  Protein information, conserved amino acid residues, trans-membrane domains, selectivity filter, and predicted subcellular localization of the 39 full-length pea aquaporins.
    S. NoAQPsGeneLengthTMHNPANPAar/R selectivity filterpIWoLF PSORTPlant-mPLoc
    LBLEH2H5LE1LE2
    Plasma membrane intrinsic proteins (PIPs)
    1PsPIP1-1Psat5g128840.32254NPA0F0008.11PlasPlas
    2PsPIP1-2Psat2g034560.12902NPANPAFHTR9.31PlasPlas
    3PsPIP1-4Psat2g182480.12886NPANPAFHTR9.29PlasPlas
    4PsPIP2-1Psat6g183960.12886NPANPAFHT08.74PlasPlas
    5PsPIP2-2-1Psat4g051960.1195300FHTR8.88PlasPlas
    6PsPIP2-2-2Psat5g279360.22635NPANPAFHTR5.71PlasPlas
    7PsPIP2-3Psat7g228600.22244NPA0FF006.92PlasPlas
    8PsPIP2-4Psat3g045080.12886NPANPAFHTR8.29PlasPlas
    Tonoplast intrinsic proteins (TIPs)
    1PsTIP1-1Psat3g040640.12517NPANPAHIAV6.34PlasVacu
    2PsTIP1-3Psat3g184440.12536NPANPAHIAV5.02Plas/VacuVacu
    3PsTIP1-4Psat7g219600.12537NPANPAHIAV4.72VacuVacu
    4PsTIP1-7Psat6g236600.12546NPANPAHIAV5.48Plas/VacuVacu
    5PsTIP2-1Psat1g005320.12506NPANPAHIGR8.08VacuVacu
    6PsTIP2-2Psat4g198360.12506NPANPAHIGR5.94Plas/VacuVacu
    7PsTIP2-3Psat1g118120.12566NPANPAHIAL6.86Plas/VacuVacu
    8PsTIP2-6Psat2g177040.12506NPANPAHIGR4.93VacuVacu
    9PsTIP3-2Psat6g054400.12606NPANPAHIAR7.27Plas/VacuVacu
    10PsTIP4-1Psat6g037720.22086NPANPAHIAR6.29Vac/ plasVacu
    11PsTIP5-1Psat7g157600.12547NPANPANVGC8.2Vacu /plasVacu/Plas
    Nodulin-26 like intrisic proteins (NIPs)
    1PsNIP1-1Psat1g195040.22155NPA0WVF06.71PlasPlas
    2PsNIP1-3Psat1g195800.12735NPANPVWVAR6.77PlasPlas
    3PsNIP1-5Psat7g067480.12766NPANPVWVAN8.98PlasPlas
    4PsNIP1-6Psat7g067360.12716NPANPAWVAR8.65Plas/VacuPlas
    5PsNIP1-7Psat1g193240.12776NPANPAWIAR6.5Plas/VacuPlas
    6PsNIP2-1-2Psat3g197520.11152NPAOG0009.64PlasPlas
    7PsNIP2-2-2Psat3g197560.116230NPA0SGR6.51PlasPlas
    8PsNIP3-1Psat2g072000.12665NPANPASIAR8.59Plas/VacuPlas
    9PsNIP4-1Psat7g126440.12766NPANPAWVAR6.67PlasPlas
    10PsNIP4-2Psat5g230920.12756NPANPAWLAR7.01PlasPlas
    11PsNIP5-1Psat6g190560.12895NPSNPVAIGR7.1PlasPlas
    12PsNIP6-1Psat5g304760.41622NPA0I0009.03PlasPlas
    13PsNIP6-2Psat7g036680.1254000G0005.27ChloPlas/Nucl
    14PsNIP6-3Psat7g259640.13066NPANPVTIGR8.32PlasPlas
    15PsNIP7-1Psat6g134160.25030NLK0WGQR8.5VacuChlo/Nucl
    Small basic intrinsic proteins (SIPs)
    1PsSIP1-1Psat3g091120.12466NPTNPAVLPN9.54PlasPlas/Vacu
    2PsSIP1-2Psat1g096840.12485NTPNPAIVPL9.24VacuPlas/Vacu
    3PsSIP1-3Psat7g203280.12406NPSNPANLPN10.32ChloPlas
    4PsSIP2-1-2Psat3g082760.12404NPLNPAYLGS10.28PlasPlas
    Uncharacterized X intrinsic proteins (XIPs)
    1PsXIP2-1Psat7g178080.13146SPVNPAVVRM7.89PlasPlas
    Length: protein length (aa); pI: Isoelectric point; Trans-membrane helicase (TMH) represents for the numbers of Trans-membrane helices predicted by TMHMM Server v.2.0 tool; WoLF PSORT and Plant-mPLoc: best possible cellualr localization predicted by the WoLF PSORT and Plant-mPLoc tool, respectively (Chlo Chloroplast, Plas Plasma membrane, Vacu Vacuolar membrane, Nucl Nucleus); LB: Loop B, L: Loop E; NPA: Asparagine-Proline-Alanine; H2 represents for Helix 2, H5 represents for Helix 5, LE1 represents for Loop E1, LE2 represents for Loop E2, Ar/R represents for Aromatic/Arginine.
     | Show Table
    DownLoad: CSV

    To understand the genome distribution of the 41 PsAQPs, we mapped these genes onto the seven chromosomes of a pea to retrieve their physical locations (Fig. 2). The greatest number (10) of AQPs were found on chromosome 7, whereas the least (2) on chromosome 4 (Fig. 2 and Table 1). Chromosomes 1 and 6 each contain six aquaporin genes, whereas chromosomes 2, 3, and 5 carry four, seven, and four aquaporin genes, respectively (Fig. 2). The trend of clustered distribution of AQPs was seen on specific chromosomes, particularly near the end of chromosome 7.

    Figure 2.  Chromosomal localization of the 41 PsAQPs on the seven chromosomes of pea. Chr1-7 represents the chromosomes 1 to 7. The numbers on the right of each chromosome show the physical map positions of the AQP genes (Mbp). Blue, green, orange, brown, and black colors represent TIPs, NIPs, PIPs, SIPs, and XIP, respectively.

    The 39 full-length PsAQP proteins have a length of amino acid ranging from 115 to 503 (Table 1) and Isoelectric point (pI) values ranging from 4.72 to 10.35 (Table 2). As a structural signature, transmembrane domains were predicted to exist in all PsAQPs, with the number in individual AQPs varying from 2 to 6. By subfamilies, TIPs harbor the greatest number of TM domains in total, followed by PIPs, NIPs, SIPs, and XIP (Table 2). Exon-intron structure analysis showed that most PsAQPs (16/39) having two introns, while ten members had three, seven members had four, and five members had only one intron (Fig. 3). Overall, PsAQPs exhibited a complex structure with varying intron numbers, positions, and lengths.

    Figure 3.  The exon-intron structures of the AQP genes in pea. Upstream/downstream region, exon, and intron are represented by a blue box, yellow box, and grey line, respectively.

    As aforementioned, generally highly conserved two NPA motifs generate an electrostatic repulsion of protons in AQPs to form the water channel, which is essential for the transport of substrate molecules[15]. In order to comprehend the potential physiological function and substrate specificity of pea aquaporins, NPA motifs (LB, LE) and residues at the ar/R selectivity filter (H2, H5, LE1, and LE2) were examined. (Table 2). We found that all PsTIPs and most PsPIPs had two conserved NPA motifs except for PsPIP1-1, PsPIP2-2-1, and PsPIP2-3, each having a single NPA motif. Among PsNIPs, PsNIP1-6, PsNIP1-6, PsNIP1-7, PsNIP3-1, PsNIP4-1 and PSNIP4-2 had two NPA domains, while PsNIP1-1, PsNIP2-1-2, PsNIP2-2-2 and PsNIP6-1 each had a single NPA motif. In the PsNIP sub-family, the first NPA motif showed an Alanine (A) to Valine (V) substitution in three PsNIPs (PsNIP1-3, PsNIP1-5, and PsNIP6-3) (Table 2). Furthermore, the NPA domains of all members of the XIP and SIP subfamilies were different. The second NPA motif was conserved in PsSIP aquaporins, however, all of the first NPA motifs had Alanine (A) replaced by Leucine (L) (PsSIP2-1-1, PsSIP2-1-2) or Threonine (T) (PsSIP1-1). In comparison to other subfamilies, this motif variation distinguishes water and solute-transporting aquaporins[45].

    Compared to NPA motifs, the ar/R positions were more variable and the amino acid composition appeared to be subfamily-dependent. The majority of PsPIPs had phenylalanine at H2, histidine at H5, threonine at LE1, and arginine at LE2 selective filter (Table 2). All of the PsTIP1 members had a Histidine-Isoleucine-Alanine-Valine structure at this position, while all PsTIP2 members but PsTIP2-3 harbored Histidine-Isoleucine-Glycine-Arginine. Similarly, PsNIPs, PsSIPs and PsXIP also showed subgroup-specific variation in ar/R selectivity filter (Table 2). Each of these substitutions partly determines the function of transporting water[46].

    Sequence-based subcellular localization analysis using WoLF PSORT predicted that all PsPIPs localized in the plasma membrane, which is consistent with their subfamily classification (Table 2). Around half (5/11) of the PsTIPs (PsTIP1-4, PsTIP2-1, PsTIP2-6, PsTIP4-1, and PsTIP5-1) were predicted to localize within vacuoles. However, several TIP members (PsTIP1-1, PsTIP1-3, PsTIP1-7, PsTIP2-2, PsTIP2-3 and PsTIP3-2) were predicted to localize in plasma membranes. We then further investigated their localizations by using another software (Plant-mPLoc, Table 2), which predicted that all the PsTIPs localize within vacuoles, thus supporting that they are tonoplast related. An overwhelming majority of PsNIPs (14/15) and PsXIP were predicted to be found only in plasma membranes., which was also expected (Table 2). Collectively, the versatility in subcellular localization of the pea AQPs is implicative of their distinct roles in controlling water and/or solute transport in the context of plant cell compartmentation.

    Tissue expression patterns of genes are indicative of their functions. Since there were rich resources of RNA-Seq data from various types of pea tissues in the public database, they were used for the extraction of expression information of PsAQP genes as represented by FPKM values. A heat map was generated to show the expression patterns of PsAQP genes in 18 different tissues/stages and their responses to nitrate levels (Fig. 4). According to the heat map, PsPIP1-2, PsPIP2-3 were highly expressed in root and nodule G (Low-nitrate), whereas PsTIP1-4, PsTIP2-6, and PsNIP1-7 were only expressed in roots in comparison to other tissues. The result also demonstrated that PsPIP1-1 and PsNIP3-1 expressed more abundantly in leaf, tendril, and peduncle, whereas PsPIP2-2-2 and PsTIP1-1 showed high to moderate expressions in all the samples except for a few. Interestingly, PsTIP1-1 expression in many green tissues seemed to be oppressed by low-nitrate. In contrast, some AQPs such as PsTIP1-3, PsTIP1-7, PsTIP5-1, PsNIP1-5, PsNIP4-1, PsNIP5-1, and PsSIP2-1-1 showed higher expression only in the flower tissue. There were interesting developmental stage-dependent regulations of some AQPs in seeds (Fig. 4). For example, PsPIP2-1, PsPIP2-2-1, PsNIP1-6, PsSIP1-1, and PsSIP1-2 were more abundantly expressed in the Seed_12 dap (days after pollination;) tissue than in the Seed_5 dai (days after imbibition) tissue; reversely, PsPIP2-2-2, PsPIP2-4, PsTIP2-3, and PsTIP3-2 showed higher expression in seed_5 dai in compare to seed_12 dap tissues (Fig. 4). The AQP genes may have particular functional roles in the growth and development of the pea based on their tissue-specific expression.

    Figure 4.  Heatmap analysis of the expression of pea AQP gene expressions in different tissues using RNA-seq data (PRJNA267198). Normalized expression of aquaporins in terms of reads per kilobase of transcript per million mapped reads (RPKM) showing higher levels of PIPs, NIPs, TIPs SIPs, and XIP expression across the different tissues analyzed. (Stage A represents 7-8 nodes; stage B represents the start of flowering; stage D represents germination, 5 d after imbibition; stage E represents 12 d after pollination; stage F represents 8 d after sowing; stage G represents 18 d after sowing, LN: Low-nitrate; HN: High-nitrate.

    Expressions of plant AQPs in vegetative tissues under normal and stressed conditions have been extensively studied[15]; however, little is known about the transcriptional regulation of AQP genes in seeds/embryos. To provide insights into this specific area, wet-bench RNA-Seq was performed on the germinating embryo samples isolated from water (W)-imbibed seeds and those treated with mannitol (M, an osmotic reagent), mannitol, and mannitol plus fullerol (F, a nano-antioxidant). The phenotypic evaluation showed that M treatment had a substantial inhibitory effect on radicle growth, whereas the supplement of F significantly mitigated this inhibition at all concentrations, in particular, 100 mg/mL in MF3, which increased the radicle length by ~33% as compared to that under solely M treatment (Fig. 5). The expression values of PsAQP genes were removed from the RNA-Seq data, and pairwise comparisons were made within the Group 1: W vs M, and Group 2: W vs MF3, where a total of ten and nince AQPs were identified as differentially expressed genes (DEGs), respectively (Fig. 6). In Group 1, six DEGs were up-regulated and four DEGs down-regulated, whereas in Group 2, six DEGs were up-regulated and three DEGs down-regulated. Four genes viz. PsPIPs2-5, PsNIP6-3, PsTIP2-3, and PsTIP3-2 were found to be similarly regulated by M or MF3 treatment (Fig. 6), indicating that their regulation by osmotic stress couldn't be mitigated by fullerol. Three genes, all being PsNIPs (1-1, 2-1-2, and 4-2), were up-regulated only under mannitol treatment without fullerol, suggesting that their perturbations by osmotic stress were migrated by the antioxidant activities. In contrast, four other genes namely PsTIP2-2, PsTIP4-1, PsNIP1-5, and PsSIP1-3 were only regulated under mannitol treatment when fullerol was present.

    Figure 5.  The visual phenotype and radicle length of pea seeds treated with water (W), 0.3 M mannitol (M), and fullerol of different concentrations dissolved in 0.3 M mannitol (MF). MF1, MF2, MF3, and MF4 indicated fullerol dissolved in 0.3 M mannitol at the concentration of 10, 50, 100, and 500 mg/L, respectively. (a) One hundred and fifty grains of pea seeds each were used for phenotype analysis at 72 h after treatment. Radicle lengths were measured using a ruler in three replicates R1, R2, and R3 in all the treatments. (b) Multiple comparison results determined using the SSR-Test method were shown with lowercase letters to indicate statistical significance (P < 0.05).
    Figure 6.  Venn diagram showing the shared and unique differentially expressed PsAQP genes in imbibing seeds under control (W), Mannitol (M) and Mannitol + Fullerol (MF3) treatments. Up-regulation (UG): PsPIP2-5, PsNIP1-1, PsNIP2-1-2, PsNIP4-2, PsNIP6-3, PsNIP1-5, PsTIP2-2, PsTIP4-1, PsSIP1-3, PsXIP2-1; Down-regulation (DG): PsTIP2-3, PsTIP3-2, PsNIP1-7, PsNIP5-1, PsXIP2-1.

    As a validation of the RNA-Seq data, eight genes showing differential expressions in imbibing seeds under M or M + F treatments were selected for qRT-PCR analysis, which was PsTIP4-1, PsTIP2-2, PsTIP2-3, PsTIP3-2, PsPIP2-5, PsXIP2-1, PsNIP6-3 and PsNIP1-5 shown in Fig 6, the expression modes of all the selected genes but PsXIP2-1 were well consistent between the RNA-Seq and the qRT-PCR data. PsXIP2-1, exhibiting slightly decreased expression under M treatment according to RNA-Seq, was found to be up-regulated under the same treatment by qRT-PCR (Fig. 7). This gene was therefore removed from further discussions.

    Figure 7.  The expression patterns of seven PsAQPs in imbibing seeds as revealed by RNA-Seq and qRT-PCR. The seeds were sampled after 12 h soaking in three different solutions, namely water (W), 0.3 M mannitol (M), and 100 mg/L fullerol dissolved in 0.3 M mannitol (MF3) solution. Error bars are standard errors calculated from three replicates.

    This study used the recently available garden pea genome to perform genome-wide identification of AQPs[35] to help understand their functions in plant growth and development. A total of 39 putative full-length AQPs were found in the garden pea genome, which is very similar to the number of AQPs identified in many other diploid legume crops such as 40 AQPs genes in pigeon pea, chickpea, common bean[7,47,48], and 44 AQPs in Medicago[49]. On the other hand, the number of AQP genes in pea is greater compared to diploid species like rice (34)[4], Arabidopsis thaliana (35)[3], and 32 and 36 in peanut A and B genomes, respectively[8]. Phylogenetic analysis assigned the pea AQPs into all five subfamilies known in plants, whereas the presence of only one XIP in this species seems less than the number in other diploid legumes which have two each in common bean and Medicago[5,48,49]. The functions of the XIP-type AQP will be of particular interest to explore in the future.

    The observed exon-intron structures in pea AQPs were found to be conserved and their phylogenetic distribution often correlated with these structures. Similar exon-intron patterns were seen in PIPs and TIPs subfamily of Arabidopsis, soybean, and tomato[3,6,50]. The two conserved NPA motifs and the four amino acids forming the ar/R SF mostly regulate solute specificity and transport of the substrate across AQPs[47,51]. According to our analysis, all the members of each AQP subfamilies in garden pea showed mostly conserved NPA motifs and a similar ar/R selective filter. Interestingly, most PsPIPs carry double NPA in LB and LE and a hydrophilic ar/R SF (F/H/T/R) as observed in three legumes i.e., common bean[48], soybean[5] chickpea[7], showing their affinity for water transport. All the TIPs of garden pea have double NPA in LB and LE and wide variation at selectivity filters. Most PsTIP1s (1-1, 1-3, 1-4, and 1-7) were found with H-I-A-V ar/R selectivity filter similar to other species such as Medicago, Arachis, and common bean, that are reported to transport water and other small molecules like boron, hydrogen peroxide, urea, and ammonia[52]. Compared with related species, the TIPs residues in the ar/R selectivity filter were very similar to those in common bean[48], Medicago[49], and Arachis[8]. In the present study, the NIPs, NIP1s (1-3, 1-5, 1-6, and1-7), and NIP2-2-2 genes have G-S-G-R selectivity. Interestingly, NIP2s with a G-S-G-R selectivity filter plays an important role in silicon influx (Si) in many plant species such as Soybean and Arachis[6,8]. It was reported that Si accumulation protects plants against various types of biotic and abiotic stresses[53].

    The subcellular localization investigation suggested that most of the PsAQPs were localized to the plasma membrane or vacuolar membrane. The members of the PsPIPs, PsNIPs, and PsXIP subfamilies were mostly located in the plasma membrane, whereas members of the PsTIPs subfamily were often predicted to localize in the vacuolar membrane. Similar situations were reported in many other legumes such as common bean, soybean, and chickpea[5,7,48]. Apart from that, PsSIPs subfamily were predicted to localize to the plasma membrane or vacuolar membrane, and some AQPs were likely to localize in broader subcellular positions such as the nucleus, cytosol, and chloroplast, which indicates that AQPs may be involved in various molecular transport functions.

    AQPs have versatile physiological functions in various plant organs. Analysis of RNA-Seq data showed a moderate to high expression of the PsPIPs in either root or green tissues except for PsPIP2-4, indicating their affinity to water transport. In several other species such as Arachis[8], common bean[48], and Medicago[49], PIPs also were reported to show high expressions and were considered to play an important role to maintain root and leaf hydraulics. Also interestingly, PsTIP2-3 and PsTIP3-2 showed high expressions exclusively in seeds at 5 d after imbibition, indicating their specific roles in seed germination. Earlier, a similar expression pattern for TIP3s was reported in Arabidopsis during the initial phase of seed germination and seed maturation[54], soybean[6], canola[55], and Medicago[49], suggesting that the main role of TIP3s in regulating seed development is conserved across species.

    Carbon nanoparticles such as fullerol have a wide range of potential applications as well as safety concerns in agriculture. Fullerol has been linked to plant protection from oxidative stress by influencing ROS accumulation and activating the antioxidant system in response to drought[56]. The current study revealed that fullerol at an adequate concentration (100 mg/L), had favorable effects on osmotic stress alleviation. In this study, the radical growth of germinating seeds was repressed by the mannitol treatment, and many similar observations have been found in previous studies[57]. Furthermore, mannitol induces ROS accumulation in plants, causing oxidative stress[58]. Our work further validated that the radical growth of germinating seeds were increased during fullerol treatment. Fullerol increased the length of roots and barley seeds, according to Panova et al.[32]. Fullerol resulted in ROS detoxification in seedlings subjected to water stress[32].

    Through transcriptomic profiling and qRT-PCR, several PsAQPs that responded to osmotic stress by mannitol and a combination of mannitol and fullerol were identified. Most of these differentially expressed AQPs belonged to the TIP and NIP subfamilies. (PsTIP2-2, PsTIP2-3, and PsTIP 3-2) showed higher expression by mannitol treatment, which is consistent with the fact that many TIPs in other species such as GmTIP2;3 and Eucalyptus grandis TIP2 (EgTIP2) also showed elevated expressions under osmotic stress[54,59]. The maturation of the vacuolar apparatus is known to be aided by the TIPs, which also enable the best possible water absorption throughout the growth of embryos and the germination of seeds[60]. Here, the higher expression of PsTIP (2-2, 2-3, and 3-2) might help combat water deficiency in imbibing seeds due to osmotic stress. The cellular signals triggering such transcriptional regulation seem to be independent of the antioxidant system because the addition of fullerol didn’t remove such regulation. On the other hand, the mannitol-induced regulation of most PsNIPs were eliminated when fullerol was added, suggesting either a response of these NIPs to the antioxidant signals or being due to the mitigated cellular stress. Based on our experimental data and previous knowledge, we propose that the fullerol-induced up- or down-regulation of specific AQPs belonging to different subfamilies and locating in different subcellular compartments, work coordinatedly with each other, to maintain the water balance and strengthen the tolerance to osmotic stress in germinating pea seeds through reduction of ROS accumulation and enhancement of antioxidant enzyme levels. Uncategorized X intrinsic proteins (XIPs) Aquaporins are multifunctional channels that are accessible to water, metalloids, and ROS.[32,56]. Due likely to PCR bias, the expression data of PsXIP2-1 from qRT-PCR and RNA-Seq analyses didn’t match well, hampering the drawing of a solid conclusion about this gene. Further studies are required to verify and more deeply dissect the functions of each of these PsAQPs in osmotic stress tolerance.

    A total of 39 full-length AQP genes belonging to five sub-families were identified from the pea genome and characterized for their sequences, phylogenetic relationships, gene structures, subcellular localization, and expression profiles. The number of AQP genes in pea is similar to that in related diploid legume species. The RNA-seq data revealed that PsTIP (2-3, 3-2) showed high expression in seeds for 5 d after imbibition, indicating their possible role during the initial phase of seed germination. Furthermore, gene expression profiles displayed that higher expression of PsTIP (2-3, 3-2) in germinating seeds might help maintain water balance under osmotic stress to confer tolerance. Our results suggests that the biological functions of fullerol in plant cells are exerted partly through the interaction with AQPs.

    Under Bio project ID PRJNA793376 at the National Center for Biotechnology Information, raw data of sequencing read has been submitted. The accession numbers for the RNA-seq raw data are stored in GenBank and are mentioned in Supplemental Table S4.

    This study is supported by the National Key Research & Development Program of China (2022YFE0198000) and the Key Research Program of Zhejiang Province (2021C02041).

  • Pei Xu is the Editorial Board member of journal Vegetable Research. He was blinded from reviewing or making decisions on the manuscript. The article was subject to the journal's standard procedures, with peer-review handled independently of this Editorial Board member and his research group.

  • [1]

    Ickowitz A, Powell B, Rowland D, Jones A, Sunderland T. 2019. Agricultural intensification, dietary diversity, and markets in the global food security narrative. Global Food Security 20:9−16

    doi: 10.1016/j.gfs.2018.11.002

    CrossRef   Google Scholar

    [2]

    Qin Y, Shi LH, Song L, Stöttinger B, Tan KF. 2018. Integrating consumers’ motives with suppliers’ solutions to combat Shanzhai: A phenomenon beyond counterfeit. Business Horizons 61:229−37

    doi: 10.1016/j.bushor.2017.11.009

    CrossRef   Google Scholar

    [3]

    Walker GS. 2017. Food authentication and traceability: An Asian and Australian perspective. Food Control 72:168−72

    doi: 10.1016/j.foodcont.2016.01.028

    CrossRef   Google Scholar

    [4]

    Aung MM, Chang YS. 2014. Traceability in a food supply chain: Safety and quality perspectives. Food Control 39:172−84

    doi: 10.1016/j.foodcont.2013.11.007

    CrossRef   Google Scholar

    [5]

    Bosona T, Gebresenbet G. 2013. Food traceability as an integral part of logistics management in food and agricultural supply chain. Food Control 33(1):32−48

    doi: 10.1016/j.foodcont.2013.02.004

    CrossRef   Google Scholar

    [6]

    Sun C, Li W, Zhou C, Li M, Yang X. 2013. Anti-counterfeit system for agricultural product origin labeling based on GPS data and encrypted Chinese-sensible Code. Computers and Electronics in Agriculture 92:82−91

    doi: 10.1016/j.compag.2012.12.014

    CrossRef   Google Scholar

    [7]

    Qian J, Xing B, Zhang B, Yang H. 2021. Optimizing QR code readability for curved agro-food packages using response surface methodology to improve mobile phone-based traceability. Food Packaging and Shelf Life 28:100638

    doi: 10.1016/j.fpsl.2021.100638

    CrossRef   Google Scholar

    [8]

    Bibi F, Guillaume C, Gontard N, Sorli B. 2017. A review: RFID technology having sensing aptitudes for food industry and their contribution to tracking and monitoring of food products. Trends in Food Science & Technology 62:91−103

    doi: 10.1016/j.jpgs.2017.01.013

    CrossRef   Google Scholar

    [9]

    Fang Z, Zhao Y, Warner RD, Johnson SK. 2017. Active and intelligent packaging in meat industry. Trends in Food Science & Technology 61:60−71

    doi: 10.1016/j.jpgs.2017.01.002

    CrossRef   Google Scholar

    [10]

    Ueda Y, Morishita J, Hongyo T. 2019. Biological fingerprint using scout computed tomographic images for positive patient identification. Medical Physics 46(10):4600−9

    doi: 10.1002/mp.13779

    CrossRef   Google Scholar

    [11]

    Chen J, Chen J, Wang Z, Liang C, Lin C. 2020. Identity-aware face super-resolution for low-resolution face recognition. IEEE Signal Processing Letters 27:645−49

    doi: 10.1109/LSP.2020.2986942

    CrossRef   Google Scholar

    [12]

    Moolla Y, De Kock A, Mabuza-Hocquet G, Ntshangase CS, Nelufule N, et al. 2021. Biometric recognition of infants using fingerprint, iris, and ear biometrics. IEEE Access 9:38269−86

    doi: 10.1109/ACCESS.2021.3062282

    CrossRef   Google Scholar

    [13]

    Sharma RP, Dey S. 2019. Two-stage quality adaptive fingerprint image enhancement using Fuzzy C-means clustering based fingerprint quality analysis. Image and Vision Computing 83-84:1−16

    doi: 10.1016/j.imavis.2019.02.006

    CrossRef   Google Scholar

    [14]

    Esteki M, Shahsavari Z, Simal-Gandara J. 2019. Food identification by high performance liquid chromatography fingerprinting and mathematical processing. Food Research International 122:303−17

    doi: 10.1016/j.foodres.2019.04.025

    CrossRef   Google Scholar

    [15]

    Durić G, Mićić N, Pasalić B. 2015. Lenticels as pomological characteristic of apple and pear fruits. Acta Horticulturae 1099:771−75

    doi: 10.17660/actahortic.2015.1099.97

    CrossRef   Google Scholar

    [16]

    Rymbai H, Srivastav M, Sharma RR, Singh SK. 2012. Lenticels on mango fruit: Origin, development, discoloration and prevention of their discoloration. Scientia Horticulturae 135:164−70

    doi: 10.1016/j.scienta.2011.11.018

    CrossRef   Google Scholar

    [17]

    Tamjinda B, Sirphanich J, Nobuchi T. 1992. Anatomy of lenticels and the occurrence of their discoloration in mangoes. Agriculture and Natural Resources 26:57−64

    Google Scholar

    [18]

    Tur AO, Selbes B, Öztürk Hİ, Karakaya İ, Demirel B. 2021. Importance of Image Enhancement Methods for Fingerprint Recognition. Proc. 2021 29th Signal Processing and Communications Applications Conference (SIU), Istanbul, Turkey, 2021, pp. 1−4. IEEE. https://doi.org/10.1109/SIU53274.2021.9477891

    [19]

    Askari S. 2021. Fuzzy C-Means clustering algorithm for data with unequal cluster sizes and contaminated with noise and outliers: Review and development. Expert Systems With Applications 165:113856

    doi: 10.1016/j.eswa.2020.113856

    CrossRef   Google Scholar

    [20]

    Nurzyńska K, Haraszczuk R. 2012. Detection and normalization of blown-out illumination areas in grey-scale images. Proc. International Symposium on Visual Computing, Heidelberg, 2012, 7431: 282-91. Heidelberg: Springer

    [21]

    Patel MB, Parikh SM, Patel AR. 2020. Global normalization for fingerprint image enhancement. In Computational Vision and Bio-Inspired Computing. ICCVBIC 2019. Advances in Intelligent Systems and Computing, eds. Smys S, Tavares J, Balas V, Iliyasu A. 1108:1059−66. Cham: Springer. https://doi.org/10.1007/978-3-030-37218-7_111

    [22]

    Zhou L, Li W, Du Y, Lei B, Liang S. 2019. Adaptive illumination-invariant face recognition via local nonlinear multi-layer contrast feature. Journal of Visual Communication and Image Representation 64:102641

    doi: 10.1016/j.jvcir.2019.102641

    CrossRef   Google Scholar

    [23]

    Bilal M, Shah JA, Qureshi IM, Ahmed AH. 2018. Motion adaptive wavelet thresholding for recovery of compressively sampled static and dynamic MR images. Applied Magnetic Resonance 49:1027−41

    doi: 10.1007/s00723-018-1022-1

    CrossRef   Google Scholar

    [24]

    Muhammed A, Pais AR. 2020. A Novel Fingerprint Image Enhancement based on Super Resolution. Proc. 2020 6th International Conference on Advanced Computing and Communication Systems (ICACCS), Coimbatore, India, 2020, pp. 165−70. IEEE. https://doi.org/10.1109/ICACCS48705.2020.9074196

    [25]

    Sharma R, Jain M. 2021. A Versatile Medical Image Enhancement Algorithm Based on Wavelet Transform. JIPS 17:1170−78

    doi: 10.3745/JIPS.03.0170

    CrossRef   Google Scholar

    [26]

    Brunetti A, Buongiorno D, Trotta GF, Bevilacqua V. 2018. Computer vision and deep learning techniques for pedestrian detection and tracking: A survey. Neurocomputing 300:17−33

    doi: 10.1016/j.neucom.2018.01.092

    CrossRef   Google Scholar

    [27]

    Pathak AR, Pandey M, Rautaray S. 2018. Application of deep learning for object detection. Procedia Computer Science 132:1706−17

    doi: 10.1016/j.procs.2018.05.144

    CrossRef   Google Scholar

    [28]

    Rao BS. 2020. Dynamic Histogram Equalization for contrast enhancement for digital images. Applied Soft Computing 89:106114

    doi: 10.1016/j.asoc.2020.106114

    CrossRef   Google Scholar

  • Cite this article

    Shen C, Zhang Y, Chen L, Jia A, Cao J, et al. 2023. A mango biological fingerprint anti-counterfeiting method based on Fuzzy C-means clustering. Food Innovation and Advances 2(1):21−27 doi: 10.48130/FIA-2023-0004
    Shen C, Zhang Y, Chen L, Jia A, Cao J, et al. 2023. A mango biological fingerprint anti-counterfeiting method based on Fuzzy C-means clustering. Food Innovation and Advances 2(1):21−27 doi: 10.48130/FIA-2023-0004

Figures(5)  /  Tables(3)

Article Metrics

Article views(3586) PDF downloads(590)

ARTICLE   Open Access    

A mango biological fingerprint anti-counterfeiting method based on Fuzzy C-means clustering

Food Innovation and Advances  2 2023, 2(1): 21−27  |  Cite this article

Abstract: The anti-counterfeiting of agricultural products plays an important role in protecting the rights and interests of consumers and maintaining the healthy development of the food market. Traditional anti-counterfeiting technology mainly relies on anti-counterfeiting features of packaging or labeling, which has the risk of being copied and reused. Biological fingerprint anti-counterfeiting is a method of anti-counterfeiting that takes the biological fingerprint of agricultural products as the anti-counterfeiting feature. This paper aims to take the distribution of lenticels on the surface of mango as a biological fingerprint, and propose a mango biological fingerprint anti-counterfeiting method. As the mango ripens, the peel color of mango will change significantly, which will affect the accuracy of anti-counterfeiting identification. In this paper, the images of ripe mangoes are classified by Fuzzy C-means clustering, and appropriate image enhancement technology is used to highlight the features. The results show that the mango biological fingerprint anti-counterfeiting method based on Fuzzy C-means clustering has good accuracy and robustness, and effectively reduces the impact of peel color change on anti-counterfeiting identification during mango ripening. These results support that it is feasible to use the lenticels distribution of mango as a biological fingerprint. In this paper, a computer vision anti-counterfeiting method based on lenticels distribution is proposed.

    • Anti-counterfeiting of agricultural products plays an important role in the world market with the development of economic globalization and the rapid growth of the demand for agricultural products[1]. On the one hand, reliable anti-counterfeiting systems can increase consumers' confidence in product quality[2,3]. On the other hand, it is convenient for enterprises to supervise the quality of agricultural products and establish brands[4,5]. Because of the influence of COVID-19, consumers are more sensitive to the origin of agricultural products, and reliable anti-counterfeiting technology is urgently needed. Currently, the main food anti-counterfeiting technologies include: packaging anti-counterfeiting technology, label anti-counterfeiting technology and radio frequency identification (RFID) anti-counterfeiting technology[6,7]. These anti-counterfeiting technologies judge the authenticity by identifying the adscititious anti-counterfeiting substances (packaging, label, RF card). The disadvantage of these technologies is that consumers cannot distinguish between real anti-counterfeiting substances and imitations with an imitation degree of up to 70%, and it is difficult to prevent anti-counterfeiting substances from being used repeatedly[8,9].

      Biological fingerprint refers to the behavioral and biological characteristics that can be used to identify individuals, which has been widely used in personal identification[10]. For example, human beings verify their individual identity by fingerprints, face and iris[1113]. Agricultural products also have their own biological fingerprints[14]. With the maturity of biological fingerprint technology, it has great development prospects in the field of anti-counterfeiting of agricultural products. The biological fingerprint of agricultural products is closely related to agricultural products, which is difficult to copy and reuse. The biological fingerprint on the surface of agricultural products can be non-destructively identified by computer vision. Using biological fingerprints of agricultural products for anti-counterfeiting can effectively improve the difficulty and cost of forgery, and does not need adscititious anti-counterfeiting substances.

      Lenticels are brown or white spots and stripes usually seen on the surface of plants. They are aerenchyma for plants to exchange gas with the outside world[15]. The research showed that the number and location of lenticels on mango peels were random. The location of lenticels would change due to its own size during the development of mango fruit. However, the location and size of the lenticels would hardly change after the green ripe stage[16,17]. Meaning, the features of mango lenticels are random and stable, providing good potential for biological fingerprints. However, the peel color of mango will change significantly during ripening, which may affect the recognition of mango lenticel features by computer vision.

      Biological fingerprint recognition algorithms are highly dependent on the quality of the acquired biological fingerprint images[18]. Images with less obvious biological fingerprint features are usually improved using image enhancement. The enhancement process should be adaptive to the fingerprint quality to achieve the desired effect of image enhancement. Therefore, it is essential to design a quality adaptive enhancement method for biometric fingerprint images of different qualities.

      Clustering refers to dividing a data set into different clusters according to a specific standard, so that the similarity of data objects in the same cluster is as large as possible, and the differences of data objects not in the same cluster are as large as possible. Among many fuzzy clustering algorithms, the fuzzy C-means clustering algorithm is the most successful and widely used[19]. It obtains the membership degree of each sample point to all class centers by optimizing the objective function, to determine the class of sample points, so as to achieve the purpose of automatic classification of sample data. Fuzzy C-means clustering algorithm is used to cluster the images with less obvious biological fingerprint features, to match the appropriate image enhancement methods to obtain better biometric fingerprint recognition effect.

    • Mango individual identity anti-counterfeiting system based on biometric fingerprints includes two parts: the establishment of identity, and the verification of identity. This workflow is shown in Fig. 1.
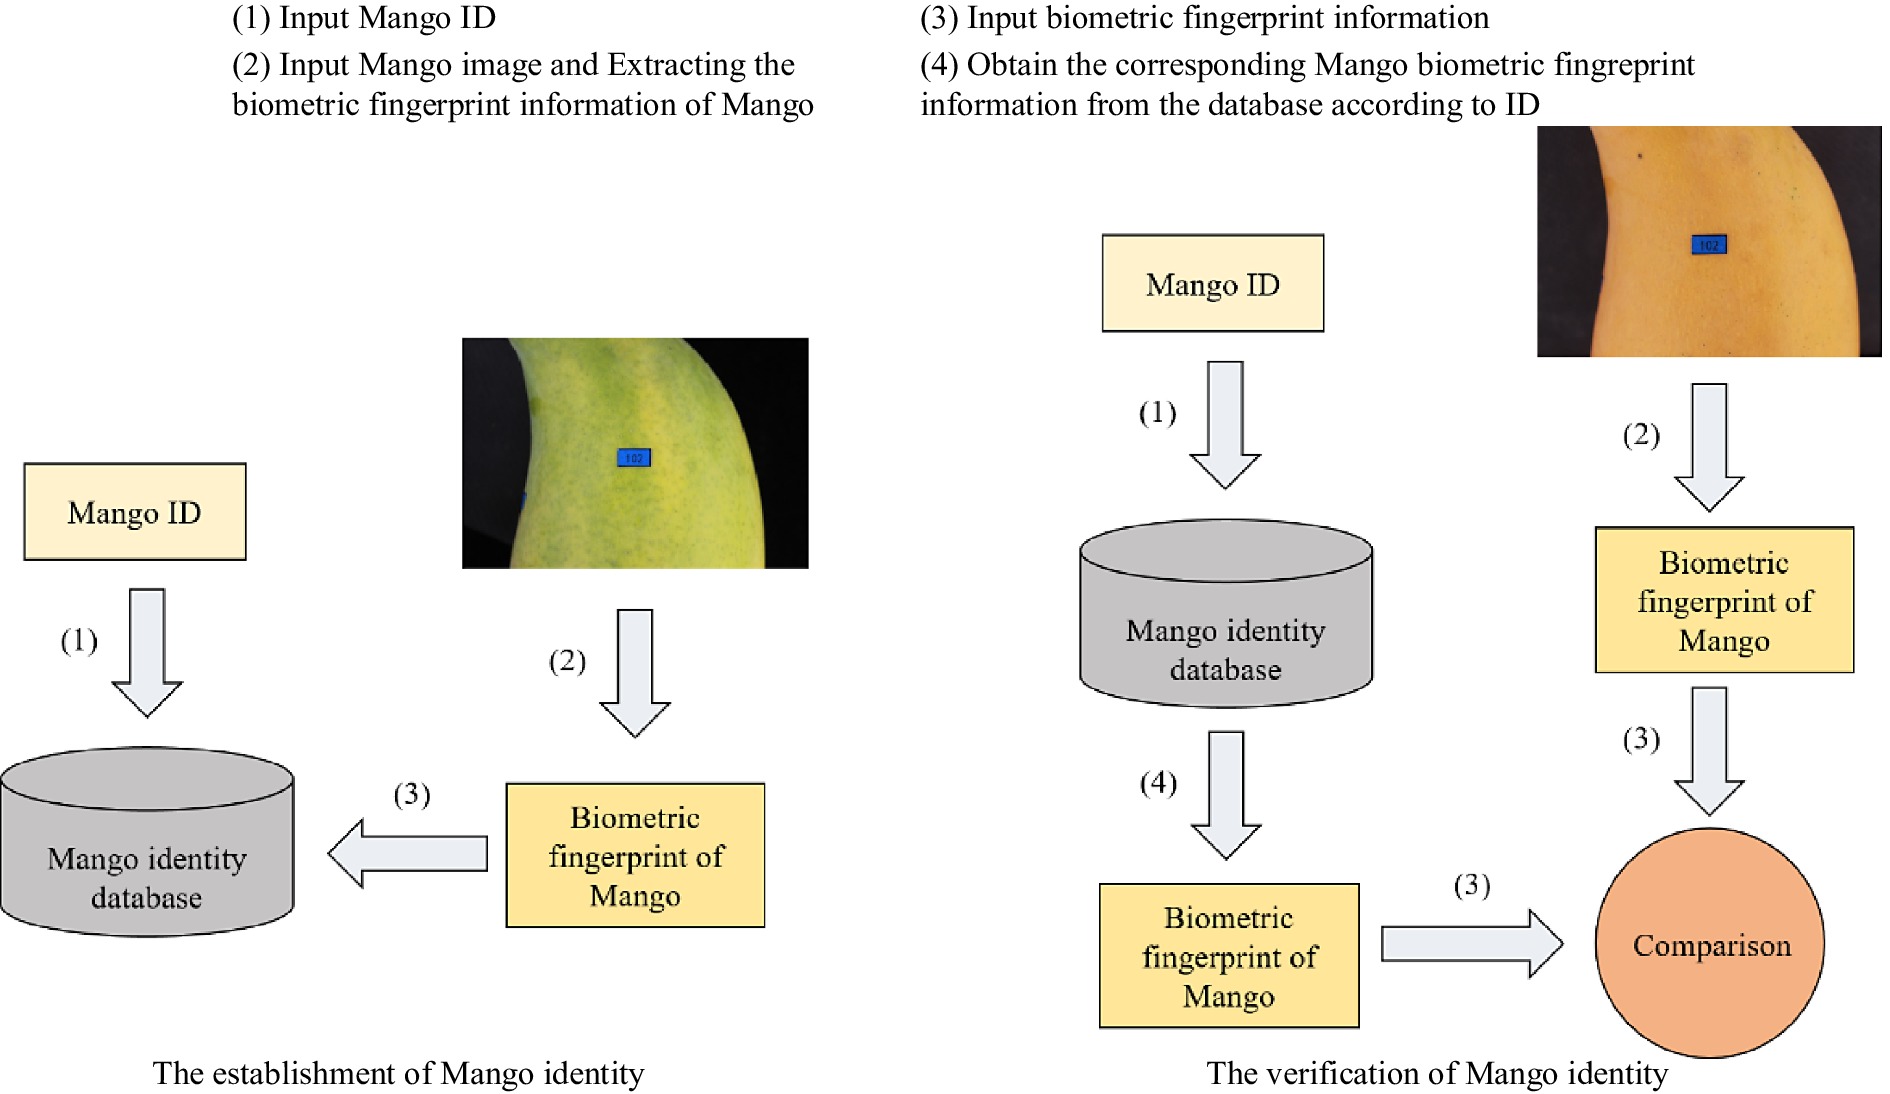
      Figure 1. 

      Mango individual identity anti-counterfeiting system based on biometric fingerprints.

    • Two hundred and fourty green ripe mangoes (Mangifera indica L., Aroemanis) with similar maturity and no visual defects were produced in Yunnan, China, and purchased from the local market in Beijing, China. The mango sample was labeled in the center of the fruit. The serial numbers marked on the blue label were used to indicate the ID of mango individuals. These serial numbers were unique. Clear images were obtained for further experiments through the following processes:

      (1) Establishment of mango identity (EI): Images of green ripe mango were acquired by camera to establish mango identity database (MIDD).

      (2) Verification of green ripe mango identity (VGI): Images of green ripe mango were acquired by camera to verify the acquired images with the MIDD.

      (3) Verification of ripe mango identity (VRI): After ripening mango, images of ripe mango were acquired by camera to verify the acquired images with the MIDD.

      (4) Verification of ripe mango identity with different equipment (VRIE): After ripening mango, images of ripe mango were acquired by mobile phone to verify the acquired images with the MIDD.

      Mangoes were stored at 25 ± 1 °C. The mango was considered as ripe when more than 3/4 of its surface were yellow.

    • Images were acquired by camera (Sony A33, 18 million pixels) and mobile phone (Huawei Mate 40, 12 million pixels;iPhone 11, 12 million pixels;Xiaomi 9, 12 million pixels) respectively. The parameters of the camera were: F/5.6, 0 exposure compensation, 1/125 s exposure time and 35 mm focal length. The main camera of mobile phone was selected. The parameters of the mobile phone were: F/5.6, 0 exposure compensation, 1/125 s exposure time and 35 mm focal length. Each mango was placed in a fixed position in the photo acquisition device. The background was set to black and illuminated by two rows of LED lights. The label was placed in the center of the image, and the four sides of the label were parallel to the four sides of the image. The images were stored on the computer in JPG format.

      We obtained 230 images of EI, 230 images of VGI, 225 images of VRI and 225 images of VRIE for further studies by removing the mango with visual defects caused by storage. Then, the images were processed using MATLAB R2018a.

      The time of identity establishment and identity verification is the CPU processing time using Lenovo laptop AMD core R7-4800U CPU and 16 GB RAM running Microsoft windows 10 64-bit operating system with MATLAB R2018a.

    • Extracting the blue color layer with the same color as the label could obtain the monochromatic image with obvious features of the label. Since only the label in the image was blue, the binary image of the label could be obtained by binarizing the monochrome image at a certain threshold. The binary image was optimized by opening operation to remove the noise, so that only the relevant features of the label were retained. Thus, the position and size of the label area were obtained.

    • After the label was positioned, the original image (Fig. 2a) was rotated and scaled according to the position and size of the label, ensuring the four sides of the label were parallel to the four sides of the image. The label size was unified to 60 × 100 pixels. Then through cutting processing, we finally obtained the scale normalized image (220 × 220 pixels, Fig. 2b) with the label (60 × 100 pixels) in the center.
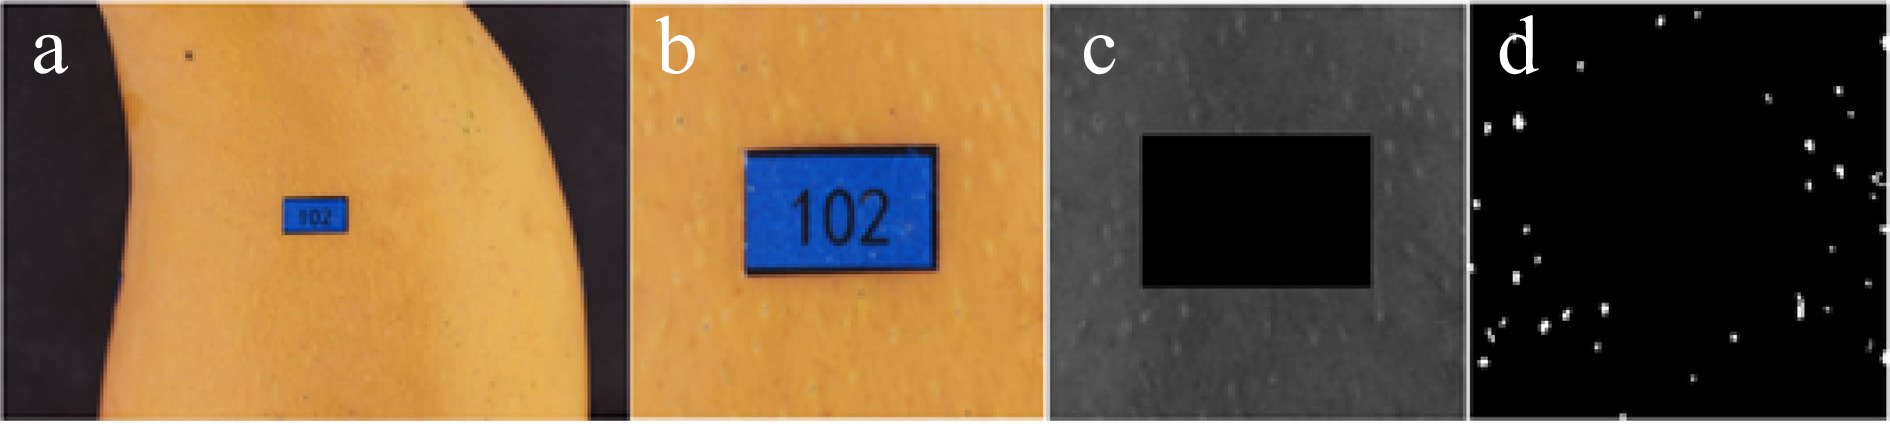
      Figure 2. 

      Image processing. (a) Original image. (b) Scale normalized image. (c) Gray normalized image. (d) Binary image.

      Although we reduced the change of illumination as much as possible, the image was still affected by the illumination angle and other factors. The gray value and variance of the image needed to be normalized to a specific range after the image was transformed into a gray image, so as to reduce the influence of the gray level change caused by the change of illumination on the identification effect[20,21]. The image was divided into 100 blocks (26 × 26 pixels). The gray average and variance of each block were calculated and expressed in MX and VX. M0 and V0 were the expected gray average and variance. The I(i, j) was the gray value of the corresponding coordinate pixel in the image. The G(i, j) was the normalized gray value. The equations were as follows:

      G(i,j)=M0+V0[I(i,j)Mx]2VxI(i,j)>Mx (1)
      G(i,j)=M0V0[I(i,j)Mx]2VxI(i,j)Mx (2)

      To smooth noise and preserve the edges of the images, median filtering was adopted[22]. Finally, the normalized image was obtained (Fig. 2c).

    • Owing to the different colors of mango lenticels and a lot of redundant information in the background area, if the whole image is binarized with the same threshold, a lot of useful information will be lost. For better feature segmentation, the image was binarized using the adaptive threshold method[23,24]. The binary image was optimized by opening operation to remove the noise or instability features left in the image. In the end, we would gain clear binary images (220 × 220 pixels, Fig. 2d). Record the coordinates of the feature area in the binary image, which contains the information of the position and size of mango lenticels, that is, the mango lenticel feature.

      Because the peel color of mango changed after ripening, we modified several parameters in image preprocessing and feature extraction for mango in different ripening states, and other methods were completely consistent.

    • The image of EI was used as the standard image. The position and size of lenticels were used to establish the MIDD. After the mango image which needed to be verified were processed as described above, the obtained lenticel feature could be compared with the lenticel feature of the corresponding identity mango in the MIDD. If two lenticels from different images partially coincided, the matching of the lenticel was regarded as successful.

      The similarity value was calculated by the successfully matched lenticel area divided by the sum of the lenticel area of the two images.

    • One hundred and seventyfive images of VRI and 175 images of VRIE were randomly selected for Fuzzy C-means clustering. The remaining 50 images of VRI and 50 images of VRIE were tested for identification. The images used for Fuzzy C-means clustering would be preprocessed to obtain the normalized image. Then, the following operations were carried out.

    • We selected some relevant characteristics, which can define the image quality to cluster the normalized image into different quality levels.

      (1) Average value: the average value of the gray value of all pixels in the image.

      (2) Variance: the variance of the gray value of all pixels in the image.

      (3) Maximum gray value: the maximum gray value of all pixels in the image.

      (4) Minimum gray value: the minimum gray value of all pixels in the image.

      (5) Contrast: contrast refered to the ratio between the brightest white and the darkest black in the image, that is, the gradient level of the grayscale of the image. A large contrast value represented more gradient levels and richer color expression.

      C=δδ(i,j)2Pδ(i,j) (3)

      Where, δ(i,j) represented the gray level difference between adjacent pixels, Pδ(i,j) indicated that the distribution probability in which the gray level difference between adjacent pixels was δ(i,j).

      (6) Uniformity: the uniformity of the distribution of image pixels on the gray histogram.

      U=1255i=0|ris/255|255i=0(ri+s/255) (4)

      Where, ri represented the number of pixels in the image with gray value i, and s represented the sum of gray values of all pixels in the image.

      (7) One-dimensional entropy: the image entropy reflected the average amount of information in the image. The one-dimensional entropy of an image represents the amount of information contained in the aggregated characteristics of the gray distribution of the image.

      H=255i=0PilogPi (5)

      Where, Pi represented the proportion of pixels in the image whose gray value was i.

      (8) Two-dimensional entropy: in order to characterize the spatial characteristics of the gray distribution of the image, one-dimensional entropy and the characteristic quantity that could reflect the spatial characteristics of the gray distribution form the two-dimensional entropy of the image.

      H=ijPi,jlogPi,j (6)

      Where, Pi,j represented the proportion of pixels with gray value was i and domain mean value was j in the image.

      The above characteristics needed further screening. Each cluster characteristics of 350 normalized images were calculated respectively, the cluster characteristics were then normalized. The characteristics with low coefficient of variation (less than 0.15) were removed and then the similarity between the remaining characteristics were calculated, respectively. If the two characteristics were significantly correlated (the absolute value is greater than 0.6), only one characteristic would be retained. Finally, three cluster characteristics were obtained which could be used to classify image quality including the variance, the minimum gray value, and the contrast.

    • According to the clustering characteristics obtained in the above steps, 350 normalized images were clustered. They were divided into three categories (I, II and III) by using the Fuzzy C-means clustering algorithm. The three clustering centers were recorded. When the image to be verified needed quality classification, the membership degree between it and the three clustering centers could be calculated to judge the quality category it belonged to[25].

    • The method proposed in this paper was to calculate the lenticel feature similarity between the mango to be verified and the mango with the same ID in the database, judging the authenticity of mango identity. When the VGI, VRI and VRIE groups were verifying the identity of mango, we input the correct mango ID as the positive sample and the wrong mango ID as the negative sample. The performance of the mango identification method was evaluated by the Receiver Operating Characteristic (ROC) curve, the Equal Error Rate (EER) and the verification time (the total time of image reading, image preprocessing, feature extraction and similarity calculation). The ROC curve was a graph of the True Positive Rate (TPR) and the False Positive Rate (FPR). The TPR and FPR were defined as following:

      TPR = TPTP + FN (7)
      FPR = FPFP + TN (8)

      The definition of TP, FP, TN and FN are shown in Table 1.

      Table 1.  Prediction results of the identification method.

      Positive sampleNegative sample
      Correct identificationTP (True positive)FP (False positive)
      Error identificationFN (False negative)TN (True negative)

      The EER was the point on the ROC curve corresponding to an equal probability of error identification for a positive or negative sample. This point was obtained by intersecting the ROC curve with a diagonal of the unit square. In other words, the EER was the FPR value when TPR + FPR = 1.

    • We only saved the lenticel feature information of mango image in the database. On average, the feature information of each mango only needed to occupy about 360 bytes of memory. Assuming that each mango weighs 0.25 kg, 1000 tons of mango only needed 1.4 GB of memory to back up and archive its identity information. In addition, the time of identity establishment (the total time of reading images, image preprocessing, feature extraction and writing to the database) only took about 0.60 s per mango. Therefore, this method could store and identify the identification information of mango with huge yield. Moreover, this method did not need a lot of image training. Compared to image identification by deep learning, the method reduced the computing power consumption and memory consumption significantly[26,27].

    • We performed image preprocessing and feature extraction for 230 VGI, 225 VRI and 225 VRIE respectively. The extracted features were compared with the features of 230 EI in MIDD. The results were as follows:

      According to Fig. 3 and Table 2, the area under curve (AUC) value of the ROC curve obtained by the VGI group was very close to 1, and the EER was very close to 0%, indicating that the lenticel distribution on the mango fruit surface were unique. The changes in the shooting angle and shooting height within a certain range had little impact on the identification effect. Compared to the results of the VRI and VGI group, we could find that the change of the peel color of the mango during the ripening process did impact the identification rate greatly of this method. However, the AUC value above 0.98 and the EER within 5% indicated that the mango identity could be identified by this method as long as the fruit did not have obvious visual defects, proving that the lenticels distribution on the surface of mango fruit had good stability. In the VRIE group, we used three different mobile phones to acquire images. Through comparison with the VRI group, we found that different shooting equipment from the EI group would reduce the accuracy of identification.
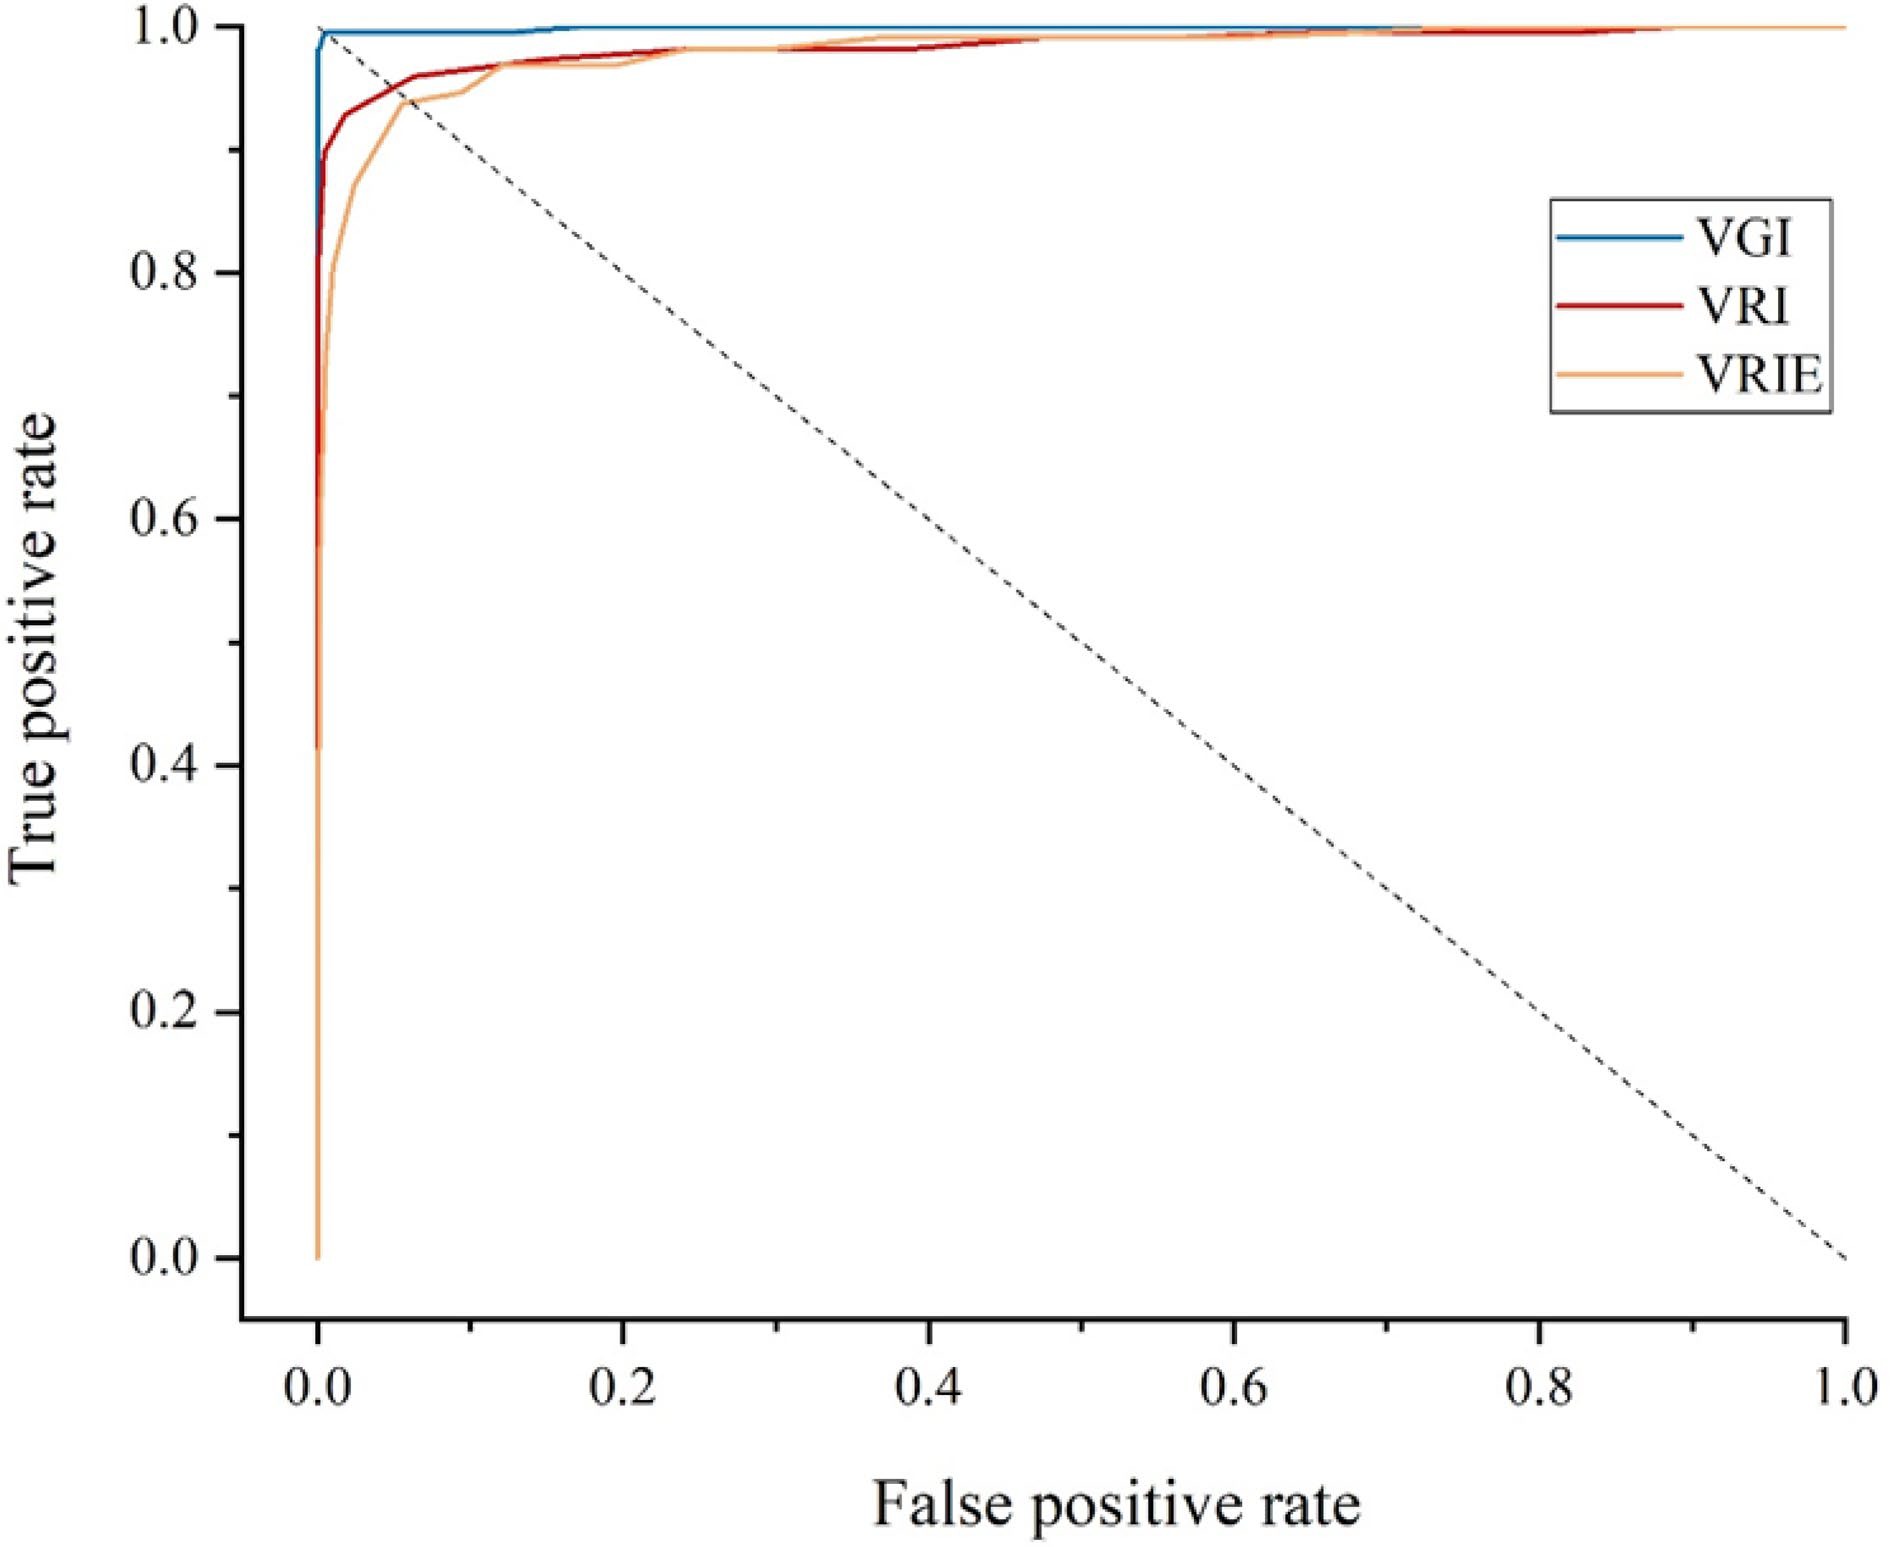
      Figure 3. 

      The ROC curves of conventional mango identification methods.

      Table 2.  Performance of conventional mango identification methods.

      Verification time (s)AUCEER (%)
      VGI0.61950.99930.43
      VRI0.60580.98534.80
      VRIE0.39930.98056.23

      The average verification time of the three groups of images are shown in Table 2. According to the above identification method, the verification time of the images taken by the camera was about 0.61 s. The difference in pixel size of the original image captured by different photographing equipment affected the verification time significantly. Larger original images required longer verification time.

      The above results proved the feasibility of anti-counterfeiting via the lenticel features of mango as a biological fingerprint. However, we also observed that the accuracy and robustness of this method need to be improved. The identification method needed to be further optimized to improve the effect.

    • In order to further improve the accuracy of the anti-counterfeiting method and reduce the influence of peel color changes during mango ripening, the image enhancement technology was used to highlight features to make it easier to extract and identify. However, due to the differences in image quality and ripening process of each mango individual, a single image enhancement technology could not meet the needs. Therefore, we used Fuzzy C-means clustering to classify the images to be verified into three categories according to the image quality. After the image was pre-processed, we calculated its membership degree with the three clustering centers to judge its quality category. Then, the corresponding image enhancement technology was carried out to facilitate the subsequent feature extraction.

      One hundred and seventyfive images of VRI and 175 images of VRIE were randomly selected for Fuzzy C-means clustering. The remaining 50 images of VRI and 50 images of VRIE were identified. The obtained results were expressed as VRIC and VRIEC.

      We clustered 350 normalized images into three categories through fuzzy C-means clustering. These three categories of images were different from the minimum gray value, variance and contrast (Fig. 4). After Fuzzy C-means clustering, we found that the features of class I images were relatively obvious, and the feature extraction could be carried out well without image enhancement. The features of class II images were similar to the background gray values, which were difficult to extract. According to Fig. 4, we found that the minimum gray value and contrast of class II images were significantly smaller than those of class I images. We could use histogram equalization algorithms to improve the gap between feature and background[28]. The background part of class III images had more redundant information, which affected feature extraction. According to Fig. 4, we found that the gray variance and contrast of class III images were significantly larger than those of class I images. We use wavelet transform for image enhancement. After the original image was decomposed into images with different frequencies, we used various methods to enhance images with different frequencies, so that reducing the influence of the background part to improve this situation[24,25].
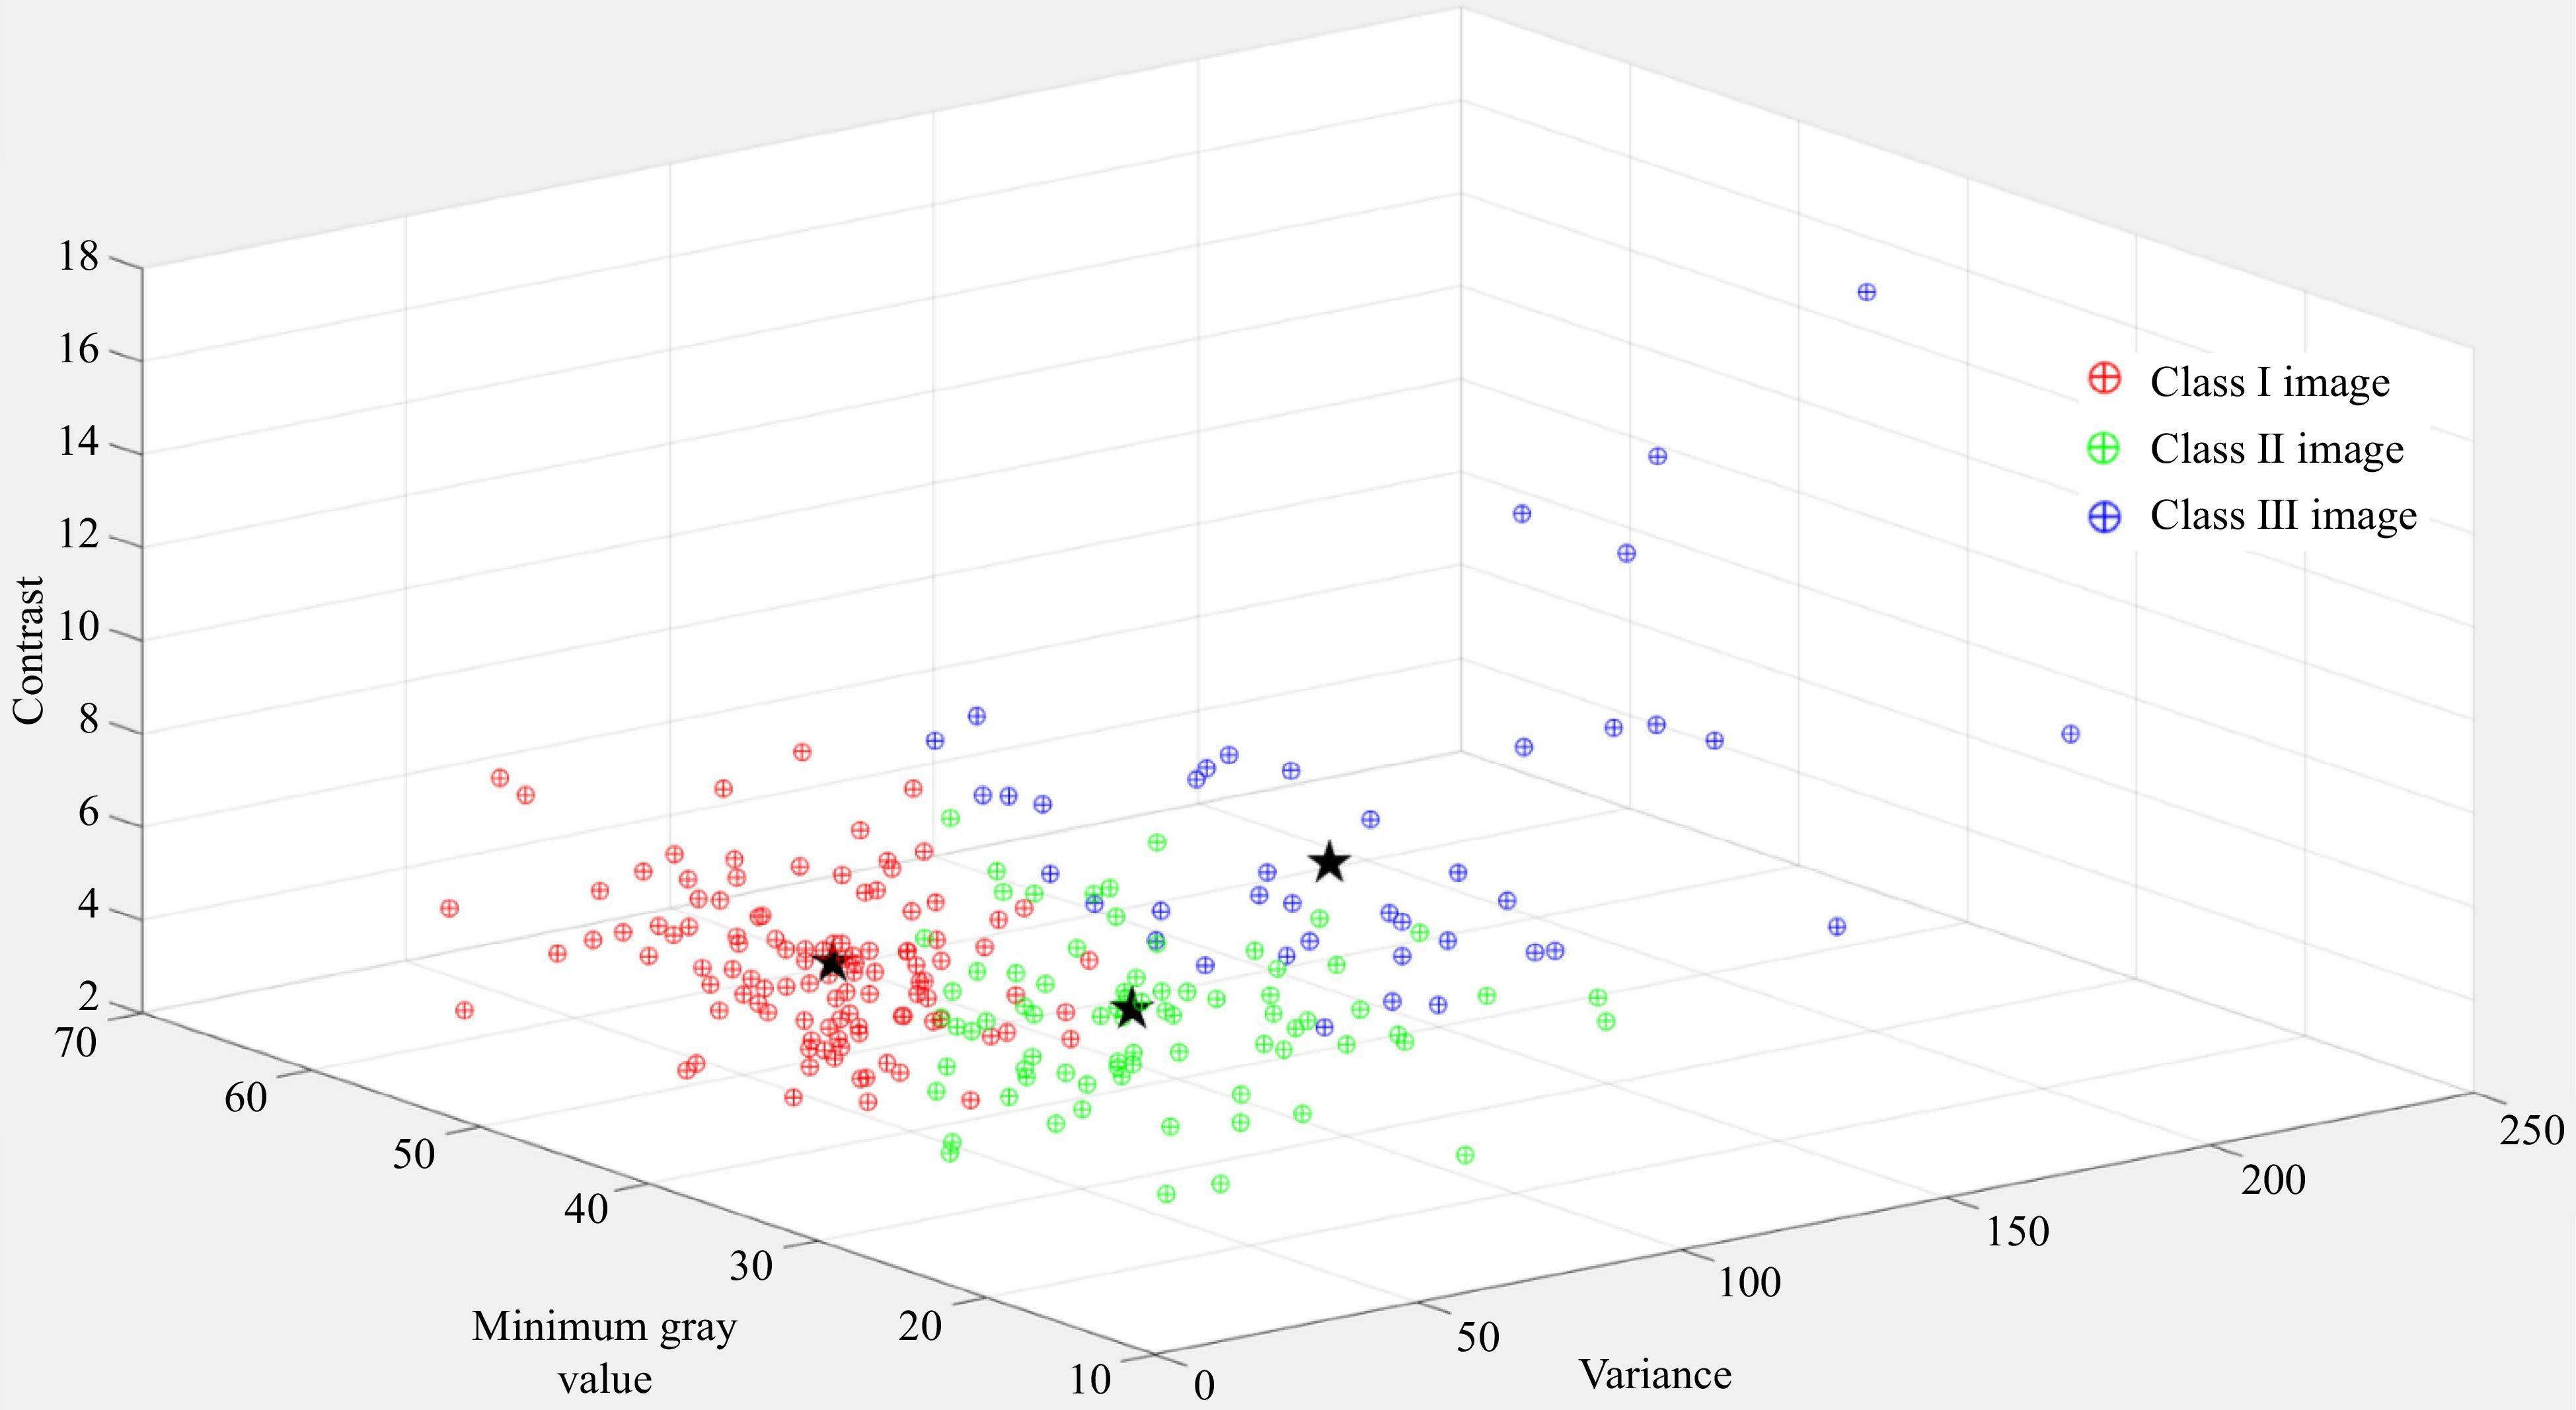
      Figure 4. 

      Fuzzy C-means clustering and clustering center of 350 normalized images.

      According to Fig. 4, the Fuzzy C-means clustering algorithm successfully clustered the images into three categories. According to Fig. 5 and Table 3, it can be seen that the impact on the changes of mango peel color could be reduced by using appropriate image enhancement techniques for different categories of images in the biometric fingerprint identification method. These strategies improved the accuracy and robustness of the method. After the image was enhanced, the AUC value of VRIC group was significantly improved and the EER was significantly decreased, which proved that the change of mango peel color had limited impact on the biometric fingerprint identification method. And the application scope of biometric fingerprint anti-counterfeiting method was broadened through our strategies. Compared to VRIE group, VRIEC group also reduced the impact significantly of different shooting equipment on accuracy. The presented results showed that the method had low equipment requirements. The consumers and administrators could simply complete image acquisition through a smart phone. The presented method of Fuzzy C-means clustering was very convenient for anti-counterfeiting.
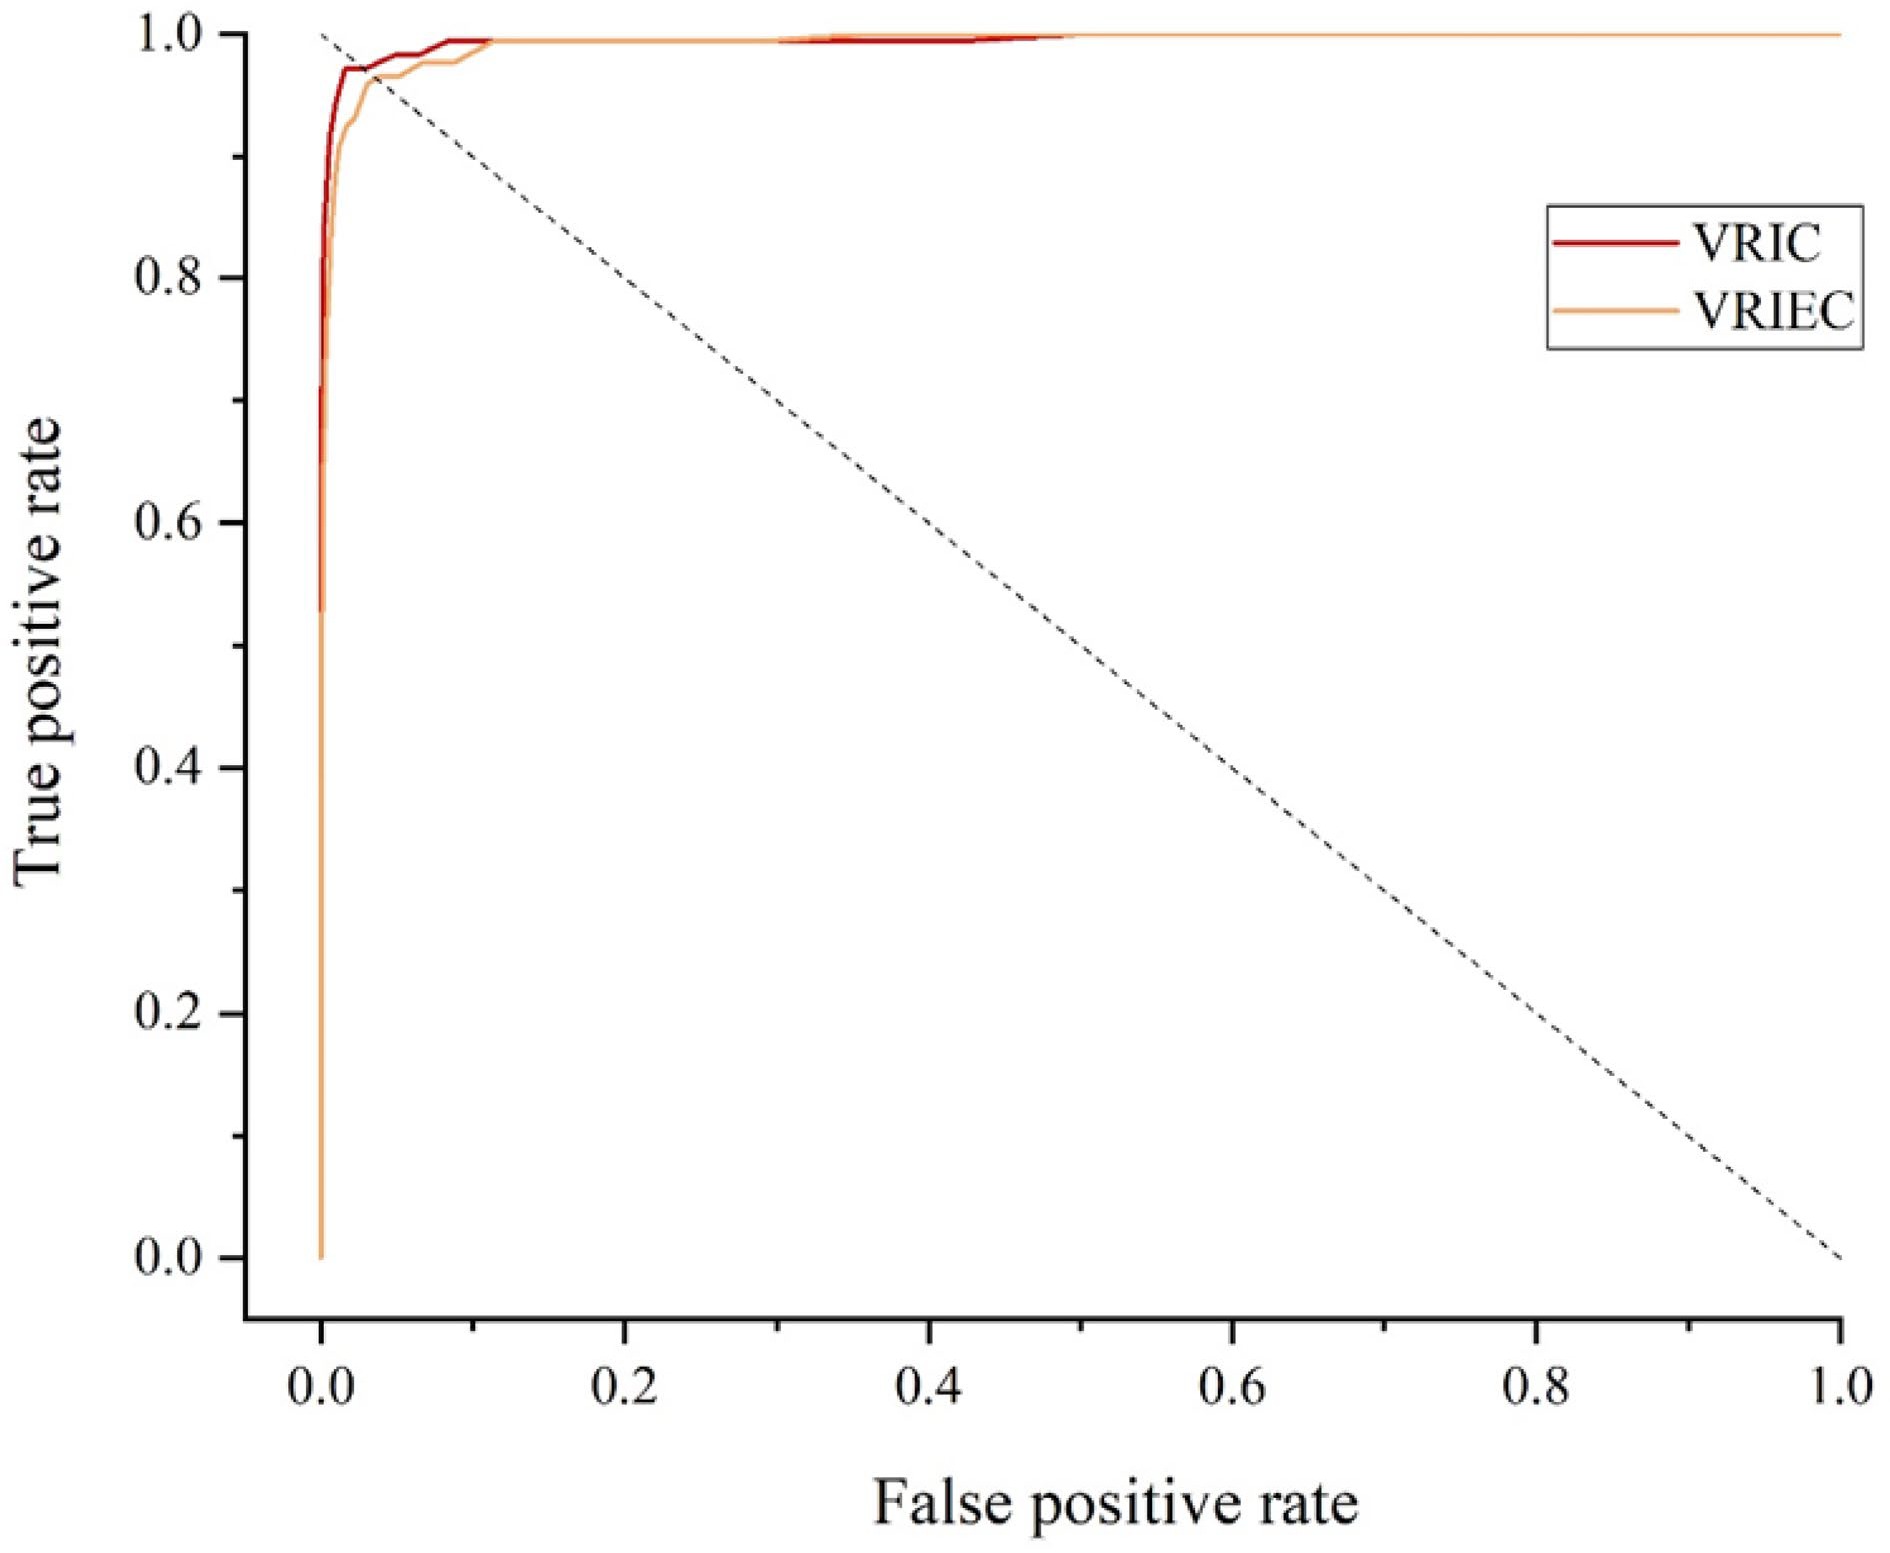
      Figure 5. 

      ROC curves of the mango identification method based on Fuzzy C-means clustering.

      Table 3.  Performance of the mango identification method based on Fuzzy C-means clustering.

      Verification time (s)AUCEER (%)
      VRIC0.63260.99502.86
      VRIEC0.42120.99303.43
    • This research proved the feasibility of taking the feature of mango lenticels as biological fingerprints. The changes of mango peel color had a limited influence on biological fingerprint identification methods. We effectively reduced the impact of the change of mango peel color on the biometric fingerprint identification method by the Fuzzy C-means clustering algorithm. A computer vision anti-counterfeiting method was proposed based on mango lenticel features, revealing the potential of the biometric fingerprint anti-counterfeiting recognition by using the surface features of agricultural products.

      • This work was supported by the National Natural Science Foundation of China (No. 32172270).

      • The authors declare that they have no conflict of interest.

      • Copyright: © 2023 by the author(s). Published by Maximum Academic Press on behalf of China Agricultural University, Zhejiang University and Shenyang Agricultural University. This article is an open access article distributed under Creative Commons Attribution License (CC BY 4.0), visit https://creativecommons.org/licenses/by/4.0/.
    Figure (5)  Table (3) References (28)
  • About this article
    Cite this article
    Shen C, Zhang Y, Chen L, Jia A, Cao J, et al. 2023. A mango biological fingerprint anti-counterfeiting method based on Fuzzy C-means clustering. Food Innovation and Advances 2(1):21−27 doi: 10.48130/FIA-2023-0004
    Shen C, Zhang Y, Chen L, Jia A, Cao J, et al. 2023. A mango biological fingerprint anti-counterfeiting method based on Fuzzy C-means clustering. Food Innovation and Advances 2(1):21−27 doi: 10.48130/FIA-2023-0004

Catalog

  • About this article

/

DownLoad:  Full-Size Img  PowerPoint
Return
Return