-
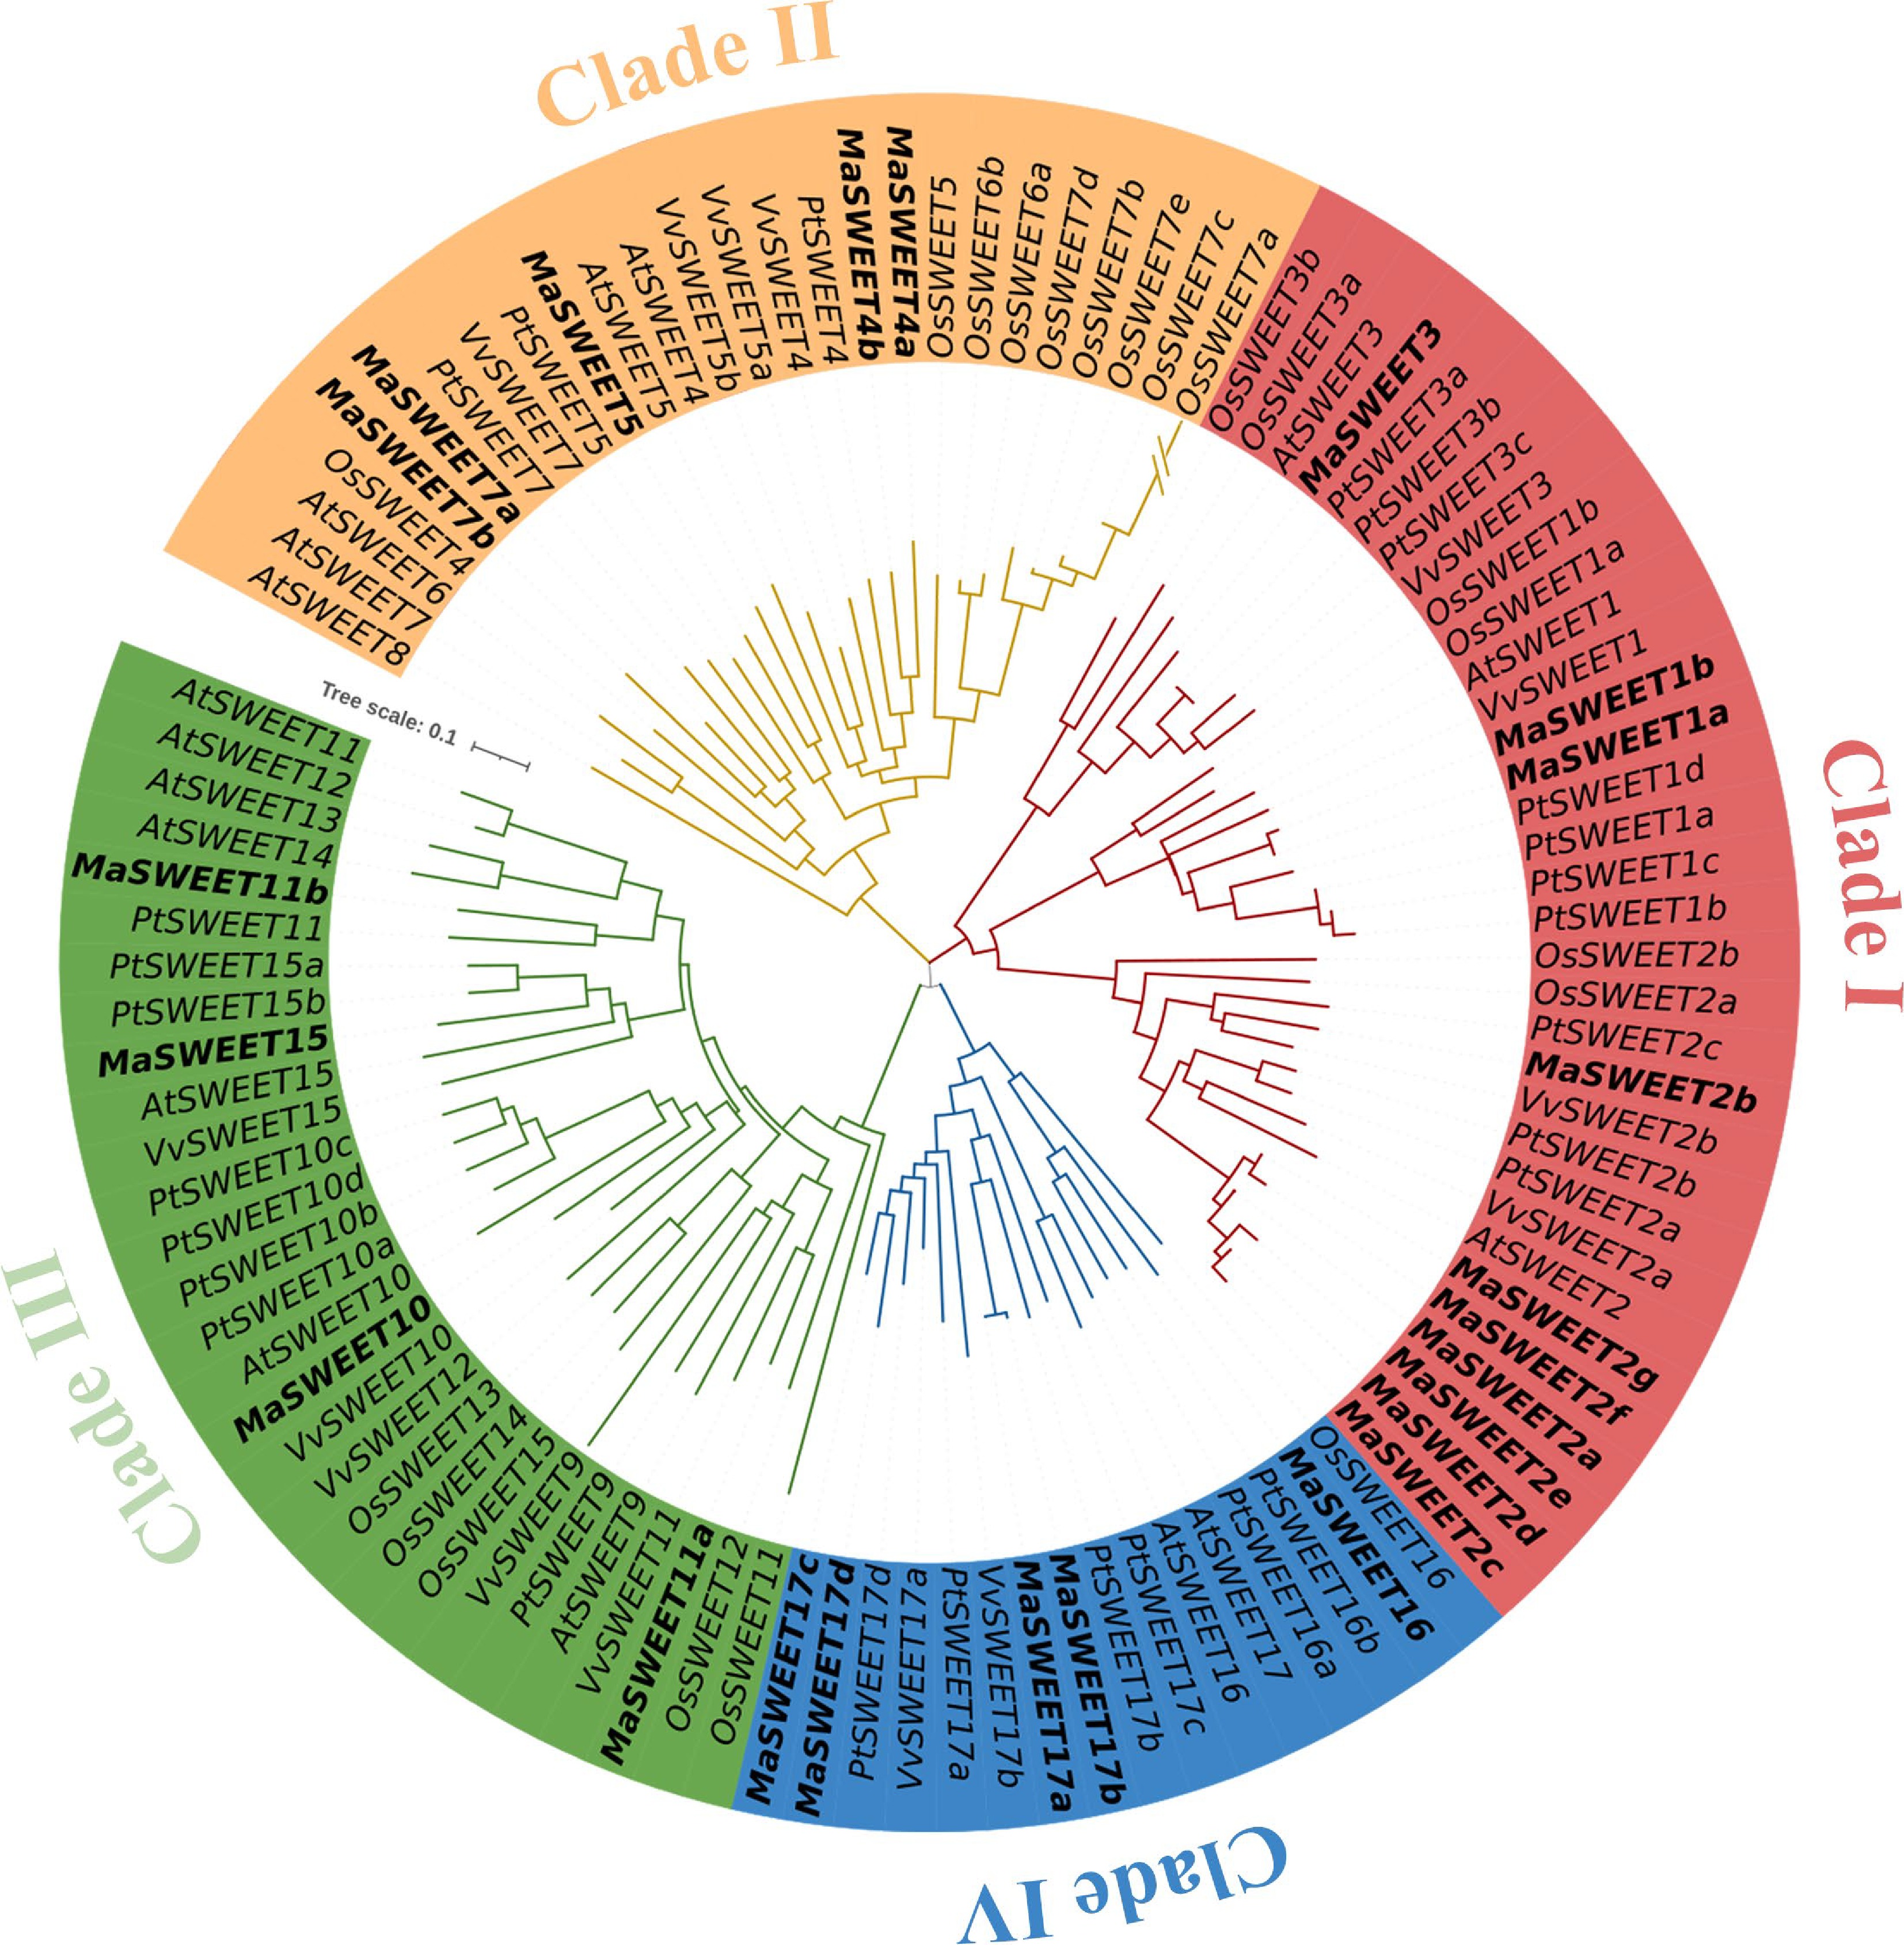
Figure 1.
Phylogenetic relationships of the SWEET family genes in Arabidopsis, Oryza sativa, Populus, Vitis vinifera, and Morus alba. The sequences of the 104 SWEET proteins from the above four plant species were aligned by Clustal Omega, and the phylogenetic tree was constructed by the MEGA 11.0 using the NJ method with 1000 bootstrap replicates. The proteins from Arabidopsis, Oryza sativa, Populus, Vitis vinifera, and Morus alba are indicated with the prefixes of At, Os, Pt, Vv, and Ma, respectively.
-
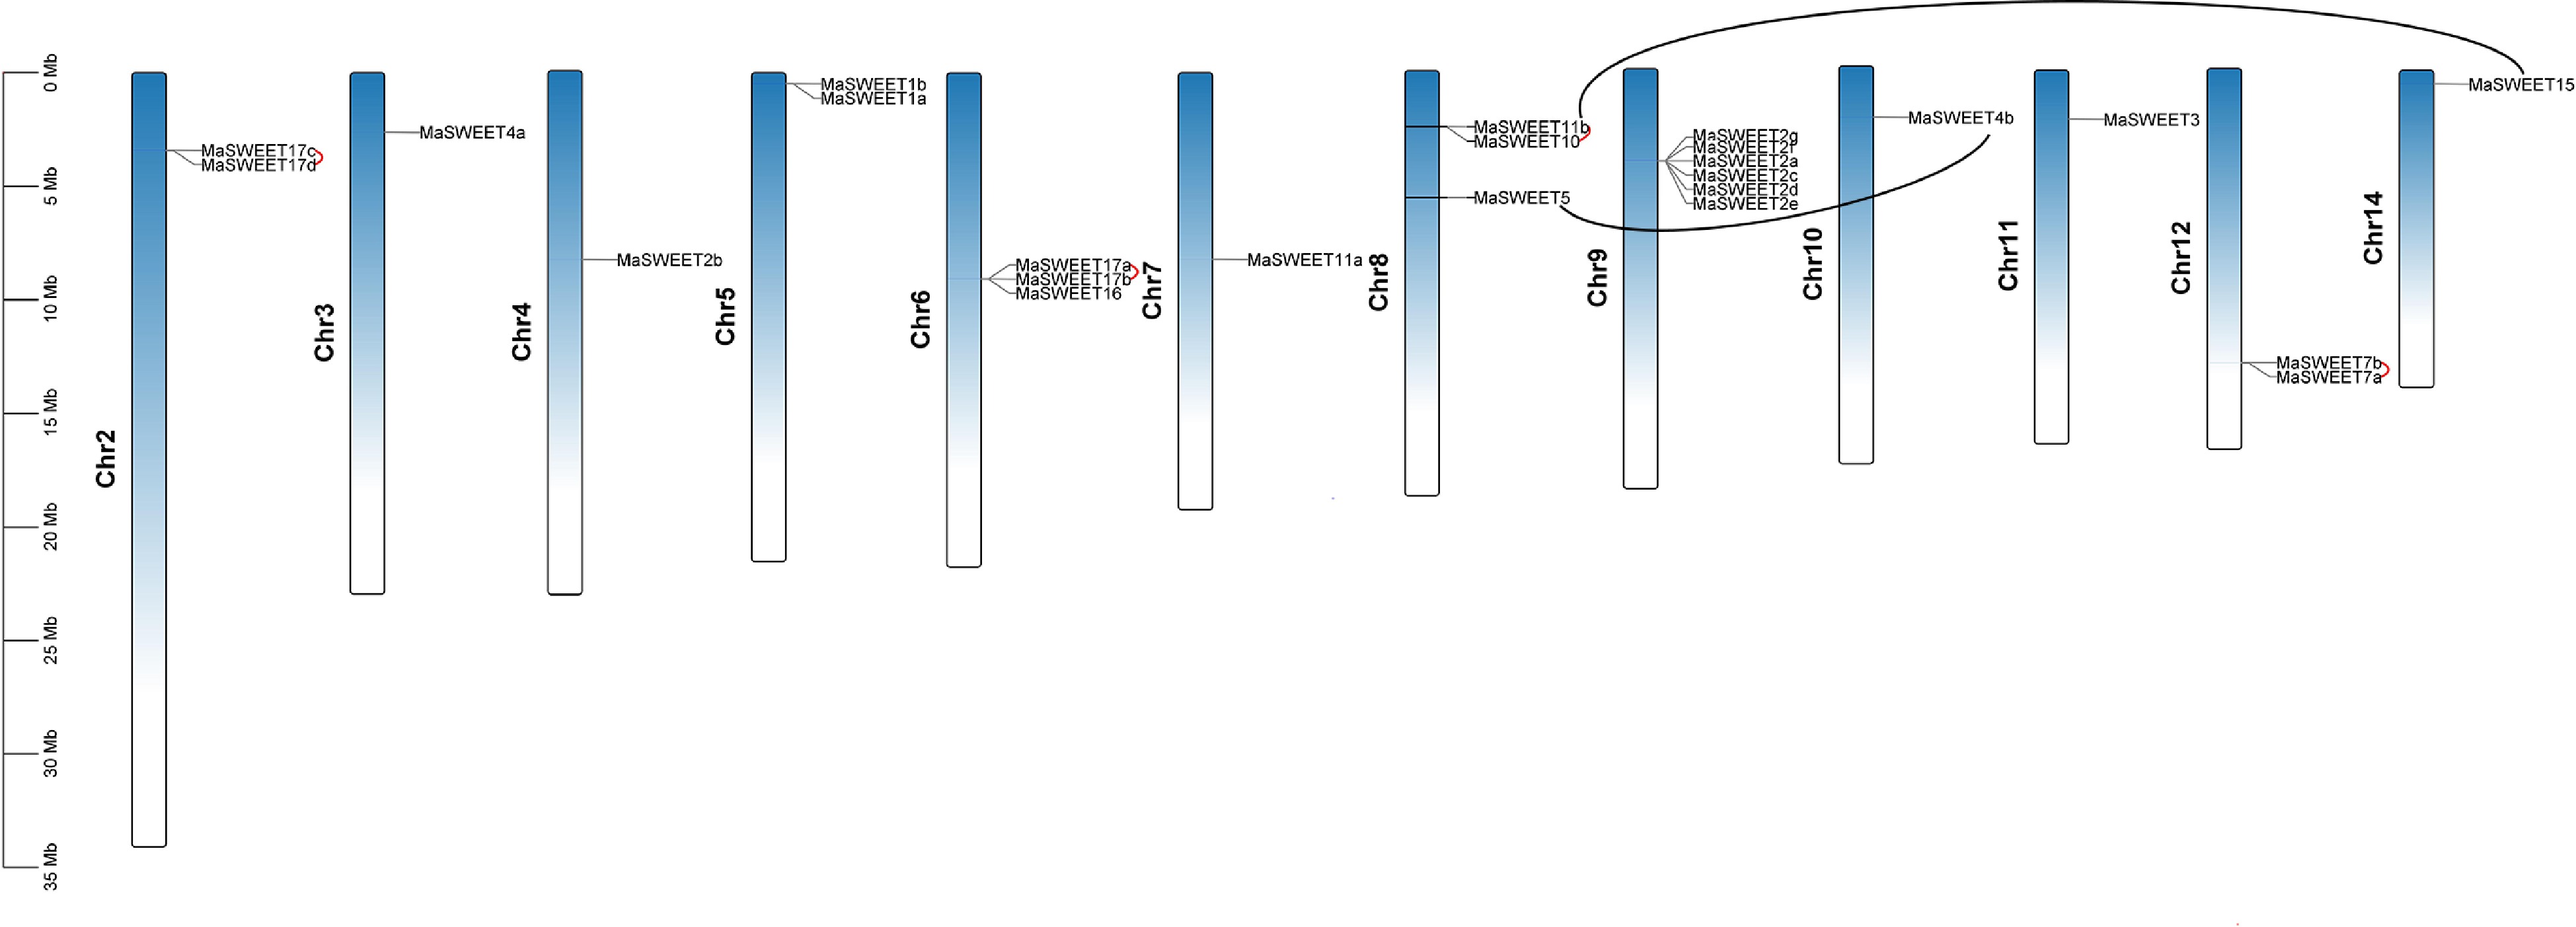
Figure 2.
Distribution of MaSWEET genes in Morus alba chromosomes. The tandem gene pairs are linked by red lines. The block duplications gene pairs are marked by black lines. The scale is provided in megabase (Mb).
-
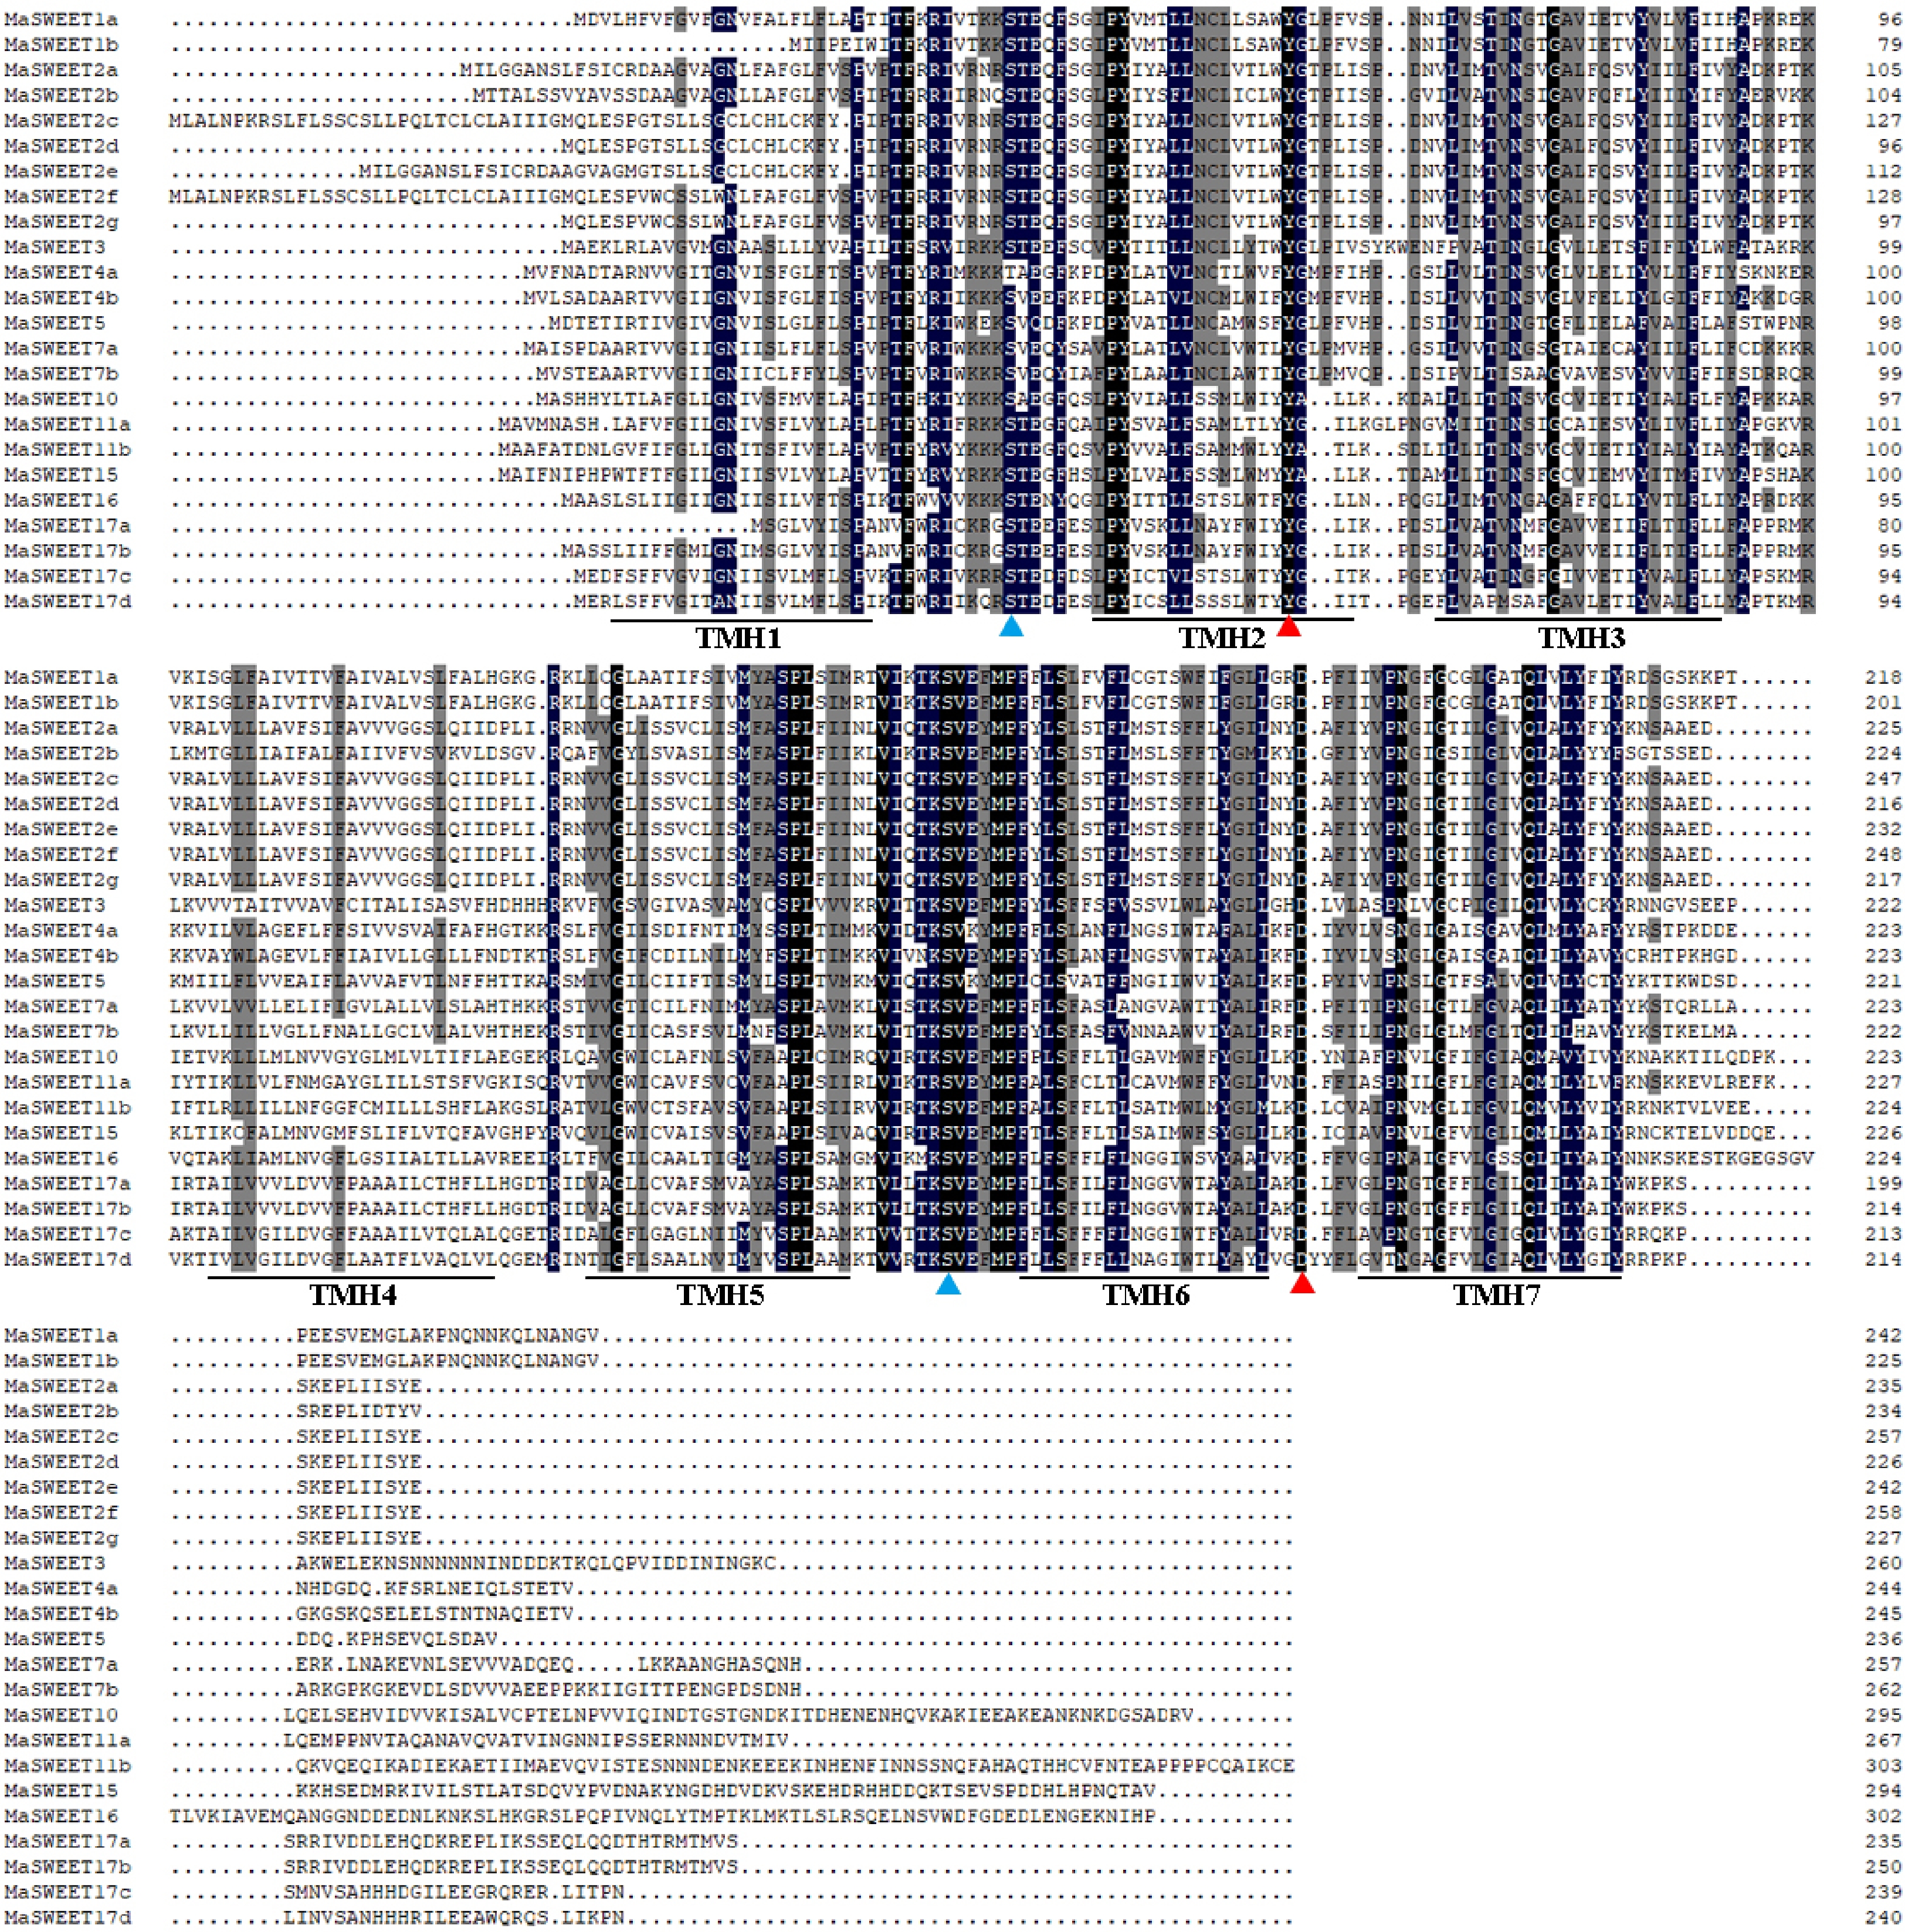
Figure 3.
Multiple sequence alignment of MaSWEET proteins. The positions of the TMHs are underlined. The positions of the active sites of tyrosine (Y) and aspartic acid (D) are indicated by red triangles. The conserved serine (S) phosphorylation sites are indicated by blue triangles.
-
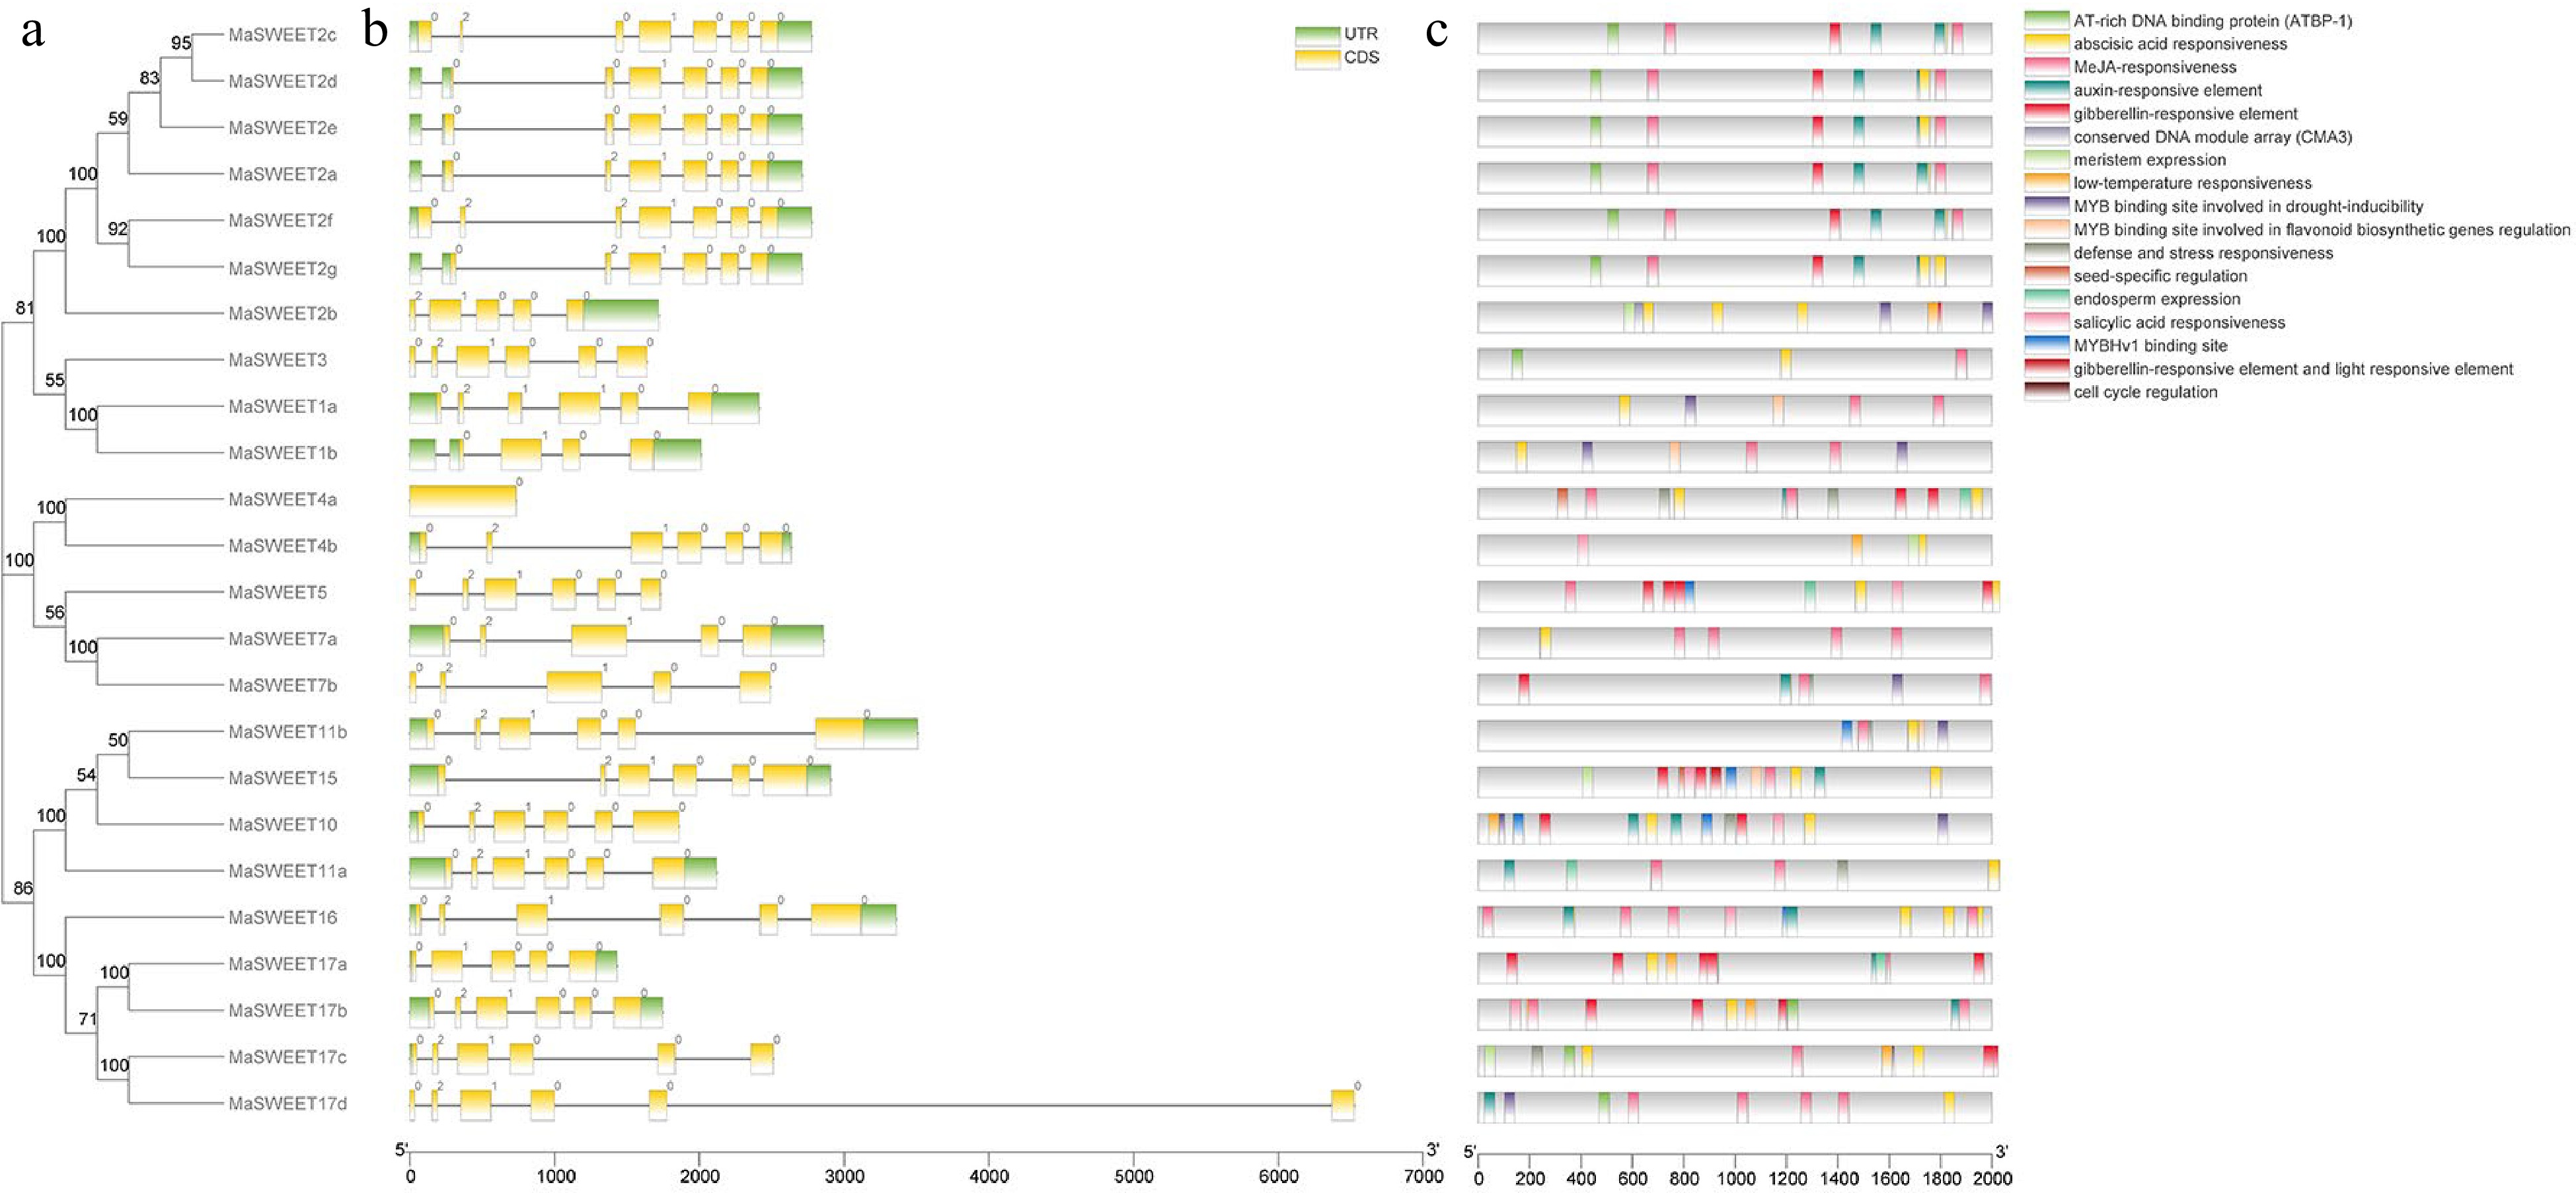
Figure 4.
Gene organization of MaSWEETs and cis-elements in promoter regions of MaSWEETs. (a) Phylogenetic tree using 24 MaSWEETs. (b) Exon/intron structures of Morus alba L. SWEETs. (c) Cis-element distribution in the promoter regions of MaSWEETs.
-
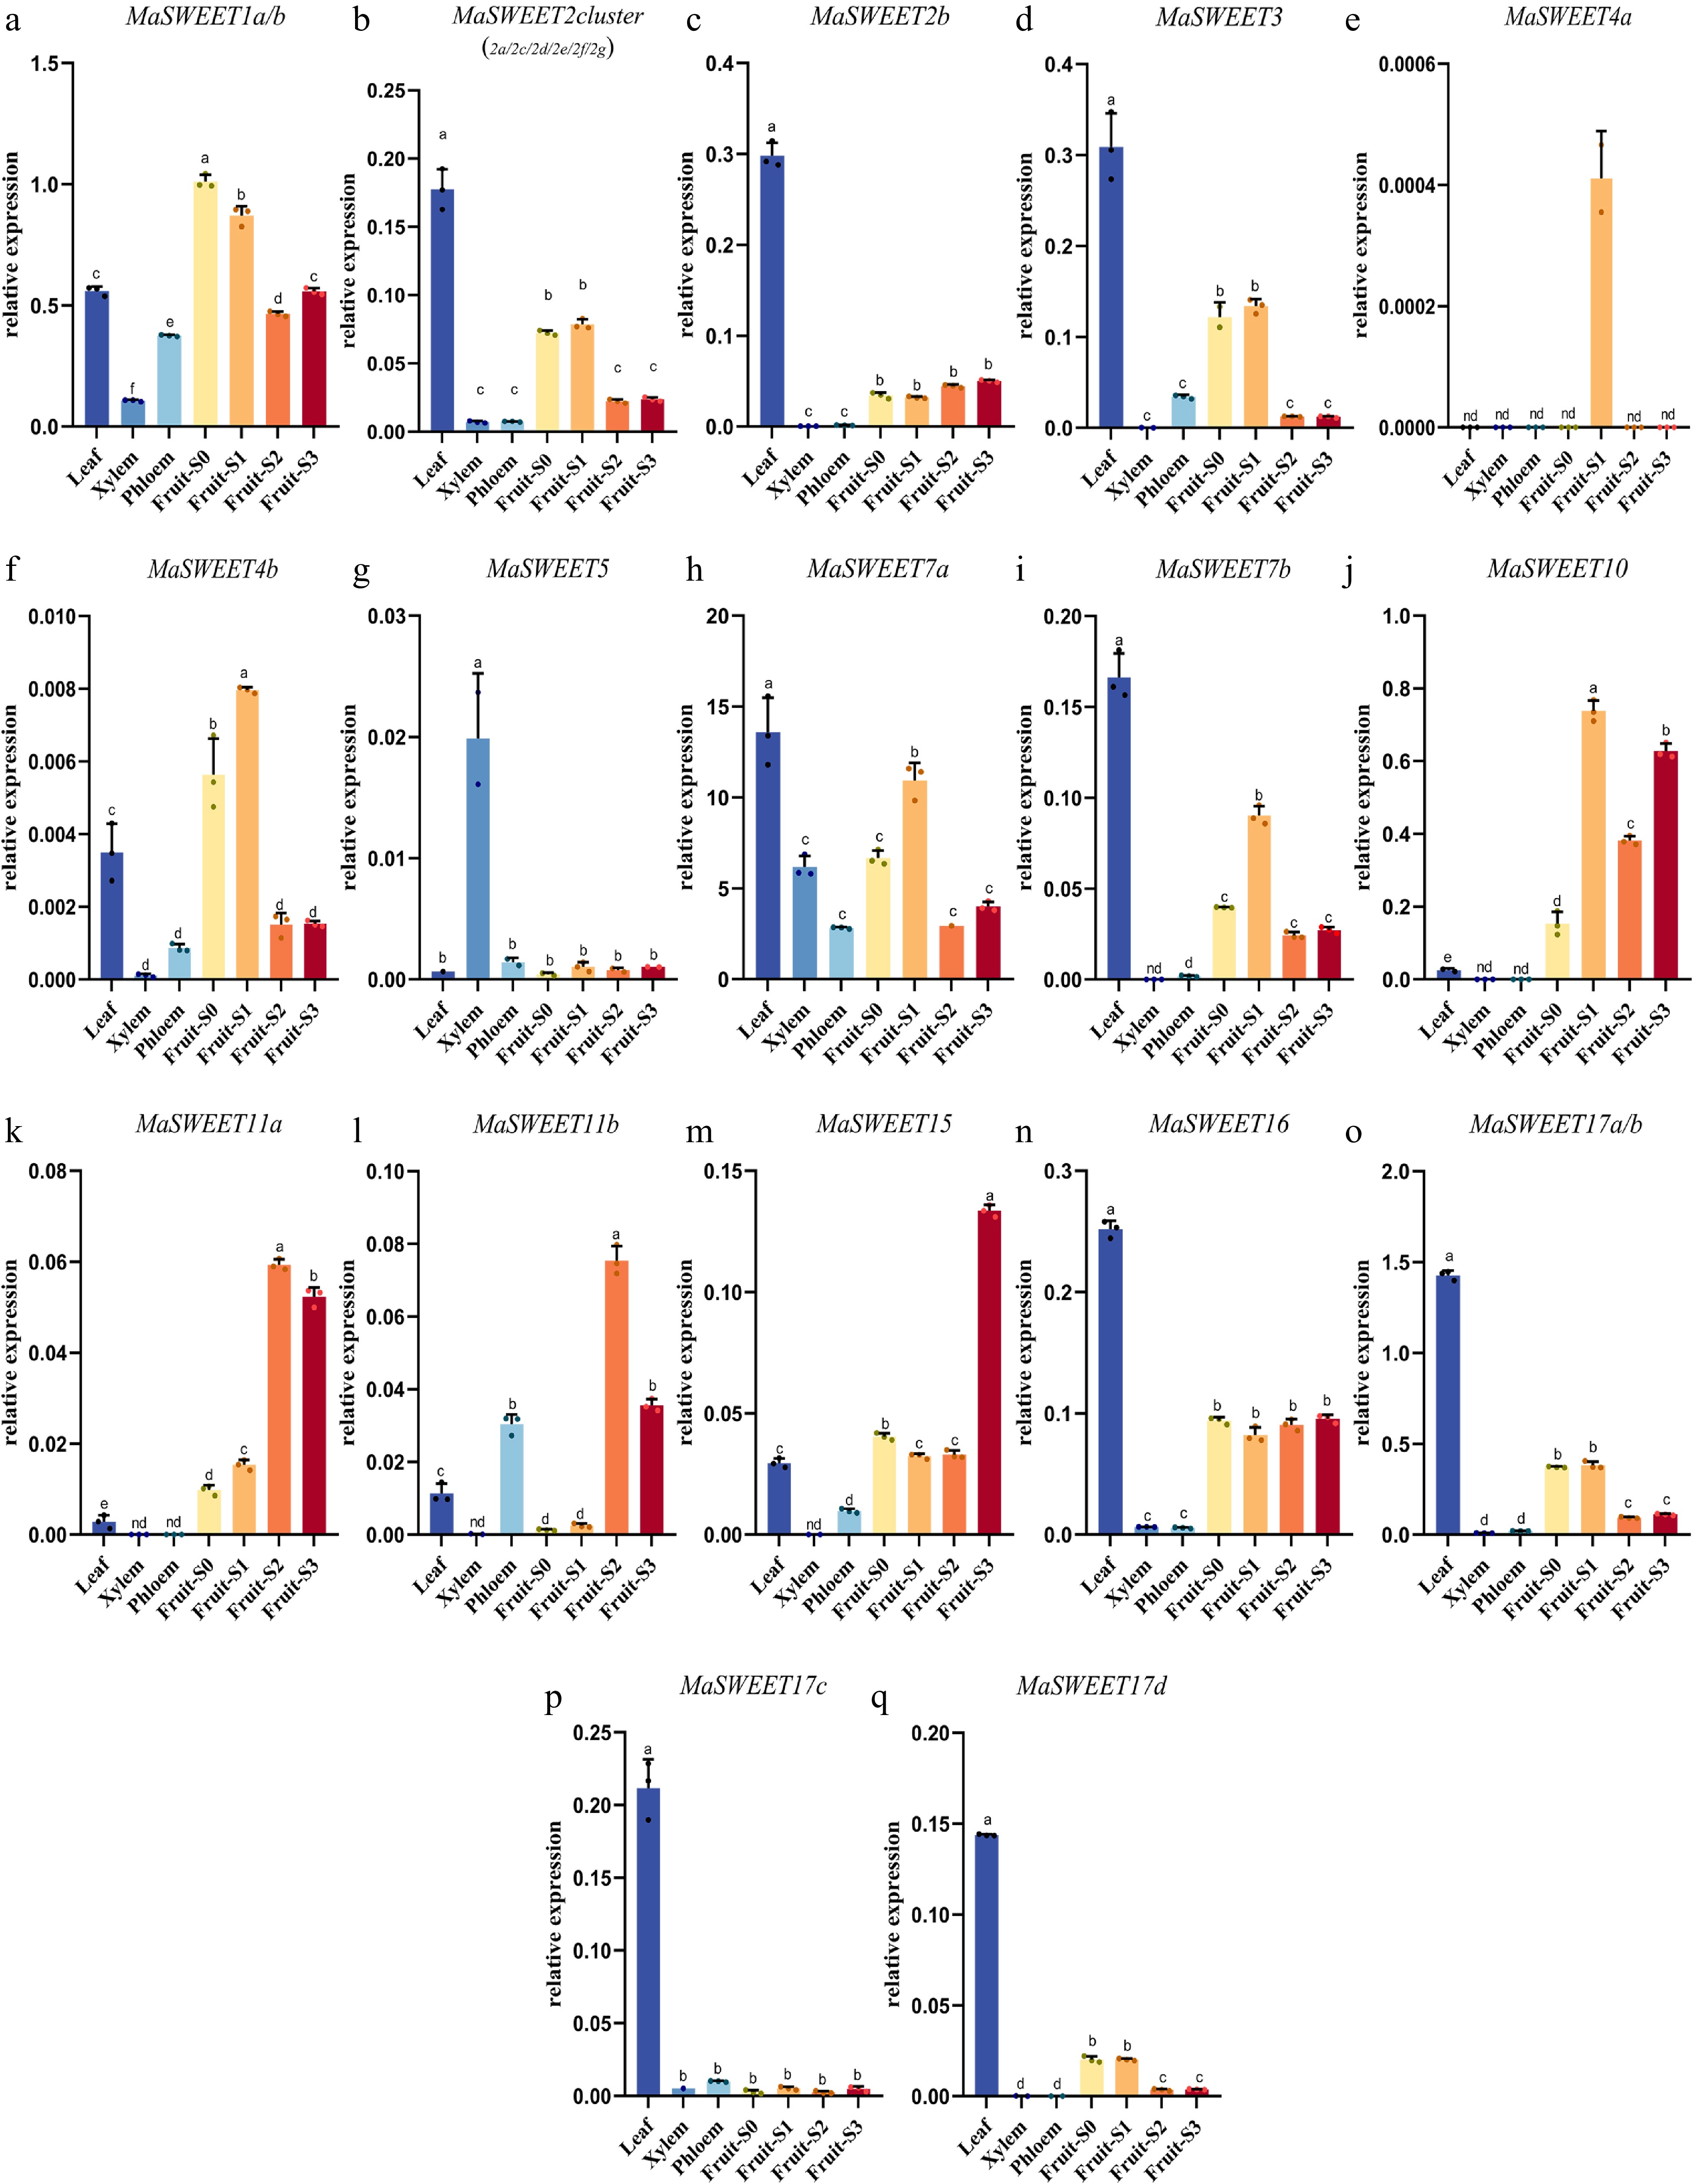
Figure 5.
Transcript levels of MaSWEETs in leaves, xylem, phloem, and different development stages of fruit. Three technical replicates were analyzed. Error bars represent SE. Different letters indicate statistically significant differences (Duncan's test, p < 0.05).
-
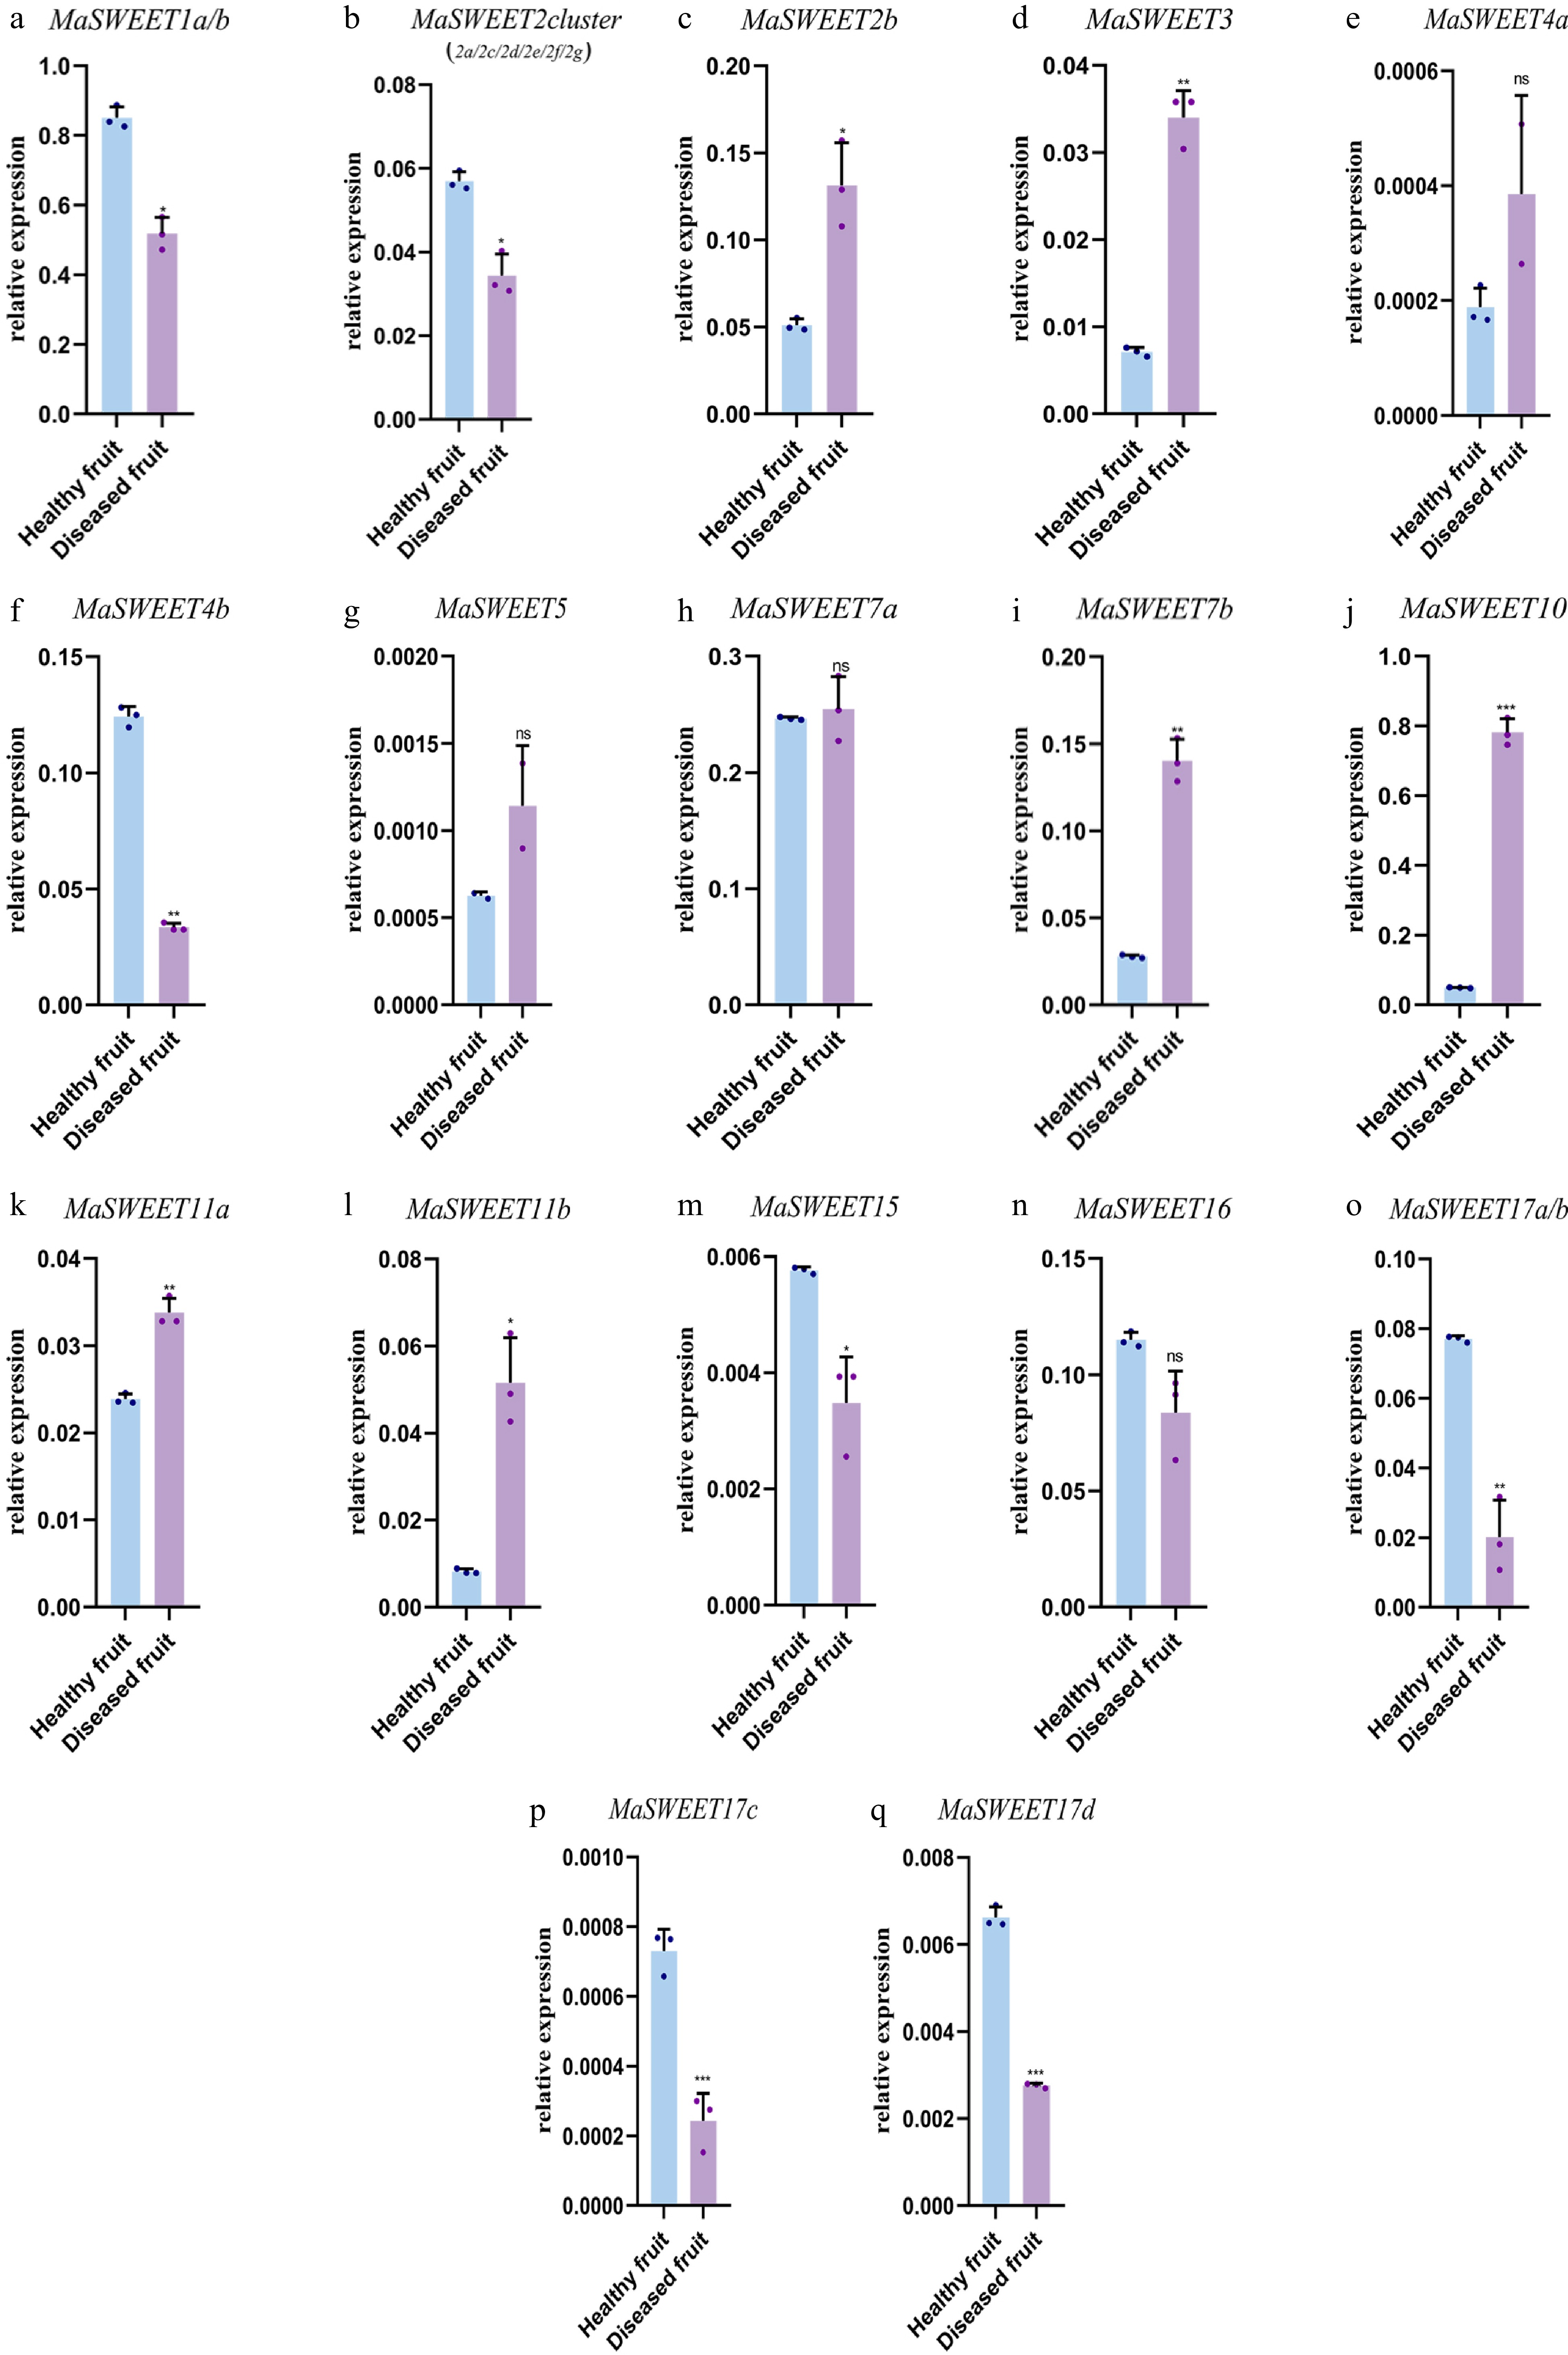
Figure 6.
Expression levels of 24 selected MaSWEET genes in response to fungi stress conditions. Three technical replicates were analyzed. Error bars represent SE. Asterisks indicate significant difference as determined by Student’s t-test (* p < 0.05; ** p < 0.01; *** p < 0.001; **** p < 0.0001).
-
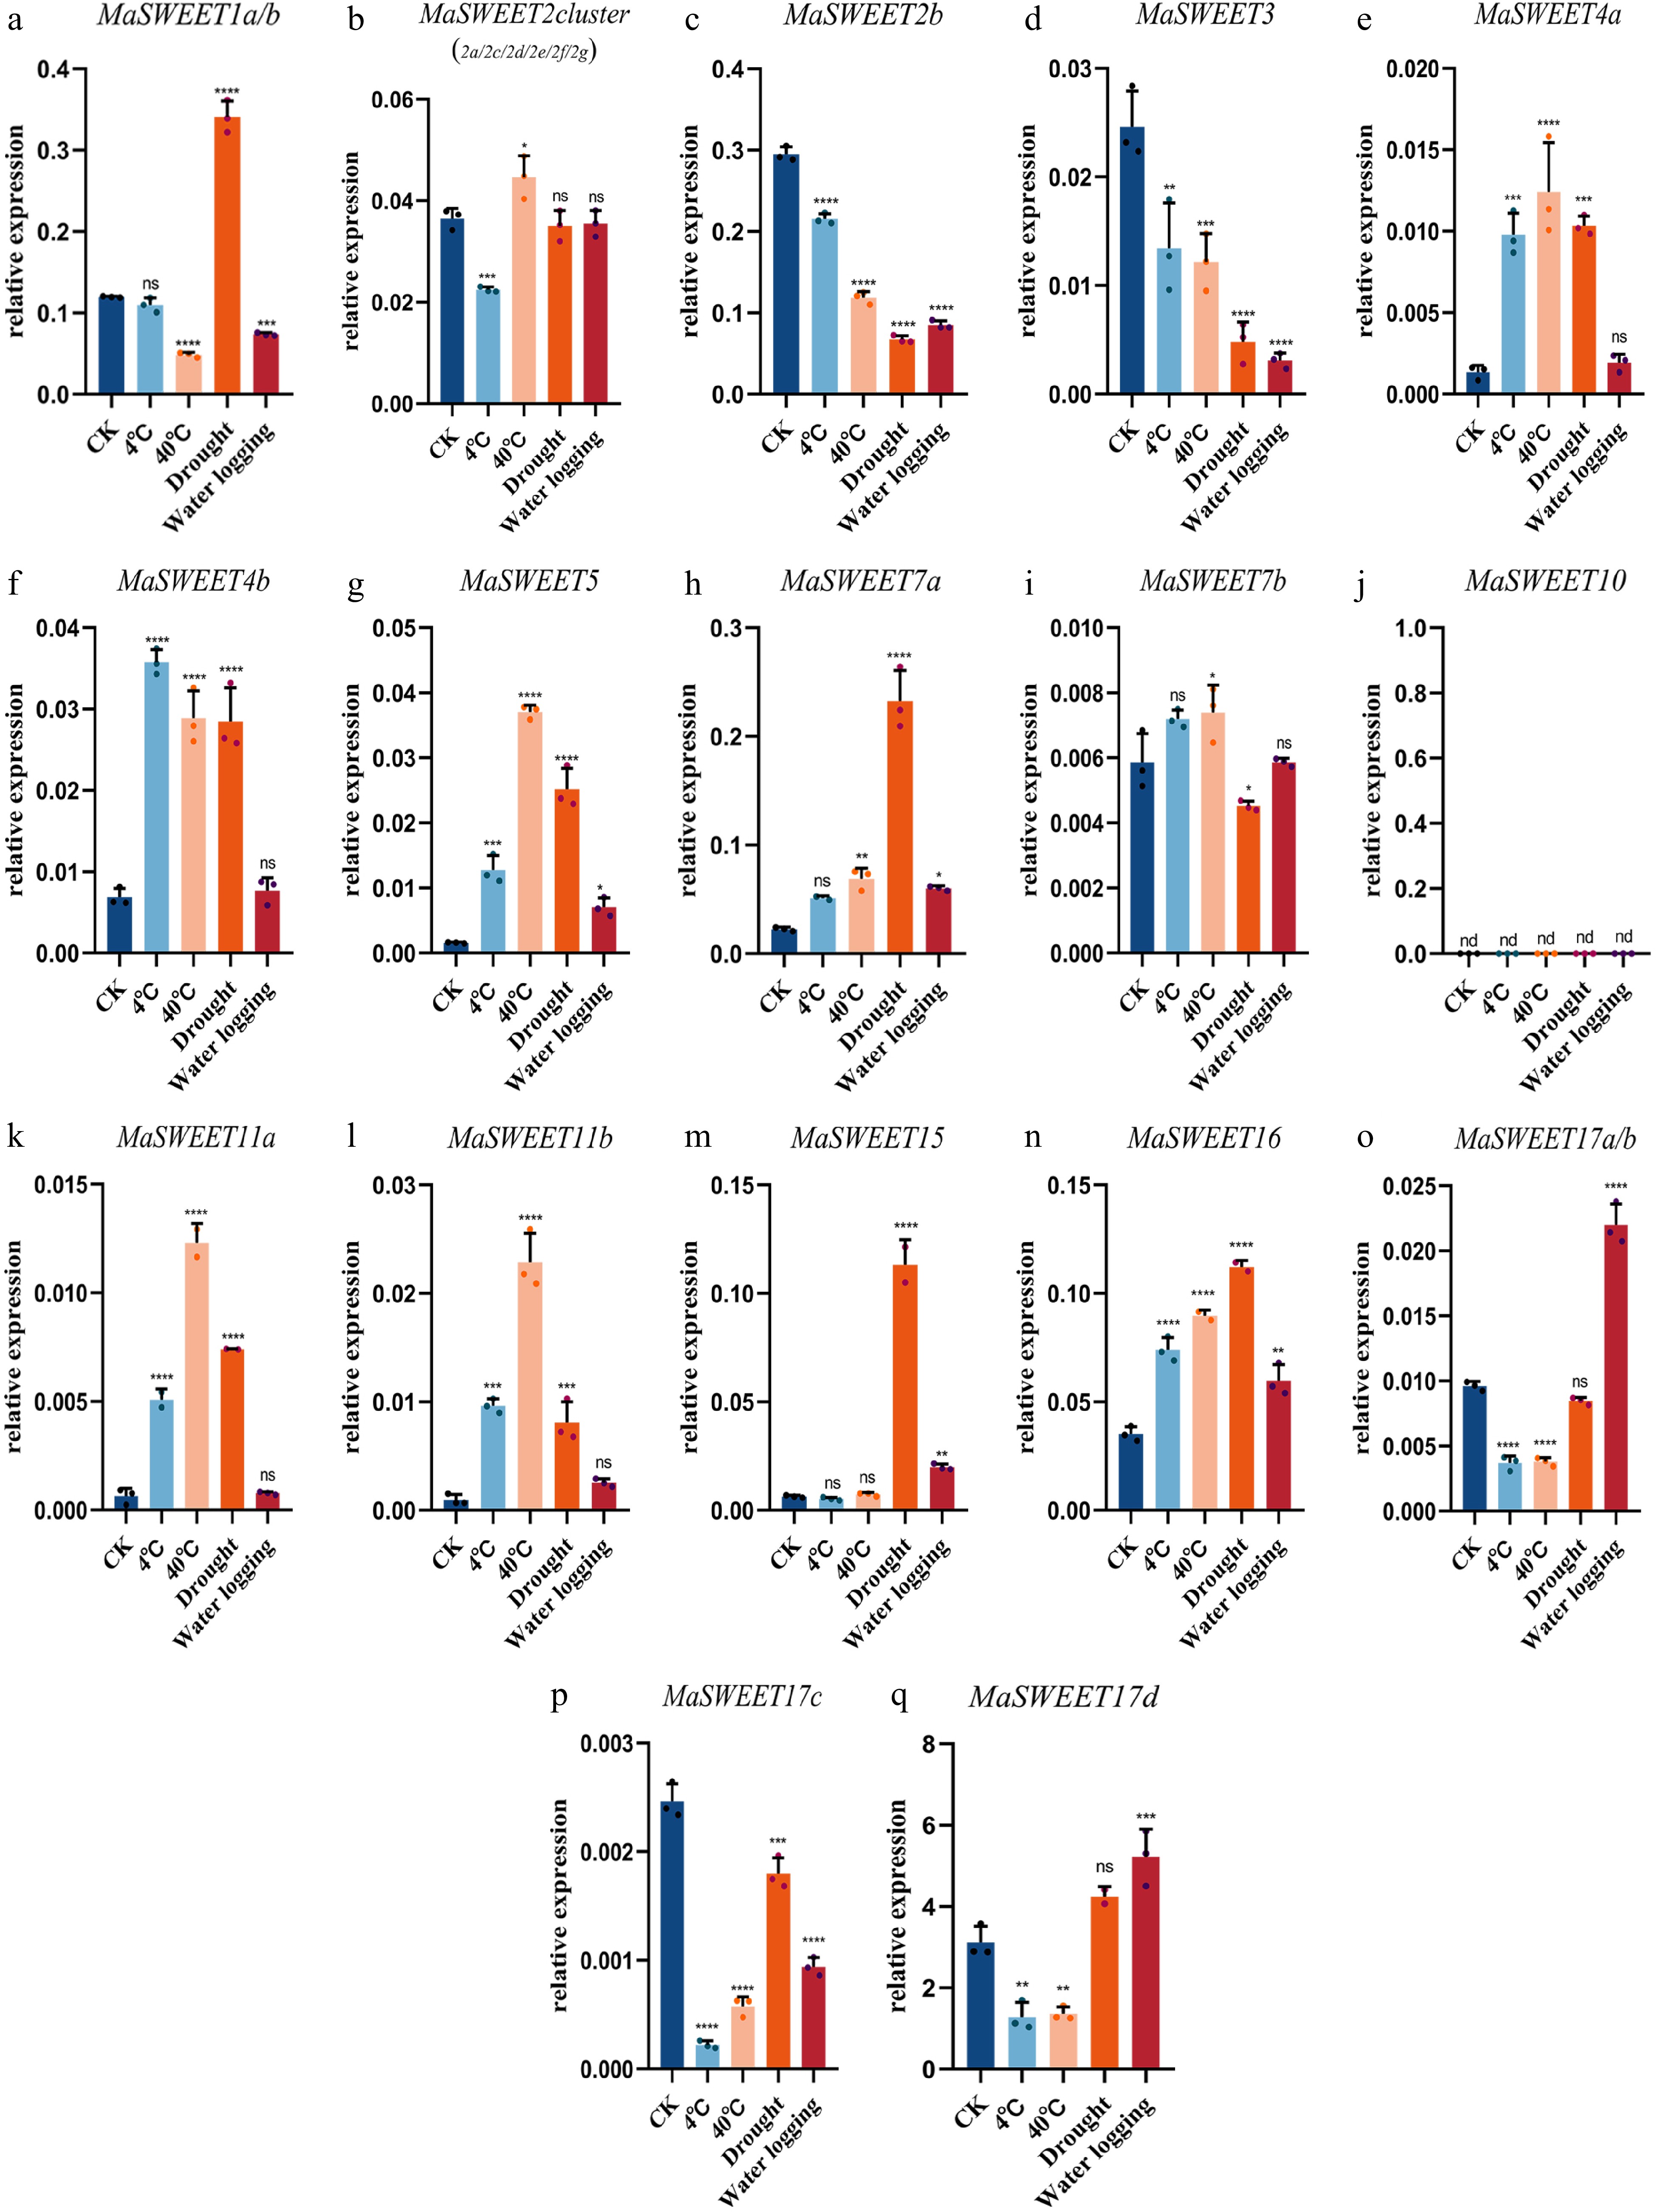
Figure 7.
Expression levels of 24 selected MaSWEET genes in response to 4 °C, 40 °C , drought, and flood stress conditions. Three technical replicates were analyzed. Error bars represent SE. Asterisks indicate significant difference as determined by Student’s t-test (* p < 0.05 ; ** p < 0.01 ; *** p < 0.001 ; **** p < 0.0001 ).
-
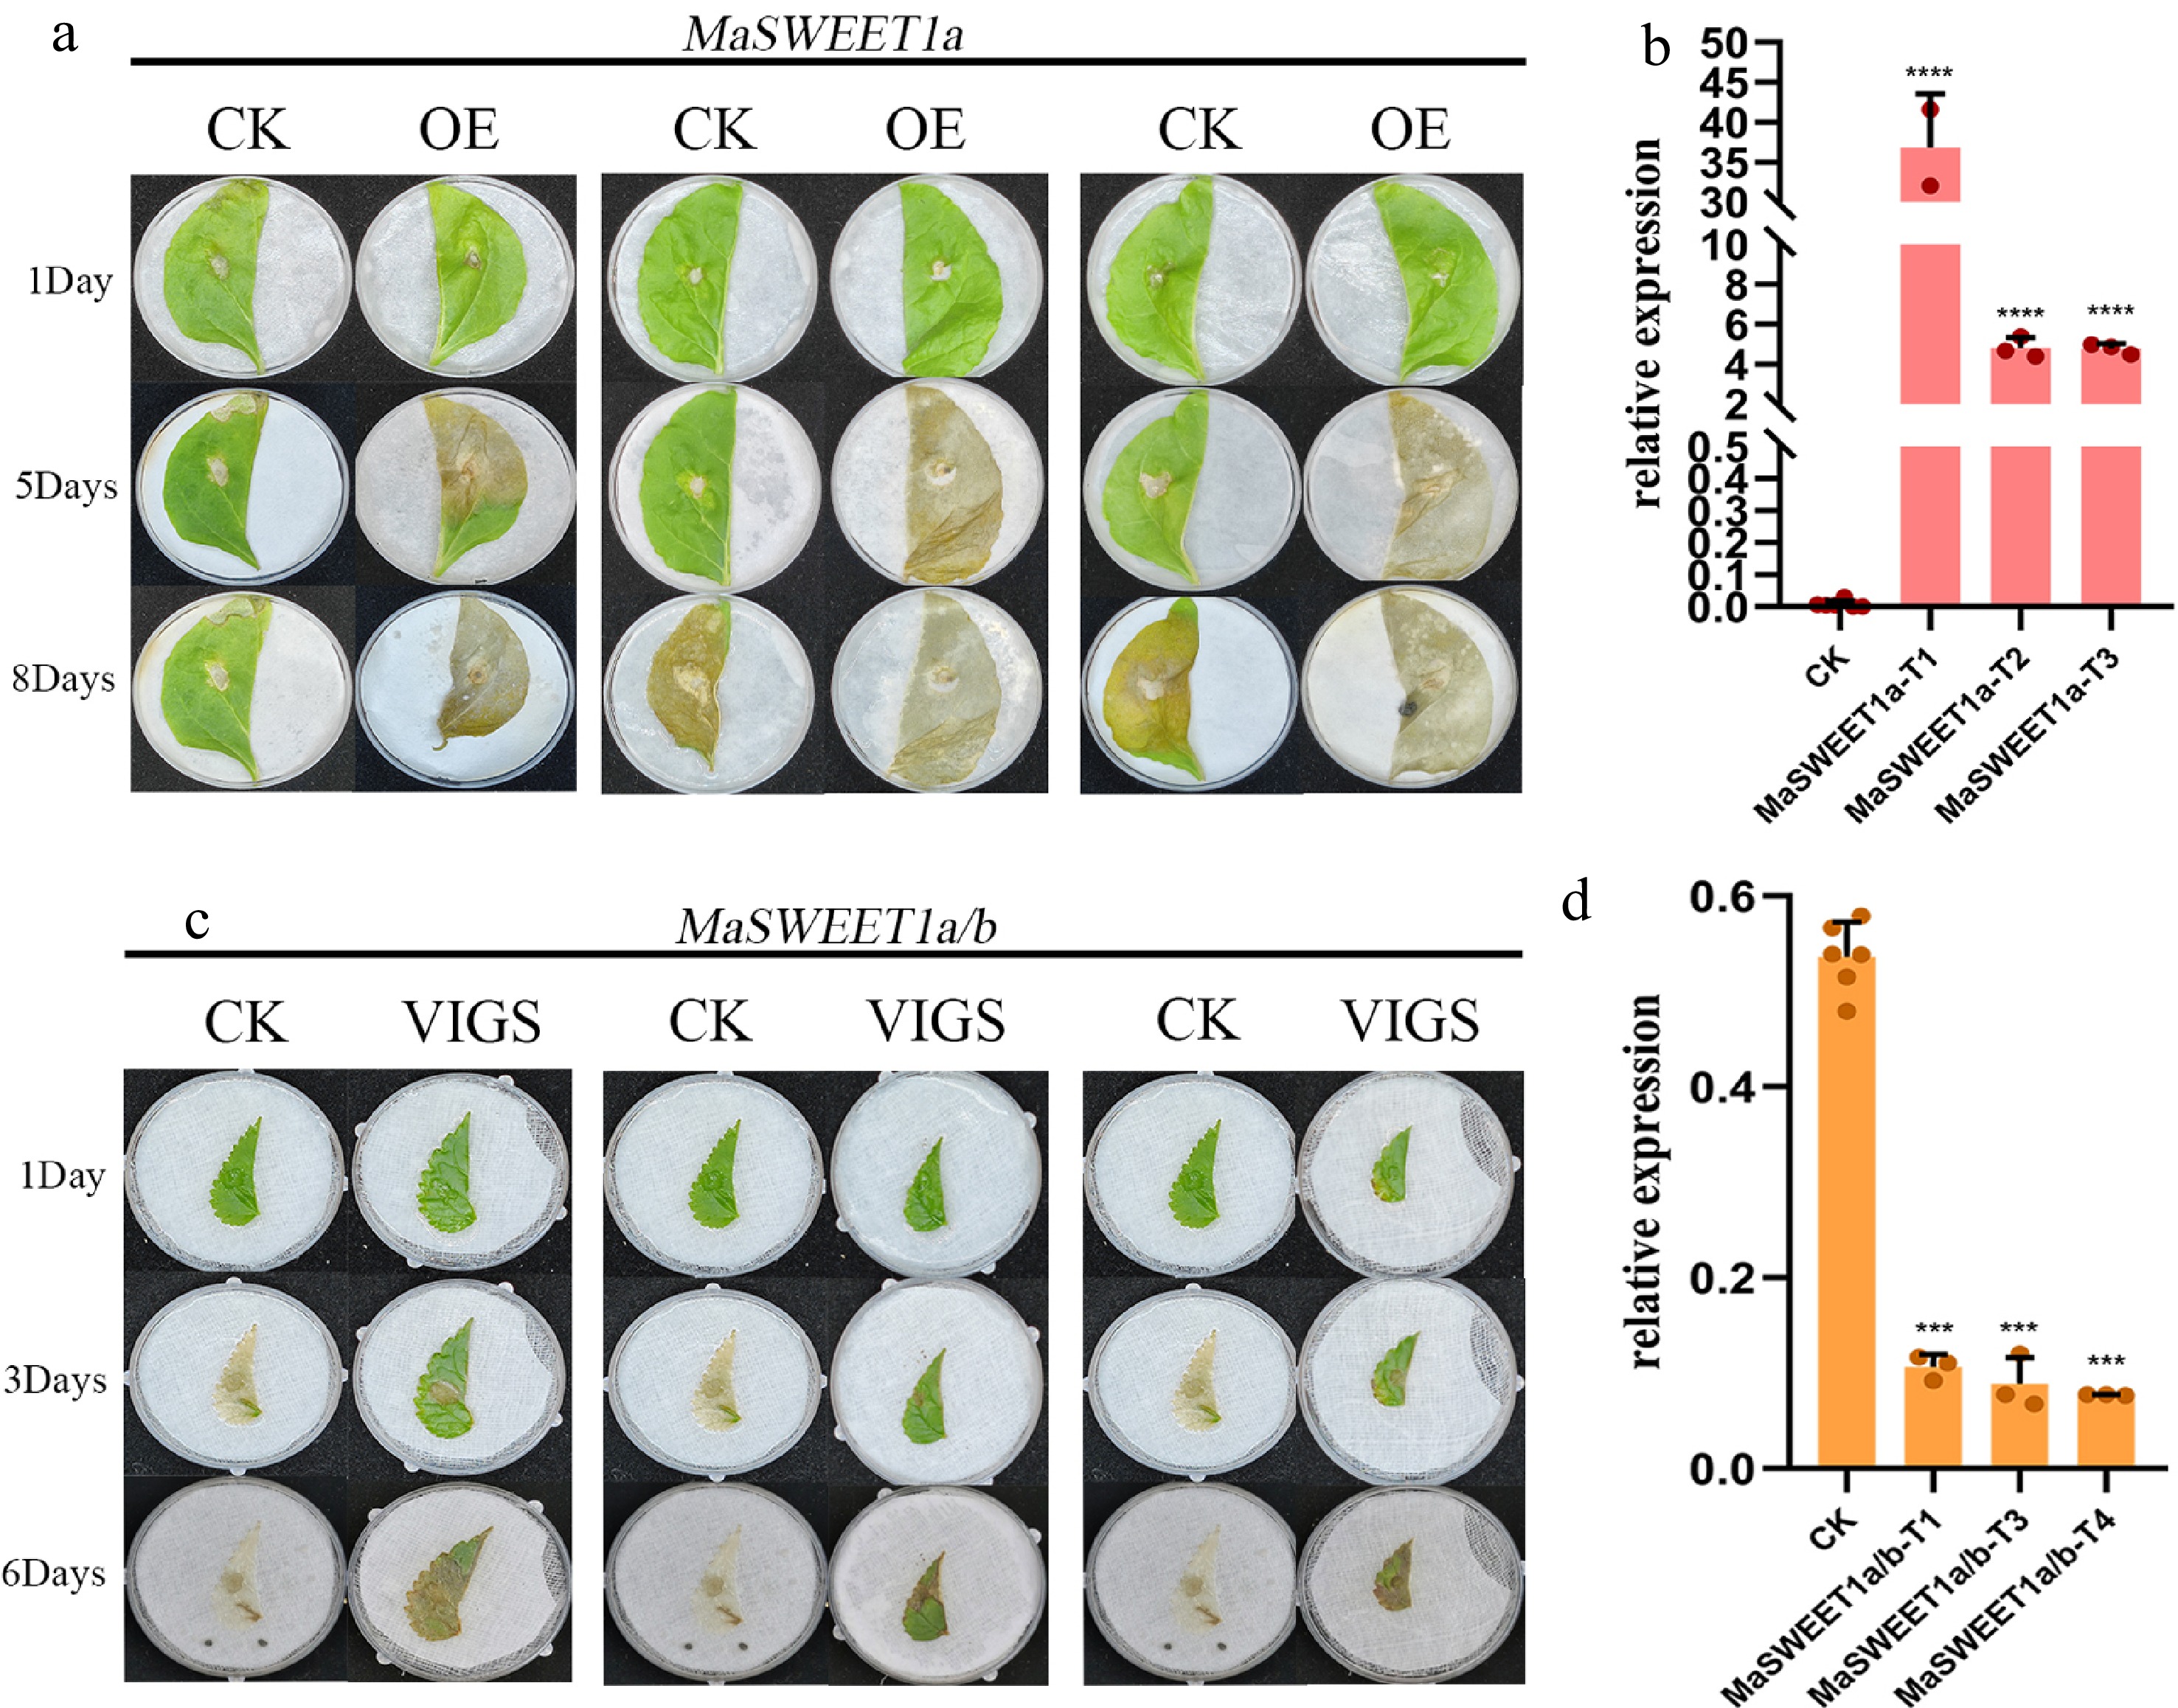
Figure 8.
Functional characterization of MaSWEET1a/b in tobacco and mulberry. (a) Damage of tobacco overexpressing MaSWEET1a after infection by C. shiraiana. (b) Expression levels of MaSWEET1a in tobacco. MaSWEET1a-T1, T2, T3 are three independent treatments with transient overexpressed MaSWEET1a. (c) Damage of mulberry with knock-down MaSWEET1a/b after infection by C. shiraiana. (d) The expression level of MaSWEET1a/b in mulberry. MaSWEET1a/b-T1, T3, T4 are three independent treatments with down-regulation of MaSWEET1a/b using VIGS.
-
Clade Gene name Accession no. Gene ID CDS Size
(bp)Protein physicochemical characteristics TMHs Subcellular MtN3/Saliva (PQ-Loop Repeat) Length (aa) MW (kDa) pI Aliphatic index Localization* Domain Position I MaSWEET1a XM_024170697.1-0 M.alba_G0012049 729 242 26.55 9.61 113.51 7 CTM 6-94, 131-209 I MaSWEET1b XM_024170698.1-0 M.alba_G0012049 678 225 21.45 9.51 115.74 6 CTM 1-49, 86-164 I MaSWEET2a XM_024163709.1-0 M.alba_G0019244 708 235 25.94 8.39 129.79 7 CTM 18-104, 137-221 I MaSWEET2b XM_024164777.1-0 M.alba_G0010863 705 234 25.92 8.98 122.86 7 TM 17-101, 137-218 I MaSWEET2c XM_024163707.1-0 M.alba_G0019244 774 257 28.58 8.58 132.33 7 PM 54-126, 159-243 I MaSWEET2d XM_024163712.1-0 M.alba_G0019244 681 226 25.27 8.22 128.89 6 EX 23-95, 128-212 I MaSWEET2e XM_024163708.1-0 M.alba_G0019244 729 242 26.72 8.49 128.06 7 CTM 39-111, 144-228 I MaSWEET2f XM_024163703.1-0 M.alba_G0019244 777 258 28.8 8.49 132.56 8 PM 41-127, 160-244 I MaSWEET2g XM_024163711.1-0 M.alba_G0019244 684 227 25.49 7.62 129.16 7 PM 10-96, 129-213 I MaSWEET3 XM_010099554.2-0 M.alba_G0003063 783 260 29.01 8.89 115.73 7 PM 9-98, 132-216 II MaSWEET4a XM_010091939.1-0 M.alba_G0009276 735 244 27.45 9.28 109.39 7 CTM 10-98, 134-218 II MaSWEET4b XM_010113461.2-0 M.alba_G0001536 738 245 27.4 8.98 122.08 7 EX 11-97, 134-216 II MaSWEET5 XM_024168739.1-0 M.alba_G0018295 711 236 26.64 7.63 120.93 7 CY 10-93, 131-127 II MaSWEET7a XM_010108966.2-0 M.alba_G0005110 774 257 28.32 9.57 128.56 7 CTM 11-95, 134-218 II MaSWEET7b XM_010108964.1-0 M.alba_G0005109 789 262 28.99 9 124.96 7 CTM 10-97, 134-218 III MaSWEET10 XM_010095631.2-0 M.alba_G0018016 888 295 33.12 8.86 120.31 7 CTM 11-96, 132-216 III MaSWEET11a XM_010114440.2-0 M.alba_G0016901 804 267 29.63 9.47 124.08 7 CTM 11-99, 135-220 III MaSWEET11b XM_010095633.2-0 M.alba_G0018015 915 304 34.12 7.57 112.89 7 CTM 12-99, 134-219 III MaSWEET15 XM_010092381.2-0 M.alba_G0006767 885 294 33.42 7.16 109.01 7 CTM 12-99, 133-219 IV MaSWEET16 XM_024167733.1-0 M.alba_G0014617 909 302 33.2 9.08 114.27 7 CTM 20-92, 129-212 IV MaSWEET17a XM_024171451.1-0 M.alba_G0014614 708 235 26.46 8.71 119.87 5 CY 5-78, 116-198 IV MaSWEET17b XM_024167902.1-0 M.alba_G0014613 753 250 28.05 8.71 120.88 6 PM 8-93, 131-213 IV MaSWEET17c XM_024171286.1-0 M.alba_G0008195 720 239 26.72 8.94 111.72 7 CY 6-92, 129-212 IV MaSWEET17d XM_024171287.1-1 M.alba_G0008196 723 240 27 9.43 122.67 7 CTM 6-92, 127-213 * The subcellular localizations were predicted by WoLFPSORT. PM, plasma membrane; EX, extracellular; CY, cytoplasmic; TM, tonoplast membrane; CTM, chloroplast thylakoid membrane. Table 1.
SWEET gene family in Morus alba.
Figures
(8)
Tables
(1)