-
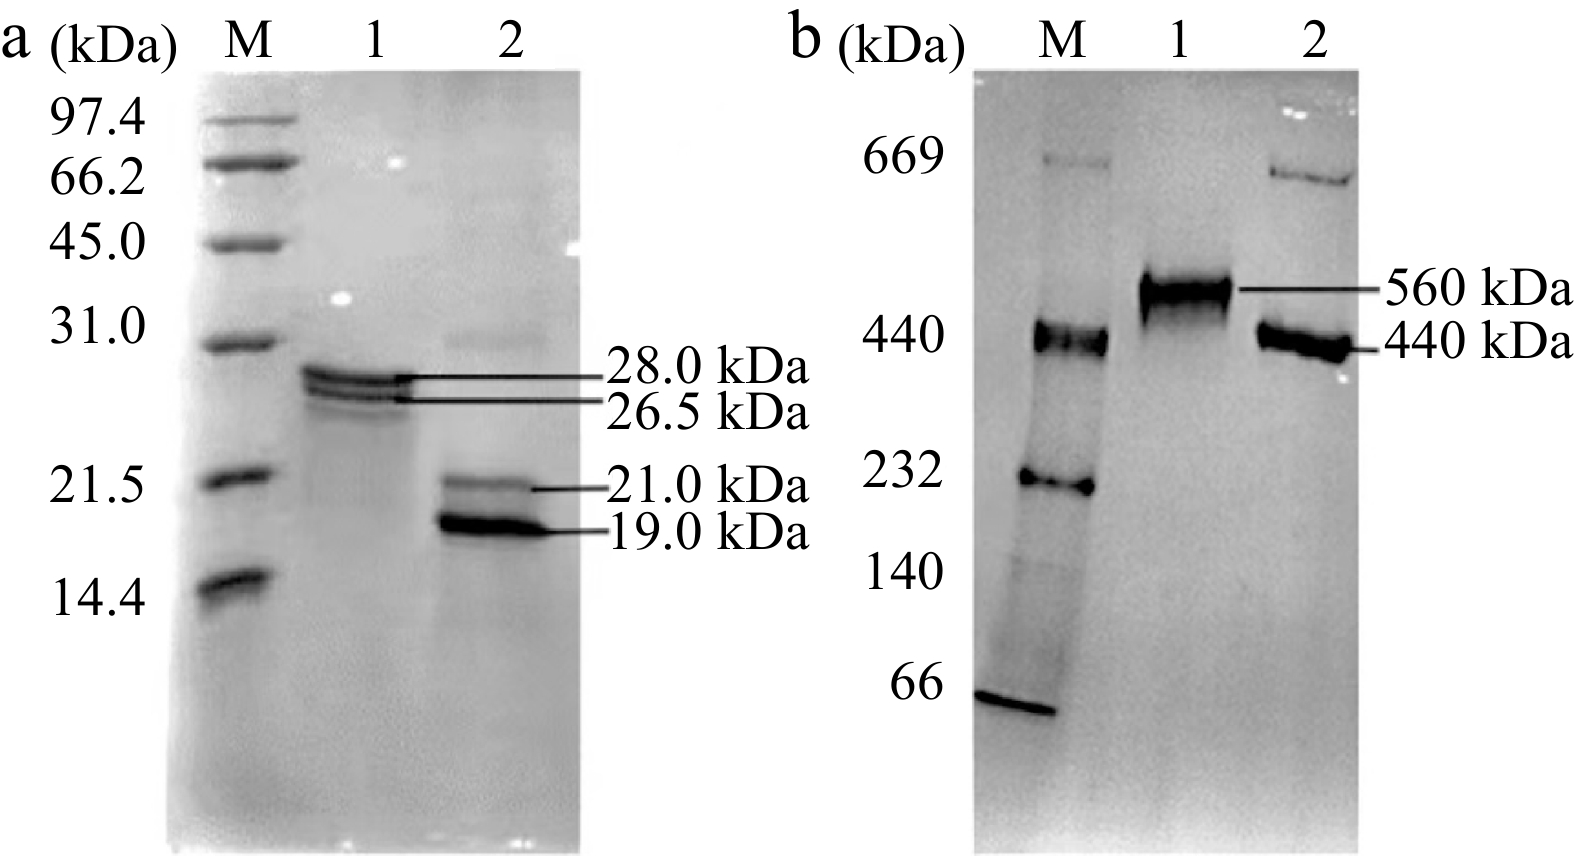
Figure 1.
Electrophoresis analyses of 1.0 μM of SSF and DSF. (a) SDS-PAGE analysis. (b) Native-PAGE analysis. Lane 1: SSF; Lane 2: DSF; Lane M: Protein markers.
-

Figure 2.
Electrophoresis analyses of 1.0 μM of SSF and DSF after different thermal treatments. (a) SDS-PAGE analysis of SSF. (b) SDS-PAGE analysis of DSF. (c) Native-PAGE analysis of SSF. (d) Native-PAGE analysis of DSF. Lane M: Protein markers.
-
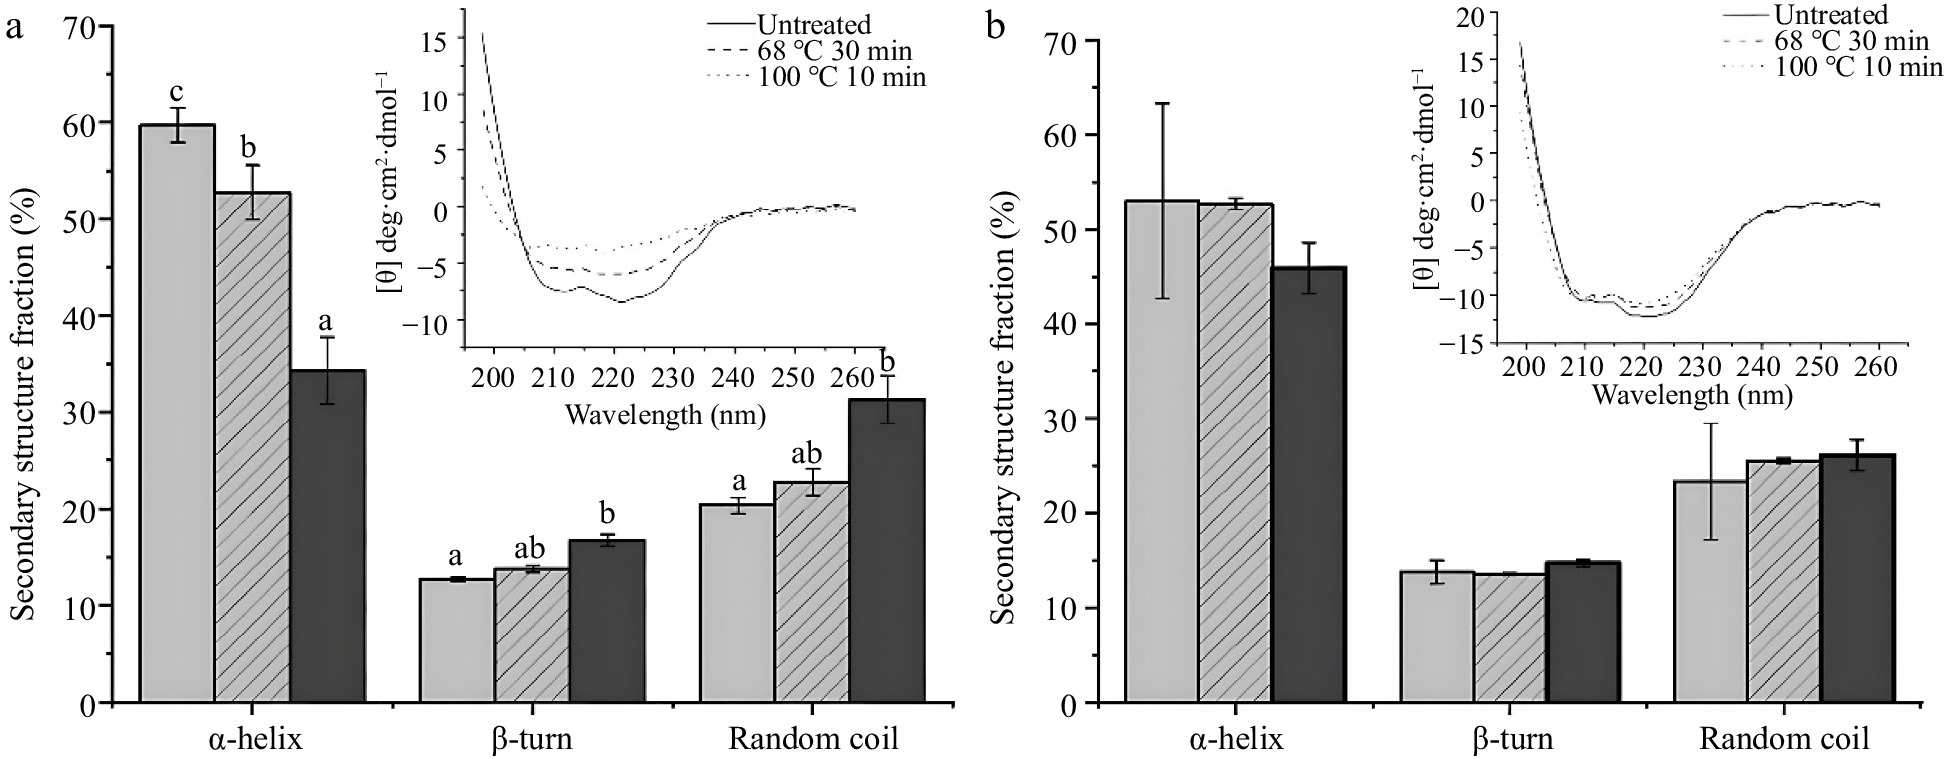
Figure 3.
CD spectra results of ferritins under conditions of untreated, 68 °C for 30 min and 100 °C for 10 min. (a) CD spectra and percentages of the secondary structure of 0.1 mg/mL SSF. (b) CD spectra and percentages of the secondary structure of 0.2 mg·mL−1 DSF. Values are means ± SD, and different letters in the column indicate significant difference (P < 0.05) between treatments.
-
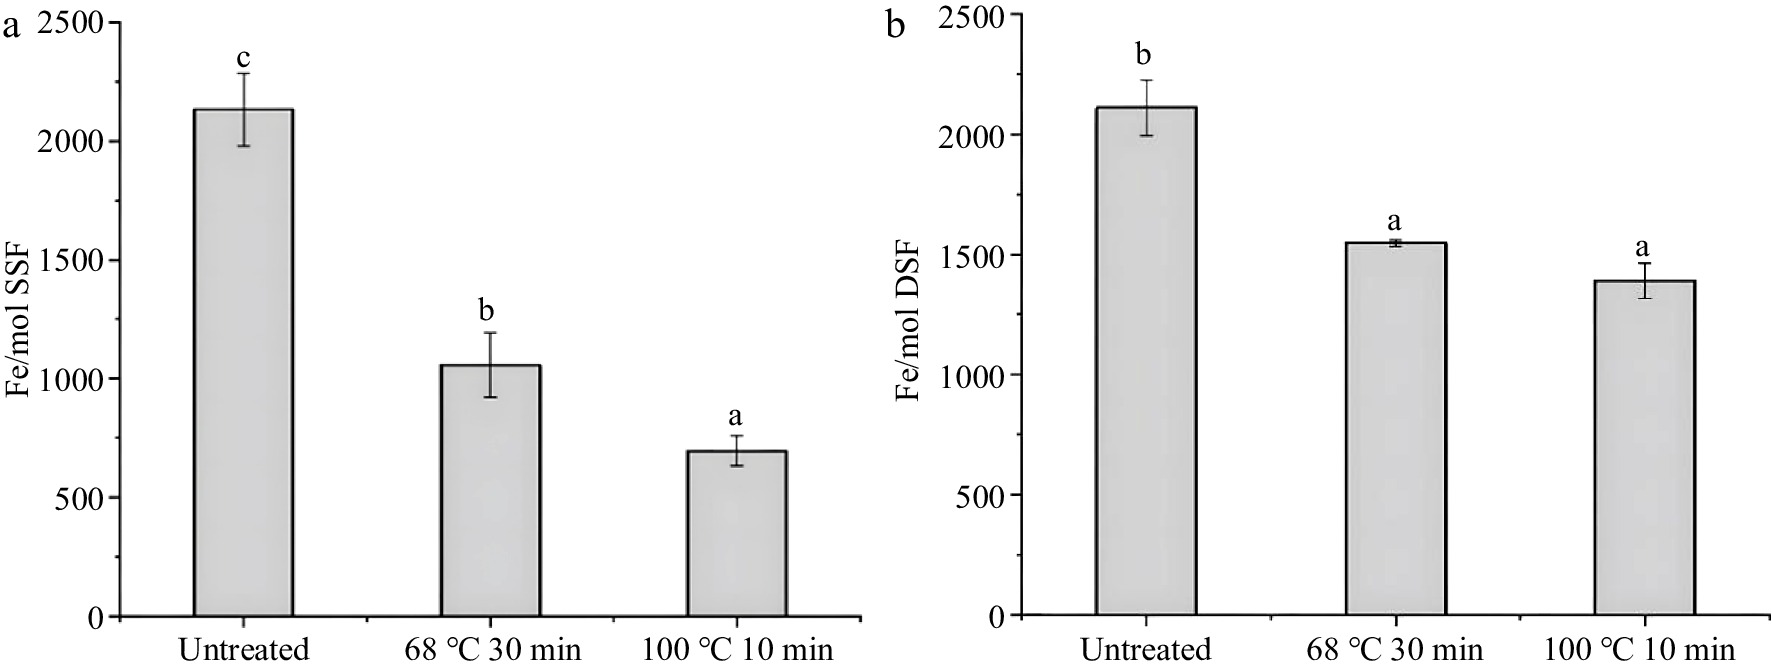
Figure 4.
Iron content of ferritins after thermal treatment measured by ICP-MS, with untreated as a control. (a) and (b) are the iron content of SSF (1.0 μM) and DSF (1.0 μM) under conditions of untreated, 68 °C for 30 min and 100 °C for 10 min, respectively. Values are means ± SD, and different letters in the column indicate significant differences (P < 0.05) between treatments.
-
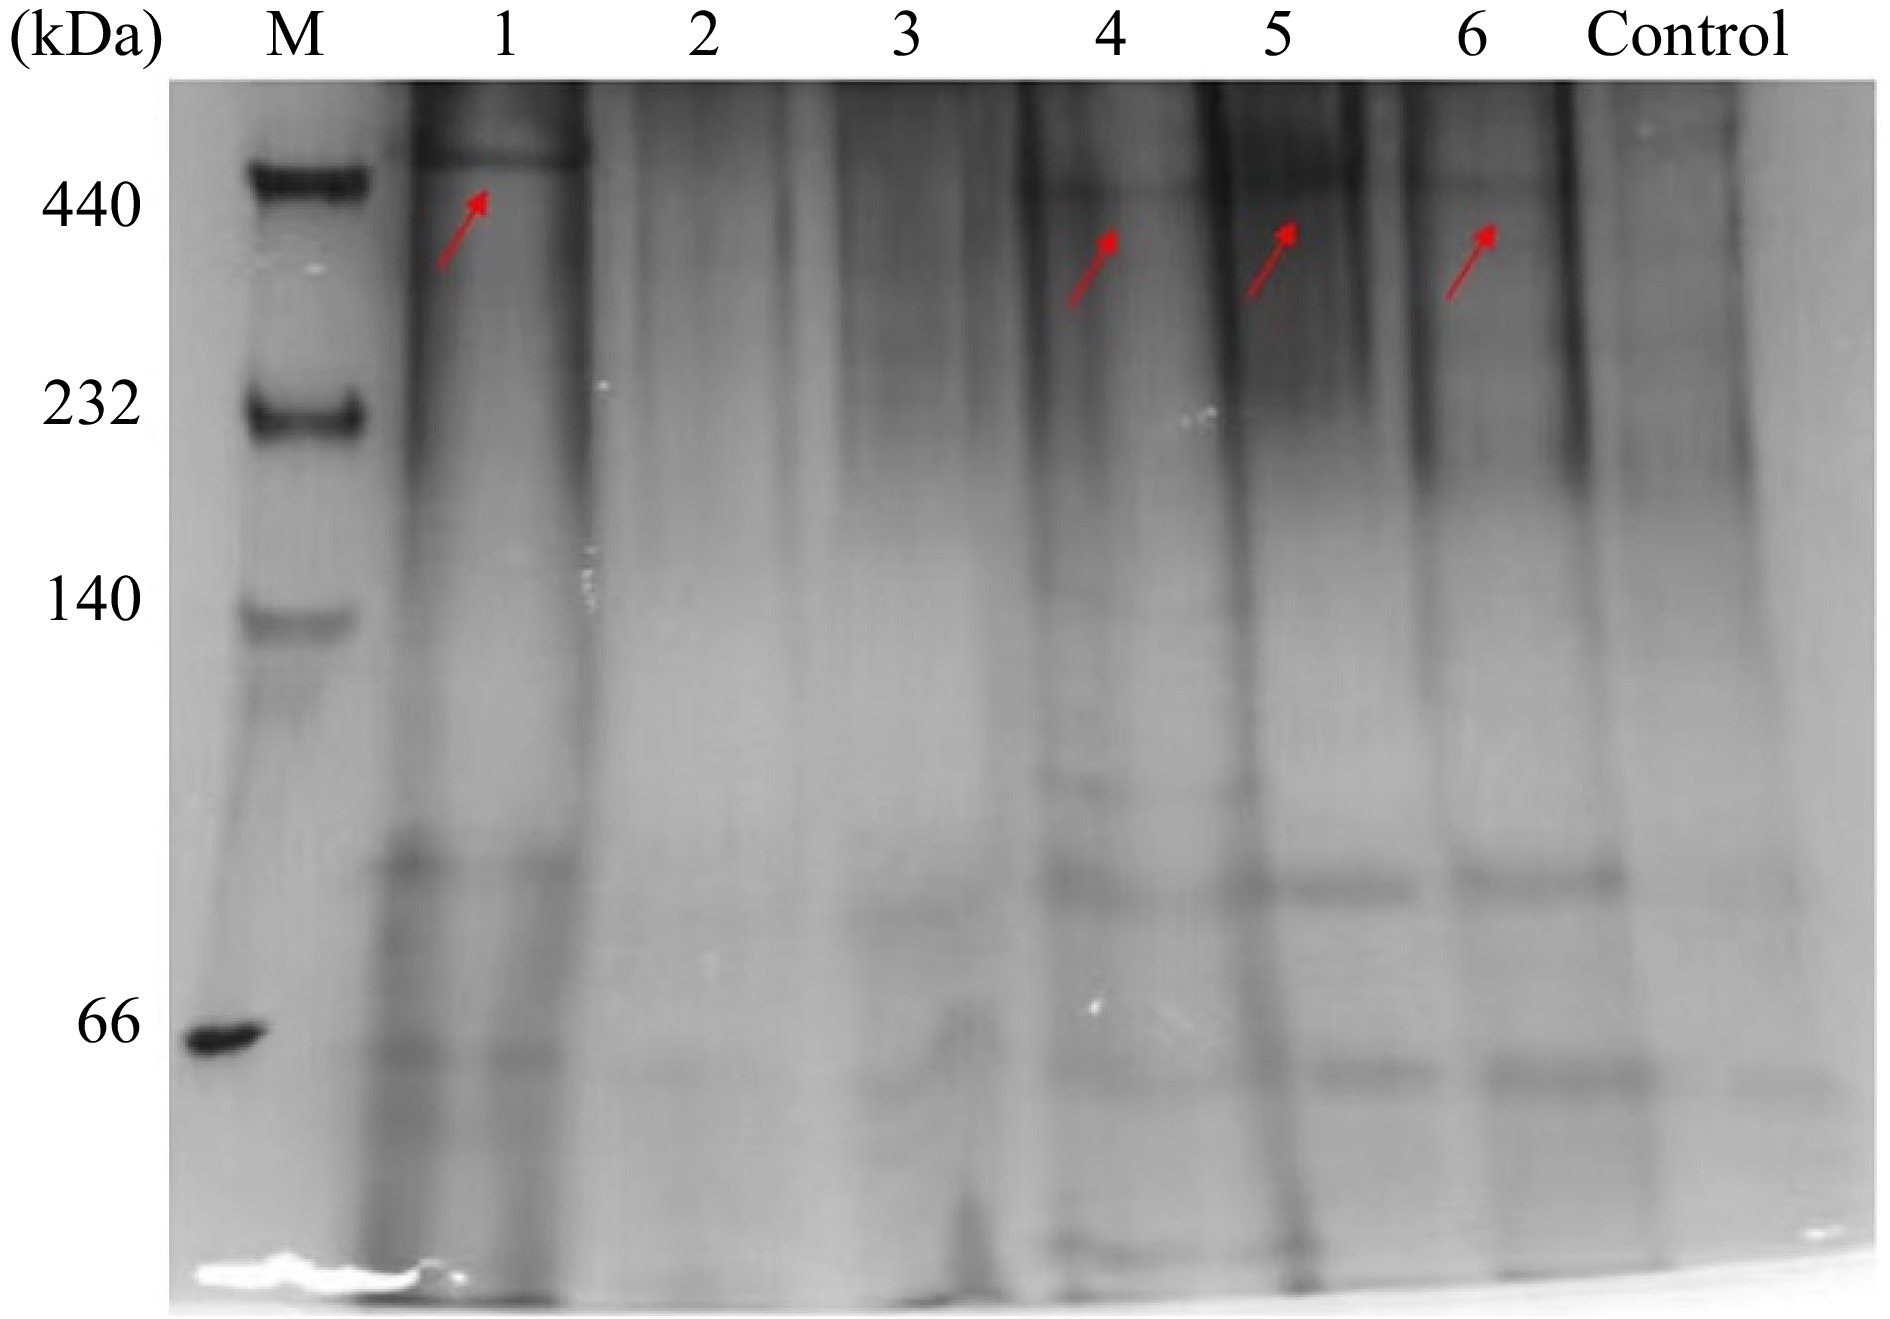
Figure 5.
In vivo digestion results of SSF and DSF after different treatments. Lanes 1−3: Untreated, 68 °C for 30 min, 100 °C for 10 min of SSF; Lanes 4−6: Untreated, 68 °C for 30 min, 100 °C for 10 min of DSF. Control group: mice administered with 300 μL of 10 mM phosphate buffer. The electrophoresis was performed three times, with similar results obtained.
-

Figure 6.
Serum iron content of mice in SSF groups and DSF groups. The letters indicate inner group comparisons of SSF groups (P < 0.05). There is no statistical difference of DSF groups (P > 0.05). Control group: mice administered with 300 μL of 10 mM phosphate buffer. Values are means ± SD, and different letters in the column indicate significant differences (P < 0.05) between treatments.
Figures
(6)
Tables
(0)